Micro Interventions for Poverty Alleviation: The ... · MICRO INTERVENTIONS FOR POVERTY...
55
For comments, suggestions or further inquiries please contact: Philippine Institute for Development Studies The PIDS Discussion Paper Series constitutes studies that are preliminary and subject to further revisions. They are be- ing circulated in a limited number of cop- ies only for purposes of soliciting com- ments and suggestions for further refine- ments. The studies under the Series are unedited and unreviewed. The views and opinions expressed are those of the author(s) and do not neces- sarily reflect those of the Institute. Not for quotation without permission from the author(s) and the Institute. December 1996 DISCUSSION PAPER SERIES NO. 96-13 Aniceto C. Orbeta Jr. and Ma. Teresa C. Sanchez Micro Interventions for Poverty Alleviation: The Philippine Case The Research Information Staff, Philippine Institute for Development Studies 3rd Floor, NEDA sa Makati Building, 106 Amorsolo Street, Legaspi Village, Makati City, Philippines Tel Nos: 8924059 and 8935705; Fax No: 8939589; E-mail: [email protected] Or visit our website at http://www.pids.gov.ph
Transcript of Micro Interventions for Poverty Alleviation: The ... · MICRO INTERVENTIONS FOR POVERTY...

For comments, suggestions or further inquiries please contact:
Philippine Institute for Development Studies
The PIDS Discussion Paper Seriesconstitutes studies that are preliminary andsubject to further revisions. They are be-ing circulated in a limited number of cop-ies only for purposes of soliciting com-ments and suggestions for further refine-ments. The studies under the Series areunedited and unreviewed.
The views and opinions expressedare those of the author(s) and do not neces-sarily reflect those of the Institute.
Not for quotation without permissionfrom the author(s) and the Institute.
December 1996
DISCUSSION PAPER SERIES NO. 96-13
Aniceto C. Orbeta Jr. and Ma. Teresa C. Sanchez
Micro Interventions for PovertyAlleviation: The Philippine Case
The Research Information Staff, Philippine Institute for Development Studies3rd Floor, NEDA sa Makati Building, 106 Amorsolo Street, Legaspi Village, Makati City, PhilippinesTel Nos: 8924059 and 8935705; Fax No: 8939589; E-mail: [email protected]
Or visit our website at http://www.pids.gov.ph

MICRO INTERVENTIONS FOR POVERTY ALLEVIATION: The Philippine Case
Aniceto C. Orbeta, Jr., and Ma. Teresa Sanchez
Abstract
This paper provides a review of frameworks for analyzing poverty alleviation initiatives. The principles in these frameworks were used to guide the review of five micro-interventions programs / projects for poverty alleviation. Principles that can be useful in the design of future programs of this type are also presented. To provide a background to the review, the development performance of the country in the last 25 years is given together with a brief description of the poverty situation and other poverty alleviation initiatives. Keywords: Poverty Alleviation Programs, Philippines JEL: I32, I38

MICRO INTERVENTION FOR POVERTY ALLEVIATION:
The Philippine Case
1. Introduction 1
2. A Framework of Analysis for Poverty Alleviation Interventions 2
3. Development Performance in the Last 25 Years 3
4. Poverty Situation and Poverty Alleviation Initiatives 5
4.1 Poverty Situation 5
4.2 Causes of Poverty 6
4.3 Broad Poverty Alleviation Initiatives 8
5. Micro-Interventions 11
5.1 Community Employment and Development Program (CEDP) 12
5.2 DOLE’s Integrated Livelihood Program (DILP) 14
5.3 DSWD’s Self-Employment Assistance Program (SEA) 26
5.4 DTI’s Tulong Sa Tao - NGO Microcredit Program (NGO-MCP) 28
5.5 Community Mortgage Program 31
5.6 Lalakas Ang Katawang Sapat Sa Sustansya (LAKASS) Program 35
6. Summary and Conclusion 39
References
Tables
MICRO INTERVENTIONS FOR POVERTY ALLEVIATION:The Philippine Case
Aniceto C. Orbeta and Ma. Teresa Sanchez1
Philippine Institute for Development Studies
1. Introduction
Poverty alleviation schemes range from as broad as the national development strategyto the delivery of very specific basic services. Development is expected to create opportunitiesfor everybody including the poor. However, seldom does it provides equal opportunity foreverybody. Depending on the character of national development, ample or meageropportunities are created for the poor. Often times restructuring the economy for better long-run performance may also constrict further the opportunities for the poor in the short-run evenif it promises to expand these opportunities over the longer term. These unequal opportunitiescreated by a general development strategy provide the rationale for micro interventions toenhance the opportunities for the poor. Another often mentioned rationale for microinterventions is that the poor need assistance in order for them to catch up and benefit morefrom development. It is argued that unless some form of capacity build up are undertaken, thepoor cannot as yet participate and much less benefit from development.
This paper discusses a select group of micro-interventions for poverty alleviation.These interventions are those that directly create wage employment, those that indirectlycreate employment through livelihood projects or self-employment schemes and those thatdirectly deliver social services. The common purpose of the first two types of interventions isto address the slow growth in employment creation accompanying the development process inthe last 30 years. The social services delivery interventions, on the other hand, tackles specialimmediate needs of the poor. Due to time limitations, the paper uses secondary information onproject performance. These include independent evaluation studies where these are availableand project monitoring reports done by implementing agencies. Even evaluation reports doneby project implementing agencies are also utilized.
The paper is organized as follows. The framework for analyzing micro-interventionsfollows this section. To provide a backdrop to the analyses of the micro interventions, areview of the country’s development performance is given in section three. Section fourreviews the poverty situation and broad brush poverty alleviation initiatives. The fifth sectionprovides the details of a select group of micro-interventions for poverty alleviation. The finalsection provides a summary and analyses of the micro-intervention programs.
1 Research Fellow and Research Associate, Philippine Institute for Development Studies. Opinions expressed hereare those of the authors and not of the Institute. This paper was prepared with the financial support provided by theInternational Labor Office through the Regional Poverty Alleviation Program (RAS/95/001) . Research assistanceprovided by Marie Anne Cagas and Melalyn Cruzado are gratefully acknowledged.

2
2. A Framework of Analysis for Poverty Alleviation Interventions
In order to understand better poverty alleviation schemes, it is useful to identifyspecific handles for poverty alleviation. Three useful ways of looking at the poverty andpoverty alleviation interventions are presented in this section.
The Presidential Commission to Fight Poverty (PCFP) commissioned a team ofconsultants to develop a “Strategy to Fight Poverty” (PCFP, 1994). The report identifiedspecific handles for poverty alleviation. First, it defines entitlement as the sum of earnedincome and the value of government transfers or public social services guaranteed by existinglaws. Under this definition, poverty alleviation can be done either through increases in incomeor provision of social services or both. Second, it classifies the poor into the less poor and theultra poor. In the Philippine context, the ultra poor can be defined as those below the foodthreshold while the less poor are those whose income are below the income threshold butabove the food threshold. Finally, given the classification, appropriate handles are identifiedfor each type poverty. It is assumed that the less poor are able to participate in marketactivities while the ultra poor are less able participants, if at all. The strategy, therefore, for theless poor includes of both direct and indirect interventions. Indirect interventions consist ofreform in the macroeconomic and sectoral policies. These interventions can go a long way forthe less poor because they participate in economic activities. This is sometimes labeled as theeconomic aspects of poverty alleviation. The direct intervention for the less poor may take theform of livelihood and income generating projects accompanied by community organizingwhere necessary. The ultra poor, on the other hand, may not be able to benefit from well-functioning markets created by a conducive policy environment because they are less ableparticipants. Thus, for them only direct interventions will be effective. In addition, for thesetypes of clients livelihood programs may not be an effective intervention as survival isexpected to be the primary concern. The direct interventions may consist of delivery of basicservices (nutrition, health, education, etc.) and community organizing to build up capabilities.This is sometimes known as the social services aspect of poverty alleviation. It is then arguedthat as the client household goes down the income ladder, direct interventions in the form ofbasic services will be the primary form of poverty intervention. Conversely, as the poorhousehold goes up the income ladder, direct interventions will be more of the livelihood type.
Another useful taxonomy is given in Stewart (1983). The study classified the claims ofhouseholds into primary claims and secondary claims. The former consists of those arisingdirectly from productive work and accumulation. The latter consists mainly of transfers.Development benefits the economically active through the primary claims. It also benefits theeconomically inactive through transfers either from family members who are economicallyactive or from government via social services. It has been argued that the better and moresustainable way of addressing poverty is to increase the productive capacity of the poor andresort to secondary claims only when the former is not feasible (Demery and Addison 1987).
Still another useful delineation of the poor is to divide the economically active intothose experiencing transient poverty and those that are in persistent poverty (Tendulkar 1992).The former refers to those pursuing viable economic activities which are rendered not viableby temporary natural (such as weather variations) or economic causes (such as terms of tradechanges). Persistent poverty, on the other hand, refers to those who are pursuing unviable

3
activities due to insufficient assets, unviable scale of operations, or lack of employmentopportunities.
There are several principles that we can learn from these frameworks. First, theseframeworks require us to recognize that the poor is not homogenous. Consequently, it isimportant to classify the poor by type as well as identify appropriate interventions for eachtype. Second, it identified and differentiated the role of general development strategy andeconomic growth from the role of micro interventions in poverty alleviation. The former isknown as indirect poverty interventions while the latter are known as direct povertyinterventions. Indirect interventions widen the opportunities for everybody including the poor.Finally, where direct interventions are required, it is argued that it is useful to determinewhether individuals are experiencing transient/temporary or chronic/persistent poverty.Obviously, chronic or persistent poverty requires sustained effort not stop-gap solutions.
3. Development Performance in the Last 25 Years
It is the objective of this section to provide a succinct review of the economic policyenvironment and development performance of the country in order to help the readerunderstand the environment within which the micro-interventions are operating. Povertyincidence is also better understood with a good grasp of the economic environment.
Economic Policy Environment. In the 1960s, the country was under an import-substitution policy regime. While early in 1970s export promotion was introduced, theprotection rates indicate that until late 1980s the trade and investment environment stillfavored inward-looking industries. This policy regime has penalized heavily the agriculturesector where the majority of the poor are dependent. In the 1980s, the country embarked on aseries of trade liberalization programs with some postponement episodes due to concurrenteconomic crises. Studies of the post-war economic policies were unanimous in pointing toimport-substituting policies as the main culprit in the country’s failure to grow rapidly (ILO(1974), Bautista and Power (1979); Medalla (1990), Medalla et. al. (1995)). The accession tothe GATT-Uruguay round is the recent addition to these liberalization efforts.
The more recent significant policy changes include the liberalization of foreigninvestments, liberalization of the foreign exchange markets, privatization of governmentowned and controlled corporations, and the opening up of previously oligopolistic industriessuch as telecommunications and shipping, among others. These policies are designed to gearup the economy for an outward-looking strategy based on comparative advantage. In fact, thetwin pillars of the current development strategy are world competitiveness and sustainablehuman resource development. If the recent policy changes are sustained, many analysts believethat there will be substantial overhauling of the Philippine economy in the coming years alongthe lines of the country’s comparative advantage resulting in vigorous employment generation.
On the aspect of governance, the landmark piece of legislation which finally gave teethto the long espoused policy of decentralization is the Local Government Code of 1991. Thislaw has institutionalized community participation in the economic process. It also mandatedthe participation of NGOs in the development efforts. Furthermore, it devolved many of thefront-line government services, such as agricultural extension and health, from the national to

4
the local government. Finally, besides increasing the share of LGUs on internal revenue taxesand national wealth, it also gave them more power to generate local revenues.
Growth in Per Capita Income. The economic growth record of the Philippineeconomy was characterized by high growth in the 1960s and 1970s. This virtually came to ahalt and even some negative growth rates were obtained in the early 1980s. There wastentative resurgence in the late 1980s while a complete recovery was demonstrated in the1990s (Table 1 ). The projections for the coming years are equally upbeat. Population growth,in the other hand, continues to be high compared to countries like Thailand and Indonesiawhich exhibited similar population growth rates in the 1960s. In the 1970s, the populationgrowth rate is more than 3 percent. The advance estimates for the latest census (1995) putsthe population growth rate at 2.32 percent. Given the economic crises in the middle of 1980s,the highest real per capita level in 1981 was only regained a decade latter in 1991. Thus, atleast a decade of per capita income growth was lost in the process.
Changes in the Economic Structure. The structure of the economy defines theopportunities for participation in growth by the poor. Industrial restructuring that favor labor-intensive industries is good for the poor. The country’s industrial structure, however, has notchanged drastically over the last 30 years. The more recent policy changes geared towardsglobal competitiveness is very recent to show clear trend towards an industrial restructuringthat is favorable for the poor although there are already indications of a more regionallydispersed economic activities in recent years.
The structure of the Philippine economy has not changed drastically over the last 25years (Table 2). The industrial sector which has been contributing about a third of domesticoutput in 1970s continues to contribute practically the same proportion 25 years later. Thedecline in the contribution of the agriculture sector is accompanied by the rise in thecontribution of the services sector.
In terms of the structure of Philippine exports, however, substantial restructuring hasoccurred. Traditional exports of agricultural products no longer dominate. In the recent past,the first two major exports are electronics and textiles.
Another long standing phenomenon in Philippine development is the flow of overseascontract workers. In more recent years, remittances of overseas contract workers contributeas much as 2 percent of gross national product. This figure may be grossly understatedbecause it represents only the documented ones. These remittances have kept the economyafloat during the period that it was not growing. This has been construed as a deviation fromthe East Asian model. While neighboring countries attracts foreign direct investments, thePhilippines sends its workers abroad (Orbeta and Sanchez, 1995).
Employment Generation. Labor is the primary asset of the poor. Thus, even withoutthe need for targeting, labor-intensive economic growth is favorable for the poor. Theemployment generation history of the country seems to indicate that the labor content ofgrowth is not impressive. Only the more recent policy changes that are geared toward globalcompetitiveness holds the promise for more employment content of economic growth.
The long history of protection and bias against the agricultural sector has resulted in alackluster employment generation record of the Philippine economy. This situation can begleaned from the sectoral contribution of output and employment (Table 2 &3). For example,the industrial sector, which contributed a third of output, absorbed only about 20 percent of

5
employment. A striking case in the industrial sector is manufacturing. Manufacturingcontributed as high as 28 percent in output but only 12 percent in employment. Theagricultural sector, on the other hand, which has a declining share in output still contributes ashigh 45 percent of employment generation. The contribution of the services sector to output isrelatively stable but its share in employment generation is rising. The data indicate that it is theservice sector rather than the industrial sector which is absorbing surplus labor. Theunemployment record of the country is high by Southeast Asian standards2. Contributinglargely to this high unemployment rate is the failure to bring down fertility rates faster. Thelatest census figures (1995) put the population growth rate at 2.32 percent. A good indicationof the extent of the unemployment problem of the country is that it has not spared eveneducated workers (Table 4). This lack luster performance in employment generation hascontributed, in the no small a degree, to the flow of overseas contract workers.
Sectoral Allocation of the National Budget. The allocation to the social sectormeasures the amount of entitlements the poor can expect from the government. It defines howmuch education, health and sanitation the poor can expect from the government. Thegovernment appears to have successfully shielded the social sectors from budget share cutsother sectors, notably the economic sector, have been experiencing during the period.
It is noteworthy that throughout the 1980s, with the exception only of 1984, the shareof the social sector in the national government budget has not drastically declined (Table 5).What has been declining is the share of the economic services. This trend has been singled outby analysts as alarming because this may mean foregoing growth prospects in the future. Thesignificant share of debt service has been the object of contention between many independentanalysts and government policy makers. Analysts were prodding the government to negotiatefor a debt relief and use the proceeds to spur growth in the middle of 1980s. The government,however, choose the conservative path of paying foreign debt as scheduled. This has resultedin the rapid growth of domestic debt.
4. Poverty Situation and Poverty Alleviation Initiatives
4.1 Poverty Situation
Poverty incidence in the country is officially measured by a headcount ratio. Thepoverty threshold is the food threshold adjusted for non-food expenditure. The food thresholdis computed as the expenditure of a typical and modest menu of food that satisfies 100%sufficiency in the required dietary allowance (2,000 kcal) for energy and protein and 80%sufficiency in vitamins, mineral and other nutrients. A different menu is determined for eachregion. This poverty line is considered too liberal compared to other countries (World Bank(1996)).
2 It must be noted that there is a difference in the definition of unemployment in the Philippines, which tend to biasupwards the magnitude of unemployment, compared to other countries. In the Philippines, the unemployed includes,in addition to those who are actively looking for work, those who are not actively looking for work due to reasonssuch as: belief that there is no work available, temporary illness/disability, bad weather.

6
The decline in the overall poverty incidence is considered gradual. From 45% in 1985the incidence declined to 36% in 1994 or an average annual decline of less that 1 percent(Table 6). The neighboring countries of Indonesia, Malaysia and Thailand, on the other hand,posted an average annual decline of 2.0, 1.6 and 1.4, respectively. As in many developingcountries, the decline of poverty incidence in urban areas is much faster compared to ruralareas3. The national capital region exhibited the fastest decline and the lowest povertyincidence. While poverty incidence is declining in many regions, the stark reality of anincreasing number of households that are classified as poor remains.
Table 7 confirms a well-known hypothesis that large families are more prone to bepoor. Poverty incidence of families beyond five exceeds the national proportion. It is notsurprising to find that majority of the poor are dependent on agriculture for livelihood. Withinthe agricultural sector, rice farmers, rice and corn farm workers, foresters and deep-seafishermen have very high incidence of poverty. In terms of numbers, however, the rice farmersdominate.
4.2 Causes of Poverty
A recent study on poverty done by Philippine analysts enumerated the causes ofpoverty in the country to include: (1) the failure of growth and the lack of employmentopportunities; (2) the inequality of income; (3) high population growth; (4) decliningproductivity; and (5) inadequate provision of social services (De Dios, et al. (1993)). Seven years ago another study on Philippine poverty identified also items (1), (2), and (3) as thereasons for poverty in the country (Worldbank 1988). Finally, the PCFP’s (1994) Strategy toFight Poverty added two more causes, namely: (1) poor or degraded resource base, and (2)unresponsive and graft-ridden politics and bureaucracy. Table 8 presents a summary of thecauses of poverty and the needed interventions.
Lack of sustained economic growth is the single most important reason for the veryslow decline in poverty incidence. Lack of growth is also the primary reason for lack ofemployment opportunities. In addition, the lack of employment content of growth alsocontributes to lack luster employment generation performance. The reasons for the failure ofgrowth and the lack of employment opportunities have been explained above.
It has been claimed that although respectable growth rates in the 1970s were achieved,these did not benefit the poor owing to the inequitable structure of the economy. Thisinequitable structure remains until today. The extent of inequality of income is indicated by thefact that for the past ten years the share of the bottom 30 percent has never gone beyond 10percent while the share of the top 10 percent for the same period has never gone below 36percent. The prospects for asset redistribution through land reform have diminished. It hasbecome clear that what political consensus will allow is not sufficient to alleviate the povertysituation. Access to production resources such as credit is also loaded against the poor and
3 I has been argued that because the definition of rural physical areas is shifting over time, there is a natural bias forgains in poverty in urban areas. This is because a rural-based stimulus will be registered as urban-based if incomesrise faster in urbanizing rural areas than in non-urbanizing rural areas (Balisacan 1993).

7
asset less.
It is also well known that the decline in fertility rates is not as impressive as eitherThailand or Indonesia. From the advance estimates using the last census (1995), thepopulation growth rate in the Philippines is still about 2.32 percent. Table 7 clearlydemonstrates that poverty incidence is high among large families.
There is also a continuous decline in total factor productivity (Hooley (1985), Sanchez(1983), Cororaton et al. (1995)). This situation is even more pronounced in the agriculturalsector where a large majority of the poor are dependent for livelihood (Table 7).
Given the failure of growth and the rapid population growth, it is not surprising thatthe provision of social services also deteriorates. It is laudable that the share of the socialsector has been protected during the difficult years. Nonetheless, lack of growth limits thegovernment ability to raise funds for more services.
Many of the poor are dependent on common property resources for livelihood.Without better management, those resources will be easily overexploited rendering them lessproductive. Once this happens, the poor’s main source of livelihood becomes bothunproductive and a threat to the environment.
Finally, the lack of responsiveness of both politicians and the bureaucracy further limitsthe opportunities of the poor.
Table 8Causes of Poverty and Interventions
Causes of Poverty Interventions RequiredFailure of growth and lack ofemployment opportunities
• Sustained economic growth;• Labor-intensive growth;• Removal of discrimination against activities in rural
areas where the most of the poor resideInequality of incomes, wealthand access to resources
• Asset redistribution, i.e. agricultural land, naturalresources, credit
High population growth • Aggressive population management programDeclining factor productivity • Removal price distortions;
• More investments in R&D particularly in agriculture• Provision of allied services, i.e. infrastructure,
extension servicesInadequate provision of socialservices
• Protecting the social sector budget;• Increasing internal efficiency - more basic education
and primary health carePoor or degraded resource base • Better management of resources under open accessUnresponsive and graft-riddenpolitics and bureaucracy
• Encourage popular participation and consultation inpolicy formulation and design of projects

8
4.3 Broad Poverty Alleviation Initiatives
A poverty incidence reduction target based on the headcount ratio was set at the startof the term of the current administration in 1992. The target is from 45 percent in 1991 to 30percent in 1998.
The current development strategy is based on the twin pillars of global competitivenessand human development. It is a growth-based strategy via elimination of artificial barriers tothe functioning of markets as well as investment in human resources and peopleempowerment. Given these backdrop, there are significant broad poverty alleviation initiatives,namely: (1) sustained economic growth, (2) the social reform agenda, (3) the use minimumbasic needs indicators, (4) a strategy to fight poverty, and (5) institutional support for povertyalleviation. Sustained economic growth is included because it is a necessary condition forsustained poverty alleviation efforts.
4.3.1 Sustained Economic Growth
The role of sustained economic growth on poverty alleviation was highlighted in themiddle of 1980s when the economy was not growing. The poverty problem in the Philippinesthen was diagnosed as mainly due to the absence of economic growth. With a turbulentpolitical condition then, it was difficult to launch a coordinated effort to achieve economicgrowth. Immediately after the restoration of the democratic process in 1986, the economystarted to grow but in a boom-bust fashion reflective of a weakened economic structure. Inmore recent years, however, growth have been sustained and many analysts are of the opinionthat this time it is sustainable.
It worth noting that an estimate for the country of the elasticity of poverty gap to adistributionally-neutral growth is -1.8, i.e., a 10 percent growth in GDP per capita wouldreduce the average poverty gap by 18 percent (Balisacan (1994)). Therefore, assuming thatthe preliminary estimate of poverty incidence in 1994 of 36 percent is correct, the country’sreal per capita GDP needs to grow by an average of 3.4 percent between 1995 and 1998 toachieve the 30 percent target. Given the population growth rate of 2.32 percent, this wouldimply a GDP growth rate of 5.72 percent annually. In order to achieve the poverty target, thecurrent growth record needs to be sustained.
With structural reforms already in place and sustained growth secured, the governmentin 1994 explicitly turned its attention to the plight of marginalized sectors. It launched theSocial Reform Agenda (SRA) as an umbrella framework for all poverty alleviation efforts.Compared to the difficult time in the early 1990s that is marked by fiscal difficulties, this timethe government is in a better position.
4.3.2 The Social Reform Agenda
The umbrella framework for poverty alleviation in the Philippines known as the SocialReform Agenda (SRA) was launched in September 1994. The agenda is built on fiveprinciples, namely: (1) a continuing and coordinated effort; (2) partnership between
9
government and other sectors; (3) provision of minimum basic needs to disadvantaged group;(4) explicit targets and commitments; and (5) a conducive policy environment for a sustainableimplementation.
To give these agenda a sense of priority, the President heads the policy-making councilbehind the SRA known as the Social Reform Council. The council is composed of keyimplementation officers for each of the flagship programs, heads of allied national governmentagencies, and representatives from local government units and the private sector. To ensure acontinuing effort, the activities under the SRA are included in the normal operations andbudgeting of the national line departments. In addition, regular monitoring and semi-annualassessment of the progress of the implementation are conducted.
Targeting is done both by geographic area and by sector. At the start of the program, atotal of 20 out of the 77 provinces have been identified as priority provinces. Currently, thishas been expanded to include all the provinces. Seven disadvantaged groups (the programcalls them basic sectors) have also been identified and continue to be the target beneficiariesup to the present. These groups include: (1) farmers and landless rural workers, (2) fisherfolk,(3) urban poor, (4) indigenous cultural communities, (5) informal sector workers; (6) othersincluding women, youth, disabled, elderly, and victims of disasters and calamities.
Specific programs were drawn for each basic sector based on the situation analysisconducted by each group in separate sectoral consultations. The programs include both broadpolicy reforms for the sectors as well as specific projects. For instance, the identified problemsof farmers and landless rural workers include limited rural infrastructure, uncertain land tenure,limited access to technology and limited access to markets. Thus the program designed for thisgroup is agricultural development consisting of intensified implementation of theComprehensive Agrarian Reform Program, concentration of agricultural developmentresources using agrarian reform communities as main conduits, increasing budget for basicrural infrastructure such as irrigation systems, post-harvest facilities and farm-to-market roadsand technology input for improved productivity. As another example, the needs assessment forindigenous cultural communities (ICCs) came out with the non-recognition of their ancestraldomain rights and lack of basic services as their priority needs. Therefore, the programdeveloped for them a legislative and executive agenda towards the protection of ancestraldomains and ICC interests. In addition to these sector-specific programs, three cross-sectoralprograms were also drawn up. These programs include: institution-building and effectiveparticipation in governance, credit, and livelihood programs.
Being an umbrella framework for poverty alleviation, majority of the credit, livelihoodand training programs that will be discussed in detail below are included among the SRAprograms. It must be understood, however, that SRA does not consist only of micro-interventions but also policy and institutional initiatives. Given the framework presented abovewhich emphasize the role of making the environment right for the poor in poverty alleviationefforts, this is indeed a step in the right direction.
4.3.3 Minimum Basic Needs Indicators
The adequacy of income as a measure of poverty has been questioned. Other measuresof deprivation are now being used mainly from the inspiration arising from the development of

10
the UNDP’s human development index. In the Philippines, a set of deprivation indicatorsknown as the Minimum Basic Needs (MBN) has been officially accepted. In this set, income isjust one of the deprivation indicators. The indicators are divided into three groups which areoften times arranged in a hierarchical manner, viz. (1) survival needs indicators (i.e., health,nutrition and water and sanitation indicators), (2) security needs indicators (i.e., income,shelter and peace and order), and (3) enabling needs indicators (i.e., basic education andpolitical participation indicators). These indicators were derived from a series of regionalconsultations. Although there is no officially accepted threshold levels for the indicators todate, these indicators are being used to monitor the status of well-being of poor households.There are ongoing efforts to gather information on these indicators at the local levels on aregular basis. Up to this time, however, data are still spotty. What has not also been resolvedis how to summarize this set of indicators to measure poverty.
4.3.4 Institutional Support for Poverty Alleviation
Besides the Social Reform Council which is the policy making body of behind theSRA, three Presidential Commissions were formed, namely: the Presidential Commission toFight Poverty (PCFP); the Presidential Commission for Countryside Development (PCCD);and the Presidential Commission for the Urban Poor.
The Presidential Commission to Fight Poverty (PCFP) was created in 1992 to overseeall government activities on poverty alleviation to ensure pro-poor bias, focus on the poorestof the poor and most needed services, and accelerated implementation of governmentprograms and projects. The PCFP is tasked with the following functions: (1) prepare a blueprint of action that shall embody the Administration’s poverty alleviation framework andtranslate this into short, medium and long-term targets which shall reflect the priority actionareas of the government; (2) monitor the implementation and impact of government povertyalleviation programs, projects and activities; (3) coordinate and integrate government povertyalleviation efforts; (4) review and evaluate the level of performance of concerned agencies andactivities; (5) prod and facilitate the implementation of poverty alleviation activities; (6)communicate to the public government’s poverty alleviation activities and its impact; (7)provide the support and assistance needed by local government units to ensure that theydeliver the basic services to their respective constituencies; and (8) ensure that all governmentpro-poor programs build the capability of our people to be empowered and to be self-reliant.
PCFP drafted the basic strategy to fight poverty. This strategy is based on theMinimum Basic Needs (MBN) Approach which was validated for responsiveness andfunctionality through consultations at provincial, regional, and national levels with sectoralgovernment agencies and NGOs.
The Presidential Council for Countryside Development (PCCD) was established toaddress the socio-economic problems of regions, provinces and areas. The Council assists inidentifying opportunities for growth and development, and motivates regions and provinces toconcentrate on development efforts that would accelerate the growth process. Moreover, thePCCD also assists in addressing infrastructure bottlenecks and inadequacies by mobilizingresources for such purposes.
Finally, the Presidential Commission for the Urban Poor (PCUP) is an institutiontasked with the function of formulating and implementing policies to reduce poverty in the

11
urban sector. The Commission coordinates, promotes, and advocates the Urban PoorDevelopment Framework Plan (UPDFP) and acts as the link between the government and theurban poor segment of the population.
5. Micro-Interventions
The micro-interventions discussed in this section are those that address both transientand chronic poverty. While it may be argued that chronic poverty should be the focus givenlimited resources, it is important to recognize the existence of transient poverty and be able tolearn from the difference in approaches and, consequently, in the appreciation of the efficiencyand effectiveness of micro-interventions. For instance, as will be revealed later in theassessment of the programs, one cannot apply the same standards for evaluating livelihoodprograms designed for temporarily displaced overseas contract workers to livelihoodprograms for out-of-school youth. In the choice of micro-interventions, an attempt was madeto cover the different types of poverty presented earlier in the framework. Note that what isknown as micro-intervention in this section is called direct intervention in the framework. Allindirect interventions are included in the broad poverty alleviation initiatives section.
The interventions chosen are those that aims to generate employment and those thatdeliver specific social services. The employment generating interventions can be furtherclassified as either wage employment creating schemes (WECS) or those that indirectlygenerate employment through either livelihood projects or self-employment creation (SECS).The emphasis on employment generation among poverty intervention is because of tworeasons: (1) it addresses the lackluster employment generation performance of the economy inthe last 30 years; and (2) labor is the primary asset of the poor. To give the reader a flavor ofthe other highly targeted interventions, a couple of poverty alleviation programs that deliverspecific social services to focused clients are also discussed. The micro-interventions analyzedinclude one WECS, namely: (1) Community Employment and Development Program(CEDP); and 4 sets of SECS which include: (1) Department of Labor and Employment’s(DOLE) Integrated Livelihood Program (DILP); (2) Department of Social Welfare andDevelopment’s (DSWD) Self-employment Assistance Program; and (3) Department of Tradeand Industry’s (DTI) Tulong sa Tao - NGO Microcredit Program. The two other micro-interventions discussed are the (1) Community Mortgage Program (CMP) and (2) Lakass andKatawan Sapat sa Sustansiya (LAKASS).
A discussion of micro-interventions for poverty alleviation will not be completewithout clarifying that SRA, which is dubbed as the umbrella framework for povertyalleviation, includes many of the SECS we will discuss in this section. However, since theSRA does not only consist of micro-interventions but also include broad policy initiatives aswell, SRA was included among the broad poverty alleviation initiatives.
In terms of the National Livelihood Program, the programs selected (except for theCEDP) contributed 91% of all livelihood projects, 57% of the beneficiaries, 58% of the totalnumber of trainings and 74% of the number of trainees (Table 9). The programs alsoaccounted for 12% of the total credit funds and 40% of the training funds. The LAKASS andthe CMP, on the other hand, are the highly acclaimed successful poverty alleviation programs

12
in their class.
5.1 Community Employment and Development Program (CEDP)
The Community Employment and Development Program (CEDP) is a comprehensiveprogram launched by the government in 1986 for the purpose of creating one million jobs inthe countryside by the end of 1987. This period immediately follows the peaceful “people-power” revolution that ended the 20-year term of Marcos. The order of the day then waseconomic recovery side-by-side with the restoration of political processes.
Objectives. The Program’s objectives are: (1) to achieve economic recovery in theshort run and sustained growth in the long run; and (2) to increase the purchasing power ofthe people in the rural areas through income from productive employment.
Beneficiaries. There was no clear identification of specific beneficiaries for theprogram except perhaps by the implication that the target projects need to be rural-based.
Features. An Inter-Agency Committee on CEDP was created by the President tocoordinate and monitor the implementation of the Program. It was tasked to formulate plansand programs, coordinate the efforts of all the agencies and local government units. It wasalso responsible for acting on the problems that may occur during Program implementation aswell as for evaluating the performance of CEDP. The Committee was headed by the Secretaryof Economic Planning (concurrently the National Economic and Development AuthorityDirector General) as chairman, with the Secretary of Budget and Management (DBM) as co-chairman. Officials of the Departments of Public Works and Highways, Transportation andCommunications, Labor and Employment, Social Welfare and Development, Justice, Tradeand Industry, Local Governments, and the Presidential Management Staff comprise itsmembership.
In 1986, a CEDP Monitoring System was established by NEDA in coordination withthe DBM and the various line agencies to monitor the implementation of the Program. Theassistance of the NGOs/PVOs/private individuals was tapped to advocate citizenryparticipation and report irregularities/anomalies committees in the course of implementation.
As one of the key features of CEDP, the assistance of non-government organizations(NGOs)/ private volunteer organizations (PVOs) in monitoring the projects was enjoined. Theeffort was made possible through the establishment of various Regional Monitoring andCoordinating Committees (RMCCs) under the Regional Development Councils (RDCs). TheNGOs/PVOs through their network of chapters and members helped monitor the progress ofrural-based projects implemented under the CEDP. They provided reports of project visitsincluding irregularities/anomalies.
A total of 4.8 billion pesos has been allocated for the implementation of mostly rural-based, labor-intensive projects by different agencies under the 1987 Program.
Performance and Lessons. Although the 1986 CEDP was originally intended to beimplemented during the second semester of 1986, difficulties encountered in its initialimplementation particularly in the funds flow schemes, necessitated for extension of itsschedule to 1987. In addition, the numerous reports of irregularities and problems in actual

13
project execution contributed to the delays in the implementation which was carried over up toJune 1987.
In 1986, a total of 20,148 projects implemented by five agencies have been completed,while 2,410 projects implemented by six agencies due to their continuing nature, remainedongoing. These include nationwide agriculture and social development projects that areimplemented on a regular basis. The 1986 program generated a total of 18.6 million man-daysof employment equivalent to 389,853 jobs.
In 1987, a total of 29,577 projects have been implemented (21,686 completed and7,891 ongoing) representing 95.4 percent of the targeted 30,999 projects. In the 1987program, a total of 18.2 million man-days of employment was generated equivalent to 405,603jobs.
As of February 1988, a total of 41,834 projects were completed and 10,301 ongoingout of the 53,841 targeted for the 1986 and 1987 Programs. The 1986 and 1987 Programsgenerated 36.9 million man-days equivalent to 795,456 jobs. The total man-days generated is76 percent of the target man-days (Table 10).
The CEDP has generated employment opportunities equivalent to a total of 36.7million man-days of 795,459 jobs. A survey of workers hired under CEDP projects wasundertaken in 1987 to determine whether the CEDP was able to reach it targeted beneficiaries,which are the unemployed, the underemployed, and the poor.
The survey of some 11,086 CEDP workers yielded the following results:
(1) In general, the Program was successful in utilizing labor in the locality where theprojects were undertaken, with most of the respondents or 77.6 percent were residentsof the barangays where the projects were located.
(2) A large proportion (54.4 percent) of worker-respondents was employed before they
joined CEDP. Of those who were employed, 34 percent were formerly laborers orproduction and related workers; 25 percent were agricultural workers (farmers,fishermen, and farm laborers); and 23 percent were service workers.
(3) The CEDP was also successful in reaching out to the poor. More than half (54
percent) of the surveyed workers had incomes below the subsistence or food line for afamily of 6 members estimated at P1,191 per month (at 1985 prices). Moreover, anoverwhelming majority (82 percent) had family incomes below the poverty thresholdwhich was P2,382 (at 1985 prices) per month.
(4) The implementation of CEDP projects in the countryside brought government efforts
nearer to the people through the provision of the needed infrastructural facilities suchas barangay roads, school buildings and artesian wells. In addition, it also providedincreased incomes to the residents employed by the projects in the area.
The participation of the citizenry in monitoring the projects conducted through theNGOs/PVOs enhanced the policy of government to promote transparency and to minimizeanomalies in project implementation.

14
The success of CEDP outlines the adoption of its concept in subsequent efforts of thegovernment as built-in into the regular programs and activities of the government machinery. The advocacy for citizenry participation through the NGOs/PVOs/private individuals inmonitoring and coordination should be strengthened. In addition, total transparency ingovernment shall always be maintained.
After 1987, the CEDP ceased to be implemented as a separate program. Most of itselements were institutionalized and adopted in most of the regular projects implemented by theagencies. Private citizen participation in the monitoring and evaluation of the projects hasbeen continually encouraged. Private participation has been formalized through the inclusionof 3 private sector members in the Regional Development Council. The council oversees theplanning and policy making in the region.
A similar program was launched in 1993 called Kabuhayan 2000. This aims atgenerating 2 million jobs between 1994 and 1995. It integrates all employment assistance ofnational government agencies. Unlike, the CEDP however, the current the activities under theprogram include such activities as reforestation, land development, physical infrastructure andlivelihood creation.
5.2 DOLE’s Integrated Livelihood Program (DILP)
The DOLE Integrated Livelihood Program (DILP) is conceptualized and implementedin response to Cabinet Resolution No. 29 which identifies the Department of Labor andEmployment as one of the line departments mandated to generate, develop and implementlivelihood programs. The program was established in late 1988. Prior to the DILP, the DOLEimplemented various livelihood programs through its bureaus and attached agencies. TheDILP is an integration of these self-employment and entrepreneurship development programs.
General Objective. The DILP aims to improve the reach, speed, and quality ofprogram delivery by focusing the services on specific client groups and thus, maximizingcompetencies.
General Feature. The programs under the DILP involve training on self-employmentand entrepreneurship development and credit delivery. The programs may have similarcomponents but the differences lie on the target beneficiaries and the funding source. Thisresulted in separate program implementation by the designated agencies.
In some of the programs, no known assessment was done. The performance andlessons given for these programs are those of predecessor programs that are almost identical indesign. Monitoring reports of project implementors are also utilized.
The programs under the DILP are: (a) The National Manpower and Youth Council(NMYC) training programs, namely: (1) Training for Entrepreneurship Development(TREND), (2) Community Training Units (CTUs) , (3) Training Delivery for The InformalSector (TDIS); (b) Expanded Livelihood Development Program (ELDP) of the OverseasWorkers’ Welfare Administration (OWWA); (c) Workers Entrepreneurship (WE) Program ofthe Bureau of Labor Relations (BLR); (d) Women’s Workers Employment andEntrepreneurship Development (WEED); (e) Working Youth Center (WYC)Livelihood/Employment Promotion Assistance Projects both of the Bureau of Women andYoung Workers (BWYW); and (f) Promotion of Rural Employment Through Self-

15
employment and Entrepreneurship Development (PRESEED) of the Bureau of Rural Workers(BRW).
a) National Manpower and Youth Council (NMYC)4 Training
1. Training for Entrepreneurship Development (TREND)5
Objectives. The program aims to contribute to employment creation and incomegeneration by developing the entrepreneurial talents and capabilities of skills training graduatesof National Manpower and Youth Council (NMYC) and DOLE.
Beneficiaries. The program beneficiaries are out-of-school youth andunemployed/underemployed adults. The program participants should be out-of-school-youthand unemployed or underemployed persons between 18-40 years of age with good moralcharacter, permanent resident of the municipality, and graduate of any NMYC/DOLE skillstraining program. Participants should possess basic reading, writing and arithmetic skills, andinclination to undertake entrepreneurship activities.
Features. The TREND is a 120-hour course that offers a combination of theoreticaland practical knowledge on running a micro-enterprise. As a program requirement, the traineeprepares and submits a business plan at the end of the training program.
Training in soft trades and selected basic industrial courses are offered by theCommunity Training Units (CTUs). Qualified individuals who are interested to undergo skillstraining shall sign up with the CTU administrator at the municipal hall.
4 In 1994 the NMYC was converted into the Technical Education and Skills Development Authority which nowoperates independently from the Department of Labor and Employment5 This program was previously called Entrepreneurship Development Training (EDT) which started in 1987.

16
2. Community Training Units (CTUs)
Table 10
Community Employment and Development Program
Summary of Funding and Accomplishments, 1986 and 1987 Programs
as of February 1988
1986 PROGRAM 1987 PROGRAM TOTAL
Allocation (P000) 4,177,735 1/ 4,857,134 9,034,869
Releases (P000) 3,334,977 3,920,966 3/ 7,255,943
Percent Support 79.8 80.7 80.3
Disbursement (P000)
2,509,120 2/ 2,312,887 4,822,007
Percent Utilization 75.2 59.0 66.5
Number of Projects
Target 22,842 30,999 53,841
Completed 20,148 21,686 41,834
Ongoing 2,410 7,891 10,301
Unstarted 284 1,561 1,845
Percent Implemented 98.8 95.4 96.8Employment Generation
Target Man-days 19,446,245 29,037,119 48,483,364 Generated Man-days
18,647,668 18,204,235 36,851,903
Percent Accomplished 95.9 62.7 76.0
Equivalent No. of Jobs
389,853 405,603 795,456
1/ Revised allocation; original amount was P3.9 billion
2/ Excludes disbursements of five agencies due to non-availability of reports
3/ Actual amount received by line agencies out of the P4.2 billion advice of allotment fromDBM

17
Objectives. This program aims to deliver outreach practical skills training for out-of-school youth and unemployed or underemployed adults in the different municipalities incooperation with the municipal government, and with the NGOs and other governmentagencies as contributing partners.
Beneficiaries. Program participants should be 18-45 years old, out-of-school youth orunemployed and underemployed adults with basic reading, writing and arithmetic skills, ofgood moral character and permanent resident of the municipality. Training in soft trades andselected basic industrial courses are offered by the Community Training Units (CTUs).Qualified individuals who are interested to undergo skills training shall sign up with the CTUadministrator at the municipal hall.
Features. The NMYC is the implementing agency of the program while the municipalgovernment provides funding support. The program complements and supplements theexisting Regional Manpower Training Centers (RMTCs) and expands the access of rural youthto quality skills training programs and services for increased employability and incomeenhancement.
3. Training Delivery For The Informal Sector (TDIS)
Objectives. The project aims to build up the capability of the local government units(LGUs) in planning, organizing, and delivering community-based skills/vocational trainingprojects.
Beneficiaries. The direct beneficiaries of the project are regular employees of themunicipalities whose present work involves community development. The employee mustpossess the following qualifications: preferably a college graduate, but must not be below 2nd
year college; must be a regular employee of the LGU; should not be more than 50 years oldand not less than 20 years of age; should be physically strong, committed to his work andunderstands development at the local level; present assignment will allow him/her toimplement his re-entry plan and effectively assume his/her role as a Community Training andEmployment Coordinator (CTEC); nominated by the LGU officer; willing to commit himselfto the field of training and community development.
The indirect beneficiaries of the project are the out-of-school youth and unemployed /underemployed adults whose employability and income will be enhanced by the community-based skills training programs.
Features. The program trains CTECs of local government units to make themeffective implementors of community-based skills and training projects. It is implementednationwide by the NMYC.
The direct beneficiaries will be designated as CTECs and will be tasked to plan,organize, cause to deliver and flow up community-based skills training programs.
Performance and Lessons. An evaluation study was done by NMYC on the 1987-88operation of the predecessor program the Entrepreneurship Development Training (EDT)(NMYC 1990). Table 11 provides the some of the indicators of the performance of the

18
program during that period. The significant results include: (1) majority of the participantswere able establish enterprises in 70 percent of the pilot regions; (2) 65% of those whoestablished new enterprises increased their monthly household income, i.e., the proportion ofparticipants who had personal income of less than P3,500 per month was reduced from 76%to 66%.
Gauging from Table 12, the Community Training Units (CTUs) provides training to alarge number of beneficiaries. In 1995, the current program was able to conduct 755 trainingsat a budget of 9.7 million pesos and benefiting some 18,605 individuals.
Several recommendations were given in the NMYC (1990) evaluation study. Theseinclude: (1) review of promotion strategies, recruitment techniques to improve beneficiaryselection; (2) improving extension services for graduates; and (3) integration of the trainingprograms into livelihood programs.
b) Expanded Livelihood DevelopmentProgram (ELDP)
Objectives. The program aims to assisteconomically dislocated or displaced overseas contractworkers (OCW)-returnees and their families anddependents through extension of total packages forincome-generating projects.
Beneficiaries. The direct beneficiaries of theprogram are the economically dislocated or displacedOCW-returnees and their families and dependents andthe underemployed or unemployed OCW returnees andtheir families and dependents. The program alsobenefits the families and dependents of OCWs planningto engage in income-generating projects to augmentcurrent salary income. The indirect beneficiaries of the
Table 11
Performance of the Entrepreneurship Development Training, 1987-1988
1987 1988
Project Outlay 438,239 614,000
No. of Training 21 48
No. of Graduates 497 1,287
Source: 1987-1988 NMYC (1990)
Table 12
Graduates of NMYC TrainingPrograms, 1987-1993
Year TREND/EDT
CTUs/CTCs
1987 491 1,769
1988 588 11,857
1989 2,088 23,594
1990 5,118 62,663
1991 4,242 58,010
1992 2,022 85,228
1993 2,935 56,096
Source: Manpower Factbook,various issues
19
program are communities and other individuals which will benefit from employmentgeneration and increased economic opportunities resulting from the livelihood projects.
Features. The program provides training for livelihood or income generating projectsand extends total loan package to OCWs and their dependents.
The two major components of the program are the Livelihood Loan Windows and theTraining component. The Livelihood Loan Windows component includes sub-componentssuch as: conduit financing, impact projects financing, small enterprise financing, micro-enterprise financing, and non-collateralized loan window. Conduit financing is open to DILPaccredited Non-Governmental Organizations (NGOs). These NGOs extend small loans toqualified OCW individuals or groups in accordance with the four other loan windows. Impactproject financing is open to group projects that has potential to launch small ventures out ofthe original project industry and or potential to have a significant impact on the communityespecially with regards to employment generation and fostering of self-reliance among theproject participants. The centralized Small-Enterprise Financing is open to group projectswhich require an additional capital of over P50,000.00 but whose Total Project Cost (TPC)does not exceed P1.0 million. Micro-enterprise financing is open to all individual projectswhich require additional capital of over P500.00 to P15,000.00 and to group loans whichrequire additional capital of P5,000.00 to P50,000.000 but whose TPC does not exceedP50,000.000. The non-collateralized loan window is available to individual projects whichrequire additional capital of P10,000.000 and below and group loans of P100,000.00 loanceiling.
As a support to the loan for income-generating projects, the loan proponent may alsoavail of different trainings under the program. The training component includes the followingsub-components: small business development training, small business planning andmanagement, training on specific skills, and industry specific cliniquing. The small businessdevelopment training is designed to generate interest among potential OCWs to engage inlivelihood projects while the small business planning and management training providestraining in business planning and management techniques to enhance entrepreneurialcompetencies and skills. The training in specific skills provides individuals with necessarytechnology and appropriate skills pertinent to their chosen project. The industry specificcliniquing involves formal discussions on industry practices and problem areas conductedamong members of specific industries to solve particular industry problems. Aside from thetraining, the monitoring officer, other OWWA personnel and professional consultants also offer business consultancy in the course of project implementation. The OWWA alsosponsors an annual Livelihood Fair to showcase the products produced by the projectbeneficiaries.
The financing aspect of the program covers agri-business, manufacturing, trading,cargo and passenger transport, professional or service-oriented projects, reconditioning ofvehicles, machinery and equipment, pigpen and poultry renovation and other lucrativelivelihood endeavors which may be considered by the Economic Benefits Department (EBD). Projects with short gestation periods, fast sales turn-over, labor intensive and requiring lesscapital outlay are eligible under the program. The following are indicative but not an exclusivelist of projects: (1) Trading (i.e., sari-sari store, food vending, fruit and vegetable vending,garments trading, mini-mart, grocery, mini-drug store, dried fish, rice/grain retailing etc.); (2)Agri-Business (i.e., mushroom culture and spawn production, cutflower production, orchid
20
growing, goat raising, cattle fattening, duck raising, black pepper, fruit and vegetableprocessing, meat and fish processing, ceramic artwork production); (3) Manufacturing (i.e,noodles, fish sauce, soy sauce, vinegar, native cakes and other delicacies, cereals, peanutbutter, candies, tofu, etc.); (4) Transport Service (i.e., pedicab, tricycle, jeep, taxi, etc.)
Performance and Lessons. A review of the predecessor program the Re-EntryProrgam for Returning OCWs Through Entrepreneurship Mediation (REPROEM) wasconducted between November 1990 to January 1991 in three pilot regions (Bot 1991). Some50 beneficiaries were interviewed. The beneficiaries of the program were found to be betteroff, particularly in terms of education and income, than most of the other programs. Of the 50projects 22 were trading activities, 17 in agribusiness, 3 in manufacturing and 8 in services.The average loan size is 13,135 pesos lent at uniform 12% per annum for 1 - 2 years. Theincome of households increased by 39% (or 2,649 pesos per month) and .9 jobs per projectwas created (0.2 in self-employment and 0.7 in wage-employment) (Table 13). The repaymentrate is almost 80%. Ten percent of the amount lent was also found to have been diverted. Itwas found, however, that the reintegration aspect of the program rarely happened. Therelatively good performance of the program was attributed to the fact that the beneficiaries arerelatively better off.
A separate evaluation of the REPROEM and the Entrepreneurship of Migrant Workers(EME) programs was done for the period 1989-1992 (CAPS 1993). These two programswere later combined into what is known as the Integrated Return Program for OCWs (IRPO).For the period, the program benefited 2,548 OCWs and dependents and generated 5,819 jobs.It was able to release only 42.098 million pesos or 35% of the allotted funds of 121.1 millionpesos between 1989-1992. This implies that the average assistance is about 16,500 pesos. Theprimary implementation problem was the delay in the delivery of the service. A loan wouldtake an average of 5-6 months to processes. As explained by the implementors, this was
largely due to lack of logistics.
Table 13Performance Indicators of Selected DILP Programs, 1990-1991
Indicator REPROEM WYC PRESEEDIncome effect / month 2,649 374 912EmploymentSelf 0.20 0.27 0.3Wage 0.69 0.20 0.1Loan diversion (%) 12 - 18 50Repayment (%) 78 89 33
No of projects evaluated 50 individual 4 association11 individual
2 association14 individual
Monthly Income 6,856 2,730 4,723Source: Bot (1991)

21
c) Workers Entrepreneurship (WE) Program
Objectives. The program aims to strengthen trade unions and federations asorganizations by providing opportunities for workers’ active participation in income-generating activities to increase their incomes under the concept of self-help. It also seeks toprovide employment opportunity for the underemployed and unemployed, to provideopportunity for training in specific trades and other skills, and to expand the workersperspective as to their role in national economic development.
Beneficiaries. The major beneficiaries of the program are members of federation andindependent unions.
Features. One of the components of the program is credit for qualified labor unionsand federations to assist them in their income-generating projects. In addition to credit, theprogram provides grants for the necessary training and other services that would equip thewould-be entrepreneurs with skills that would help ensure the success of their income-generating endeavor.
The program is implemented nationwide by the Bureau of Labor Relations with fundscoming from the Workers Organization and Development Fund. The program extends loanassistance with a maximum amount of P1.5 million per federation and P300,000 perindependent union at 6 percent interest rate and loan maturity of three years. The trainingassistance includes Business Appreciation Course (BAC) Skills Training, Basic Managementand Value Orientation, and Consultation Services.
Performance and Lessons. The project monitoring reports show that in between1994-1995 there were 70 organizations and 878 workers who availed of the grant componentamounting to 5.6 million pesos. For the loan component, on the other hand, 7 organizationswere assisted benefiting some 37,511 union members and some 10.5 million pesos of the loanfund released (Table 14). The program was able to utilize only 10% of the allotted budget.
22
d) Women’s Workers Employment and Entrepreneurship Development (WEED)
Objectives. The Women’s Workers Employment and Entrepreneurship Developmentprogram addresses the needs of women particularly on the issue of unemployment andunderemployment. It aims to strengthen the role of women in economic development byimproving their socio-economic conditions and harnessing their entrepreneurial abilitiesthrough training in production or income generating activities, group formation and financingof income-generating activities.
The program specifically aims to improve the socio-economic conditions of womenworkers by providing income generating activities and livelihood and making credit facilities ofboth GOs and NGOs accessible to women workers. Moreover, it intends to raise andstrengthen the level of consciousness of women workers on issues and opportunities affectingthem and their civic mindedness and sense of responsibility to assume correspondingobligations to the assistance extended to them for the benefit of fellow citizens.
Beneficiaries. The project direct beneficiaries are qualified women worker groups.The indirect beneficiaries are working women in the informal sector such as the self-employed,underemployed and home-based workers.
Features. The program started in 1989 and now covers all the 14 regions of thecountry. It is being implemented by the Bureau of Women and Young Workers (BWYW).The women groups will undergo social preparation, entrepreneurship and other appropriatetraining and, eventually, will be provided with credit/funding assistance, for theirentrepreneurial / income generating endeavors. The financial assistance involves the provisionof a loan facility with a maximum amount of P400,000 per accredited co-partner (ACP) andP200,000 per group/beneficiaries at 6% interest rate and a maximum loan maturity of 2 years.
Table 14
Performance Indicators for Workers Entrepreneurship Program, 1994-1995
1994 1995 Total
Budget 62,217,000 94,007,669 156,224,669
Grants
No. of Organizations 25 45 70
No of Workers 142 736 878
Grant Funds 1,314,148 4,308,661 5,622,809
Loans
No of Organization 0 7 7
No. of Workers 0 37,511 37,511
Loan Funds 0 10,500,000 10,500,000
Source: Program Reports
23
The training assistance includes training on social preparation (value orientation; gendersensitivity training (GST), leadership, communication, organization, management;cooperativism), Entrepreneurship Development Training (EDT), and Appropriate SkillsTraining (AST). Technical assistance and consultancy services are also provided to thebeneficiaries.
Performance and Lessons. An assessment of the program was done for the period1989-1992 (CAPS 1993). During this period 58 projects were assisted benefiting 1,123women and a total of 1.75 million of loan funds released. Funding sources include the DOLEthrough BWYW, DTI and DOST and private institutions such as Abot Palad Foundation andthe Rehabilitation Fund. The BWYW fund was underutilized even if the project, which wasdesigned to be a nationwide program, was implemented in only 8 regions (Table 15).
The study revealed that revealed that the beneficiaries were highly concentrated inLuzon (71 percent) while regions in the Visayas had the lowest number of beneficiaries. Thishas been caused by the financial difficulties resulting in delays in program implementation andlimited the projects, beneficiaries, and areas covered by the program.
The projects financed by the program included traditional women activities such asweaving, handicrafts, food processing, crop production, and others. These activitiesincreased women’s income and contributed to their families’ welfare. However, since theseare traditional women activities, they failed to integrate women into the mainstream laborforce, nor are they instrumental in mitigating gender biases in the society (CAPS 1993).
In 1995, the program was able to assist 330 projects involving some 5.1 million creditfunds and benefiting some 4,637 beneficiaries.
The 1995 project reports reveal a number of notable program impact on the womenbeneficiaries. Women beneficiaries became self-employed, productive, and modelentrepreneur with enhanced skills. Positive values were inculcated, and self-reliance andsocial skills were developed among program beneficiaries. Majority of the beneficiaries wasrelieved from usurious practice of lenders. The program also contributed to employmentgeneration and improvement in family income among the households of women beneficiaries. However, the women beneficiaries also encountered a number of problems such as the
Table 15
WEED Funds Utilization, 1989-1992
Year Budget Releases % Utilized
1989 200.0 168.5 84
1990 189.5 109.5 58
1991 150.5 90.0 60
1992 140.0 115.0 82
Total 680.0 483.0 71
Source: CAPS, 1993

24
insufficiency of raw materials for production and the lack of market for their products. Someprojects were delayed due to insufficient DOLE livelihood funds.
Major problems in program implementation include the lack of DOLE personnel toimplement and monitor the programs in the regions, and delays in the release of funds. Anumber of projects in sites with unstable peace and order situation failed to reach its intendedbeneficiaries while others were not sustained due to problems concerning collection of loanrepayments.
e) Working Youth Center (WYC) Livelihood/Employment Promotion AssistanceProjects
Objectives. The general objective of the program is to develop and enhance thepotentials of young workers as effective leaders, self-reliant and productive citizens, theprogram also provides opportunities to help augment family income. The specific objectivesare: (1) to organize and strengthen working youth associations for their own collectiveprotection and benefit and for facilitating the delivery of programs; (2) to facilitate the deliveryof existing programs to the young workers such as training, employment and other programsthat will ensure the fullest development of the young workers potentials and productivity; (3)to enlighten young workers on government laws, rules and regulations and on other issuesrelating to their employment, primarily those which promote the improvement of their workingconditions and welfare; and (4) to mobilize all sectors and available resources in undertakingprograms, services and activities for the full attainment of the young workers participation inlabor and development.
Beneficiaries. The program beneficiaries include working youth aged 15-24 who areemployed, underemployed or self-employed. The credit assistance is extended to youngworkers and Working Youth Organizations with feasible and viable income generatingprojects.
Features. The Working Youth Center (WYC) program attempts to initiate andimplement selected small-scale projects to supplement the income of low-wage workers. TheWYC livelihood and income generating projects are ideally conceptualized and implemented ina community development/community outreach setting.
A maximum of P20,000 loan per group project is granted to projects with a minimumof 20 beneficiaries. The loan is payable within the maximum of 3 years.
Performance and Lessons. The regional and monitoring reports of the program for1995 raised a number of issues and concerns regarding the livelihood projects, the workingyouth organizations, and the regional implementation of the programs. In particular, thequalification criteria for applicants of WYC credit and livelihood assistance are too rigid that anumber of Working Youth Organizations (WYOs) had a hard time qualifying as accredited co-partners (ACPs). Capital loan fund releases were also delayed and thus, delayed the projectimplementation. Inefficiency in the management of projects and activities were found amongWYOs because officers and members of the WYOs have insufficient technical know-how. Inthe regional implementation, the program suffered from lack of skilled manpower tocoordinate and monitor projects especially those in the rural areas. Moreover, the re-orientation of the Local Government Units (LGUs) with regards to the objectives of the WYC

25
program should be emphasized because some of the WYOs were being used in partisanpolitics.
The assessment of the program was done between 1990-1991. This involved 15projects 4 of which are association projects while 11 are individual projects benefiting some 25individuals (Bot 1991). Eight of these 25 revealed that the projects are their main source ofincome. The average monthly income increased by 14% or 374 with a base income of 2,730per month. Half a job was created per project on the average. No loan diversion was reported.The repayment is a high 89% (Table 13).
f) Promotion of Rural Employment Through Self-employment andEntrepreneurship Development (PRESEED)
Objectives. The program aims to promote self-employment among rural workers andtheir families who have entrepreneurial potential by providing them access to entrepreneurshiptraining, credit and technical assistance.
Beneficiaries. The program is targeted to assetless and landless rural workers whopossess entrepreneurial skills particularly the unemployed plantation workers, marginalfarmers, fishermen and home-based cottage industry workers.
Features. The program is composed of three major components namely, creditassistance, entrepreneurship development training, and consultancy services.
Under the program, credit assistance is facilitated through DILP accredited NGOswhich act as guarantor and conduit of the loan fund. In Phase I, the individual loan borrowersare granted a maximum loan amount of P25,000 while the organized rural workers are granted P100,000. Phase II which covers only individual borrowers, grants P15,000 as the loanceiling. The beneficiary equity is 10 percent of the total project cost. The DOLE charges a 6percent interest rate to ACP while the ACP charges 18 percent to beneficiary.
Performance and Lessons. An assessment of the program reveals that the guidelineswith respect to the credit requirements, selection of beneficiaries, penalty charges, and rate ofexecution should be reviewed. The requirements for credit and grant applications were foundto be rigid and unsuitable for SRA implementation which is supposed to cover the ultra poorand the marginalized sectors of the economy. The penalty charges for delinquent loans andthe rate of execution were found to be too high. In effect, the program failed to reach andassist most of it target beneficiaries.
The implementation of the livelihood projects suffered from delays in the release offunds and approval of project proposals. Other problems encountered in projectimplementation include: limited funds, lack of manpower to monitor the projects and collectloan repayments, and difficulty in getting accredited co-partners (ACPs) in poor communities. A number of project beneficiaries were also found to have diverted funds to purposes otherthan the livelihood activities lined up under the program.
An assessment of the project was done in 1990-1991 involving 14 beneficiaries. Of the9 projects were in trading, 2 in agribusiness and 1 in manufacturing (Bot 1991). The averageincrease in monthly income is 19 % (912 with a base monthly income of 4,723) (Table 13).

26
On the average, 0.4 jobs were created, of which, 0.3 are through self-employment. It wasreported that loan diversion run as high 50%, 19% for consumption purposes, 31% for otherproductive purposes that what was originally applied for. The average repayment rate is only33%. In one of the pilot regions, all the projects were terminated before the repayment periodwas over.
In 1995, the program contributed the most number of projects assisted (2,443) and thelargest credit funds released (23.6 million) among the DILP programs (Table 16).
5.3 DSWD’s Self-Employment Assistance Program (SEA)
The Self-Employment Assistance Program (SEA-Kaunlaran) is a nationwide programof the Department of Social Welfare and Development (DSWD) which provides an integratedpackage of social welfare services including capital, technical and marketing assistance toneedy family heads, disadvantaged women, out-of-school youth and persons with disability,whose income fall below the poverty threshold for their socio-economic rehabilitation.
Objectives. The program aims to enable socially disadvatanged individuals, families orgroups to become socially and economically productive.
Beneficiaries. The program beneficiaries are the unemployed or underemployed familyheads, disadvantaged women, out-of-school youth and persons with disability whose incomefall below the poverty threshold.
Features. The program aims to provide interest-free and collateral-free credit toincome generating projects of the beneficiaries. The capital assistance ranges from P1,000-P5,000 for individual projects, P10,000-P20,000 for organized groups and P50,000-P100,000for organized associations based on the requirements of the project.
On the basis of its target clientele, the program includes four major schemes namely:
a. SEA Kaunlaran for the Youth (SEA-K para sa Kabataan)
b. SEA Kaunlaran for the Disabled (SEA-K para sa may Kapansanan)
c. SEA Kaunlaran for the Disadvanatged Women (SEA-K Pangkababaihan)
d. SEA Kaunlaran for Family Heads/Other Needy Adults (SEA-K pang Pamilya)
To be eligible for financial assistance, the following requirements must be met: 1)income eligibility - total family income below poverty line; 2) physical eligibility - physically fit;age requirement 16 years old and above; residence requirements; 3) psychosocial eligibilityrequirements: with good moral character; positive family relationship; manifest positiverelationship among members of the community; demonstrate positive work habits andattitudes; committed to meet the obligation/agreement on written promise; willing to save; 4) completed Basic Business Management Training; 5) requirement specific to disadvantagedwomen projects: completed or willing to undergo sessions on the modular packages of theWomen’s Welfare Programs, i.e., Maternal and Child Care, Self-Enhancement, CommunityParticipation and Leadership Training.
Table 17 provides a summary of the key interventions in each sub-program.
27
For instance, the SEA Pangkababaihan (Grameen Bank Replication) extends initialloans to women borrowers amounting to P1,000 increasing gradually in succeedingborrowings. The borrowers must utilize the loan specifically for income generating projects, must make regular payment of amortization; must undergo required training and observeproject policies. Interest rate charged on the borrower depends on conduit but should not toexceed 20% per annum.
The SEA-Pangkababaihan also provides other assistance such as social preparation andcapability building, technical assistance, sessions on modular packages on maternal and childcare, self-enhancement, community participation and leadership skills development, and safetynets of social welfare services.
Performance and Lessons. This project has a long history. It has been in existencesince 1968.
The implementation of the program is an extension and manifestation of the DSWD’smandate of caring, protecting and rehabilitating the segment of the population which has theleast in life in terms of physical, mental, and social well-being and needs social and welfareassistance and social work intervention to restore normal function and participation in nationaldevelopment. The program is successful in reaching the poorest of the poor as 75 percent ofthe beneficiaries belong to the marginalized group. The beneficiaries were found to engage incrop production, livestock, fishing, food processing, trading, small-scale manufacturing,handicrafts and services. Most of the women beneficiaries have established sari-sari stores orare engaged in food vending. These were the most common activities because of they requireminimum skills and education. However, these activities contribute very little to value-addedand may prove to be unsustainable in times of economic changes. On of the bright spots of theprogram is that it appears to have succeeded in its roll-back scheme. The estimated loanrecovery rate is between 60-80 percent. This is high given that the clients are not obligated topay back. This only indicates that the social preparation aspect of the program is working(CAPS 1993).
The evaluation conducted covering the period 1988-1991 found 62,157 new projectsbenefiting some 843,365 old and new beneficiaries. It was able to release 104.18 million in1991 (no releases was done between 1981-1989. This represented only 52.8% of the allottedfor practical skills development, 46% of the allotment for basic business management seminar,and 78.9% of the fund for capital assistance or an average of 65% utilization.

28
5.4 DTI’s Tulong SaTao - NGO MicrocreditProgram (NGO-MCP)
The Tulong sa TaoProgram was establishedin 1987 through ExecutiveOrder No. 158. Theprogram is a majorgovernment response tothe apparent lack offinancial support to thenon-agricultural sector. The program recognizesthat Non-GovernmentalOrganizations (NGOs) areeffective intermediaries forcredit, skills, andorganizational assistanceto low income groups inthe rural areas, and thus,pioneered in the use ofNGOs as credit inter-mediaries to meet theneeds of micro-entrepreneurs.
Objectives. TheNGO-MCP is designed toaddress the credit needs ofexisting and potentialmicro entrepreneursthrough the extensive useof NGOs as conduits forlending and technicalassistance. The programaims to increaseemployment, assist in thestrengthening of self-helpgroups, encourage savingsmobilization, strengthenNGOs and increase theproduction of goods andservices by the low-income groups.
Beneficiaries. The primary beneficiaries of the program are the micro entrepreneurs.
Table 17Financial Assistance Provided by Programs of DSWD
ACTIVITY GRANTCEILING
Capital assistance to Associations, e.g.,SEA-K Pang pamilya; SEA-KPangkababaihan, etc.)- a community-based credit associationmanaged by the members themselves
P100,000.00
Tindahang Bigay-Buhay (TBB)- provision of working capital to retailstores for purchase of prime commoditiesto be sold to poor families at discountedprices
P20,000.00
Productivity Skills Capability Buildingfor Disadvanatged Women (PSCBDW) - provision of skills training todisadvantaged women (along the areas ofsewing craft, toy craft, ceramics/pottery,rattan craft, food processing andpreservation) and enable them to gainemployment either through self or open-employment, sub-contract jobs orsheltered workshop.
1. Individual Projects: incomegenerating projects operated/managed byindividual women utilizing the acquiredskills at the PSCB Center
P1,000-P5,000
2. Supervised NeighborhoodProduction Group (SNPG) - anorganized production activity involving 5-25 women producing one or moreproduct lines in one’s own home on asub-contractual or non-contractual work
P10,000-P20,000
3. Community Production center - acommunity-based production activity of10-30 women, producing similar productlines with a stable market outlet either insub-contract or non-subcontractual jobs
P50,000-P100,000
29
The Tulong sa Tao - NGO MCP II has two major components: the NGO-MicrocreditProject II, and the Credit Program to the Poorest of the Poor (CPPP).
(a) NGO-Micro-Credit Program
Features. The NGO-Microcredit Project II was implemented throughout the countryin 1992. The program aims to provide credit to micro entrepreneurs, create employment andenhance income in the rural areas, and develop and strengthen NGO capabilities for theimplementation of livelihood projects. The program beneficiaries are micro-entrepreneurs andself-help groups engaged in micro-business. The NGO-MCP II Program consists of three sub-components, namely: (1) credit for NGOs for onlending to beneficiaries for microenterprisesand livelihood projects; (2) NGO strengthening through systematic assessment of needs,provision of training in livelihood project management, market development and other relatedactivities; and (3) beneficiaries/self-help groups strengthening through assistance in theidentification of viable micro-enterprises, entrepreneurship development and marketdevelopment.
The NGOs as conduits of loans re-lend to individual micro-entrepreneurs engaged ineither manufacturing, agro-processing, trade, transport and service business; and to self-helpgroups engaged in a manufacturing, agro-processing, trade, transport and service business. Maximum amount of loan extended to NGOs is P2,000,000 at 12 percent per annum interestrate payable up to 5 years inclusive of grace period. Micro-enterpreneurs and self-help groupscan avail of the maximum initial loan amount of P25,000 and P200,000, respectively, atinterest rate not exceeding commercial bank rates prevailing in the area.
Performance and Lessons. As of June 1996, a total of P989.597 million loan hasbeen released to 1,458 NGOs nationwide. The project has assisted in the country’s povertyalleviation efforts through the provision of credit facilities to 79,713 microentrepreneurs withno access to formal credit and creation of 147,579 jobs. The cost per job is P4,479 andsavings mobilization generated is estimated at P20 million. About 75 percent of the sub-borrowers are women and most of the microenterprises are managed and operated by women.
For the year 1995, approved loans under NGO-MCP II amounted to P357.346 millionregistering a 53 percent increase from the P233.20 million approved for the year 1994. Regions II and III accounted for large shares in total loans approved with 18.4 percent and15.8 percent shares, respectively. As of 1995, total loans released under the projectamounted to P804.536 million which is 96 percent of the total project cost of P839.21 million.
Three hundred sixteen (316) new NGOs were accredited as co-implementors of theproject and were granted loans. This increased the total number of NGO conduits to 1,233. Region V has the most number of NGOs at 159, followed by Regions III and IV. Sixty-sixand a half percent (66.5 percent) of the NGOs are cooperatives, 13.5 percent are associations,10 percent are foundations and 3.5 percent are church/school-based organizations. Theproject provided credit facilities to 18,754 microentrepreneurs with no access to formal credit(Table 18).
Sixty-three percent (63 percent) of the microentrepreneurs assisted are engaged inmanufacturing and agro-processing activities, 22 percent are in trading and 15 percent inservice-oriented projects. Female sub-borrowers accounted for the largest share to total

30
borrowers (64 percent) while the male sub-borrowers accounted for 34 percent of total. Theremaining 2 percent is accounted for by self-help groups.
The project has contributed to the country’s poverty alleviation efforts through theprovision of credit facilities to non-bankable microentrepreneurs and the creation of jobs. In1995, a total of 42,187 jobs was created nationwide. Total employment generated under theproject reached 107,036. The cost per job created averages at P7,500 which is within theproject’s target range of P5,000 to P10,000.
(b) Credit Program for the Poorest of the Poor
Features. The Credit Program for the Poorest of the Poor (CPPP) component is beingimplemented in 25 priority provinces identified by the Presidential Commission to FightPoverty and the Presidential Council for Countryside Development. This special lendingprogram was initiated with the realization that there is an existing gap in terms of providingcredit assistance to the most disadvantaged or marginalized sectors of the society. Theprogram aims to provide credit to the poorest of the poor, create employment and enhanceincome in the rural areas, develop and strengthen NGO and self-help group capabilities for theimplementation of livelihood projects, and encourage savings mobilization among low-incomegroups. Under CPPP, loans are extended to small self-help groups belonging to the pooresthouseholds with income within the lowest 75 percent of the poverty line.
The CPPP includes the following sub-components: 1) credit for NGOs for on-lendingto group beneficiaries for microenterprises and livelihood projects belonging to the poorestgroup of all household defined by the government, and 2) NGO and beneficiary self-helpgroups strengthening through systematic assessment of needs, provision of training inlivelihood project management, market development and other related activities. The CPPP isbeing implemented in the following provinces: Abra, Agudan del Sur, Antique, Aurora,Basilan, Benguet, Batanes, Biliran, Eastern Samar, Guimaras, Ifugao, Kalinga-Apayao,Masbate, Mt. Province, Romblon, Southern Leyte, Sulu, Surigao del Sur, Tawi-Tawi, Leyte,Capiz, Negros Oriental, North Cotabato, Zamboanga del Sur, and Maguindanao.
The sub-borrowers should belong to the poorest households with income within thebottom 75 percent of the poverty line as defined by the government. Under the program, loans are granted on a group basis involving 4 to 10 individuals who will be jointly
Table 18Micro-Enterprises Assisted and Employment Generated
YearNo. of Micro-Enterprises Assisted
No of EmploymentGenerated
1992 2,946 6,9971993 8,470 20,1171994 15,888 37,7351995 18,754 42,187

31
responsible for repayment of the loan. A maximum initial loan amount of P40,000 are grantedto a group of 4-10 individuals with interest rate, capital build-up and other charges not exceeding 15 percent per annum.
Performance and Lessons. A total of 106 NGO conduits assisted DTI inimplementing the program, 62 of which have been tapped in 1995 (Table 19). About 631microenterprises, managed by self-help groups, was assisted by the program in 1995. Thetotal microenterprises assisted had reached 1,133, registering a 125.7 percent increase fromthe 1994’s coverage.
The assistance to microenterprises created a total of 4,479 jobs for poor households inthe countryside with 2,491 persons provided with jobs in 1995 alone. As of June 1996, theprogram was able to assist 1,349 group-based microenterprises and created 5,372 jobsthrough small loans totaling to P53.987 million.
5.5 Community Mortgage Program
Objectives. The Community Mortgage Program (CMP) is a financing program of theNational Home Mortgage Finance Corporation which provides assistance to organizedcommunity associations of poor and homeless individuals to purchase and develop a piece ofland under the concept of community mortgage. The program aims to assist the residents ofblighted or depressed areas such that they can own the lots they occupy, or the lots on areaswhere they choose to relocate, and eventually improve their homes and neighborhood to theextent of their affordability. It aims to increase the accessibility of home ownership and toimprove the security of tenure and the living conditions of the poor.
Beneficiaries. Poor families particularly the residents of blighted or depressed areasand/or the urban poor; relocatees of depressed or blighted areas who are members ofcommunity associations, cooperatives or condominium corporations with legal personalityduly registered with the HIGC or the Cooperative Development Authority (CDA).
Features. The CMP was launched in 1988 as a sub-program of the Unified HousingLoan Program (UHLP). The program utilizes an innovative financing scheme involving athree-phased approach which addresses the problem of ensuring security of land tenure for thelandless poor through the concept of community mortgage. The first stage involves theacquisition of land by the community associations through the financial assistance of theNational Home Mortgage Finance Corporation (NHMFC). These whole plots of privately andpublicly held lands are subdivided among qualified beneficiaries who are members of thecommunity organization. The second stage involves the provision of financing for housingdevelopment and the individual titling of the land among qualified beneficiaries. The thirdstage involves provision of financing for house construction or home improvement amongqualified beneficiaries. The CMP operates on the principle of self-help. The communityassociations has the responsibility of collecting the monthly amortization of their members. The community associations are also responsible for individualizing the title of the land andassigning the loans to its members.
The loan packages under this program are: P30,000 for undeveloped lot, P45,000 fordeveloped lot, P80,000 for lot acquisition, development and house construction and

32
improvement. For lots located within Metro Manila, the loanable amount is P60,000 fordeveloped or undeveloped lots. All loan packages are payable in equal monthly amortizationwith maturity of 25 years at 6 percent interest rate.
Performance and Lessons: The total fund requirements for the CMP under theComprehensive and Integrated Shelter Finance Act (CISFA) of 1994 amounted to P12.78billion annually for five years starting 1994. The budget appropriations for the programamounted to P272.6 million, P700 million and P100 million for 1994, 1995 and 1996,respectively. However, the funds released were much lower and only amounted to P190million and P45 million for 1994-95 and 1996, respectively. This indicates that of the P1.072billion funds allocated to the program for the period 1994-1996, only P425 million or 39.6percent was released.

33
Table 19Credit Program for Poorest of the Poor
For the Calendar Year 1995
Province Loan Approvals(in M Pesos)
Loan Releases* No. of NGOs
Benguet - 500,000 1
Ifugao - 1,455,000 2
Kalinga Apayao - 500,000 1
Mountain Province - 620,000 5
Abra 700,000 2,700,00 4
Batanes 500,000 500,000 1
Masbate 2,650,000 3,100,000 14
Romblon 3,560,000 - -
Antique - 1,560,000 1
Guimaras 150,000 150,000 1
Capiz 1,020,000 1,020,000 4
Negros Oriental 1,320,000 1,320,000 1
Biliran - - -
Southern Leyte 2,000,000 2,000,000 3
Leyte 1,986,000 2,136,000 3
Basilan 1,000,000 1,500,000 2
Surigao del Sur 1,660,000 3,100,000 16
North Cotabato 3,000,000 3,000,000 2
Tawi-Tawi 56,000 56,000 1
TOTAL 20,010,000 25,217,000 62
*This includes applications approved in 1994.
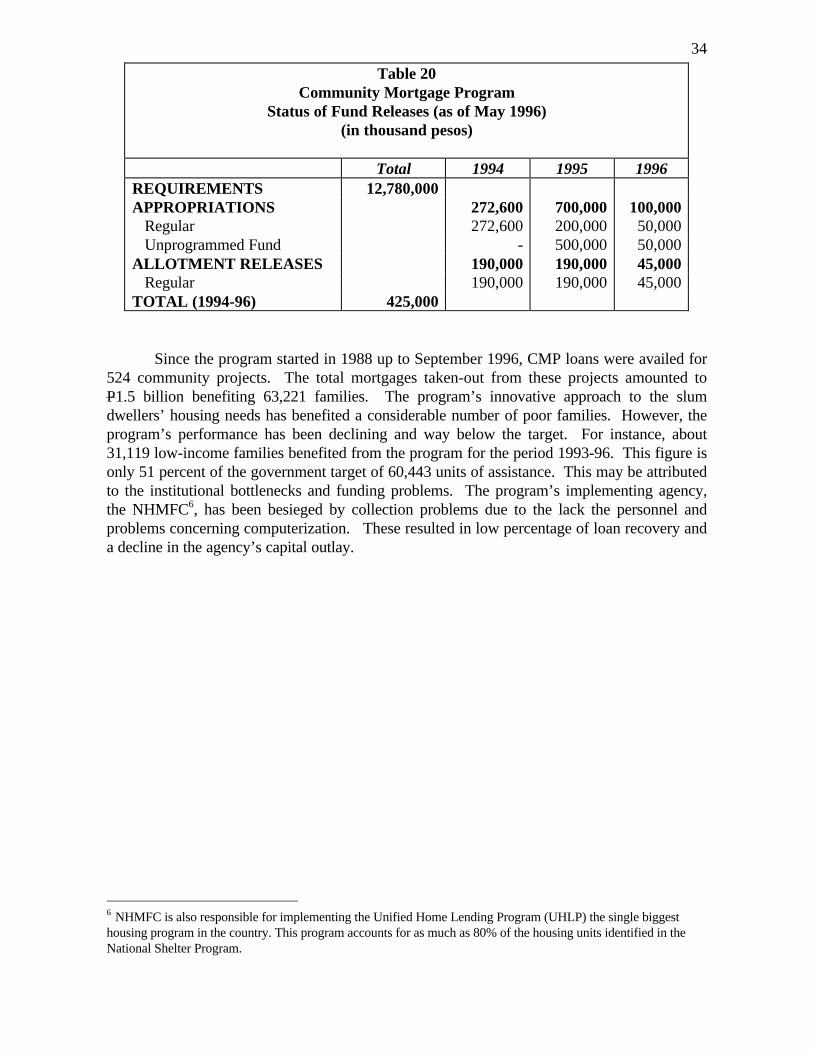
34
Since the program started in 1988 up to September 1996, CMP loans were availed for524 community projects. The total mortgages taken-out from these projects amounted toP1.5 billion benefiting 63,221 families. The program’s innovative approach to the slumdwellers’ housing needs has benefited a considerable number of poor families. However, theprogram’s performance has been declining and way below the target. For instance, about31,119 low-income families benefited from the program for the period 1993-96. This figure isonly 51 percent of the government target of 60,443 units of assistance. This may be attributedto the institutional bottlenecks and funding problems. The program’s implementing agency,the NHMFC6, has been besieged by collection problems due to the lack the personnel andproblems concerning computerization. These resulted in low percentage of loan recovery anda decline in the agency’s capital outlay.
6 NHMFC is also responsible for implementing the Unified Home Lending Program (UHLP) the single biggesthousing program in the country. This program accounts for as much as 80% of the housing units identified in theNational Shelter Program.
Table 20Community Mortgage Program
Status of Fund Releases (as of May 1996)(in thousand pesos)
Total 1994 1995 1996REQUIREMENTS 12,780,000APPROPRIATIONS 272,600 700,000 100,000 Regular 272,600 200,000 50,000 Unprogrammed Fund - 500,000 50,000ALLOTMENT RELEASES 190,000 190,000 45,000 Regular 190,000 190,000 45,000TOTAL (1994-96) 425,000

35
5.6 Lalakas Ang Katawang Sapat Sa Sustansya (LAKASS) Program
Objectives. The LAKASS Program is an action-oriented and community-based nutritionstrategy of the Philippine Food and Nutrition Program (PFNP) being coordinated by the NationalNutrition Council (NNC). The program aims to improve the nutrition situation in identifiednutritionally depressed municipalities (NDMs) and provide effective and sustainable services forand by the community to improve the nutritional status of its population. The program addressesthe dual problem of poverty and malnutrition. It combines livelihood opportunities with direct andindirect nutrition services. It also provides an opportunity for community members to plan andmanage their own nutrition action plan.
Beneficiaries. The most nutritionally depressed barangays in unserved or underservedmunicipalities are prioritized for delivery of basic nutrition and related services. The prioritybeneficiaries are families who are most affected and at-risk to malnutrition found within thenutritionally depressed barangays (these families belong to the bottom 30 percent of the incomeladder). Specifically, the target beneficiaries include infants, preschool children, school-agedchildren and pregnant and lactating women who are more at risk to malnutrition. The risks arehigher among the poor, which include families or households of small fisherfolks, "slash and burn"farmers, share-tenants farming coconut lands, hired laborers of food crop farmers, hired laborers ofthe fishing industry, the unemployed especially in the urban areas, large-sized families with lowincomes and families with lowly-educated mothers.
Table 21Community Mortgage Program PerformanceNumber of Household Beneficiaries by Region
Region 1993 1994 1995 1993-95
TOTAL 10,139 11,690 9,290 31,119NCR 3,847 4,378 4,196 12,421Region 1 0 88 0 88Region 2 59 0 0 59Region 3 2,101 1,787 447 4,335Region 4 1,278 2,123 1,531 4,932Region 5 246 0 0 246Region 6 232 447 819 1,498Region 7 537 196 411 1,144Region 8 73 200 103 376Region 9 578 166 916 1,660Region 10 160 666 344 1,170Region 11 686 1,575 430 2,691Region 12 342 64 93 499CAR 0 0 0 0ARMM 0 0 0 0

36
Features. The "Lalakas ang Katawang Sapat sa Sustansiya" Program (LAKASS) waslaunched in 1989 as a strategy to alleviate poverty and malnutrition in the most depressed areas ofthe country. The program combines the delivery of direct nutrition services with effectivesustainable development projects that will enhance their nutritional benefits. The LAKASSprogram delivers various nutrition and health related projects that include: food assistance,incremental food production, nutrition-related health services and income generating projects(IGP).
The program delivers the basic nutrition and related services to the most nutritionallydepressed barangays in a municipality. The nutritionally depressed municipalities (NDMs) areidentified on the basis of high prevalence of malnutrition and low level of municipal income. Information on malnutrition and income levels are obtained from the results of the annual weightsurvey of preschoolers (Operation Timbang) and audited municipal revenues from the Commissionon Audit. The priority beneficiaries are families who are most affected and at-risk to malnutrition. The programs and projects are identified, implemented and managed by the community itself withnational government agencies and nongovernment agencies extending technical, financial andmaterial assistance. Programs and projects are identified to prevent or cure malnutrition, andpromote good nutrition. Communities are mobilized and empowered to build and sustain theircapabilities to improve their nutritional situation. A requisite to the availment of LAKASS funds isthe preparation of nutrition action plans by the communities. At the barangay level, the BarangayNutrition Action Program (BNAP) is formulated after identifying and describing the nutritionalproblems in the community and assessing the resources available to address the problem. Based onthe BNAP, specific projects and beneficiaries are identified for LAKASS. Community organizationand mobilization follows where the Barangay Nutrition Council organizes and mobilizes thecommunity to participate in the LAKASS program. Community involvement in project planning isvital to sustain the momentum and interest in LAKASS. Thus, consultations with familybeneficiaries are conducted to determine the possible projects that can be funded under theLAKASS program.
Each municipality was provided an average of P200,000 to finance nutrition actionprograms. This amount supplements available resources from government agencies,nongovernment organizations, the local government, and the community. Up to 80 percent ofLAKASS funds can be used for projects and activities which address the immediate and underlyingcauses of malnutrition. These include:
1. Incremental Food Productiona. Family food production using the bio-intensive gardening (BIG) approachb. Small animal dispersalc. Food preservation and processing
2. Construction of water-sealed toilets and potable drinking water systems3. Development or purchase of nutrition education materials4. Small-scale income-generating activities like small animal dispersal and food
vending
A small portion, 20 percent or less, is set aside to provide direct nutrition services to thecommunity. These services include:

37
1. vitamin and mineral supplementation, especially of vitamin A, iron or iodine topreschool children, pregnant and lactating mothers, respectively;
2. supplemental feeding activities, including purchase of locally-produced foodcommodities or purchase of small equipment such as hand grinders; and
3. repair of nutrition rehabilitation units.
Performance and Lessons. The program was launched in 1989 and has followed twoexpansion programs. Initially implemented nationwide in 115 nutritionally depressed municiplaities(NDMs), the program expanded to 181 NDMs as of February 1996. Under the current secondexpansion program, 90 more municipalities are envisioned to be covered between 1996 and 1998.The program brought about an increase in family income and an improvement in the nutritionalstatus of children beneficiaries and households. In 1994 for instance, the prevalence ofunderweight-for-age, stunting, and wasting declined by 16 percent, 21 percent and 16 percent,respectively. The annual family income of beneficiaries were found to increase by 3 percent. Aside from these benefits, the LAKASS Program has brought about other benefits to thehousehold beneficiaries. Among these are: a) increased awareness and consciousness on theimportance of proper nutrition and good environmental sanitation; b) improved hygienic practices;c) acquisition of management skills and expertise among implementors and beneficiaries; d)improved perception of government in terms of capability to deliver basic services; and e) improvedquantity and quality of food consumption.
The strength of the program lies in being highly focused and grounded on pressingnutrition problems and needs of communities and households. In addition, while it is a nationalinitiative, it harnessed the capability of LGUs to select, plan for and implement the projectsthemselves. Finally, because of good targeting the income generating and food productionprojects became a mechanism for empowerment of the very poor in the selected areas.
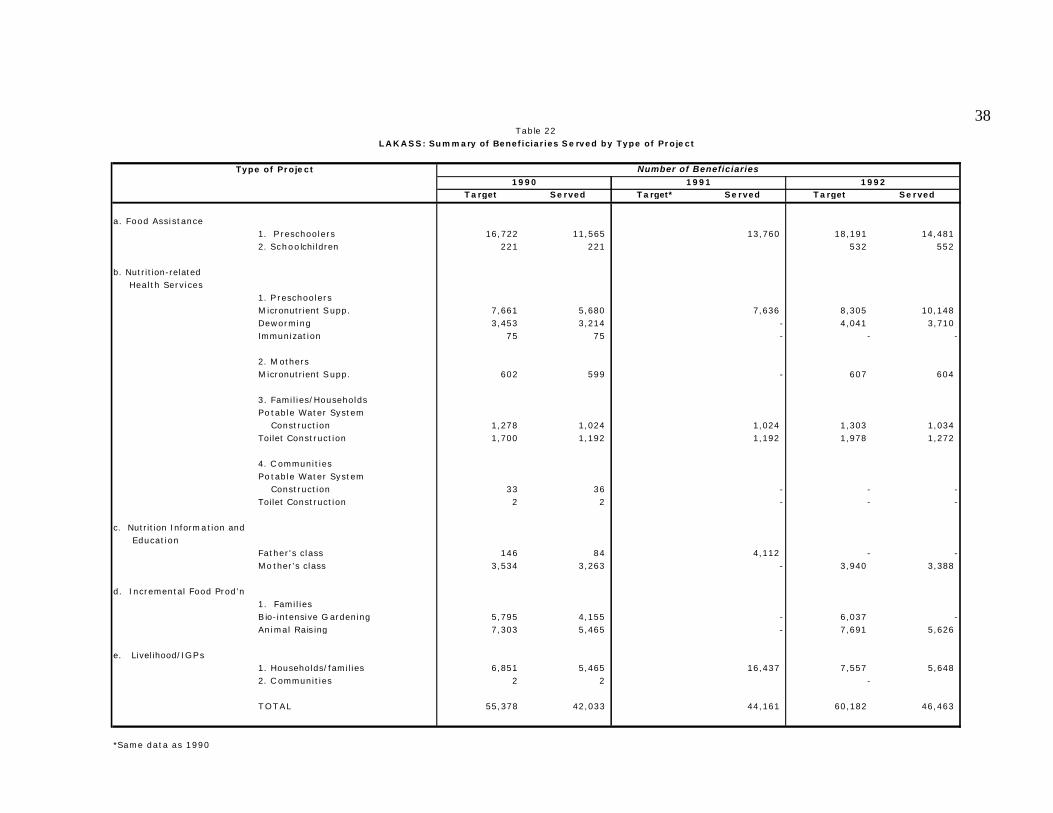
38Tab le 22
L A K A S S : Summary of Beneficiaries S e rved by Type of Proje c t
Type of Proje c t Number of Beneficiaries
1990 1991 1992T a rget S e rved T a rget* S e rved T a rget S e rved
a . Food Ass i s t ance1. P reschoo le rs 16 ,722 11,565 13,760 18,191 14,4812. S c h o o lchi ldren 221 221 532 552
b. Nutrit ion-related Hea l th Serv i ces
1. P reschoo le rsM icronutrient S upp. 7,661 5,680 7,636 8,305 10,148Deworming 3,453 3,214 - 4,041 3,710Immunizat ion 75 75 - - -
2. M othersM icronutrient S upp. 602 599 - 607 604
3. Fami l ies/Househo ldsP o tab le Wate r Sys tem Const ruct ion 1,278 1,024 1,024 1,303 1,034Toilet Const ruct ion 1,700 1,192 1,192 1,978 1,272
4. C ommuni t iesP o tab le Wate r Sys tem Const ruct ion 33 36 - - -Toilet Const ruct ion 2 2 - - -
c. Nutrit ion Inform a tion and Educat ion
Father ' s c lass 146 84 4,112 - -M o ther 's c lass 3,534 3,263 - 3,940 3,388
d. Incrementa l Food Prod 'n1. Fami l iesB io- intensive G ardening 5,795 4,155 - 6,037 -An ima l Ra is ing 7,303 5,465 - 7,691 5,626
e. Livel ihood/IG P s1. Households/fami l ies 6,851 5,465 16,437 7,557 5,6482. C ommuni t ies 2 2 -
T O T A L 55,378 42,033 44,161 60,182 46,463
*Same da t a a s 1990

6. Summary and Conclusion
The micro interventions discussed in this paper are understandably varied. However,these can be categorized into five, namely: (1) wage employment (CEDP); (2) pure trainingfor entrepreneurial development (TREND); (3) developing community training capabilities(CTUs, TDIS); (4) livelihood cum training programs; and (5) social services deliveryprograms. The target beneficiaries can be classified as follows: (1) unemployed /underemployed; (2) out-of-school youth; (3) community development workers; (4) displacedOCWs; (5) trade union members; (6) women workers; (7) landless rural workers; (8)disadvantaged family heads, women, out-of-youth, disabled persons; (9) micro entrepreneurs;(9) residents in blighted urban areas; and (10) residents in nutritionally depressed areas. Theprograms addressed both transient and chronic poverty. Despite the diversity of the programsand target clientele, there are several principles that can be learned.
First, interventions that directly address specific needs and those that are designed tobe temporary interventions are always easier to administer compared to those that requiresocial preparation to ensure sustainability of a program. The success of the CEDP can beattributed to the relative simplicity of wage employment creation compared to implementing alivelihood program. The former consists of creating jobs in a well-defined set of activities. Theother requires harnessing what one hopes as latent entrepreneurial abilities. It is also relativelyeasy to implement a pure training program or developing capability for training compared toimplementing a livelihood program. This is also true for the social services delivery programs.The direct nutrition intervention of LAKASS is easier to administer than the more indirect butpotentially sustainable food production or livelihood component. In the case of the CMP, thesocial preparation for joint liability to work is also much more difficult. These imply that theevaluation of the efficiency and effectiveness of micro-interventions need to consider thesedifferences.
Second, social preparation for disadvantaged groups takes a considerable amount oftime and resources and many projects fails to provide the necessary resources for thiscomponent. One of the recurring themes of the assessments is the considerable underutilization of the budgeted funds for livelihood programs and joint liability programs. The oft-mentioned reason is the lack of personnel complement for the project. What was not wellemphasized (or maybe recognized) is that it takes a lot of time to do social preparation fordisadvantaged beneficiaries. Allowing for ample time to do social preparation is oftenoverlooked in the design of many poverty alleviation programs. It is also often difficult to getgrant funds to finance the social preparation part of the package if it exists. As the PCFPframework conveys, the lower you go in the income ladder the more the intervention be of thesocial services type rather than livelihood projects. Forcing livelihood programs among theultra poor usually results in fund diversion such as those found in the evaluation PRESEED ascompared to say REPROEM the predecessor of ELDP. The higher quality of the REPROEMbeneficiaries was also cited by the evaluation study as the thing that made the difference inperformance of the programs. REPROEM and ELDP is designed for transient poverty such asthose of displaced OCW-returnees. Transient poverty is easier to deal with because itpresumes temporarily displaced but erstwhile economically active beneficiaries. Among thesocial services delivery programs, the relative success of LAKASS lies primarily in the grant

40nature of the assistance while in CMP collection problems slowed down the program. Thisexplains the under utilization of the programmed funds in CMP.
Third, government line agencies must realize that in trying to implement credit-livelihood program themselves they are expecting bureaucrats, who are not trained (or did notprefer) to be development workers, to behave as development workers. In addition, agenciesdo not have the built-in capacity for loan appraisal and repayment collection. This role is oftenfilled-in by NGOs and other similar intermediaries who have the advantage of proximity to theclient and development orientation. However, it is not easy to find reliable intermediaries.Collusion between intermediaries and final beneficiaries are common. The CAPS (1993) studyeven pointed out that most NGOs were just organized to fill the project requirements anddisappeared after the funds run out. A recent assessment of microfinance institutions gives aneven more pessimistic view of the capacity of NGOs to act as financial intermediaries servingthe poor unless major reform in their legal personality, financial intermediation approach andoperational procedures are done (Llanto, Garcia and Callanta (1996)).
Fourth, since funds are limited focus and effective targeting is necessary. Governmentcannot pretend to have the all the funds to finance livelihood programs. Thus, the morefocused livelihood programs are, the more implementable and sustainable they become.Lamberte (1990) raised the merits of a guarantee program compared to a credit programbecause of the leveraging aspect of the former. It must be appreciated, however, thatguarantee does not extinguish the credit liability of the beneficiary. This characteristic makesthe program, which maybe appropriate for small and medium enterprises, inappropriate for thechronic poor. Insurance or outright grant will be better alternatives. Roll-over scheme such asthe one being implemented in the DSWD’s SEA program is good alternative. But again thisrequires adequate investment in social preparation and a very transparent roll-over strategy.
Fifth, there appears to be a lack of market orientation of the livelihood projects that areimplemented. Many livelihood program fail because of lack of market for the products. Marketstudy is often a necessary ingredient for a successful livelihood program. Since this requiresspecialized skills that cannot be replicated overnight, it may be advisable to include thiscomponent as part of the intervention. It’s one thing to be able to produce products for saleand another thing to find a market that will pay for the products remuneratively. Businessesusually start with producing what the market requires. This is often a forgotten dictum notonly in livelihood programs but also in training programs.
Sixth, there is a need to assess the relative readiness of potential clients for theinterventions being introduced. It is not enough to know that the beneficiaries in the listdeserve the assistance. It is important to assess the relative readiness of each for, say,livelihood programs. Obviously, it is easier to assists practicing entrepreneurs such as thebeneficiaries of TST-NGO-MCP compared to an unemployed out-of-school youth in terms ofimplementing livelihood projects. Using unions as the NGO-analogue in development worksuch as those in the WE program, may require a lot of re-orientation for both union leadersand members.

41Finally, there is a need to do serious and regular evaluation analyses of poverty
alleviation programs and to learn from the flaws of predecessor programs. The NMYCevaluation of the predecessor of TREND already recommended that the entrepreneurshiptraining be integrated with a livelihood component. Yet the design of the TREND is stillbasically a pure training intervention. It was not clear how much coordination between DILPprojects is happening since this the natural route through which integration of TRENDbeneficiaries to livelihood programs can be effected. The results of program evaluation shouldbe taken seriously in the design of successor programs.

42References
Asian Development Bank (n.d.) Escaping the Poverty Trap.
Balisacan, A. (1995). “Anatomy of Poverty During Adjustment: The Case of the Philippines,”Economic Development and Cultural Change. 44(1): 33-62.
Balisacan, A. (1994). “Urban Poverty in the Philippines: Nature, Causes and PolicyMeasures,” Asian Development Review, 12(1): 117-152.
Balisacan, A. (1993). “Agricultural Growth and Rural Performance: A PhilippinesPerspective,” Journal of Philippine Development, 20(2):289-317.
Bautista, R., J. Power and Associates (1979). Industrial Promotion Policies in the Philippines.Philippine Institute for Development Studies.
Bot, K. (1991). “Evaluation of the DOLE Integrated Livelihood Program,” DOLE , Manilaand International Labor Organization Asian Employment Program (ARTEP)
Bot, K. (1994). “An Assessment of Three Livelihood Programs,” DOLE, Manila andInternational Labor Organization Asian Employment Program (ARTEP)
Center of Advanced Philippine Studies (CAPS) (1993). Impact Assessment of the NationalLivelihood Program.
Cororaton, C., B. Endriga, D. Ornedo, and C. Chua (1995). Estimation of Total FactorProductivity of Philippine Manufacturing Industries: The Estimates. PIDS DiscussionPaper Series No. 95-32.
De Dios, N. and Associates (1993). Poverty, Growth and the Fiscal Crisis. PIDS and IDRC.
Demery, L. and T. Addison (1987). The Alleviation of Poverty Under Structural Adjustment.
Hooley, R. (1985). Productivity Growth in Philippine Manufacturing Retrospect and FutureProspects,” PIDS Monograph Series No. 9.
International Labor Organization (1974). Sharing in Development: A Programme ofEmployment, Equity and Growth for the Philippines.
Lamberte, M. (1990). The Impact of Special Credit and Guarantee Programmes for SMEs onEmployment and Productivity. DOLE, Manile and International Labor OrganizationAsian Employment Program (ARTEP).
Llanto, G., E. Garcia and R. Callanta (1996). “An Assessment of the Capacity and Financial Performance of Microfinance Institutions: The Philippine Case,” PIDS DiscussionPaper Series No. 96-12.
Manasan, R., G. Llanto, and W. Nuqui (1994). Financing Social Programs in the Philippines:Public Policy and Budget Restructuring.
Medalla, E. (1990). “Assessment of Trade and Industrial Policy, 1986-1988,” PIDS WorkingPaper Series No. 90-07.
Medalla, E., G. Tecson, R. Bautista, J. Power and Associates (1995). Catching Up withAsia’s Tigers. Philippine Institute for Development Studies.

43National Statistics Office (1995). 1994 Family Income and Expenditure Survey: Preliminary
Results. Processed.
Orbeta, A. and T. Sanchez (1995). “The Philippines in the Regional Division of Labor,” Paperpresented at a meeting on Regionalization and Labor Market Interdependence in Eastand South-East Asia, Bangkok, Thailand, 23-26 January 1995.
Presidential Commission to Fight Poverty (1994). A Strategy to Fight Poverty. Processed.
Sanchez, A. (1983). Philippine Capital Stock Measurement and Total Factor ProductivityAnalysis, Ph.D. Dissertation, UP Manila.
SRA Secretariat (1994). Basic Reference Documents for the Social Reform Summit.Processed.
Stewart, F. ed. (1983). Work, Income and Inequality: Payments Systems in the Third World.London: Macmillan.
Tendulkar, S. 1992. “Economic Growth and Poverty.” In B. Harriss, S. Guhan, and R. H.Cassen, eds. Poverty in India. Bombay: Oxford University Press.
Worldbank (1988). The Philippines: The Challenge of Poverty.
World Bank (1996). A Strategy to Fight Poverty: Philippines.
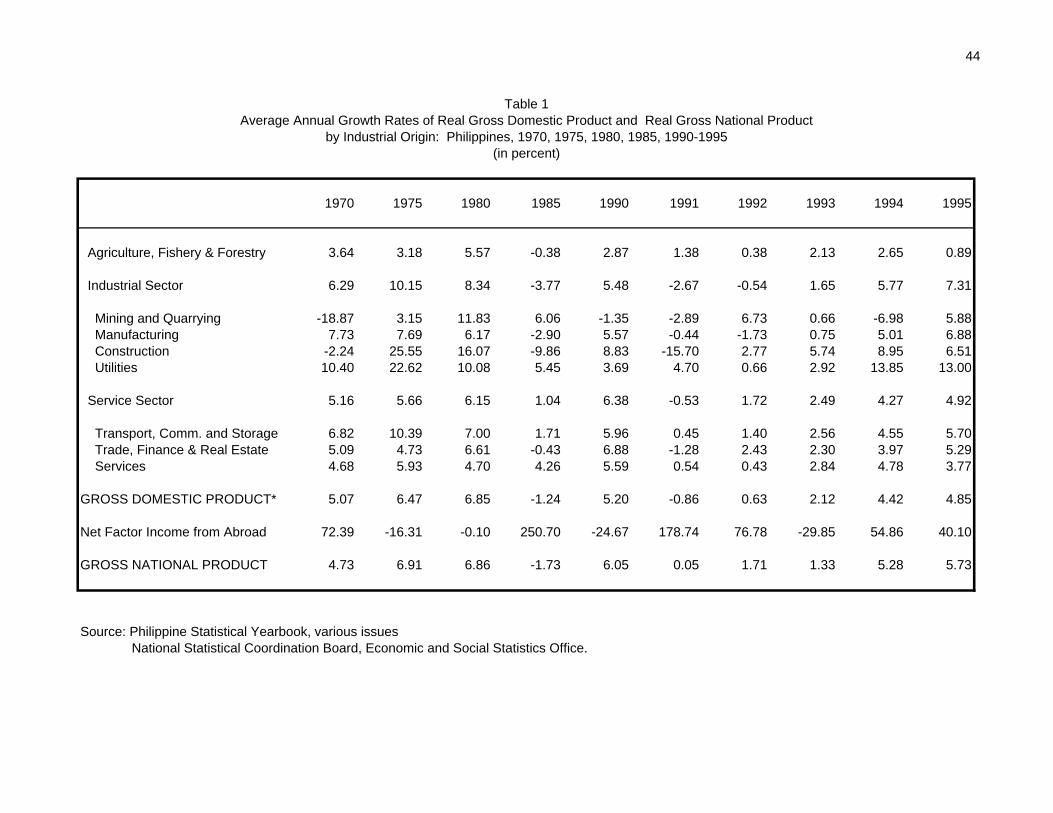
44
1970 1975 1980 1985 1990 1991 1992 1993 1994 1995
Agriculture, Fishery & Forestry 3.64 3.18 5.57 -0.38 2.87 1.38 0.38 2.13 2.65 0.89
Industrial Sector 6.29 10.15 8.34 -3.77 5.48 -2.67 -0.54 1.65 5.77 7.31
Mining and Quarrying -18.87 3.15 11.83 6.06 -1.35 -2.89 6.73 0.66 -6.98 5.88 Manufacturing 7.73 7.69 6.17 -2.90 5.57 -0.44 -1.73 0.75 5.01 6.88 Construction -2.24 25.55 16.07 -9.86 8.83 -15.70 2.77 5.74 8.95 6.51 Utilities 10.40 22.62 10.08 5.45 3.69 4.70 0.66 2.92 13.85 13.00
Service Sector 5.16 5.66 6.15 1.04 6.38 -0.53 1.72 2.49 4.27 4.92
Transport, Comm. and Storage 6.82 10.39 7.00 1.71 5.96 0.45 1.40 2.56 4.55 5.70 Trade, Finance & Real Estate 5.09 4.73 6.61 -0.43 6.88 -1.28 2.43 2.30 3.97 5.29 Services 4.68 5.93 4.70 4.26 5.59 0.54 0.43 2.84 4.78 3.77
GROSS DOMESTIC PRODUCT* 5.07 6.47 6.85 -1.24 5.20 -0.86 0.63 2.12 4.42 4.85
Net Factor Income from Abroad 72.39 -16.31 -0.10 250.70 -24.67 178.74 76.78 -29.85 54.86 40.10
GROSS NATIONAL PRODUCT 4.73 6.91 6.86 -1.73 6.05 0.05 1.71 1.33 5.28 5.73
Source: Philippine Statistical Yearbook, various issues National Statistical Coordination Board, Economic and Social Statistics Office.
Table 1Average Annual Growth Rates of Real Gross Domestic Product and Real Gross National Product
by Industrial Origin: Philippines, 1970, 1975, 1980, 1985, 1990-1995(in percent)

45
1970 1975 1980 1985 1990 1991 1992 1993 1994 1995
Agriculture, Fishery & Forestry 28.18 24.68 23.50 24.58 22.30 22.81 22.75 22.75 22.37 21.52
Industrial Sector 33.70 38.38 40.52 35.07 35.46 34.81 34.41 34.25 34.70 35.51
Mining and Quarrying 1.44 1.26 1.50 2.08 1.54 1.51 1.60 1.58 1.40 1.42 Manufacturing 27.07 28.32 27.60 25.15 25.52 25.63 25.03 24.69 24.83 25.32 Construction 4.06 6.99 9.39 5.08 5.81 4.94 5.04 5.22 5.45 5.54 Electricity, Gas and Water 1.13 1.81 2.03 2.76 2.59 2.74 2.74 2.76 3.01 3.24
Service Sector 38.12 36.94 35.98 40.35 42.24 42.38 42.84 42.99 42.94 42.96
Transport, Comm. and Storage 4.14 4.76 4.78 5.54 5.70 5.78 5.82 5.85 5.86 6.19 Trade, Finance & Real Estate 23.92 22.34 22.14 23.10 24.64 24.53 24.97 25.02 24.91 26.23 Services 10.05 9.85 9.06 11.72 11.90 12.07 12.04 12.13 12.17 12.63
GROSS DOMESTIC PRODUCT 343,162 454,260 609,768 571,883 720,690 714,460 718,941 734,156 766,579 803,740 (Million Pesos)
Source: Philippine Statistical Yearbook, various issues National Statistical Coordination Board, Economic and Social Statistics Office.
Table 2Shares in the Real Gross Domestic Product, by Industry:
Philippines, 1970, 1975, 1980, 1985, 1990-1995(in percent)
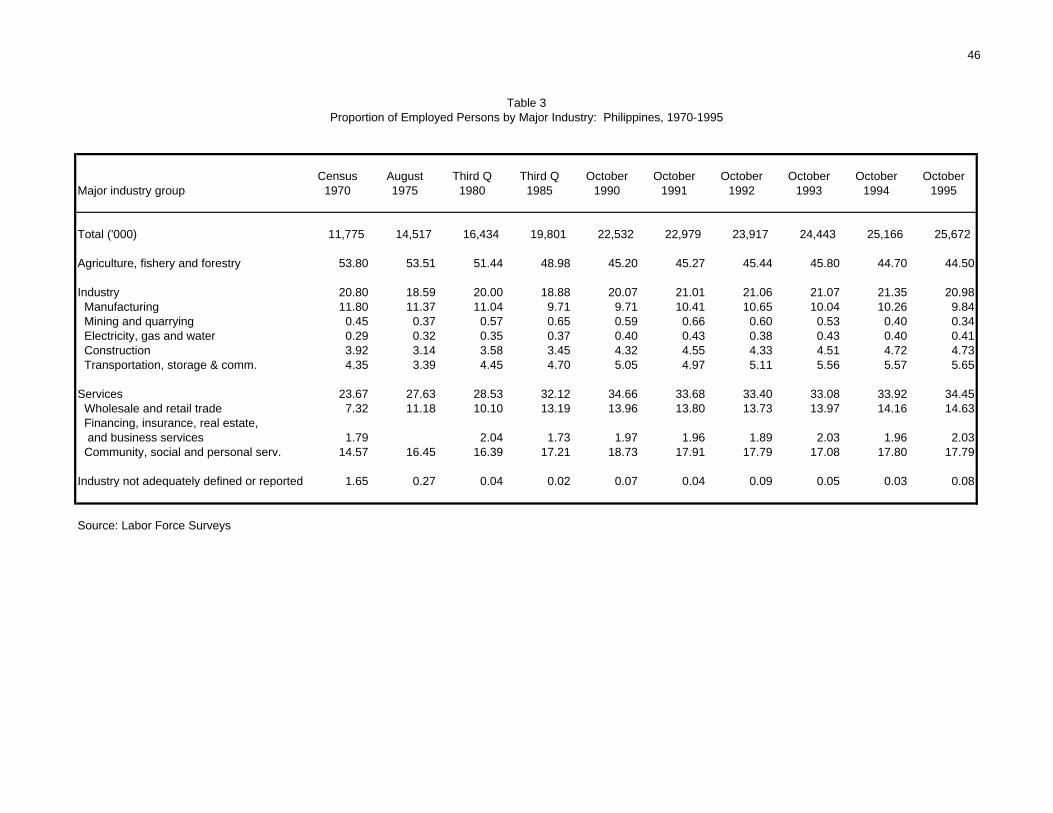
46
Census August Third Q Third Q October October October October October OctoberMajor industry group 1970 1975 1980 1985 1990 1991 1992 1993 1994 1995
Total ('000) 11,775 14,517 16,434 19,801 22,532 22,979 23,917 24,443 25,166 25,672
Agriculture, fishery and forestry 53.80 53.51 51.44 48.98 45.20 45.27 45.44 45.80 44.70 44.50
Industry 20.80 18.59 20.00 18.88 20.07 21.01 21.06 21.07 21.35 20.98 Manufacturing 11.80 11.37 11.04 9.71 9.71 10.41 10.65 10.04 10.26 9.84 Mining and quarrying 0.45 0.37 0.57 0.65 0.59 0.66 0.60 0.53 0.40 0.34 Electricity, gas and water 0.29 0.32 0.35 0.37 0.40 0.43 0.38 0.43 0.40 0.41 Construction 3.92 3.14 3.58 3.45 4.32 4.55 4.33 4.51 4.72 4.73 Transportation, storage & comm. 4.35 3.39 4.45 4.70 5.05 4.97 5.11 5.56 5.57 5.65
Services 23.67 27.63 28.53 32.12 34.66 33.68 33.40 33.08 33.92 34.45 Wholesale and retail trade 7.32 11.18 10.10 13.19 13.96 13.80 13.73 13.97 14.16 14.63 Financing, insurance, real estate, and business services 1.79 2.04 1.73 1.97 1.96 1.89 2.03 1.96 2.03 Community, social and personal serv. 14.57 16.45 16.39 17.21 18.73 17.91 17.79 17.08 17.80 17.79
Industry not adequately defined or reported 1.65 0.27 0.04 0.02 0.07 0.04 0.09 0.05 0.03 0.08
Source: Labor Force Surveys
Proportion of Employed Persons by Major Industry: Philippines, 1970-1995Table 3

47
Table 4
Distribution of Unemployed Persons by Highest Grade Completed:
Philippines, Selected Years
(In percent)
Year Total No Elementary High School College Not
Grade 1-5 grad 1-3 grad non- grad Reported
grad
1961 6.36 5.80 31.20 21.30 18.10 12.70 10.40 0.50 0.001965 6.16 6.30 26.80 28.30 13.30 12.70 12.20 0.50 0.001976 4.25 2.31 15.13 21.79 17.05 16.79 14.23 11.67 1.031980 5.05 3.58 15.27 16.15 16.77 19.38 17.27 10.21 0.671985 7.12 1.42 8.64 13.75 13.87 23.71 20.64 17.89 0.081990 8.13 2.80 12.40 14.80 14.20 24.80 14.70 15.90 0.501994 9.49 2.00 10.10 13.00 15.90 26.30 18.60 13.90 0.30
Source: Labor Force Survey Series
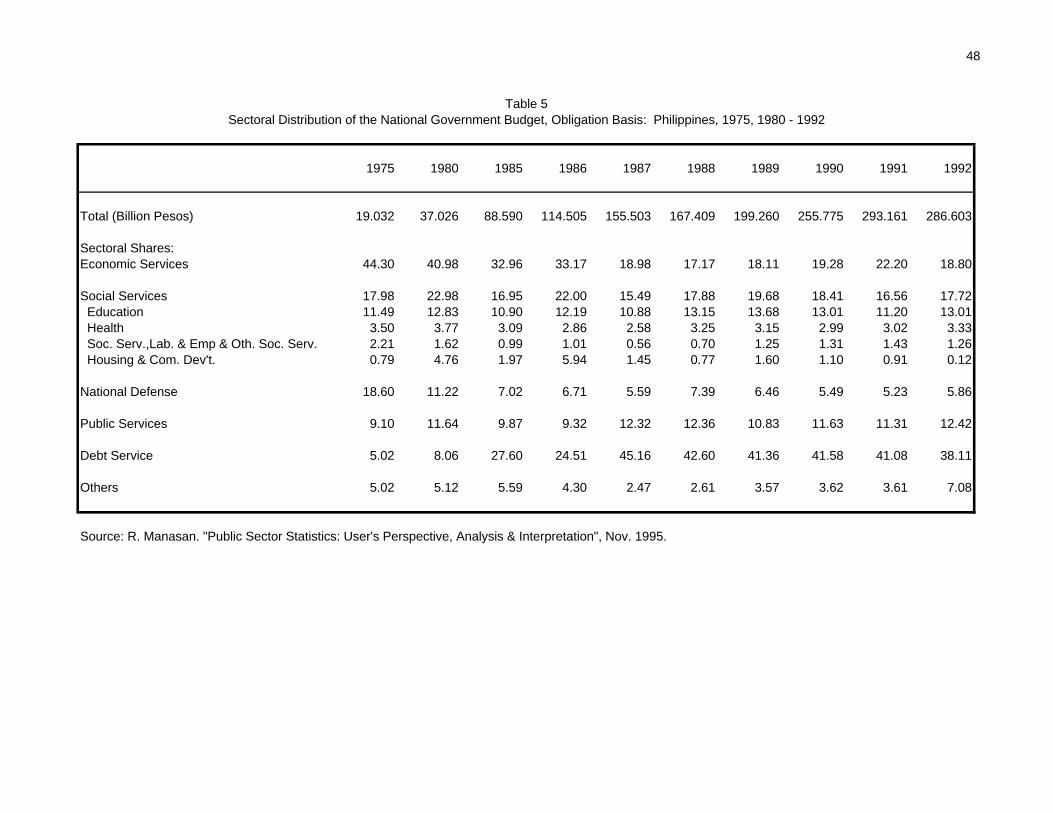
48
1975 1980 1985 1986 1987 1988 1989 1990 1991 1992
Total (Billion Pesos) 19.032 37.026 88.590 114.505 155.503 167.409 199.260 255.775 293.161 286.603
Sectoral Shares:Economic Services 44.30 40.98 32.96 33.17 18.98 17.17 18.11 19.28 22.20 18.80
Social Services 17.98 22.98 16.95 22.00 15.49 17.88 19.68 18.41 16.56 17.72 Education 11.49 12.83 10.90 12.19 10.88 13.15 13.68 13.01 11.20 13.01 Health 3.50 3.77 3.09 2.86 2.58 3.25 3.15 2.99 3.02 3.33 Soc. Serv.,Lab. & Emp & Oth. Soc. Serv. 2.21 1.62 0.99 1.01 0.56 0.70 1.25 1.31 1.43 1.26 Housing & Com. Dev't. 0.79 4.76 1.97 5.94 1.45 0.77 1.60 1.10 0.91 0.12
National Defense 18.60 11.22 7.02 6.71 5.59 7.39 6.46 5.49 5.23 5.86
Public Services 9.10 11.64 9.87 9.32 12.32 12.36 10.83 11.63 11.31 12.42
Debt Service 5.02 8.06 27.60 24.51 45.16 42.60 41.36 41.58 41.08 38.11
Others 5.02 5.12 5.59 4.30 2.47 2.61 3.57 3.62 3.61 7.08
Source: R. Manasan. "Public Sector Statistics: User's Perspective, Analysis & Interpretation", Nov. 1995.
Sectoral Distribution of the National Government Budget, Obligation Basis: Philippines, 1975, 1980 - 1992Table 5

49
Table 6Annual Per Capita Poverty Threshold and Poverty Incidence: Philippines, 1985, 1988, 1991, & 1994
Annual Per Capita Threshold (Pesos) Magnitude of Families Poverty Incidence1985 1988 1991 1994 1985 1988 1991 1994 1985 1988 1991 1994
PHILIPPINES 3,744 4,777 7,302 8,969 4,355,052 4,230,484 4,780,865 4,558,974 44.2 40.2 39.9 35.7
Urban 4,365 5,893 8,327 9,910 1,250,398 1,198,555 1,847,579 1,539,087 33.6 30.1 31.1 24.2Rural 3,353 4,094 6,276 8,035 3,104,655 3,031,929 2,933,286 3,019,887 50.7 46.3 48.6 47.1
NCR 4,527 6,576 9,286 11,312 301,973 310,284 217,602 150,020 23.0 21.6 13.2 8.5Region 1 3,775 4,934 8,060 10,064 267,004 280,394 325,145 344,213 37.5 44.9 48.4 48.7Region 2 3,448 4,573 7,035 8,522 174,844 177,072 211,839 189,087 37.8 40.4 43.3 36.1Region 3 3,895 5,242 8,173 9,744 264,811 304,313 371,817 313,723 27.7 29.3 31.1 24.6Region 4 3,794 4,832 8,075 9,481 524,839 527,360 612,213 511,104 40.3 41.1 37.9 29.5Region 5 3,434 4,144 6,385 8,421 404,751 402,522 452,777 476,164 60.5 54.5 55.0 54.2Region 6 3,675 4,344 6,403 8,201 528,098 472,909 484,505 481,663 59.9 49.4 45.3 42.5Region 7 3,305 3,711 5,585 6,409 449,760 388,571 377,448 304,788 57.4 46.8 41.7 32.0Region 8 3,283 3,818 5,138 6,482 334,751 292,953 264,906 268,304 59.0 48.9 40.1 38.7Region 9 3,521 3,793 6,351 7,180 268,872 208,710 238,022 228,948 54.3 38.7 49.7 45.0Region 10 3,546 4,523 6,433 8,682 300,226 279,900 363,231 383,558 53.1 46.1 53.0 52.2Region 11 3,645 4,876 6,544 8,236 309,532 318,117 383,368 357,688 43.9 43.1 46.2 40.3Region 12 3,673 4,147 7,321 8,961 225,551 177,807 209,458 216,460 51.7 36.1 57.0 54.8CAR NA 5,116 8,332 11,522 NA 89,572 111,030 133,730 NA 41.9 48.8 55.4ARMM NA NA 7,450 8,885 NA NA 157,507 199,524 NA NA 50.7 60.5
Memo: Peso/US$ 18.61 21.09 27.48 26.42
Source: National Statistics Coordination Board
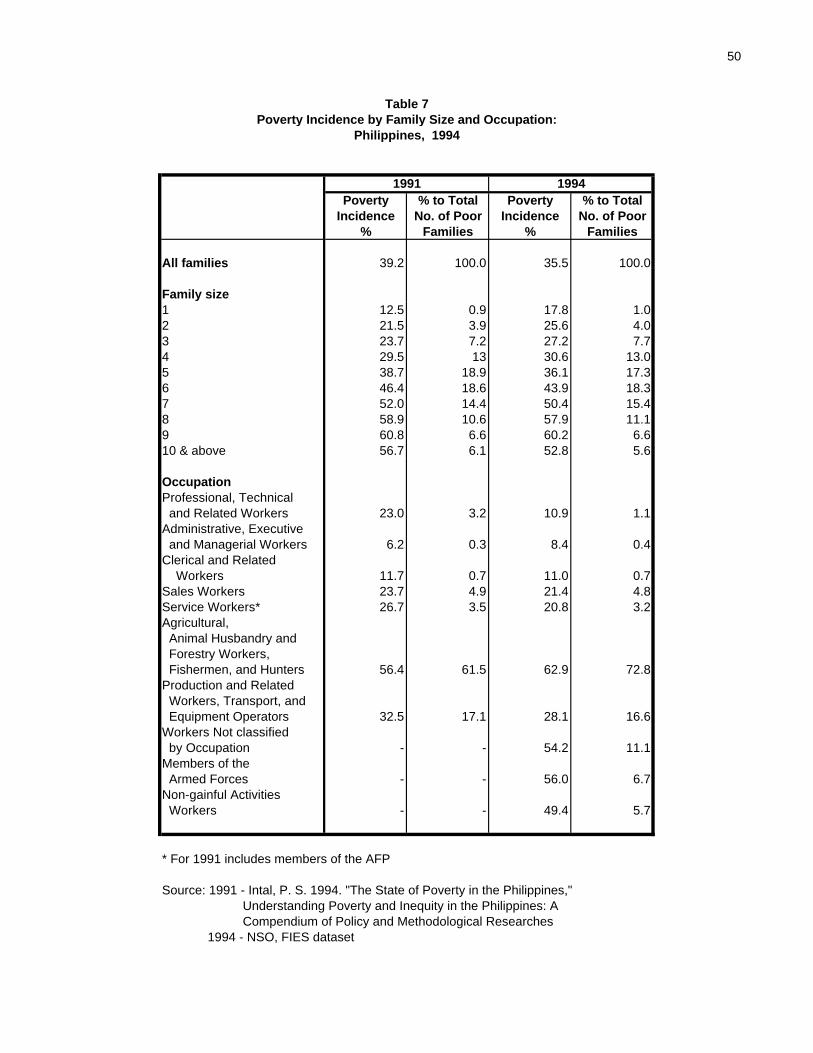
50
Table 7Poverty Incidence by Family Size and Occupation:
Philippines, 1994
1991 1994Poverty % to Total Poverty % to Total
Incidence No. of Poor Incidence No. of Poor% Families % Families
All families 39.2 100.0 35.5 100.0
Family size1 12.5 0.9 17.8 1.02 21.5 3.9 25.6 4.03 23.7 7.2 27.2 7.74 29.5 13 30.6 13.05 38.7 18.9 36.1 17.36 46.4 18.6 43.9 18.37 52.0 14.4 50.4 15.48 58.9 10.6 57.9 11.19 60.8 6.6 60.2 6.610 & above 56.7 6.1 52.8 5.6
OccupationProfessional, Technical and Related Workers 23.0 3.2 10.9 1.1Administrative, Executive and Managerial Workers 6.2 0.3 8.4 0.4Clerical and Related Workers 11.7 0.7 11.0 0.7Sales Workers 23.7 4.9 21.4 4.8Service Workers* 26.7 3.5 20.8 3.2Agricultural, Animal Husbandry and Forestry Workers, Fishermen, and Hunters 56.4 61.5 62.9 72.8Production and Related Workers, Transport, and Equipment Operators 32.5 17.1 28.1 16.6Workers Not classified by Occupation - - 54.2 11.1Members of the Armed Forces - - 56.0 6.7Non-gainful Activities Workers - - 49.4 5.7
* For 1991 includes members of the AFP
Source: 1991 - Intal, P. S. 1994. "The State of Poverty in the Philippines," Understanding Poverty and Inequity in the Philippines: A Compendium of Policy and Methodological Researches 1994 - NSO, FIES dataset

51
Table 9LIVELIHOOD ACCOMPLISHMENT REPORT ON THE IMPLEMENTATION
OF THE NATIONAL LIVELIHOOD PROGRAM1995
Livelihood Credit TrainingAgency No. of No. of No. of No. of Outlay Funds
Projects BeneficiariesTrainings Trainees
DOLE a/ 4,379 15,759 791 32,175 56,964,726 10,198,249DSWD b/ 12,995 58,853 2,355 58,853 113,103,520 12,167,550DTI c/ 21,467 42,934 - - 330,460,000 -
Sub-total 38,841 117,546 3,146 91,028 500,528,246 22,365,799% to Total 91.08 57.25 58.11 73.80 11.81 39.65
DAR d/ 26 4,745 - - 15,134,960 -DA e/ 51 14,690 - - 11,000,000 -DECS f/ - - 1,069 19,941 - 16,628,582DENR g/ 2,613 2,606 7 - - -OP h/ - 378 - - 3,024,000 -LBP I/ - 32,387 - - 996,823,000 -PNB j/ - - - - 1,011,909,000 -DBP k/ 503 8,655 - - 450,852,000 -GSIS l/ 169 169 - - 7,621,000 -SSS m/ 8 8 - - 690,000 -LIVECOR n/ 395 10,128 140 2,460 1,069,136,000 137,696TLRC 39 14,014 1,052 9,920 171,020,000 17,280,000
TOTAL 42,645 205,326 5,414 123,349 4,237,738,206 56,412,077Source: NEDA-SDC Subcomittee on Livelihooda/ DOLE - the livelihood projects include PRESEED, CTU, OLSTP, TDIS-CTEC, WEED, ELP, PESO-KC
b/ DSWD - projects include SEA-Kaularan Projects, CIDSS, Practical Skills Capability for Disadvantaged,
Women, SEA-K for Disadvantaged Women
c/ DTI - Tulong sa Tao
d/ DAR - projects include CARP-Barangay Marketing Centers of Quedancor, DAR-LBP, Countryside Partnership Scheme
e/ DA - LEAD 2000
f/ DECS - Literacy cum Livelihhod
g/ DENR - Integrated Social Forestry Program, Small Scale Mining
h/ OP - Livelihood Loan Assistance
i/ LBP - Regular Lending Program, Credit Facility for Farmers and Fisherfolk
j/ PNB - Credit facility for viable and bankable projects
k/ DBP - Cattle Financing, Fisheries Sector Financing Program, Cotton Financing, Boundary Hulog Prog., DBP-KMI
Damayan sa Pamumuhunan, Omnibus Financing Program for New Entrepreneurs, Small Scale Irrigation Program
l/ GSIS - MADE Lending Program
m/ SSS - Livelihood Financing
n/ LIVECOR - FIG, GFSME

52
Table 16DOLE Livelihood Programs, 1995
Implementing No. of No of No. of No. of Credit TrainingProgram Agency Projects Beneficiaries Trainings Trainees Outlay Outlay
NMYC Programs (TREND,CTUs,TDIS) NMYC-TESDA - - 755 18,605 - 9,669,577 ELDP OWWA 748 955 16 508 18,257,730 393,909 WE BLR 7 2,578 - - - - WEED BWYW 330 4,637 - - 5,123,996 - WYC BWYW 116 1,743 - - - - PRESEED BRW 2,443 3,222 9 238 23,636,000 - Others 735 2,624 11 12,824 9,947,000 134,763
Total 4,379 15,759 791 32,175 56,964,726 10,198,249
Source: SDC Subcomittee on Livelihood
NMYC National Manpower and Youth Council (now TESDA)OWWA Overseas Workers Welfare AdministrationBLR Bureau of Labor RelationsBWYW Bureau of Women and Young WorkersBRW Bureau of Rural Workers