Michigan Petroleum and Energy Supply Update David Svanda, Commissioner Michigan Public Service...
38
Michigan Petroleum and Energy Supply Update David Svanda, Commissioner Michigan Public Service Commission & President, National Association of Regulator Utility Commissioners Jeffrey Pillon, Manager, Energy Data & Security Michigan Public Service Commission March 21, 2003
-
Upload
nathaniel-knight -
Category
Documents
-
view
214 -
download
0
Transcript of Michigan Petroleum and Energy Supply Update David Svanda, Commissioner Michigan Public Service...
Michigan Petroleum and Energy Supply Update
David Svanda, Commissioner Michigan Public Service Commission & President, National Association of Regulatory Utility Commissioners
Jeffrey Pillon, Manager, Energy Data & Security Michigan Public Service CommissionMarch 21, 2003
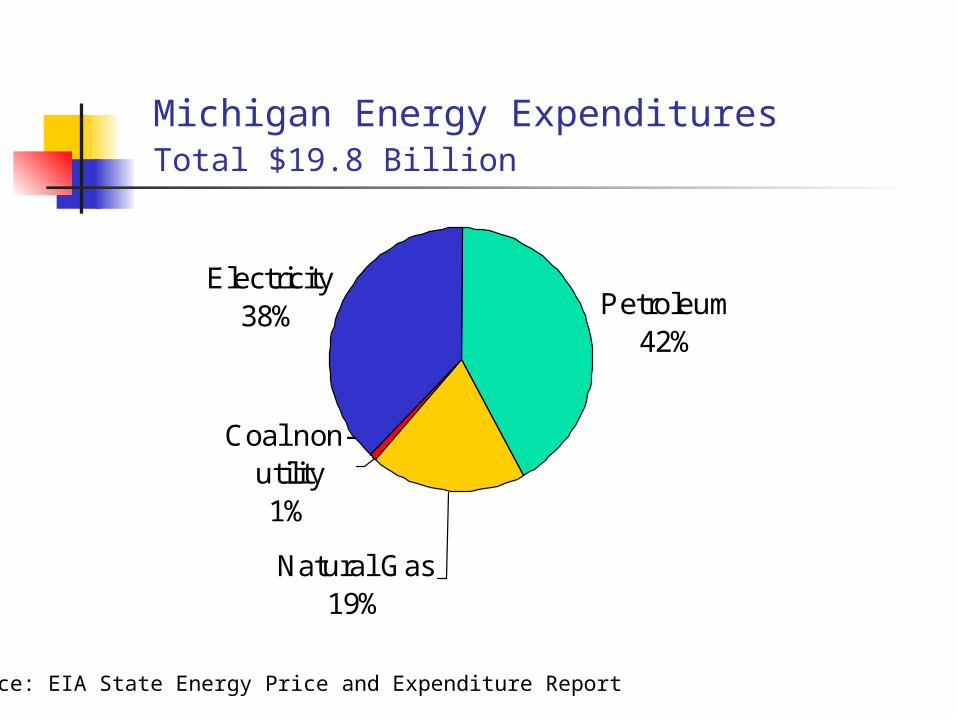
Michigan Energy ExpendituresTotal $19.8 Billion
Petroleum42%
Natural Gas19%
Coal non-utility1%
Electricity38%
Source: EIA State Energy Price and Expenditure Report
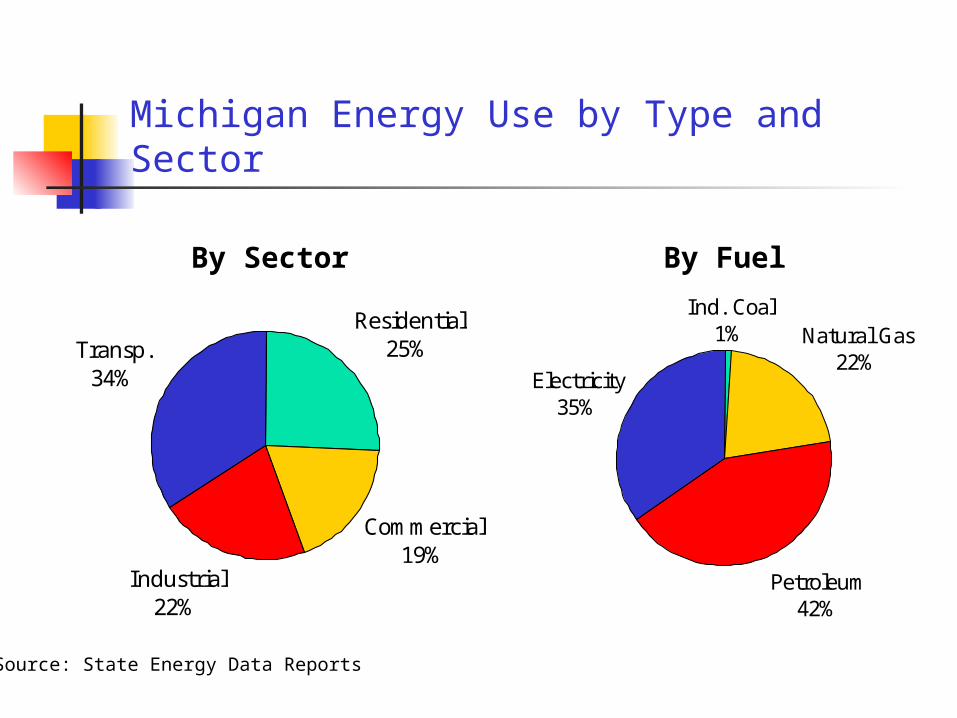
Michigan Energy Use by Type and Sector
Residential25%
Commercial19%
Industrial22%
Transp.34%
Ind. Coal1% Natural Gas
22%
Petroleum42%
Electricity35%
By Sector By Fuel
Source: State Energy Data Reports
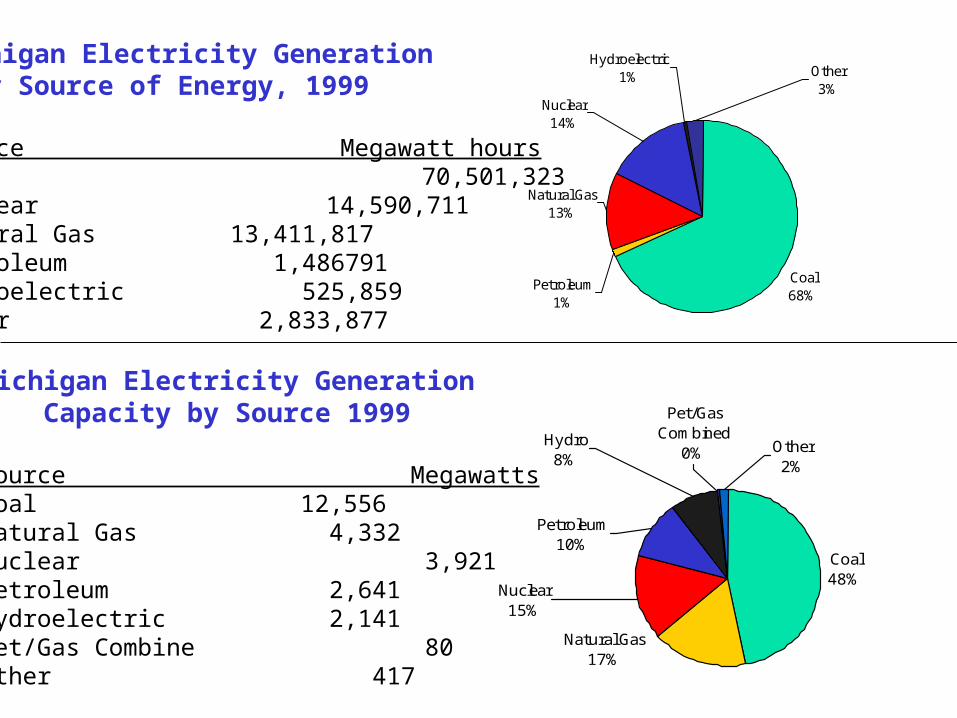
Coal68%
Natural Gas13%
Hydroelectric1% Other
3%Nuclear14%
Petroleum1%
Michigan Electricity Generation by Source of Energy, 1999
Source Megawatt hoursCoal 70,501,323Nuclear 14,590,711Natural Gas 13,411,817Petroleum 1,486791Hydroelectric 525,859Other 2,833,877
Coal48%
Nuclear15%
Natural Gas17%
Petroleum10%
Hydro8%
Pet/Gas Combined
0% Other2%
Michigan Electricity Generation Capacity by Source 1999
Source MegawattsCoal 12,556Natural Gas 4,332Nuclear 3,921Petroleum 2,641Hydroelectric 2,141Pet/Gas Combine 80Other 417

Residential Space Heating by Fuel Type in Michigan
Number of Homes and % of Total
• Natural Gas - 2,961,000 78%
• Propane - 358,000 9.4%
• Electric - 251,000 7%
• Fuel Oil - 131,000 3%
• Other - 85,000 2%
Source: 2000 Census of Housing

Michigan Petroleum Overview
Petroleum Supply (Upstream) Crude Oil Production: 20,000 barrels per day
(2001), ranked 17th (18th including Federal Offshore). Accounts for about 3% of U.S. crude oil production.
Total Producing Oil Wells: 3,700 (2001) Major Pipelines:
Crude Oil - Lakehead, Shell, Marathon Product - Buckeye, Marathon, Wolverine, BP Amoco Liquefied Petroleum Gas - Cochin, Shell, Lakehead

Michigan Petroleum Overview Cont.
Ports & Waterway Systems Detroit (Port), Trenton (Port), Wyandotte (Port), Ecorse
(Port), River Rouge (Port), Dearborn (Port), Essexville (Port), Bay City (Port), Ludington (Port), Muskegon (Port), Escanaba (Port)
Refining & Marketing (Downstream) Refineries: Marathon Ashland Petro LLC Detroit @ 74,000
barrels per calendar day Gasoline Stations: 5,193 outlets (2002), or about 3% of
U.S. total
Sources and notes: Energy Information Administration, Bureau of Census, and National Petroleum News "Market Facts 2001." Rankings include the District of Columbia.

Michigan Total Petroleum Use and Crude Oil Production
0
50
100
150
200
250
19751977
19791981
19831985
19871989
19911993
19951997
19992001
Mill
ions
of
Barr
els
per
year
Total Petroleum Use
Michigan Crude Oil Production

Michigan Petroleum Use by Fuel Type207,214 thousands barrels consumed in 1999
LPG - Propane8%
Jet Fuel5%
Residual Oil1%
Gasoline63%
Distillate Fuel17%
Asphalt & Road Oil4%Lubricants
2%
Source: State Energy Data Reports

MONROE
JACKSON
WASHTENAWWAYNE
LIVINGSTON
OAKLAND
MACOMB
ST. CLAIROTTAWA
Refineries Pipeline terminals
Marine Terminals
There are no pipelines in the Upper Peninsula which is supplied by tanker truck from pipeline terminal in Green Bay Wis.
Wolverine 16"
Amoco 10"W
olverine 8"
Buckeye 8"
Wol
verin
e 8"
Mar
atho
n 10
"
Sun 8
"
Buckeye 8"
Buckeye 12 "
Sun 6" lines
Sun two 8" lines
The yellow shaded area shows the counties where 7.8 Reid Vapor Pressure (RVP) gasoline is required. The balance of the state used 9.0 RVP
Alma
Lansing
Michigan Petroleum Product Pipelines


Sources of World Oil Supply, 2001Venezuela – 2.9 m/b/d or 3.8% of world suppliesIraq – 2.4 m/b/d or 3.2% of world suppliesTotal World Oil Production 76.7 m/b/d
9.0 8.88.0
3.7 3.6 3.32.9 2.8 2.4 2.3 2.3
0.0
2.0
4.0
6.0
8.0
10.0
United
Stat
es
Form
er U
SSR
Saud
i Arabia Ira
n
Mexico
China
Vene
zuela
Cana
da Iraq
United
Arab Em
irates
Nigeria
mill
ion
barr
els
per
day
Source: Energy Information Administration

Source of U.S. Oil Supply19.7 million barrels per day 2001
Domestic42%
Canada9%
Mexico7%
Other Non-OPEC15%
Iraq4%
Nigeria4%
Other OPEC3%
OPEC27%
Venezuela8%
Saudi Arabia8%

Positive World Oil Supply FactorsVenezuelan production is now up to at least 2.4 million barrels per day (m/b/d), from
614,000 barrels per day in January.
Saudi production up to 9.2 m/b/d in March, from 8.7 m/b/d in January
Saudi Arabia has stockpiled nearly 50-mil bbl of oil which it will use if war disrupts Iraqi exports, the New York Times reported Tuesday.
Global Seasonal decline in oil demand is in the range of 2-3 m/b/d
Strategic Petroleum Reserve at nearly 600 million barrels, and is capable of being drawn down at a maximum rate of 4.3 m/b/d
1.5
4.1
2.9
2.42.6
3.5
4.3
0
1
2
3
4
5
OPEC SPR Venezuela Iraq 1973 1979 1991
Spare Capacity Production levels
first nine months of 2002
Previous oil supply disruptions
Million of Barrels per day
Risk Factors Uncertainty of War Loss of Iraqi oil exports of 2 million barrels per day Potential for disruptions to Kuwaiti oil production Political turmoil in Venezuela and civil unrest in
Nigeria Al Qaeda threats to Saudi oil export facilities Availability of oil tankers to transit the Persian Gulf Very low U.S. crude oil and refined product
inventories

Inventories are Low
As of March 14, 2003
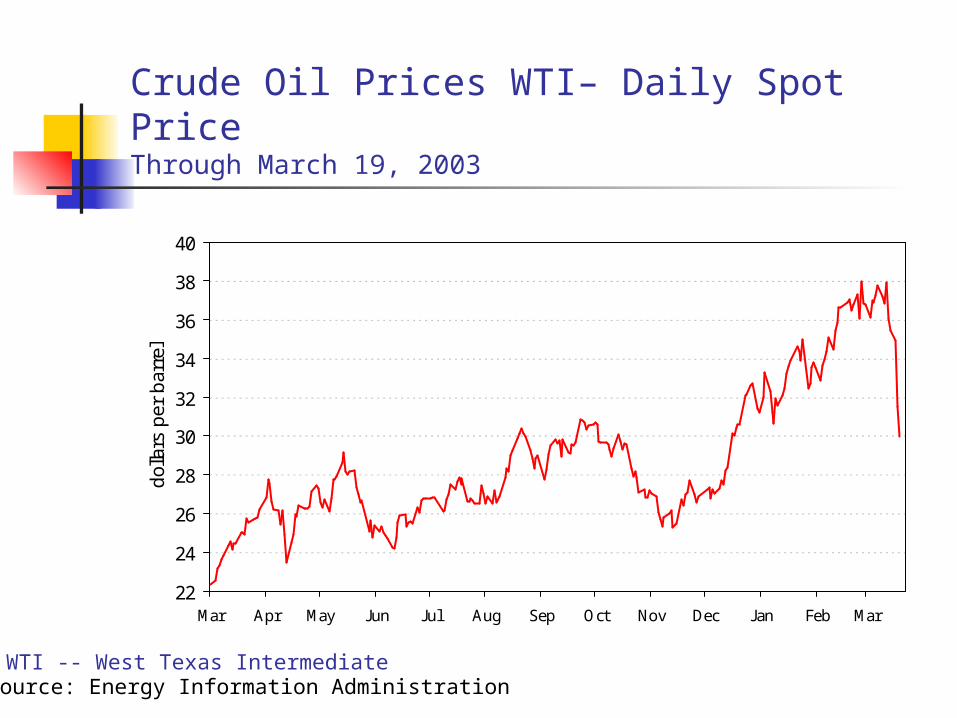
Crude Oil Prices WTI– Daily Spot PriceThrough March 19, 2003
22
24
26
28
30
32
34
36
38
40
Mar Apr May Jun Jul Aug Sep Oct Nov Dec Jan Feb Mar
dolla
rs p
er b
arre
l
Source: Energy Information AdministrationWTI -- West Texas Intermediate
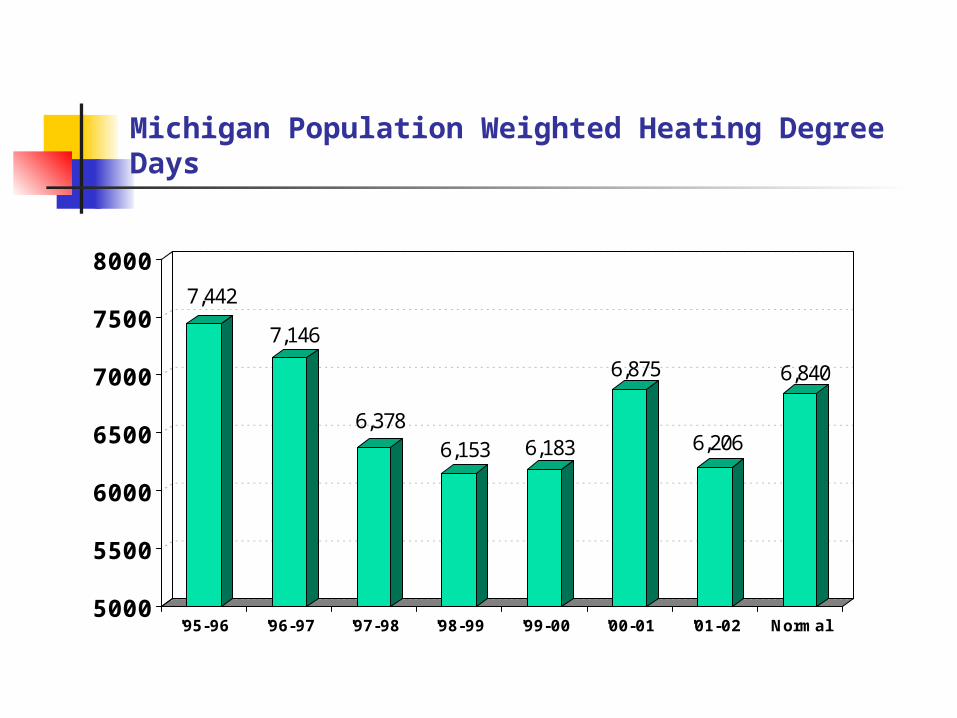
Michigan Population Weighted Heating Degree Days
7,442
7,146
6,3786,153 6,183
6,875
6,206
6,840
5000
5500
6000
6500
7000
7500
8000
'95-96 '96-97 '97-98 '98-99 '99-00 '00-01 '01-02 Normal
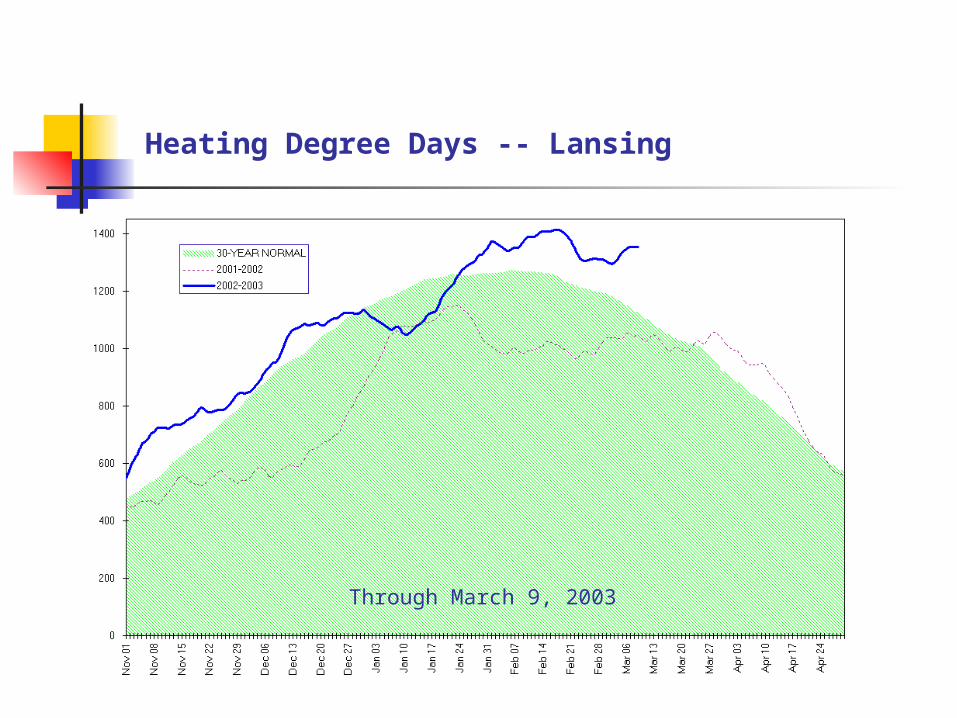
Heating Degree Days -- Lansing
Through March 2, 2003Through March 9, 2003

Weekly Crude Oil and Home Heating Fuel Prices
0.60
0.80
1.00
1.20
1.40
1.60
1.80
2.00
$/ga
llon
15.00
20.00
25.00
30.00
35.00
40.00
$/ba
rrel
Heating Oil ($/gal, left scale)
Propane ($/gal, left scale)
Crude Oil ($/bbl, right scale)
Source: Michigan Public Service Commission and Energy Information Administration
2001-02 Heating Season
2002-03 Heating Season

Residential Heating Oil PricesWeekly Average Prices, $/gallons excluding sales tax
$1.10
$1.20
$1.30
$1.40
$1.50
$1.60
$1.70
$1.80
$1.90
10/7/02 10/28/02 11/18/02 12/9/02 12/30/02 1/20/03 2/10/03 3/3/03
Source: Michigan Public Service Commission and Energy Information Administration
National
Michigan$1.59 3/17
Midwest
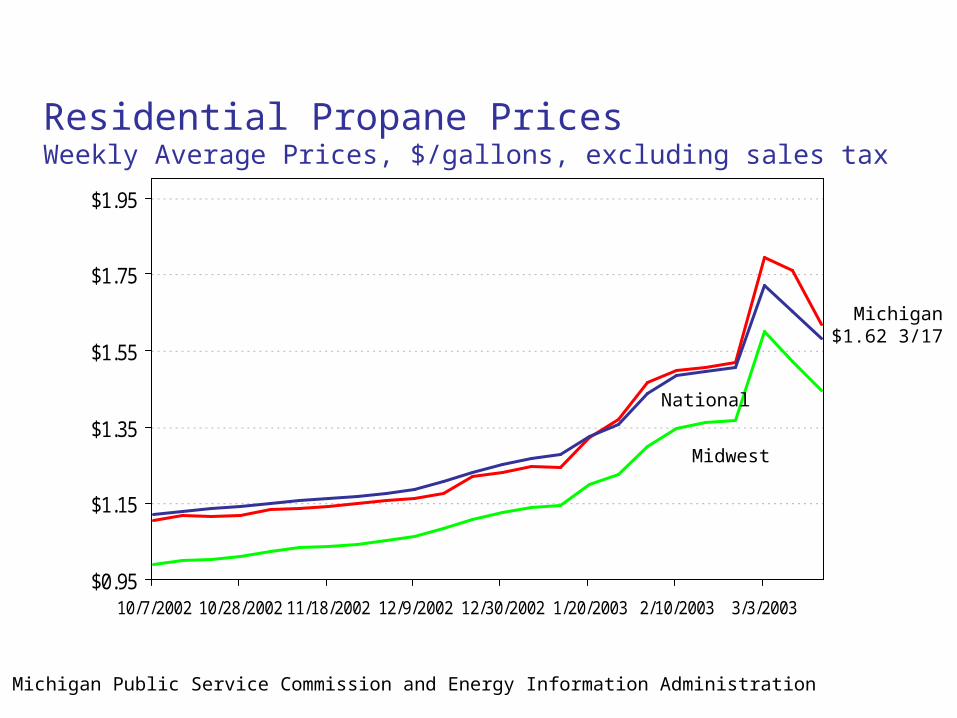
Residential Propane PricesWeekly Average Prices, $/gallons, excluding sales tax
$0.95
$1.15
$1.35
$1.55
$1.75
$1.95
10/7/2002 10/28/2002 11/18/2002 12/9/2002 12/30/2002 1/20/2003 2/10/2003 3/3/2003
National
Michigan$1.62 3/17
Midwest
Source: Michigan Public Service Commission and Energy Information Administration
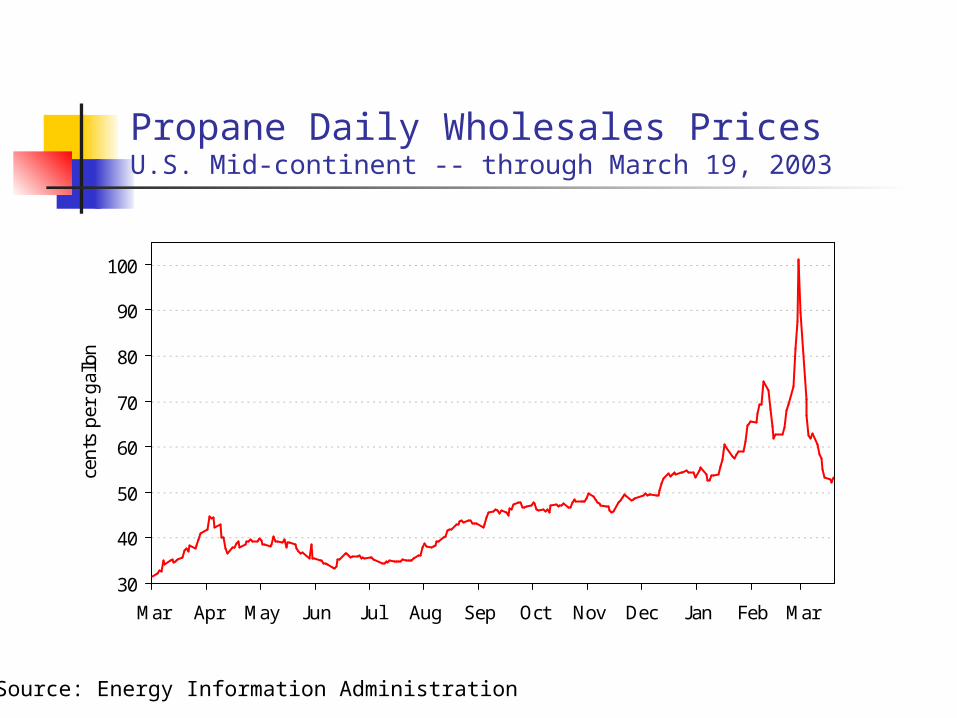
Propane Daily Wholesales PricesU.S. Mid-continent -- through March 19, 2003
30
40
50
60
70
80
90
100
Mar Apr May Jun Jul Aug Sep Oct Nov Dec Jan Feb Mar
cent
s pe
r ga
llon
Source: Energy Information Administration

Residential Propane Prices Heating Seasons 1995 to 2003
$0.60
$0.80
$1.00
$1.20
$1.40
$1.60
$1.80
'95-96 '96-97 '97-98 '98-99 '99-00 '00-01 '01-02 '02-03
Michigan Midwest U.S.
Source: Michigan Public Service Commission and Energy Information Administration

Michigan Gasoline Demand
2002 consumption is estimated to be 4.8 billion gallons Average daily demand is 13 million gallons Michigan consumption is projected to increase 11.1
million gallons through the first half of 2003, or 0.5%. Given higher prices, this growth could be depressed.
Michigan has nearly 8.5 million registered motor vehicles.
Total 2002 expenditures for gasoline were about $6.7 billion. Based on current prices and projected demand, expenditures through the first half of the year could increase by $2 million per day.

Michigan Monthly Gasoline ConsumptionUsage has a seasonal pattern
250,000
300,000
350,000
400,000
450,000
500,000
Jan-90 Jan-92 Jan-94 Jan-96 Jan-98 Jan-00 Jan-02
Gal
lons
per
mon
th

Michigan Primary Gasoline InventoriesThe trend has been to operate with less in storage
0
50,000
100,000
150,000
200,000
250,000
Jan-85 Jan-88 Jan-91 Jan-94 Jan-97 Jan-00
Gal
lons

U.S. refinery capacity has become increasingly concentrated
1971 1976 1981 1986 1991 1996100
150
200
250
300
350
Num
ber
of R
efin
erie
s
0
5
10
15
20
Tho
usan
dsC
apac
ity
Number of Refineries Crude Oil Distillation Capacity
Source: Energy Infromation Administration, and MPSC Staff estimatesThe U.S. Petroleum Industry the Past as a Prologue 1970-1992, Petroleum Supply Annual T 41.
U.S. Refining Capacity
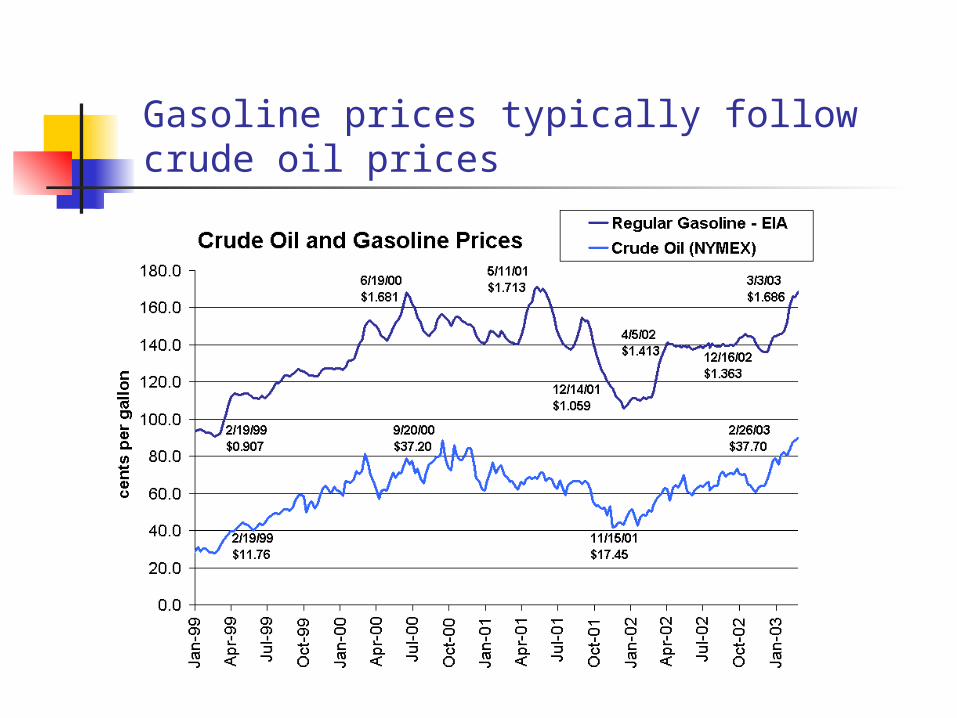
Gasoline prices typically follow crude oil prices

Detroit Area Unleaded Regular Gasoline Retail Prices
$0.50
$0.70
$0.90
$1.10
$1.30
$1.50
$1.70
$1.90
$2.10
$2.30
01/05/93 01/05/95 01/05/97 01/05/99 01/05/01 01/05/03
Prices through March 17, 2003Source: AAA Michigan
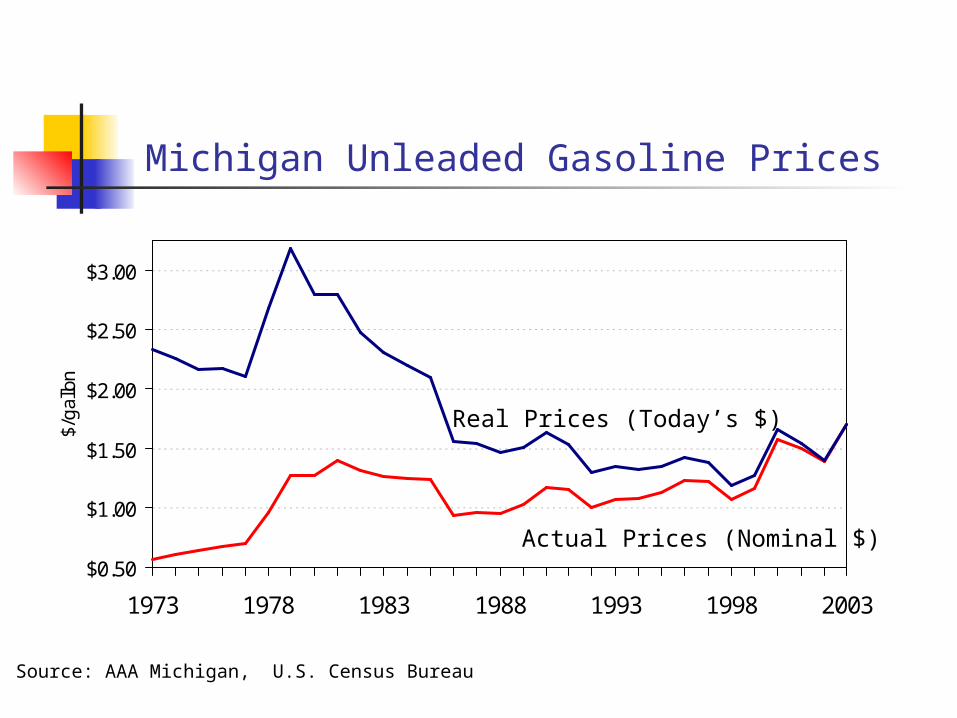
Michigan Unleaded Gasoline Prices
$0.50
$1.00
$1.50
$2.00
$2.50
$3.00
1973 1978 1983 1988 1993 1998 2003
$/ga
llon
Source: AAA Michigan, U.S. Census Bureau
Real Prices (Today’s $)
Actual Prices (Nominal $)
$1.25
$1.35
$1.45
$1.55
$1.65
$1.75
$1.85
$1.95
$2.05
$2.15
$2.25
$ pe
r ga
llon
Cal
iforn
iaH
awai
iN
evad
aA
rizon
aO
rego
nW
ashi
ngto
nN
ew Y
ork
Ala
ska
D.C
.C
onne
ctic
utW
isco
nsin
Idah
oM
onta
naN
orth
Dak
ota
Mic
higa
nIll
inoi
sR
hode
Isla
ndF
lorid
aW
est V
irgin
iaN
ebra
ska
Mas
sach
usse
ttsU
tah
Indi
ana
Col
orad
oM
aryl
and
New
Mex
ico
Ver
mon
tW
yom
ing
Ohi
oS
outh
Dak
ota
Mai
neK
entu
cky
Kan
sas
Pen
nsyl
vani
aN
ew H
amps
hire
Iow
aM
inne
ssot
aD
elaw
are
Ark
ansa
sN
orth
Car
olin
aA
laba
ma
Ten
ness
eeM
issi
ssip
piLo
uisi
ana
Tex
asV
irgin
iaM
isso
uri
New
Jer
sey
Geo
rgia
Sou
th C
arol
ina
Okl
ahom
a
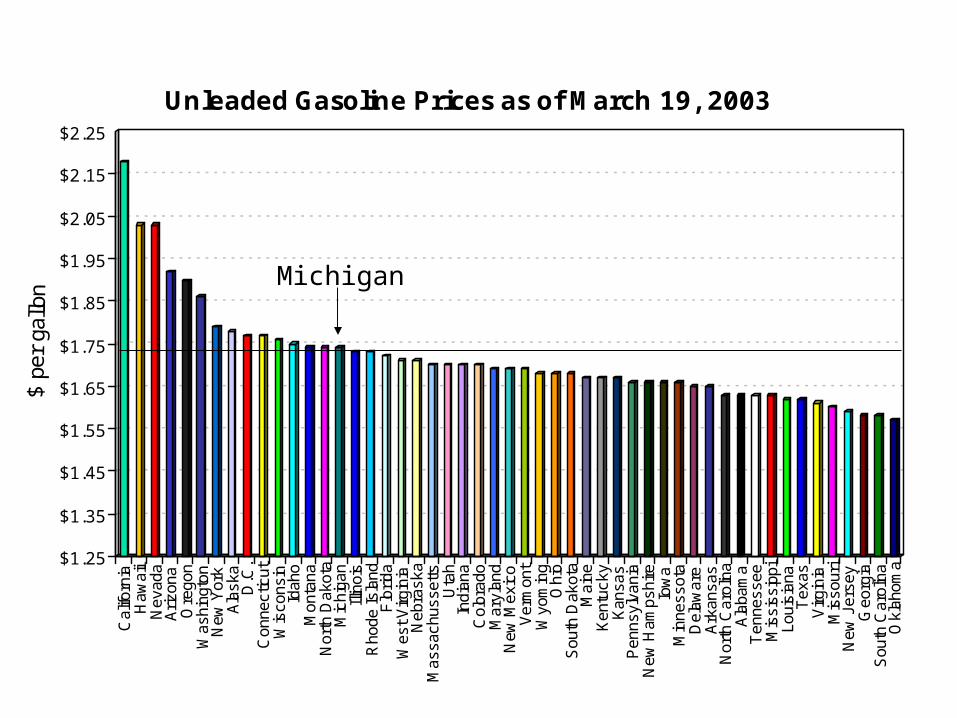
Unleaded Gasoline Prices as of March 19, 2003
Michigan
$1.15
$1.20
$1.25
$1.30
$1.35
$1.40
$1.45
$1.50
$1.55
$1.60
$1.65
$1.70
$ pe
r gal
lon
Ca
lifo
rnia
Ari
zon
aA
lask
aN
eva
da
Ha
wa
iiO
reg
on
Wa
shin
gto
nD
.C.
Wyo
min
gN
ort
h D
ako
taN
ew
Me
xico
Ke
ntu
cky
Ida
ho
Ne
w Y
ork
Ve
rmo
nt
Ma
ssa
chu
sse
ttC
olo
rad
oC
on
ne
ctic
ut
Mo
nta
na
Mic
hig
an
Ind
ian
aO
hio
Ma
ryla
nd
We
st V
irg
inia
Ne
w H
am
psh
ire
Ge
org
iaU
tah
Ne
bra
ska
Wis
con
sin
Iow
aS
ou
th D
ako
taN
ew
Je
rse
yM
ain
eM
inn
ess
ota
Ark
an
sas
Mis
sou
riK
an
sas
Illin
ois
Vir
gin
iaF
lori
da
Ala
ba
ma
De
law
are
Mis
siss
ipp
iL
ou
isia
na
Rh
od
e I
sla
nd
Te
xas
Te
nn
ess
ee
So
uth
Ca
rolin
aO
kla
ho
ma
No
rth
Ca
rolin
aP
en
nsy
lva
nia
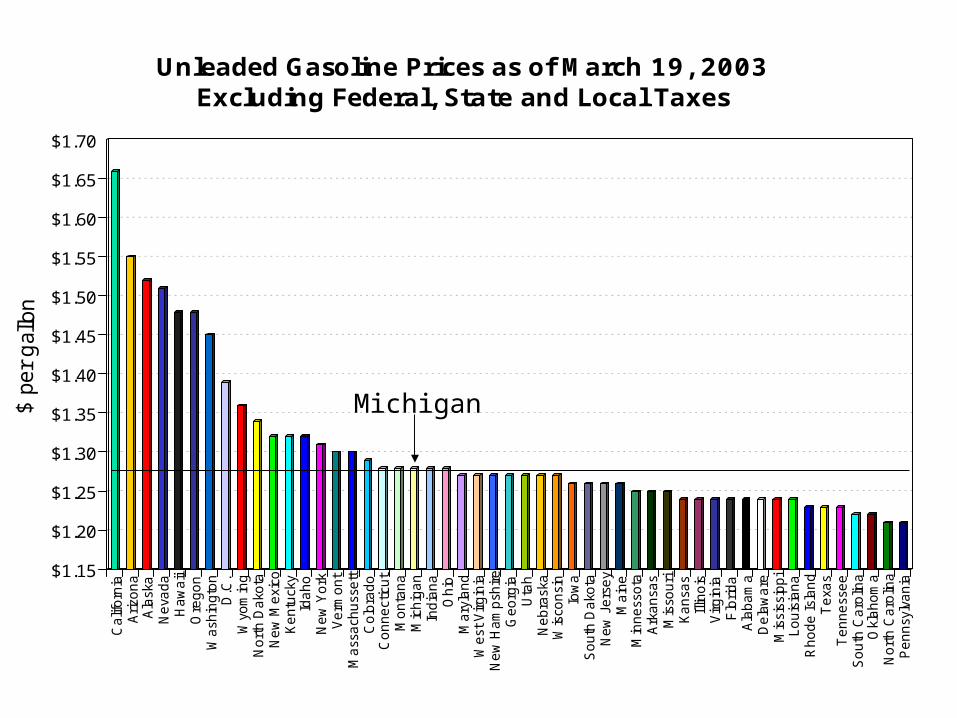
Unleaded Gasoline Prices as of March 19, 2003Excluding Federal, State and Local Taxes
Michigan
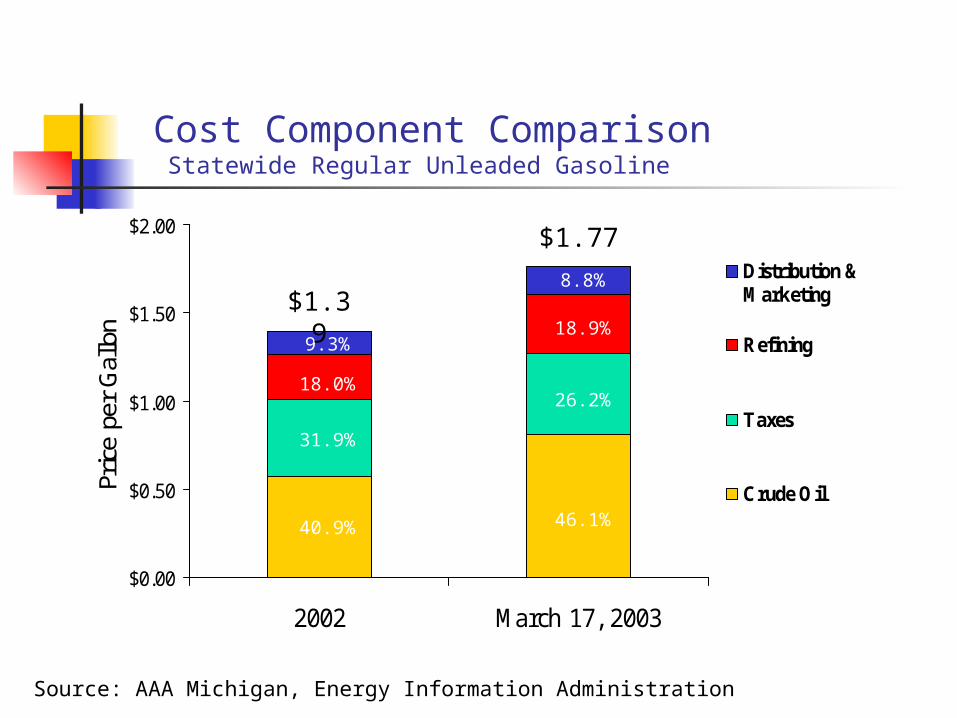
Cost Component Comparison Statewide Regular Unleaded Gasoline
$0.00
$0.50
$1.00
$1.50
$2.00
2002 March 17, 2003
Pric
e pe
r G
allo
n
Distribution &Marketing
Refining
Taxes
Crude Oil
40.9%
31.9%
18.0%
9.3%
46.1%
26.2%
18.9%
8.8%$1.39
$1.77
Source: AAA Michigan, Energy Information Administration
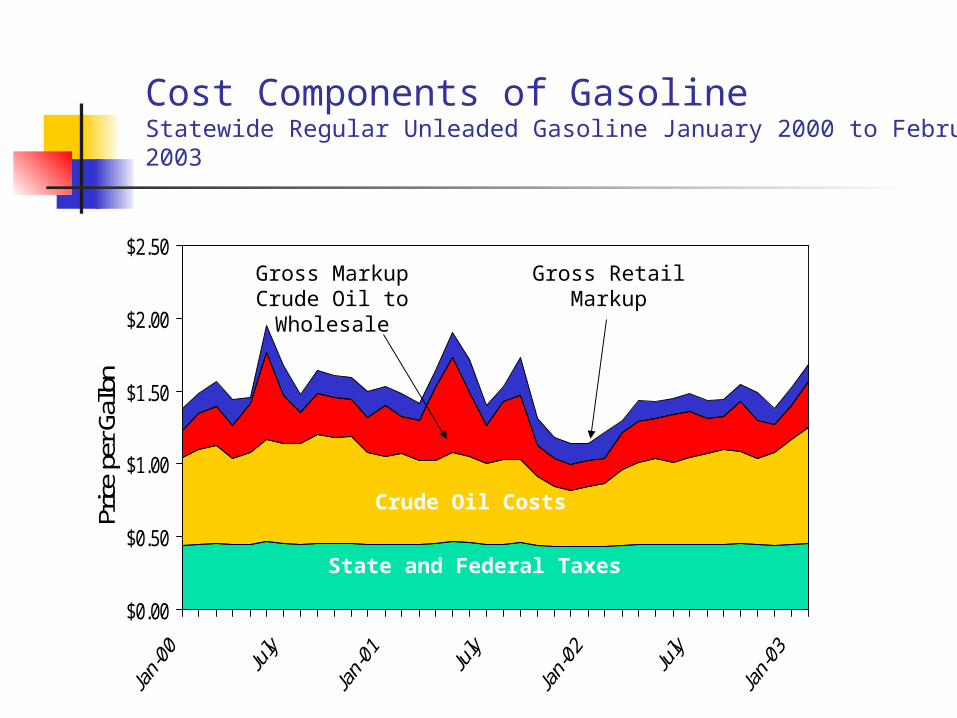
Cost Components of GasolineStatewide Regular Unleaded Gasoline January 2000 to February 2003
$0.00
$0.50
$1.00
$1.50
$2.00
$2.50
Price
per
Gal
lon
Crude Oil Costs
State and Federal Taxes
Gross MarkupCrude Oil toWholesale
Gross RetailMarkup
Petroleum Price Impacts in Michigan
Direct Consumer Impacts Motorists pay higher gasoline bills Higher heating costs for heating oil and
propane users Higher business operating costs passed on
to consumers Durable Goods Manufacturing Tourism Agriculture

Petroleum Price Impacts on Michigan HouseholdsCold weather and higher prices have increased bills
$1,459
$1,011
$693
$1,628
$1,331
$988
$0
$200
$400
$600
$800
$1,000
$1,200
$1,400
$1,600
$1,800
Gasoline Propane Heating Oil
Expe
nditu
res
per
Hou
seho
ld
2002 2003

Critical Infrastructure Protection
• The MPSC is working with the private sector to reduce risk and vulnerabilities at key energy facilities.• Participating on Michigan Homeland Security Task Force to assure a coordinated State Government response.