Michigan Part B Annual Performance Report...APR – Part B Michigan Part B State Annual Performance...
224
Michigan Part B Annual Performance Report As required by 20 U.S.C. 1416 Sec. 616(b)(1) of the Individuals with Disabilities Education Act 2004 Submitted to the United States Department of Education Office of Special Education Programs (OSEP) February 3, 2014 Resubmitted to the OSEP on April 23, 2014 Office of Special Education
Transcript of Michigan Part B Annual Performance Report...APR – Part B Michigan Part B State Annual Performance...

Michigan Part B
Annual Performance Report As required by 20 U.S.C. 1416
Sec. 616(b)(1) of the Individuals with Disabilities Education Act 2004
Submitted to the United States Department of Education
Office of Special Education Programs (OSEP) February 3, 2014
Resubmitted to the OSEP on April 23, 2014
Office of Special Education


APR – Part B Michigan
Part B State Annual Performance Report for FFY 2012 (2012-2013) Table of Contents (OMB NO: 1820-0624 / Expiration Date: 7/31/2015)
Annual Performance Report Table of Contents
Page Overview of the Annual Performance Report Development .................................. 6
Indicator 1 Graduation ............................................................................. 14
Indicator 2 Dropout ................................................................................. 22
Indicator 3 Statewide Assessment ............................................................. 32
Indicator 4A Suspension/Expulsion .............................................................. 50
Indicator 4B Suspension/Expulsion by Race/Ethnicity ..................................... 60
Indicator 5 Educational Environments ........................................................ 72
Indicator 6 Preschool Educational Environments .......................................... 80
Indicator 7 Preschool Outcomes ................................................................ 88
Indicator 8 Facilitated Parent Involvement ................................................. 102
Indicator 9 Disproportionate Representation—Child with a Disability .............. 112
Indicator 10 Disproportionate Representation—Eligibility Categories ................ 118
Indicator 11 Child Find ............................................................................. 126
Indicator 12 Early Childhood Transition ....................................................... 134
Indicator 13 Secondary Transition .............................................................. 144
Indicator 14 Postsecondary Outcomes ........................................................ 154
Indicator 15 Compliance Findings ............................................................... 164
Indicator 18 Resolution Session Agreements ................................................ 180
Indicator 19 Mediation Agreements ............................................................ 184
Indicator 20 Timely and Accurate Data ....................................................... 188
Acronym List ........................................................................................... 196
Appendix A Students with an Individualized Education Program .................... 198
Appendix B Michigan’s Mandated Activities Projects (MAPS) ......................... 204
Appendix C Continuous Improvement and Monitoring System (CIMS) ............ 210
Appendix D Disproportionate Representation Business Rules ........................ 216
Appendix E Postsecondary Outcomes Survey .............................................. 222


APR – Part B Michigan
Part B State Annual Performance Report for FFY 2012 (2012-2013) Overview Page 6 (OMB NO: 1820-0624 / Expiration Date: 7/31/2015)
Michigan’s Federal Fiscal Year 2012 Annual Performance Report
February 2014 Overview The Michigan Department of Education (MDE), Office of Special Education (OSE) developed the federal fiscal year (FFY) 20121 Annual Performance Report (APR) in collaboration with the Office of Great Start, Early Childhood Education & Family Services (OGS/ECE&FS), the Bureau of Assessment and Accountability (BAA), as well as other state agency offices and OSE grantees. This APR includes a report of Michigan’s progress and/or slippage in meeting the state’s “measurable and rigorous targets” found in its State Performance Plan (SPP) Extension. The term SPP Extension refers to Michigan’s revised SPP document that only includes information relevant to FFY 2010 through FFY 2012. The SPP Extension includes any revised targets which included input from our Special Education Advisory Committee2 (SEAC) and revised improvement activities. The historic version of the SPP and the current versions of the SPP Extension and APR can be found on the MDE website at www.michigan.gov/ose-eis (select “Annual Performance Report/State Performance Plan” in the left column). During the past year Michigan has seen major changes in the Michigan Department of Education and Michigan law. The BAA was reorganized and became the Division of Accountability Services. To maintain consistency with prior years APR and the SPP Extension, we will continue to reference the BAA in our FFY 2012 reporting. Recently enacted Public Act 436 of 2012, known as the Local Fiscal Stability and Choice Act Process, indicates that if there are one or more conditions indicative of probable financial stress in a local school district, the state superintendent may conduct a preliminary review. If warranted after the preliminary review, the state superintendent may recommend the creation of a review team. Should the review team determine that a financial emergency exists, one course of action is the appointment of an emergency manager by the governor. Upon appointment of the emergency manager, the chief administrative officer and governing body of the local school district are prohibited from exercising any powers of offices without written approval of the emergency manager. If a district is unable to provide an adequate debt reduction plan, the state superintendent may decide to dissolve the school district. Since the enactment of this law, several districts have had emergency managers appointed and other districts have been dissolved. In September of 2012, the Education Achievement Authority (EAA) began operation as an independent district. The EAA is a new statewide school system that was established through an inter-local agreement between Eastern Michigan University and the City of Detroit Public Schools. It is comprised of the lowest performing schools in the state of Michigan that are not achieving satisfactory results on a redesign plan or that are under an Emergency Manager. The system is designed to transform these entities into stable, financially responsible public schools that provide the conditions, tools, resources, supports and safe learning environments in 1 The 2012 federal fiscal year is defined as the period between July 1, 2012 and June 30, 2013. 2 Michigan’s Individuals with Disabilities Education Act (IDEA) mandated special education State Advisory Panel.

APR – Part B Michigan
Part B State Annual Performance Report for FFY 2012 (2012-2013) Overview Page 7 (OMB NO: 1820-0624 / Expiration Date: 7/31/2015)
which teachers can help students make significant academic gains. At the current time, all schools in the EAA were previously associated with the City of Detroit Public Schools; however, the EAA will eventually expand to include additional low-performing schools throughout Michigan. The APR reflects statewide summary data from Michigan’s local educational agencies (LEAs) and state agency education programs. In this document, the term “district” or “local” refers to all LEAs, PSAs3, intermediate school districts (ISDs)/ educational service agencies (ESAs), and state agencies that provide direct services to students. There were a total of 881 school districts that submitted student information during the fall 2012 general student data collection. Students with an individualized education program (IEP) were enrolled in 862 of these entities as of the Special Education Annual Child Count date. Of the 862 districts that submitted data for students with an IEP, 537 were traditional school districts, 267 were PSAs, 55 were ISDs/ESAs, and 3 were state agencies. The state agency education programs included the MDE’s Michigan School for the Deaf and educational programs operated by Michigan’s Departments of Community Health, Corrections, and Human Services. Over the past several years, student enrollment in Michigan’s public schools has declined. This trend is also reflected in the population of students with an IEP (reference Appendix A for a description of Michigan’s population of students with an IEP). Within each indicator, the number of districts included in the calculations varies depending on the data requirements (e.g., not all districts had a preschool program or a secondary program). Michigan is using the title “Early Childhood Educational Environments: Ages 3 through 5” for Indicator 6. This is more reflective of the children being served in Michigan and is the language used in the measurement table. Over the past year, Michigan has been moving toward providing more status detail for revised student centered improvement activities. Several of the indicators use a different format to report the “Discussion of Improvement Activities Completed”. The status of the improvement activity is presented in one large cell rather than in a narrow column. Due to OSEP’s change in the Response Table format, the Indicator Status column of the Michigan Part B FFY 2011 SPP/APR Response Table Michigan is reporting Results Data Summary Notes where available. For those indicators that do not have information in the Results Data Summary Notes, we are reporting information from the Results Data Summary. Process Used to Develop the APR Leadership The OSE is comprised of three units: the Performance Reporting Unit (PR) that is responsible for data, monitoring, and determination; the Program Accountability
3 Charter schools in Michigan are referred to as Public School Academies (PSAs).

APR – Part B Michigan
Part B State Annual Performance Report for FFY 2012 (2012-2013) Overview Page 8 (OMB NO: 1820-0624 / Expiration Date: 7/31/2015)
Unit (PA) that has a responsibility of state complaints, hearings, and rule promulgation; and the Program Finance Unit that provides oversight for the federal and state special education funding structures. The OSE implemented a new SPP Core Team structure for the FFY 2012 reporting year. In prior years, there was a single team comprised of administrators and consultants. Due to increased demand on our staff and a need for additional expertise, the decision was made to create multiple teams. The SPP Core Teams included the:
OSE PR Data and SPP Coordinators OSE SPP/APR Consultant Mandated Activities Project (MAP)4 Directors PR Data Analysts and Consultants PA Consultants OSE Support Staff.
The core teams provided global direction and oversight during the APR development. The core teams made recommendations on the required elements of each indicator report which contributed to the accuracy and coherence of the final report. The core teams also addressed specific issues related to individual SPP indicators. A work team was created for each SPP indicator. Each work team had an indicator lead and co-lead, with data and administrative support staff. As appropriate, work teams included staff from:
the OSE the OGS/ECE&FS Michigan’s MAPs the BAA the Center for Educational Performance and Information (CEPI) external providers of data services to the OSE.
The indicator teams examined data, data collection strategies, variables that impacted progress and slippage, and improvement activities. The OSE director and assistant director, supervisors from the OSE PA and PR Units, and the OGS/ECE&FS Supervisor of Preschool and Early Elementary Programs completed a final read of the APR and related documents to ensure completeness and accuracy. National Guidance and Support The following national technical assistance centers, networks and organizations provided the MDE with APR-related consultation and/or resources:
Center on Positive Behavioral Interventions and Supports (PBIS) Consortium for Appropriate Dispute Resolution in Special Education (CADRE)
4 Michigan’s state improvement and compliance initiatives, funded with IDEA administrative set-aside funds.

APR – Part B Michigan
Part B State Annual Performance Report for FFY 2012 (2012-2013) Overview Page 9 (OMB NO: 1820-0624 / Expiration Date: 7/31/2015)
Data Accountability Center (DAC (including the former National Center for Special Education Accountability Monitoring (NCSEAM)))
Early Childhood Outcomes (ECO) Center Education Information Management Advisory Consortium (EIMAC) Great Lakes East Comprehensive Center National Association of State Directors of Special Education (NASDSE) National Dissemination Center for Children with Disabilities (NICHCY) National Dropout Prevention Center for Students with Disabilities (NDPC-SD) National Early Childhood Technical Assistance Center (NECTAC) National Post-School Outcomes Center (NPSO) National Secondary Transition Technical Assistance Center (NSTTAC) North Central Regional Resource Center (NCRRC).
Stakeholder Involvement The SEAC, partner organizations, and parent networks provided stakeholder input. A description of stakeholder involvement is presented in the historic Part B SPP Extension Overview. Data Systems and Improvements This year’s APR continues to reflect improved district data entry, state collection, verification and analysis practices. The OSE collaborated with data systems’ technical experts to ensure compliance with all data collection requirements and improved data validity and reliability including:
The BAA coordinated statewide student assessment data, including the re-introduction of the Michigan Educational Assessment Program (MEAP) Access alternate assessment.
The CEPI enhanced the Michigan Student Data System to: o Provide data quality support in the collection of preschool outcomes data. o Enhance the ability for districts to verify discipline data in a secure
manner consistent with the Family Educational Rights and Privacy Act and Michigan’s Identity Theft Protection Act.
Collaborative work between the OSE and the CEPI transitioned public reporting to the MI School Data portal.
Public Sector Consultants assisted with the alignment of data elements feeding into the public reporting database, the Continuous Improvement and Monitoring System (CIMS) Workbook, and the Determinations data set.
Wayne State University’s Center for Urban Studies maintained data portals for local and state views of disproportionate representation, parent involvement and postsecondary outcomes data for the general public and through secure login for districts.
The HighScope Educational Research Foundation supported the analysis of preschool outcomes data.
Monitoring and Reporting The OSE continued its implementation of the CIMS. Electronic CIMS Workbooks were issued in August, December and April providing districts with information about their performance on key compliance and results indicators. Findings of

APR – Part B Michigan
Part B State Annual Performance Report for FFY 2012 (2012-2013) Overview Page 10 (OMB NO: 1820-0624 / Expiration Date: 7/31/2015)
noncompliance were issued through the CIMS Workbooks based on data reviews and focused monitoring activities. To ensure timely correction of findings, districts were required to submit corrective action plans (CAPs) within 45 days of findings being issued. The OSE reviewed and approved each CAP. Districts submitted progress reports per an established calendar and were required to request closure within the CIMS once all activities were completed and the districts indicated they were in compliance including student level CAPs. The OSE verified correction of noncompliance. Verification included correction of each individual case of noncompliance and a review of new data submissions or record reviews to determine whether or not the district was correctly implementing specific regulatory requirements and changes in their policies, procedures and practices. Districts were notified of the status of their CAPs within the CIMS Workbooks. Technical assistance was provided throughout the year to ensure correction of noncompliance as soon as possible but in no case later than one year, including verification (see Appendix C). State Complaints The OSE utilizes a single-tier complaint system. All state complaints are completed using this system. This single-tier system allows the ISDs and the OSE to jointly investigate complaints resulting in the opportunity to encourage and support the use of local resolution and methods of alternative dispute resolution. Revisions to the state complaint procedures were identified as being necessary to enhance the implementation of the due process system. State Complaint Procedures were developed and implemented, and changes to Michigan Administrative Rules for Special Education were promulgated with input from stakeholders to reflect the single-tier state complaint system and the Individuals with Disabilities Education Act (IDEA) regulations. The OSE is in the final testing stages of a new database that will track state complaints and integrate data more efficiently from state complaints, due process complaints and mediation. Mandated Activities Projects The OSE has developed a system to advance evidence-based practices in the field of education to support diverse learners. The OSE is currently funding 12 projects that address needs identified through new federal and/or state mandates, data analysis, systemic compliance findings, or stakeholder-based input. For detailed information, reference Appendix B. These projects are:
Center for Educational Networking (CEN) Continuous Improvement and Monitoring System (CIMS) Michigan Alliance for Families (MAF) Michigan Department of Education, Low Incidence Outreach (MDE-LIO) Michigan Special Education Mediation Program (MSEMP) Michigan Transition Outcomes Project (MI-TOP) Michigan's Integrated Behavior and Learning Support Initiative (MiBLSi)

APR – Part B Michigan
Part B State Annual Performance Report for FFY 2012 (2012-2013) Overview Page 11 (OMB NO: 1820-0624 / Expiration Date: 7/31/2015)
Michigan's Integrated Mathematics Initiative (MI2) Michigan's Integrated Technology Supports (MITS) Project Find Michigan Reaching and Teaching Struggling Learners (RTSL) Statewide Autism Resources and Training (START).
Collaboration Among Districts and State Entities Given federal expectations for increasing alignment between the Elementary and Secondary Education Act (ESEA) and the IDEA, the OSE, along with the MAPs, continued collaboration and coordination with districts and state agencies. The OSE continued to expand and improve communication systems with stakeholders involved in implementing the IDEA and the ESEA. For example, regular community-of-practice calls, webinars, and face-to-face meetings with ISD special education directors and monitors occurred throughout the year. The OSE, in partnership with organizations such as the Michigan Association of Administrators of Special Education5 and Michigan Pupil Accounting and Attendance Association, provided workshops and information at general membership meetings and through webinars. The OSE PR Monitoring and Technical Assistance Team has been collaborating with the MDE Office of Education Improvement & Innovation and the BAA to align school improvement activities within the school improvement framework. Public Reporting Michigan’s 2013 IDEA Public Reporting on the performance of individual districts on required indicators (Indicators 1-5 and 7-14) was accomplished through:
Collaboration with stakeholder groups—The OSE collaborated with groups such as the SEAC, the Michigan Alliance for Families6, and the OSE Data Advisory Committee regarding the content and format of the public reports.
Shared leadership with ISDs—The OSE collaborated with ISD personnel to provide information to district staff and the public.
General announcement—An MDE deputy superintendent sent a memorandum to all superintendents and PSA administrators announcing the availability of the public reports.
District preview of public reporting—The OSE ensured that districts had ample opportunity to preview the data. The preview period enabled districts to prepare communications for their communities and plans for improvement. A memorandum was sent to all special education listservs and the data were made available to the public.
Media advisory—The MDE’s Office of Communications distributed a media advisory announcing the availability of public reporting.
Posting on the MDE website at www.michigan.gov/ose-eis. During the last week in May of 2013, the OSE posted individual districts’ performance on the required indicators with comparisons to state or federal targets and state performance. This posting also provided the opportunity to easily view district performance across all indicators in a spreadsheet or PDF.
5 Michigan’s state affiliate of the National Council of Administrators of Special Education and the Council for Exceptional Children. 6 Michigan’s Parent Training and Information Center.
APR – Part B Michigan
Part B State Annual Performance Report for FFY 2012 (2012-2013) Overview Page 12 (OMB NO: 1820-0624 / Expiration Date: 7/31/2015)
As of September 30, 2012, the Michigan Compliance Information System was decommissioned.
Public reporting on Michigan’s performance was supplemented by posting the current APR on the MDE website.


APR – Part B Michigan
Part B State Annual Performance Report for FFY 2012 (2012-2013) Indicator 1 Page 14 (OMB NO: 1820-0624 / Expiration Date: 7/31/2015)
Part B State Annual Performance Report (APR) for FFY 2012 (2012-2013) Overview of Indicator 1 (Graduation) Report Development: 1. See General Overview pages 6-12. 2. The Office of Special Education (OSE) staff, Performance Reporting Unit, and the
Indicator Team conducted substantive changes in the State Performance Plan (SPP)/APR improvement process of both Indicator 1 and 2. Work occurring in FFY 2012 emphasized data utility and stronger linkages between activities and impact on students which is further explained in this report.
Monitoring Priority: FAPE in the LRE7/Graduation (Results Indicator)
Indicator 1: Percent of youth with an IEP graduating from high school with a regular diploma. (20 U.S.C. 1416 (a)(3)(A))
Measurement: States must report using the adjusted cohort graduation rate required under the ESEA.
7 Free Appropriate Public Education in the Least Restrictive Environment.

APR – Part B Michigan
Part B State Annual Performance Report for FFY 2012 (2012-2013) Indicator 1 Page 15 (OMB NO: 1820-0624 / Expiration Date: 7/31/2015)
Measurable and Rigorous Targets
FFY Baseline Target Actual
Calculations using Leaver Graduation Rate Methodology
2004 69.7%
2005 >80.0% 70.6%
2006 >80.0% 69.0%
2007 >80.0% 69.3% Calculations using Cohort Four-Year Graduation Rate Methodology
and the Office of Special Education Programs (OSEP) Prescribed One Year Data Lag
2008 (using 2007-2008 school year data)
58.0% >80.0% 58.0%
2009 (using 2008-2009 school year data)
>80.0% 57.3%
2010 (using 2009-2010 school year data)
>80.0% 57.4%
2011 (using 2010-2011 school year data)
>80.0% 51.9%
2012 (using 2011-2012 school year data)
>80.0% 53.5%*
Percent = [(# of youth with an IEP who entered ninth grade in 2008-2009 and received a regular diploma within four years) divided by the (total # of youth with an IEP in the cohort)] times 100.
*[8,205 ÷ 15,332] X 100 Source: Single Record Student Database, Michigan Student Data System, Graduation/Dropout Review and Comment Application
Explanation of Progress or Slippage that occurred for FFY 2012: Michigan did not meet its FFY 2012 graduation rate target of 80 percent or greater. The four-year cohort graduation rate for FFY 2012 was 53.5 percent. While this rate did not meet the 80 percent target, it is a 1.6 percent increase over FFY 2011. Further analysis of graduation rates showed an improvement in the three-year trend for students who remained in school for a fifth year; 61.2 percent of the fifth-year students with an IEP graduated in June 2012.

APR – Part B Michigan
Part B State Annual Performance Report for FFY 2012 (2012-2013) Indicator 1 Page 16 (OMB NO: 1820-0624 / Expiration Date: 7/31/2015)
Although there was an incremental increase in the four-year cohort graduation rate, there remains a need for improvement to meet the target. The OSE is critically analyzing multiple variables that can reliably identify Michigan students at-risk of dropping out or likely to graduate. The OSE has created a set of revised improvement activities to strengthen the capacity of educators to use data to inform decisions that lead to improved opportunities and student outcomes. Discussion of Improvement Activities Completed:
Timelines Activities Status
PROVIDE TECHNICAL ASSISTANCE
2011-2013 1. Use graduation, dropout, secondary transition and postsecondary outcomes data to develop and implement technical assistance (TA) and personnel development to increase graduation rate.
Reference Improvement Activity details below.
Improvement Activity 1 Details:
In fall 2012, Michigan required Priority and Focus schools to participate in the Superintendent’s Dropout Challenge as an activity of Michigan’s ESEA flexibility waiver (https://www.michigan.gov/mde/0,4615,7-140-37818_60094---,00.html). Michigan Department of Education (MDE) staff distributed two surveys; sent in January and May. Staff in these schools were encouraged to report on their use of the early warning signs to identify youth, including students with an IEP, at risk for dropout and disengagement. The early warning signs data, promoted by the National High School Center (www.betterhighschools.org), is a set of metrics that identify student risk factors in the areas of attendance, behavior, and course proficiency, which are predictive of both negative exits and on-time graduations. In addition, staff reported their use of any and/or all of the six Institute for Education Sciences (IES) Practice Guide for Dropout Prevention Recommendations which can be found at the following: http://www.michigan.gov/documents/mde/IES_Dropout_Practice_Guide_293427_7.pdf. In the January 2013 survey, 269 schools reported (99 percent response rate) the following top ten student dynamics in which they intervened:
poor course proficiency/low grades family related factors lack of classroom participation attendance related factors repeated behavior referrals peer pressure leading to poor decision making psychological issues lack of connections with classmates frequent suspension/expulsions lack of access to specific interventions.

APR – Part B Michigan
Part B State Annual Performance Report for FFY 2012 (2012-2013) Indicator 1 Page 17 (OMB NO: 1820-0624 / Expiration Date: 7/31/2015)
Timelines Activities Status
The May 2013 survey of all Priority and Focus schools revealed the following IES recommendations by their percentage of use:
Longitudinal Data: 53% were using school data to identify their students with risks of dropout.
Adult Advocate: 45% were employing an adult advocate to help their students.
Academic Enrichment and Supports: 66% were giving specific academic supports.
Classroom Behavior and Social Supports: 50% used positive behavior supports with their students.
Personalized Learning: 50% were encouraging classroom participation to engage students at risk.
Rigorous and Relevant Learning: 54% were offering classroom management supports.
This first year of survey data provides multiple opportunities to target assistance to buildings and districts in need of increasing graduation rates and other positive outcomes for students with an IEP. Targeted TA for Priority and Focus schools’ efforts to use data and dropout prevention strategies is consistent with OSE’s developing a TA system to support students with an IEP to be career and college ready. Michigan’s Integrated Behavior and Learning Support Initiative (MiBLSi) is an OSE and OSEP funded project that provides educators with professional development (PD) and TA in a schoolwide, integrated behavior and reading multi-tiered system of support (MTSS). The project collaborated with intermediate school districts (ISDs) (which also serve public school academies) and local educational agencies to develop infrastructures so that the practices can be implemented with fidelity and will endure over time. MiBLSi provided educators with access to scientifically based reading instruction practices to prevent reading failure so students are successful in school as they move through grade levels toward graduation. Additionally, educators applied Positive Behavioral Interventions and Supports (PBIS) to recover instructional time previously lost to discipline issues and created positive learning environments for successful student engagement. Throughout this process, school and district teams used data for decision making in selecting and improving effective practices based on need. The Michigan Transition Outcomes Project (MI-TOP) focused on the development of activities that improved students’ success in achieving a diploma and being career and college ready. MI-TOP conducted eight additional (total of 16) focus groups to identify challenges and practices related to the postsecondary transition of youth. This data was designed to guide future transition supports throughout the state. An ISD specific report was prepared for each focus group. This profile included information regarding local performance on Indicators 1 (Graduation), 2 (Dropout),

APR – Part B Michigan
Part B State Annual Performance Report for FFY 2012 (2012-2013) Indicator 1 Page 18 (OMB NO: 1820-0624 / Expiration Date: 7/31/2015)
Timelines Activities Status 13 (Secondary Transition) and 14 (Postsecondary Outcomes). In addition, the updated data report titled “Fast Facts” combined academic and economic data so that focus group members could discuss conditions of transition readiness for students to live, learn and work after exiting from school. This data facilitated the conversations more likely to increase resource capacity and to support students who may be at risk of not completing high school. MI-TOP also reviewed the interagency agreement between The Michigan Rehabilitation Services (MRS) and the MDE to ensure the alignment of the language of the Individuals with Disabilities Education Act and the Vocational Rehabilitation Act at the local level. MI-TOP provided professional development and TA opportunities to education and vocational service professionals (MRS and Bureau of Services for Blind Persons). This resulted in an increase in resource sharing and local collaborative agreements that improved services to youth. This collaborative work often led to increased career experiences for students prior to high school exit, a practice which positively correlates with graduation (Benz et al., 2000), (Carter et al., 2010), (Carter et al., 2011). 2011-2013 2. Provide sustained building level
personnel development using available district/building level data to increase graduation rate.
Reference Improvement Activity details below.
Improvement Activity 2 Details:
Schools participating with MiBLSi, as part of Cohort 7, finished their third and final year of the formal training sequence during the 2012-2013 school year. The following data depicts implementation fidelity and student outcomes for schools participating in the school-level model. MiBLSi has worked primarily with elementary schools as a method for preventing school dropout through early intervention. When schools help students become successful both academically and socially/behaviorally early on, they are more likely to matriculate through secondary school with their classmates, thereby increasing their chances to graduate.
PBIS fidelity data, discipline referral data, and out-of-school suspension data were gathered from the PBIS Evaluation for schools that participated with MiBLSi and reflected data from all students enrolled in a school that has voluntarily participated with MiBLSi. Reading outcome data were gathered from the Dynamic Indicators of Basic Early Literacy Skills (DIBELS) Data System or requested directly from schools participating with MiBLSi.
The Benchmarks of Quality (BOQ) is a team self-assessment used to evaluate the extent to which universal PBIS is being implemented. A total score of 70 percent on the BOQ (criterion total) indicates a minimum threshold or implementation fidelity of schoolwide PBIS. Schools with total scores below 70 percent may not see improvements in student behavior because a score below 70 percent is one

APR – Part B Michigan
Part B State Annual Performance Report for FFY 2012 (2012-2013) Indicator 1 Page 19 (OMB NO: 1820-0624 / Expiration Date: 7/31/2015)
Timelines Activities Status indicator that a school is not implementing schoolwide PBIS with fidelity. There were 180 schools that submitted BOQ data during the 2012-2013 school year. For these 180 schools, the mean BOQ total score was 78 percent. Seventy-eight percent of schools met or exceeded the BOQ criterion total score of 70 percent.
Discipline Referrals: For schools that met criterion on the BOQ, the mean rate of discipline referrals per 100 students per day was 0.48. The median rate of discipline referrals for schools that did not meet criterion on the BOQ was 0.68. This demonstrates that schools implementing PBIS with fidelity had lower rates of problem behaviors than schools not implementing PBIS with fidelity.
Reading Achievement: For schools that met or exceeded criterion on the BOQ, the mean percent of students that were on track in the area of reading was 65 percent compared to only 53 percent in schools that did not meet criterion on the BOQ.
The above data demonstrates the positive outcomes achieved by schools participating with MiBLSi when those schools are implementing PBIS with fidelity. MiBLSi plans to evaluate the impact on student outcomes when schools implement an integrated model of MTSS (behavior and reading) and when districts and ISDs have the internal capacity to support and sustain implementation of MTSS. At the district level, MI-TOP facilitated local district participation in focus groups and continued to assure that local transition coordinators know how to use data to plan for transition. Over 90 percent of ISD transition coordinators had participated in leadership TA and PD. In addition, there has been an increase in local transition coordinators collaborating with their local MRS agencies. 2011-2013 3. Provide policy and data guidance to
support a long-term, outcomes-based approach to student-centered planning.
During the 2012-2013 school year, at each of the three MI-TOP workshops, leadership provided ongoing data guidance and updates on the planned transition data portal, and integrated district level graduation, dropout and college enrollment information. Transition coordinators received their own updated ISD level “Fast Facts” data reports that began to include specific data about resource sharing and MRS outcomes.

APR – Part B Michigan
Part B State Annual Performance Report for FFY 2012 (2012-2013) Indicator 1 Page 20 (OMB NO: 1820-0624 / Expiration Date: 7/31/2015)
Revisions, with Justification, to Proposed Targets / Improvement Activities / Timelines / Resources for FFY 2012
Timelines New and Revised Activities Justification PROVIDE TECHNICAL ASSISTANCE
2011-2013 Deletion of Activity #1: Use graduation, dropout, secondary transition and postsecondary outcomes data to develop and implement technical assistance and personnel development to increase graduation rate.
Activity has been completed.
2013-2014 Revision of Activity #2: Leverage community and state level resources to provide districts with targeted assistance and professional development to increase graduation rates of students with an IEP.
Activity #2 focused on sustained building level professional development targeted assistance. The OSE is redesigning the TA and Professional Development system to provide targeted supports to ISDs and districts whose data indicate a need for assistance in increasing graduation rates. The ultimate goal being that students with an IEP will be career and college ready.
New Additional Resources: MAPS projects, ISDs, MDE, Superintendent’s Dropout Challenge, state and community human service agencies
2013-2014 New Activity: Develop and test a model using state level student data that can reliably identify students at risk of dropping out and students likely to graduate.
Michigan’s graduation rate has not met state standards and large numbers of students with an IEP continue to drop out-of-school. One of the first steps in improving the performance on the indicator is to identify those students that are at risk of not graduating and/or dropping out.
Resources: MDE; Department of Technology, Management and Budget; National Dropout Prevention Center for Students with Disabilities
2013-2014 New Activity: Disseminate the risk and protective factors associated with students with an IEP that emerged as a result of the data model described in the new activity above so that districts can assist students to matriculate through secondary school with their classmates toward graduation.
This data model will be based on Michigan data, although the underling measures are based on national research. Districts are more likely to have confidence in the findings since the factors are based on Michigan students.
Resources: MDE; Department of Technology, Management and Budget
APR – Part B Michigan
Part B State Annual Performance Report for FFY 2012 (2012-2013) Indicator 1 Page 21 (OMB NO: 1820-0624 / Expiration Date: 7/31/2015)
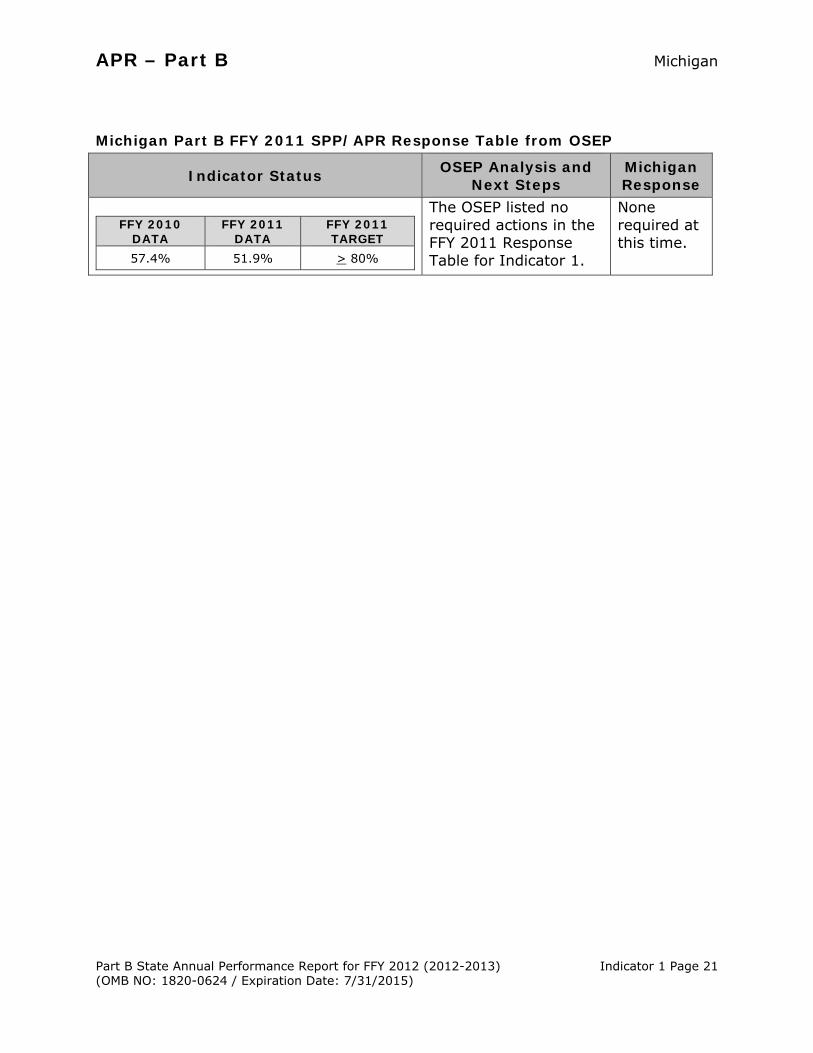
Michigan Part B FFY 2011 SPP/APR Response Table from OSEP
Indicator Status OSEP Analysis and Next Steps
Michigan Response
FFY 2010 DATA
FFY 2011 DATA
FFY 2011 TARGET
57.4% 51.9% > 80%
The OSEP listed no required actions in the FFY 2011 Response Table for Indicator 1.
None required at this time.

APR – Part B Michigan
Part B State Annual Performance Report for FFY 2012 (2012-2013) Indicator 2 Page 22 (OMB NO: 1820-0624 / Expiration Date: 7/31/2015)
Part B State Annual Performance Report (APR) for FFY 2012 (2012-2013)
Overview of Indicator 2 (Dropout) Report Development: 1. See General Overview pages 6-12. 2. Michigan’s State Performance Plan (SPP) Extension contains a detailed
description of how the event dropout rate is calculated. The event rate reported in Indicator 2 is based on a different set of business rules than those used to report EDFacts data.
3. The Office of Special Education (OSE) staff, Performance Reporting Unit, and the Indicator Team conducted substantive changes in the State Performance Plan (SPP)/APR improvement process of both Indicator 1 and 2. Work occurring in FFY 2012 emphasized data utility and stronger linkages between activities and impact on students which is further explained in this report.
4. The Superintendent’s Dropout Challenge became a requirement of Michigan’s Elementary and Secondary Education Act (ESEA) flexibility waiver, impacting 269 Priority and Focus elementary, middle, and high schools needing to improve achievement and/or close their achievement gaps. The high schools in this group received multi-tiered targeted technical assistance to decrease their dropout rates for all students, including students with an IEP, as they work through the flex waiver accountability system.
Monitoring Priority: FAPE in the LRE8/Dropout (Results Indicator)
Indicator 2: Percent of youth with an individualized education program (IEP) dropping out of high school. (20 U.S.C. 1416 (a)(3)(A))
Measurement: States must report a percentage using the number of youth with an IEP (ages 14-21) who exited special education due to dropping out in the numerator and the number of all youth with an IEP who left high school (ages 14-21) in the denominator.
8 Free Appropriate Public Education in the Least Restrictive Environment

APR – Part B Michigan
Part B State Annual Performance Report for FFY 2012 (2012-2013) Indicator 2 Page 23 (OMB NO: 1820-0624 / Expiration Date: 7/31/2015)
Measurable and Rigorous Targets
FFY Baseline Target Actual
Calculations using Leaver Dropout Rate Methodology
2004 25.5%
2005 <13.0% 25.2%
2006 <11.5% 28.9%
2007 <10.0% 28.1% Calculation using CSPR Event Dropout Rate Methodology9, and using the Office of
Special Education Programs (OSEP’s) Prescribed One Year Data Lag
2008 (using 2007-2008 school year
data) 7.6% <10.0% 7.6%
2009 (using 2008-2009 school year
data) <9.5% 7.2%
2010 (using 2009-2010 school year
data) <9.0% 6.1%
2011 (using 2010-2011 school year
data) <8.0% 9.5%
2012 (using 2011-2012 school year
data) <8.0% 9.4%*
Percent = [(# of youth with an IEP who dropped out of high school in one year) divided by the (# of youth with an IEP who were enrolled in grades 9-12 in the same year)] times 100. This includes students ages 14-21 who were in ungraded programs and matched by age to grades 9-12.
*[5,899 ÷ 62,922] X 100 Source: Michigan Student Data System, Graduation and Dropout Review and Comment Application Explanation of Progress or Slippage that occurred for FFY 2012: Michigan did not meet its FFY 2012 target of 8 percent or less for youth with an IEP who dropped out-of-school. The 9.4 percent dropout event rate is a one-year snapshot of students with an IEP who dropped out during the 2011-2012 school
9 The new methodology makes the two rates not comparable.

APR – Part B Michigan
Part B State Annual Performance Report for FFY 2012 (2012-2013) Indicator 2 Page 24 (OMB NO: 1820-0624 / Expiration Date: 7/31/2015)
year. The event rate decreased from the previous year’s rate of 9.5 percent. This decrease of the event rate, although small, is an encouraging sign. The data analysis described in Improvement Activities 1 and 4 will reveal patterns of student need to which the OSE can direct more targeted resources. By targeting resources, we will decrease the likelihood that students with an IEP will drop out and will be more career and college ready. Discussion of Improvement Activities Completed:
Timelines Activities Status
PROVIDE TECHNICAL ASSISTANCE
2011-2013 1. Use graduation, dropout, secondary transition and postsecondary outcomes data to develop and implement technical assistance (TA) and personnel development to increase graduation rates and decrease dropout rates.
Reference Improvement Activity details below.
Improvement Activity 1 Details:
The Indicator Team for Graduation and Dropout facilitated the analysis of the data for students that did not graduate in the 2011-2012 school year. The top disability categories of students who dropped out are listed in the following order: emotional impairment, cognitive impairment, specified learning disability and other health impaired. This pattern is consistent with national research that students with ‘high incidence’ disabilities drop out more frequently (Dr. Mindee O’Cummings previously at National High School Center), now known as the American Institute for Research (AIR) Career and College Readiness Center at http://www.air.org/focus-area/education/?id=141. In Michigan, freshman students with an IEP left school more frequently than their classmates in tenth, eleventh and twelfth grade. This is consistent with the research that the freshman year in high school is a critical year to monitor vulnerable youth (Dr. Elaine Allensworth at the University of Chicago Consortium of School Research http://ccsr.uchicago.edu; Dr. Ruth Curran Neild, overseer of the What Works Clearinghouse system http://ies.ed.gov/ncee/wwc/). Among all racial groups with a minimum cell size of 100 students, Black, Hispanic and White students had the highest rates of dropout. Racial disparities are a top priority for Michigan to address. In addition, Black males and White males left school at twice the rate of their female counterparts. The result of these analyses highlighted the need for deeper exploration of the data and to strengthen Michigan’s improvement efforts. During the 2012-2013 school year, the OSE staff participated in the Michigan Department of Education’s (MDE) Closing the Achievement Gap effort to improve outcomes for Black males. Since the racial opportunity gaps for Black students with an IEP were similar to their general education peers, cross office data sharing and reports on these disparities were produced and distributed within the office and to key stakeholders in the field. The Great Lakes Comprehensive Center staff worked

APR – Part B Michigan
Part B State Annual Performance Report for FFY 2012 (2012-2013) Indicator 2 Page 25 (OMB NO: 1820-0624 / Expiration Date: 7/31/2015)
Timelines Activities Status with the OSE to identify patterns of dropout, suspension/expulsion, and achievement
issues so that educators could mediate these differences. In spring 2013, pilot schools participated in culturally responsive activities that included recommendations from Dr. Ivory Toldson’s work, “Breaking Barriers”. As Toldson suggests, “schools agreed to systematically call home with positive reports regarding how their Black male students were performing in school.” The collection of this and other work is available at the following MDE website: http://www.michigan.gov/mde/0,4615,7-140-6530_30334_33229-297206--,00.html. The cumulative effect of race, poverty, and gender, in addition to the fact that students with an IEP are often not prepared for high school in their freshman year, requires educators to develop a deeper analysis of three areas: 1) the data-based antecedents of dropout, 2) usable and accessible dropout prevention strategies, and 3) a commitment to review school discipline policies that may unintentionally push out students with an IEP. In terms of suspension/expulsion and adult decision-making, the 2011-2012 school year data revealed that 15.5 percent of students with an IEP, receiving one to ten days of out-of-school suspensions, dropped out and 16.4 percent of students with an IEP, receiving more than ten days of out-of-school suspensions, dropped out. The relationship between the percentages for in-school suspensions and dropout rates is similar to the out-of-school data (16.5 percent dropped out with one to ten days and 20.1 percent dropped out with more than ten days). The OSE and the Mandated Activities Projects (MAPs)10 are continuing to pursue activities that will reduce the number of suspensions that Black students with an IEP receive. Activities in development include increased parent engagement, increased access to restorative justice practices and positive behavior supports. Two MAPs, Reaching and Teaching Struggling Learners (RTSL) and Michigan’s Integrated Behavior and Learning Support Initiative (MiBLSi) provided early warning sign data training in the state. The early warning signs, promoted by the National High School Center (www.betterhighschools.org), are a set of metrics that identify student risk factors, in the areas of attendance, behavior and course proficiency, which are predictive of both negative exits and on-time graduations. Intermediate and local school districts in Ingham, Clinton, Shiawassee, Eaton and Kalamazoo counties requested and were provided TA in how to predict risk of dropout based on attendance, office disciplinary referrals, grade point average and course failures in ninth grade. All of these metrics are relevant to the data patterns described in the observations found by the OSE indicator team mentioned above. The Superintendent’s Dropout Challenge team participated in a multitude of presentations to districts and statewide conferences to support districts in use of the
10 Michigan’s state improvement and compliance initiatives, funded with the Individuals with Disabilities Education Act (IDEA) administrative set-aside funds.

APR – Part B Michigan
Part B State Annual Performance Report for FFY 2012 (2012-2013) Indicator 2 Page 26 (OMB NO: 1820-0624 / Expiration Date: 7/31/2015)
Timelines Activities Status early warning signs to monitor and provide appropriate supports for students who
exhibited early warning signs. At the district level, this TA focused on Priority Schools11 and Focus Schools12 between high- and low-achieving students within a school. All Focus Schools must close their achievement gaps by developing and implementing strategies to support students in the bottom 30 percent. Additionally, training in the early warning signs was incorporated into a corrective action in a state complaint in which the district used the early warning signs to identify students at risk of dropping out and conducted educational benefit reviews for these students to ensure they were receiving the appropriate programs and services within their IEP. MiBLSi is a MDE, OSE and OSEP funded project that provides educators with professional development (PD) and TA in a schoolwide, integrated behavior and reading multi-tiered system of support (MTSS). The project collaborates with intermediate school districts (ISDs), public school academies and local educational agencies to develop infrastructures so that the practices can be implemented with fidelity and will endure over time. MiBLSi addresses dropout and graduation rates of students with an IEP by providing educators with access to scientifically based reading instruction to prevent reading failure so students are successful in school as they move through grade levels. Additionally, educators applied Positive Behavioral Interventions and Supports (PBIS) to recover instructional time previously lost to discipline issues and created positive learning environments for successful student engagement. Throughout this process, school and district teams used data for decision making in selecting and improving effective practices based on need. The Michigan Transition Outcomes Project (MI-TOP) focused on development of activities to decrease students’ risk for dropout, successfully achieve a diploma and be career and college ready. MI-TOP conducted 8 additional (total of 16) focus groups to identify challenges and practices related to the postsecondary transition of youth. This data was designed to guide future transition supports throughout the state. An ISD data report was prepared for each focus group. This profile included information regarding local performance on Indicators 1 (Graduation), 2 (Dropout), 13 (Secondary Transition) and 14 (Postsecondary Outcomes). In addition, the updated data report titled “Fast Facts” combined academic and economic data so that focus group members could discuss conditions of transition readiness for students to live, learn and work post-exit from school. This data facilitated the conversations more likely to increase resource capacity and to support students who may be at risk of dropping out.
11 Priority Schools are those in the bottom five percent of schools on the state’s Top to Bottom list. These schools are placed under the supervision of MDE’s School Reform/Redesign Office and are required to submit redesign plans that include one of the four school intervention models identified by the federal government. 12 Focus Schools are designated as schools with the largest gaps in student results as identified by statewide assessments.

APR – Part B Michigan
Part B State Annual Performance Report for FFY 2012 (2012-2013) Indicator 2 Page 27 (OMB NO: 1820-0624 / Expiration Date: 7/31/2015)
Timelines Activities Status While all of the activities above are aligned with research and substantiated by the
2011-2012 school year student level exit data, the data model created in the revised Improvement Activity 4 should provide greater direction linking other indicators connected to graduation and dropout. 2011-2013
2. Provide sustained building level personnel development using available district/ building level data to increase graduation rates and decrease dropout rates.
Reference Improvement Activity details below.
Improvement Activity 2 Details:
Schools participating with MiBLSi as part of Cohort 7 finished their third and final year of the formal training sequence with MiBLSi during the 2012-2013 school year. The following data depicts implementation fidelity and student outcomes for schools participating in the school-level model. The majority of these data are from elementary schools. MiBLSi has worked primarily with elementary schools as a method for preventing school dropout through early intervention. When schools help students become successful both academically and socially/behaviorally early on, they are more likely to matriculate through secondary school with their classmates, thereby increasing graduation rates. PBIS fidelity data, discipline referral data, and out-of-school suspension data were gathered from the PBIS Evaluation for schools that participated with MiBLSi and should reflect data from all students enrolled in a school that has voluntarily participated with MiBLSi. Reading outcome data were gathered from the Dynamic Indicators of Basic Early Literacy Skills Data System (DIBELS) or requested directly from schools participating with MiBLSi. The Benchmarks of Quality (BOQ) is a team self-assessment used to evaluate the extent to which universal PBIS is being implemented. A total score of 70 percent on the BOQ (criterion total) indicates a minimum threshold or implementation fidelity of schoolwide PBIS. Schools with total scores below 70 percent may not see improvements in student behavior because a score below 70 percent is one indicator that a school is not implementing schoolwide PBIS with fidelity. There were 180 schools that submitted BOQ data during the 2012-2013 school year. For these 180 schools, the mean BOQ total score was 78 percent. Seventy-eight percent of schools met the BOQ criterion total score of 70 percent. Discipline Referrals: For schools that met criterion on the BOQ, the mean rate of discipline referrals per 100 students per day was 0.48. The median rate of discipline referrals for schools that did not meet criterion on the BOQ was 0.68. This demonstrates that schools implementing PBIS with fidelity had lower rates of problem behaviors than schools not implementing PBIS with fidelity. Out-of-School Suspensions: For schools that met criterion on the BOQ, the average percent of all students with at least one out-of-school suspension was 5 percent. On average, 12 percent of all students were suspended in schools that did not meet

APR – Part B Michigan
Part B State Annual Performance Report for FFY 2012 (2012-2013) Indicator 2 Page 28 (OMB NO: 1820-0624 / Expiration Date: 7/31/2015)
Timelines Activities Status criterion on the BOQ. This demonstrates that schools implementing PBIS with fidelity
suspended a smaller proportion of students than schools not implementing PBIS with fidelity. Reading Achievement: For schools that met criterion on the BOQ, the mean percent of students that were reading at grade level was 65 percent compared to only 53 percent in schools that did not meet criterion on the BOQ. The above data demonstrates the positive outcomes achieved by schools participating with MiBLSi when those schools are implementing PBIS with fidelity. MiBLSi plans to evaluate the impact on student outcomes when schools implement an integrated model of behavior and reading and when districts and ISDs have the internal capacity to support and sustain implementation of MTSS. At the district level, MI-TOP facilitated local district participation in focus groups and continued to assure that local transition coordinators know how to use data to plan for transition. Over 90 percent of ISD transition coordinators had participated in leadership TA and PD. In addition, there has been an increase in local transition coordinators collaborating with their local MRS agencies. 2011-2013 3. Provide policy and data guidance to
support a long-term, outcomes-based approach to student-centered planning.
During the 2012-2013 school year, at each of the three MI-TOP workshops, leadership provided ongoing TA related to effective uses of data and updates on the planned transition data portal. They also provided integrated district level graduation, dropout and college enrollment information. Transition coordinators received their own updated ISD level “Fast Facts” data reports that began to include specific data about resource sharing and MRS outcomes.
EVALUATION
2012-2013 4. Determine if there is a combination of student level data collected by the state that can reliably identify students at risk of dropping out and students likely to graduate.
Reference Improvement Activity details below.
Improvement Activity 4 Details:
The Indicator and Performance Reporting unit team created the business rules for the data model and mapped the fields of Michigan Student Data System (MSDS) in order to build a tool which could predict which students with an IEP were matriculating through secondary school with their classmates toward graduation and

APR – Part B Michigan
Part B State Annual Performance Report for FFY 2012 (2012-2013) Indicator 2 Page 29 (OMB NO: 1820-0624 / Expiration Date: 7/31/2015)
Timelines Activities Status those that were delayed, as well as, identify students with an IEP at risk for
dropping out. The team identified the MSDS fields that best match the model: student characteristics, district configurations and school programs. The model is informed by the early warning signs research that uses attendance, behavior and achievement data. Other variables such as poverty, mobility, access to the general education environment, and participation in federal programs such as those for students who are homeless, eligible for migrant services, and received Limited English Proficiency services were fields added to this model. Analysis of data spanned the time period of students with an IEP who were the first graduates under the rigorous requirements of the Michigan Merit Curriculum (MMC). These students were freshmen in 2008 and were likely to graduate with their four-year cohort in 2012. Information about the MMC are available at: http://www.michigan.gov/documents/mde/New_MMC_one_pager_11.15.06_183755_7.pdf Once the student population was defined, the team determined which exits to include so that the unique patterns of school completion for students with an IEP could be observed. Graduation data already indicates higher rates of completion in the fifth year. Consideration of all exits could inform the team if this extra year or years impacted students with an IEP. Exit questions the team considered were: access to quality transition; access to career and technical education; enrollment in a high school with high “promoting power”, and engaging in early educational development planning. The team will continue to develop the model and then study the patterns of graduation and dropout in order to identify predictors of risk and protective factors for students with an IEP in Michigan. Revisions, with Justification, to Proposed Targets / Improvement Activities / Timelines / Resources for FFY 2012
Timelines New and Revised Activities Justification
PROVIDE TECHNICAL ASSISTANCE 2011-2013 Deletion of Activity #1: Use
graduation, dropout, secondary transition and postsecondary outcomes data to develop and implement technical assistance and personnel development to increase graduation rate.
Activity has been completed.
2011-2014 Revision of Activity #2: Leverage community and state level resources to provide districts with targeted assistance and
Activity #2 focused on sustained building level professional development and targeted TA. The OSE is redesigning the TA and

APR – Part B Michigan
Part B State Annual Performance Report for FFY 2012 (2012-2013) Indicator 2 Page 30 (OMB NO: 1820-0624 / Expiration Date: 7/31/2015)
Timelines New and Revised Activities Justification
professional development to increase graduation rates of students with an IEP.
Professional Development system to provide targeted supports to ISDs and districts whose data indicate a need for assistance in decreasing dropout rates for students with an IEP. The ultimate goal being that students with an IEP will be career and college ready.
New Additional Resources: MAPs projects, ISDs, MDE, Superintendent’s Dropout Challenge, state and community human service agencies
EVALUATION
2011-2014 Revision of Activity #4: Develop and test a model using state level student data that can reliably identify students at risk of dropping out and students likely to graduate.
Michigan has not met its target for dropout. One of the first steps in improving the performance on the indicator is to identify those students that are at risk of not graduating and/or dropping out.
New Additional Resources: National Dropout Prevention Center for Students with Disabilities
PROVIDE TRAINING/PROFESSIONAL DEVELOPMENT
2013-2014 New Activity: Disseminate the risk and protective factors associated with students with an IEP that emerged as a result of the data model described in activity four so that districts can assist students to matriculate through secondary school with their classmates toward graduation.
This data model will be based on Michigan data, although the underling measures are based on national research. Districts are more likely to have confidence in the findings since the factors are based on Michigan students.
Resources: MDE, Department of Technology, Management & Budget
Michigan Part B FFY 2011 SPP/APR Response Table from OSEP
Indicator Status OSEP Analysis and
Next Steps Michigan Response
FFY 2010 DATA
FFY 2011 DATA
FFY 2011 TARGET
6.1% 9.5% < 8.0%
The OSEP listed no required actions in the FFY 2011 Response Table for Indicator 2.
None required at this time.

APR – Part B Updated 4-23-14 Michigan
Part B State Annual Performance Report for FFY 2012 (2012-2013) Indicator 3 Page 32 (OMB NO: 1820-0624 / Expiration Date: 7/31/2015)
Part B State Annual Performance Report (APR) for FFY 2012 (2012-2013)
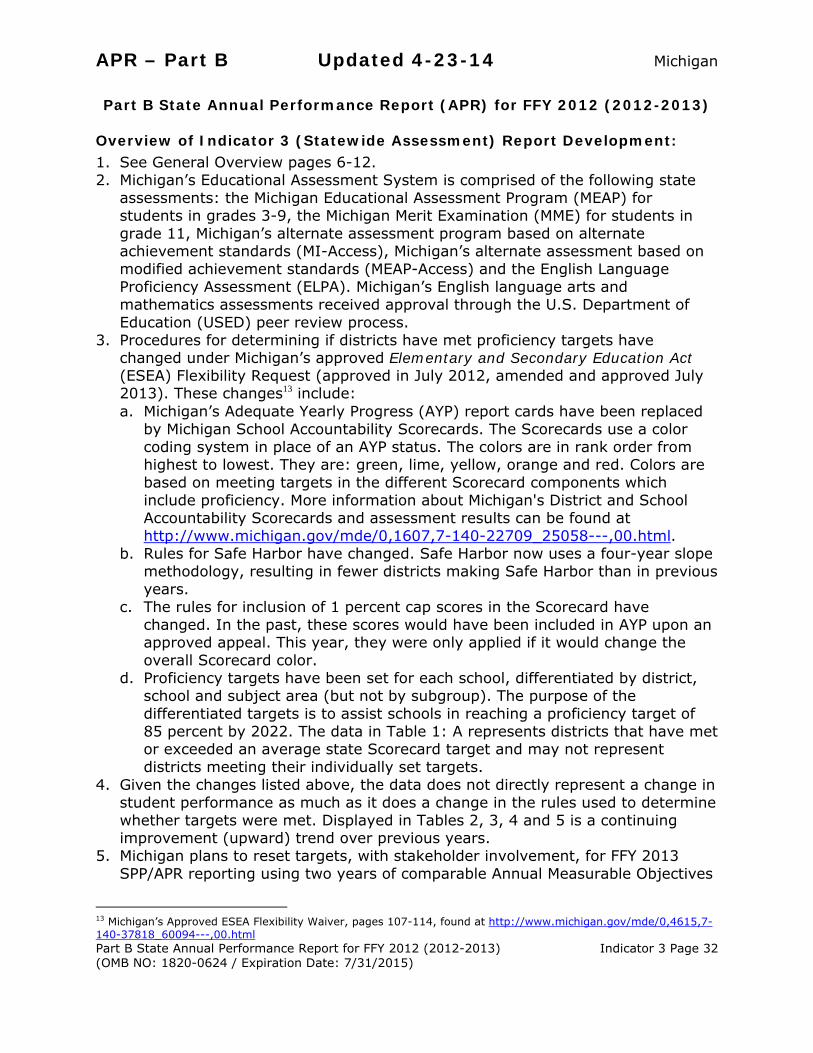
Overview of Indicator 3 (Statewide Assessment) Report Development: 1. See General Overview pages 6-12. 2. Michigan’s Educational Assessment System is comprised of the following state
assessments: the Michigan Educational Assessment Program (MEAP) for students in grades 3-9, the Michigan Merit Examination (MME) for students in grade 11, Michigan’s alternate assessment program based on alternate achievement standards (MI-Access), Michigan’s alternate assessment based on modified achievement standards (MEAP-Access) and the English Language Proficiency Assessment (ELPA). Michigan’s English language arts and mathematics assessments received approval through the U.S. Department of Education (USED) peer review process.
3. Procedures for determining if districts have met proficiency targets have changed under Michigan’s approved Elementary and Secondary Education Act (ESEA) Flexibility Request (approved in July 2012, amended and approved July 2013). These changes13 include: a. Michigan’s Adequate Yearly Progress (AYP) report cards have been replaced
by Michigan School Accountability Scorecards. The Scorecards use a color coding system in place of an AYP status. The colors are in rank order from highest to lowest. They are: green, lime, yellow, orange and red. Colors are based on meeting targets in the different Scorecard components which include proficiency. More information about Michigan's District and School Accountability Scorecards and assessment results can be found at http://www.michigan.gov/mde/0,1607,7-140-22709_25058---,00.html.
b. Rules for Safe Harbor have changed. Safe Harbor now uses a four-year slope methodology, resulting in fewer districts making Safe Harbor than in previous years.
c. The rules for inclusion of 1 percent cap scores in the Scorecard have changed. In the past, these scores would have been included in AYP upon an approved appeal. This year, they were only applied if it would change the overall Scorecard color.
d. Proficiency targets have been set for each school, differentiated by district, school and subject area (but not by subgroup). The purpose of the differentiated targets is to assist schools in reaching a proficiency target of 85 percent by 2022. The data in Table 1: A represents districts that have met or exceeded an average state Scorecard target and may not represent districts meeting their individually set targets.
4. Given the changes listed above, the data does not directly represent a change in student performance as much as it does a change in the rules used to determine whether targets were met. Displayed in Tables 2, 3, 4 and 5 is a continuing improvement (upward) trend over previous years.
5. Michigan plans to reset targets, with stakeholder involvement, for FFY 2013 SPP/APR reporting using two years of comparable Annual Measurable Objectives
13 Michigan’s Approved ESEA Flexibility Waiver, pages 107-114, found at http://www.michigan.gov/mde/0,4615,7-140-37818_60094---,00.html

APR – Part B Updated 4-23-14 Michigan
Part B State Annual Performance Report for FFY 2012 (2012-2013) Indicator 3 Page 33 (OMB NO: 1820-0624 / Expiration Date: 7/31/2015)
data. 6. Michigan’s assessment results are available to the public at
http://www.michigan.gov/mde/0,4615,7-140-22709_52674_63953---,00.html.
Monitoring Priority: FAPE in the LRE14/Statewide Assessment
(Results Indicator)
Indicator 3: Participation and performance of children with individualized education programs (IEPs) on statewide assessments:
A. Percent of the districts with a disability subgroup that meets the state’s minimum “n” size that meet the state’s AYP/AMO15 targets for the disability subgroup.
B. Participation rate for children with an IEP.
C. Proficiency rate for children with an IEP against grade level, modified and alternate academic achievement standards. (20 U.S.C. 1416 (a)(3)(A))
Measurement:
A. AYP/AMO percent = [(# of districts with a disability subgroup that meets the State’s minimum “n” size that meet the State’s average Scorecard targets) divided by the (total # of districts that have a disability subgroup that meets the State’s minimum “n” size)] times 100.
B. Participation rate percent = [(# of children with an IEP participating in the assessment) divided by the (total # of children with an IEP enrolled during the testing window, calculated separately for reading and math)]. The participation rate is based on all children with an IEP, including both children with an IEP enrolled for a full academic year and those not enrolled for a full academic year.
C. Proficiency rate percent = ([(# of children with an IEP enrolled for a full academic year scoring at or above proficient) divided by the (total # of children with an IEP enrolled for a full academic year, calculated separately for reading and math)].
14 Free Appropriate Public Education in the Least Restrictive Environment 15 Annual Measurable Objectives

APR – Part B Updated 4-23-14 Michigan
Part B State Annual Performance Report for FFY 2012 (2012-2013) Indicator 3 Page 34 (OMB NO: 1820-0624 / Expiration Date: 7/31/2015)
Table 1: A — Districts Meeting AYP/AMO Objectives for Disability Subgroup
Measurable and Rigorous Targets
FFY Baseline Target Actual
2005 100%
2006 >88.0% 92.7%
2007 >91.0% 98.5%
2008 >94.0% 99.4%
2009 >97.0% 99.7%
2010 >98.0% 96.6%
2011 >98.0% 72.3%
2012 represents a change in how districts meet the “target.” Calculations are based on Annual Measurable Objectives requirements of Michigan’s approved
ESEA Flexibility Request
2012 12.1%* >98.0%
Percent = [(# of districts with a disability subgroup that meets the state’s minimum “n” size that meet the state’s Scorecard targets for the disability subgroup) divided by the (total # of districts that have a disability subgroup that meets the state’s minimum “n” size)] times 100.
*16[74 ÷ 610] x 100
Source: Michigan Department of Education (MDE)/Bureau of Assessment and Accountability (BAA)
16 Increase in district numbers over last year due to inclusion of districts with less than 30 students per grade level yet the sum totals over 30 for all grades this year.


APR – Part B Updated 4-23-14 Michigan
Part B State Annual Performance Report for FFY 2012 (2012-2013) Indicator 3 Page 36 (OMB NO: 1820-0624 / Expiration Date: 7/31/2015)
Table 2: B - Participation — Participation of children with an IEP in a regular assessment with no accommodations; regular assessment with accommodations; alternate assessment against grade level standards; alternate assessment against alternate achievement standards; and alternate assessment against modified achievement standards17.
Participation Rate
Grade 3 Grade 4 Grade 5 Grade 6 Grade 7 Grade 8 Grade 11
Reading Math Reading Math Reading Math Reading Math Reading Math Reading Math Reading Math
a. # of Children with an IEP in assessed grades18,19 14,271 14,266 14,980 14,968 15,430 15,436 15,594 15,605 15,528 15,499 15,269 15,273 12,709 12,735
b. # and % of Children with an IEP in regular assessment with no accommodations
7,602 6,835 7,278 6,015 7,083 5,509 7,262 4,938 7,594 5,289 7,703 5,480 3,461 2,134
53.3% 47.9% 48.6% 40.2% 45.9% 35.7% 46.6% 31.6% 48.9% 34.1% 50.4% 35.9% 27.2% 16.8%
c. # and % of Children with an IEP in regular assessment with accommodations
1,652 3,049 1,977 3,945 2,302 4,413 2,184 4,948 1,990 4,464 2,066 4,386 5,941 7,204
11.6% 21.4% 13.2% 26.4% 14.9% 28.6% 14.0% 31.7% 12.8% 28.8% 13.5% 28.7% 46.7% 56.6%
d. # and % of Children with an IEP in alt. assessment against grade level standards
Not Applicable
Not Applicable
Not Applicable
Not Applicable
Not Applicable
Not Applicable
Not Applicable
Not Applicable
Not Applicable
Not Applicable
Not Applicable
Not Applicable
Not Applicable
Not Applicable
e. # and % of Children with an IEP in alternate assessment against alternate achievement standards
2,355 2,214 2,431 2,297 2,570 2,446 2,627 2,528 2,597 2,589 2,582 2,582 2,532 2,542
16.5% 15.5% 16.2% 15.3% 16.7% 15.8% 16.8% 16.2% 16.7% 16.7% 16.9% 16.9% 19.9% 20.0%
f. # and % of Children with an IEP in alternate assessment against modified achievement standards
2,387 1,857 3,081 2,451 3,278 2,840 3,280 2,893 3,060 2,844 2,654 2,532 Not
Applicable Not
Applicable 16.7% 13.0% 20.6% 16.4% 21.2% 18.4% 21.0% 18.5% 19.7% 18.3% 17.4% 16.6%
Total # and Overall Participation Rate20
13,996 13,955 14,767 14,708 15,233 15,208 15,353 15,307 15,241 15,186 15,005 14,980 11,934 11,880
98.1% 97.8% 98.6% 98.3% 98.7% 98.5% 98.5% 98.1% 98.2% 98.0% 98.3% 98.1% 93.9% 93.3%
17 Participation data does not include Limited English Proficiency students who, at the time of testing, were in the United States for less than 10 months and participated in the ELPA in place of the regular reading assessment. 18 Students included in a, but not b-f above are the result of Michigan’s enrollment data being gathered on 10/3/12 for fall assessments and 2/13/13 for spring assessments, with the assessment windows occurring from 10/1/12- 11/9/12 (grades 3-8) and 2/11/13 - 3/22/13 (grade 11). In addition, Michigan does not count students with invalid scores as assessed. 19 The enrollment numbers differ slightly within a grade due to student mobility as Michigan assesses mathematics and reading during different weeks in the assessment window. 20 The bottom row represents the total numbers and rates of children with an IEP who participated in state assessment.


APR – Part B Updated 4-23-14 Michigan
Part B State Annual Performance Report for FFY 2012 (2012-2013) Indicator 3 Page 38 (OMB NO: 1820-0624 / Expiration Date: 7/31/2015)
Table 3: B – Participation of Children with an IEP Measurable and Rigorous Targets
FFY Reading Grade 3 Grade 4 Grade 5 Grade 6 Grade 7 Grade 8 Grade 11
2005-2012 Target 95.0% 95.0% 95.0% 95.0% 95.0% 95.0% 95.0%
2005 Actual 98.1% 98.6% 99.1% 97.0% 98.1% 97.5% 91.3%
2006 Actual 99.3% 99.7% 99.3% 99.3% 99.2% 98.9% 85.1%
2007 Actual 99.1% 98.8% 99.2% 99.7% 98.3% 98.3% 90.5%
2008 Actual 98.5% 98.5% 98.9% 98.5% 98.3% 97.6% 92.7%
2009 Actual 98.4% 98.5% 98.4% 98.2% 98.5% 97.5% 93.0%
2010 Actual 98.6% 98.9% 98.9% 98.9% 98.7% 98.5% 92.6%
2011 Actual 98.4% 97.7% 98.8% 98.7% 98.3% 98.1% 92.5%
2012 Actual 98.1% 98.6% 98.7% 98.5% 98.2% 98.3% 93.9% 2012
Status Target
Met Target
Met Target
Met Target
Met Target
Met Target
Met Target Not
Met Measurable and Rigorous Targets
FFY Mathematics Grade 3 Grade 4 Grade 5 Grade 6 Grade 7 Grade 8 Grade 11
2005-2012 Target 95.0% 95.0% 95.0% 95.0% 95.0% 95.0% 95.0%
2005 Actual 98.4% 98.9% 99.2% 97.5% 98.9% 98.1% 94.1%
2006 Actual 99.2% 99.6% 99.3% 99.1% 99.0% 98.8% 91.1%
2007 Actual 99.4% 99.1% 99.8% 98.7% 98.7% 98.8% 91.8%
2008 Actual 99.0% 98.9% 99.4% 99.1% 99.0% 98.4% 92.5%
2009 Actual 98.3% 98.5% 98.4% 98.1% 98.2% 97.0% 92.0%
2010 Actual 98.2% 98.8% 98.9% 98.8% 98.4% 98.1% 91.9%
2011 Actual 98.3% 98.6% 98.8% 98.7% 98.3% 98.1% 91.3%
2012 Actual 97.8% 98.3% 98.5% 98.1% 98.0% 98.1% 93.3% 2012
Status Target
Met Target
Met Target
Met Target
Met Target
Met Target
Met Target Not
Met

APR – Part B Updated 4-23-14 Michigan
Part B State Annual Performance Report for FFY 2012 (2012-2013) Indicator 3 Page 39 (OMB NO: 1820-0624 / Expiration Date: 7/31/2015)
Summary Information FFY 2012 Participation Students with an IEP Participating in
State Reading Assessment Students with an IEP Participating in
State Mathematics Assessment Number of students with an IEP enrolled
in tested grade levels = 103,781 Number of students with an IEP
participating = 101,529 Percentage of students with an IEP
participating = 97.8 percent
Number of students with an IEP enrolled in tested grade levels = 103,782
Number of students with an IEP participating = 101,224
Percentage of students with an IEP participating = 97.5 percent
Source: MDE/BAA

APR – Part B Updated 4-23-14 Michigan
Part B State Annual Performance Report for FFY 2012 (2012-2013) Indicator 3 Page 40 (OMB NO: 1820-0624 / Expiration Date: 7/31/2015)
Table 4: C — Proficiency of children with an IEP against grade level standards and alternate achievement standards
21 Michigan added this row and used it as the denominator when the “Total # and Overall Proficiency Rate for Children with an IEP” was calculated. The bottom row is based on the # of students with an IEP participating in the state regular or alternate assessments, not the total numbers of students with an IEP in a given grade. This was approved by the OSEP state contact and aligns with Michigan’s approved Accountability Workbook. 22 Students included in a, but not b-e above are the result of Michigan’s enrollment data being gathered on 10/3/12 for fall assessments and 2/13/13 for spring assessments, with the assessment windows occurring from 10/1/12 - 11/9/12 (grades 3-8) and 2/11/13 - 3/22/13 (grade 11). In addition, Michigan does not count students with invalid scores as assessed.
Proficiency Rate Grade 3 Grade 4 Grade 5 Grade 6 Grade 7 Grade 8 Grade 11
Reading Math Reading Math Reading Math Reading Math Reading Math Reading Math Reading Math
a. Number of Children with an IEP in assessed grades 14,271 14,266 14,980 14,968 15,430 15,436 15,594 15,605 15,528 15,499 15,269 15,273 12,709 12,735
Total # of Participants21 13,996 13,955 14,767 14,708 15,233 15,208 15,353 15,307 15,241 15,186 15,005 14,980 11,934 11,880 b. # and % of Children with an IEP in assessed grades who are proficient or above as measured by the regular assessment with no accommodations22
3,192 1,819 3,091 1,840 2,834 1,543 2,562 937 1,815 704 2,041 529 635 97
22.8% 13.0% 20.9% 12.5% 18.6% 10.1% 16.7% 6.1% 11.9% 4.6% 13.6% 3.5% 5.3% 0.8% c. # and % of Children with an IEP in assessed grades who are proficient or above as measured by the regular assessment with accommodations
313 303 452 453 600 429 534 365 388 249 541 153 1,155 250
2.2% 2.2% 3.1% 3.1% 3.9% 2.8% 3.5% 2.4% 2.5% 1.6% 3.6% 1.0% 9.7% 2.1% d. # and % of Children with an IEP in assessed grades who are proficient or above as measured by the alternate assessment against grade level standards
Not Applicable
Not Applicable
Not Applicable
Not Applicable
Not Applicable
Not Applicable
Not Applicable
Not Applicable
Not Applicable
Not Applicable
Not Applicable
Not Applicable
Not Applicable
Not Applicable
e. # and % of Children with an IEP in assessed grades who are proficient or above as measured against alternate achievement standards
702 1,781 655 1,827 630 1,753 706 1,967 651 1,763 665 1,947 732 1,794
5.0% 12.8% 4.4% 12.4% 4.1% 11.5% 4.6% 12.9% 4.3% 11.6% 4.4% 13.0% 6.1% 15.1% f. # and % of Children with an IEP in assessed grades who are proficient or above as measured against modified achievement standards
938 1,183 1,426 1,409 1,959 1,660 1,925 1,677 1,878 1,281 1,811 859 Not Applicable
Not Applicable
6.7% 8.5% 9.7% 9.6% 12.9% 10.9% 12.5% 11.0% 12.3% 8.4% 12.1% 5.7% Total # and Overall Proficiency Rate for Children with an IEP
5,145 5,086 5,624 5,529 6,023 5,385 5,727 4,946 4,732 3,997 5,058 3,488 2,522 2,141 36.8% 36.4% 38.1% 37.6% 39.5% 35.4% 37.3% 32.3% 31.0% 26.3% 33.7% 23.3% 21.1% 18.0%
Source: MDE/BAA


APR – Part B Updated 4-23-14 Michigan
Part B State Annual Performance Report for FFY 2012 (2012-2013) Indicator 3 Page 42 (OMB NO: 1820-0624 / Expiration Date: 7/31/2015)
Table 5: C – Proficiency of Children with an IEP Measurable and Rigorous Targets - Reading
Grade 3 Grade 4 Grade 5 Grade 6 Grade 7 Grade 8 Grade 11 2005
Target 50.0% 48.0% 46.0% 45.0% 43.0% 41.0% 52.0%
2005 Actual 53.3% 46.8% 45.0% 43.3% 38.4% 35.3% 25.1%
2006 Target 50.0% 48.0% 46.0% 45.0% 43.0% 41.0% 52.0%
2006 Actual 56.1% 51.3% 49.0% 48.4% 43.2% 39.1% 25.5%
2007 Target 60.0% 59.0% 57.0% 56.0% 54.0% 53.0% 61.0%
2007 Actual 57.9% 50.5% 48.9% 49.0% 42.1% 43.6% 24.5%
2008 Target 60.0% 59.0% 57.0% 56.0% 54.0% 53.0% 61.0%
2008 Actual 60.0% 50.6% 48.8% 49.0% 48.8% 43.6% 28.0%
2009 Target 70.0% 69.0% 68.0% 67.0% 66.0% 65.0% 71.0%
2009 Actual 69.4% 60.0% 60.2% 62.8% 54.3% 55.4% 35.7%
2010 Target 78.0% 77.0% 76.0% 75.0% 74.0% 73.0% 79.0%
2010 Actual 64.5% 58.0% 57.2% 54.8% 45.7% 51.2% 36.4%
2011 Target 47.0% 48.0% 50.0% 43.0% 34.0% 39.0% 33.0%
2011 Actual 34.1% 34.7% 35.5% 32.3% 25.2% 25.9% 21.0%
2012 Target 74.0% 74.0% 75.0% 72.0% 67.0% 70.0% 67.0% 2012 Actual 36.8% 38.1% 39.5% 37.3% 31.0% 33.7% 21.1% 2012
Status Target
Not Met Target
Not Met Target
Not Met Target
Not Met Target
Not Met Target
Not Met Target
Not Met

APR – Part B Updated 4-23-14 Michigan
Part B State Annual Performance Report for FFY 2012 (2012-2013) Indicator 3 Page 43 (OMB NO: 1820-0624 / Expiration Date: 7/31/2015)
Measurable and Rigorous Targets – Mathematics Grade 3 Grade 4 Grade 5 Grade 6 Grade 7 Grade 8 Grade 11
2005 Target 59.0% 56.0% 53.0% 50.0% 46.0% 43.0% 44.0%
2005 Actual 68.2% 59.0% 48.5% 35.3% 29.2% 31.9% 21.7%
2006 Target 59.0% 56.0% 53.0% 50.0% 46.0% 43.0% 44.0%
2006 Actual 74.1% 66.9% 50.9% 42.1% 35.2% 39.5% 22.1%
2007 Target 67.0% 65.0% 62.0% 60.0% 57.0% 54.0% 55.0%
2007 Actual 77.1% 67.7% 49.5% 42.9% 39.1% 40.4% 20.3%
2008 Target 67.0% 65.0% 62.0% 60.0% 57.0% 54.0% 55.0%
2008 Actual 79.3% 70.6% 51.5% 51.5% 50.6% 46.4% 22.1%
2009 Target 67.0% 65.0% 62.0% 60.0% 57.0% 54.0% 55.0%
2009 Actual 84.9% 80.0% 56.5% 56.2% 54.1% 39.5% 23.6%
2010 Target 75.0% 74.0% 71.0% 70.0% 67.0% 66.0% 67.0%
2010 Actual 86.4% 78.0% 53.9% 58.6% 55.1% 49.9% 23.7%
2011 Target 17.0% 20.0% 18.0% 14.0% 14.0% 10.0% 8.0%
2011 Actual 30.8% 32.0% 30.0% 27.7% 23.5% 22.5% 18.3%
2012 Target 58.0% 60.0% 59.0% 57.0% 57.0% 55.0% 54.0% 2012 Actual 36.4% 37.6% 35.4% 32.3% 26.3% 23.3% 18.0% 2012
Status Target
Not Met Target
Not Met Target
Not Met Target
Not Met Target
Not Met Target
Not Met Target
Not Met Source: MDE/BAA
Explanation of Progress or Slippage that occurred for FFY 2012: Michigan did not meet its FFY 2012 target of 98.0 percent for districts meeting Scorecard objectives for the disability subgroup. While overall rates remained the same, Michigan met its FFY 2012 participation targets for students with an IEP in grades 3, 4, 5, 6, 7, and 8 in reading and mathematics. Participation rate for grade 11 was not met. Michigan is planning to review grade 11 data to determine the root cause for this low participation rate. Proficiency targets were not met in reading or

APR – Part B Updated 4-23-14 Michigan
Part B State Annual Performance Report for FFY 2012 (2012-2013) Indicator 3 Page 44 (OMB NO: 1820-0624 / Expiration Date: 7/31/2015)
mathematics in any grade. As indicated in the overview, changes were made to the rules to determine whether or not targets were met. Changes to the rules determining whether or not targets were met included:
Rules for Safe Harbor have changed. Safe Harbor now uses a four-year slope methodology, resulting in fewer districts making safe harbor than in the past.
The rules for inclusion of 1 percent cap scores in the Scorecard have changed. In the past, these scores would have been included in AYP upon an approved appeal. This year, they were only applied if it would change the overall Scorecard color.
The state target is actually a target average. Targets have been set individually by district, school and subject, giving reasonable targets for each school to become 85 percent proficient in 2022.
Given the changes listed above, the data does not directly represent a change in student performance, as much as it does a change in the rules used to determine whether targets were met. Displayed in Table 5 are data that shows Michigan’s students with an IEP did not meet the revised proficiency targets in any grades in reading or mathematics. However, steady progress has been made in proficiency rates over 2011 in all grades for reading, except grade 11. In mathematics, proficiency rates also improved in every grade except grade 11. Discussion of Improvement Activities Completed:
Timelines Activities Status
PROVIDE TRAINING/PROFESSIONAL DEVELOPMENT
2011-2013 1. Develop and disseminate guidelines on selecting the appropriate assessment for students with an IEP.
The state published an Assessment Selection Guideline document that included all assessments. This document continues to be used as the standard for IEP team guidance in determining the most appropriate assessment for students with an IEP. This document continues to be referenced in training and professional development (PD) presentations offered to districts.
2011-2013 2. Continue to collaborate with the Office of Special Education (OSE) in monitoring implementation of accommodations and disseminate information on the appropriate use of assessment accommodations,
The Bureau of Assessment and Accountability added a dedicated accessibility specialist to ensure information on accommodations is properly aligned and disseminated on all of the
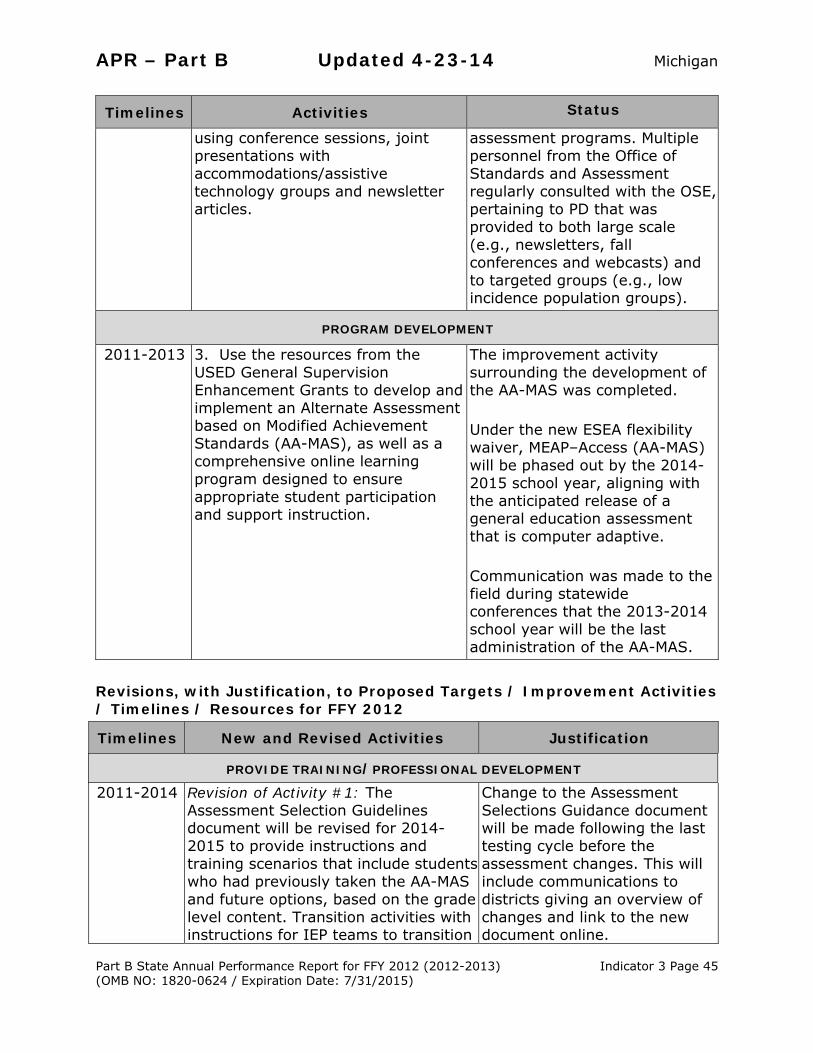
APR – Part B Updated 4-23-14 Michigan
Part B State Annual Performance Report for FFY 2012 (2012-2013) Indicator 3 Page 45 (OMB NO: 1820-0624 / Expiration Date: 7/31/2015)
Timelines Activities Status using conference sessions, joint
presentations with accommodations/assistive technology groups and newsletter articles.
assessment programs. Multiple personnel from the Office of Standards and Assessment regularly consulted with the OSE, pertaining to PD that was provided to both large scale (e.g., newsletters, fall conferences and webcasts) and to targeted groups (e.g., low incidence population groups).
PROGRAM DEVELOPMENT
2011-2013 3. Use the resources from the USED General Supervision Enhancement Grants to develop and implement an Alternate Assessment based on Modified Achievement Standards (AA-MAS), as well as a comprehensive online learning program designed to ensure appropriate student participation and support instruction.
The improvement activity surrounding the development of the AA-MAS was completed. Under the new ESEA flexibility waiver, MEAP–Access (AA-MAS) will be phased out by the 2014-2015 school year, aligning with the anticipated release of a general education assessment that is computer adaptive. Communication was made to the field during statewide conferences that the 2013-2014 school year will be the last administration of the AA-MAS.
Revisions, with Justification, to Proposed Targets / Improvement Activities / Timelines / Resources for FFY 2012
Timelines New and Revised Activities Justification
PROVIDE TRAINING/PROFESSIONAL DEVELOPMENT 2011-2014 Revision of Activity #1: The
Assessment Selection Guidelines document will be revised for 2014-2015 to provide instructions and training scenarios that include students who had previously taken the AA-MAS and future options, based on the grade level content. Transition activities with instructions for IEP teams to transition
Change to the Assessment Selections Guidance document will be made following the last testing cycle before the assessment changes. This will include communications to districts giving an overview of changes and link to the new document online.

APR – Part B Updated 4-23-14 Michigan
Part B State Annual Performance Report for FFY 2012 (2012-2013) Indicator 3 Page 46 (OMB NO: 1820-0624 / Expiration Date: 7/31/2015)
Timelines New and Revised Activities Justification
students back to the general assessment will be conducted during statewide conferences in August and September of 2013.
Resources: BAA – Test Composition Unit and Test Development Unit.
2011-2013 Deletion of Activity #3: Use the resources from the USED General Supervision Enhancement Grants to develop and implement an AA-MAS, as well as a comprehensive online learning program designed to ensure appropriate student participation and support instruction.
The improvement activity surrounding the development of the AA-MAS has been completed.
2013-2014 New Activity: The Michigan Department of Education will compare the participation rates for grade 11 over the past five years with other subgroups and overall 11th grade participation to determine if the current trend is related specifically to students with an IEP, or if the participation rates are attributed to other factors. It will be a collaboration between members from the Bureau of Assessment and Accountability and the Office of Special Education. A recommendation will be made to the participating offices from this collaboration regarding potential improvement activities based on the results.
Michigan has not reached the participation target for grade 11 for the past several years. This improvement activity is designed to identify potential barriers for participation of students with an IEP.
Resources: BAA – Office of Standards and Assessment, and the OSE.

APR – Part B Updated 4-23-14 Michigan
Part B State Annual Performance Report for FFY 2012 (2012-2013) Indicator 3 Page 47 (OMB NO: 1820-0624 / Expiration Date: 7/31/2015)
Michigan Part B FFY 2011 SPP/APR Response Table from OSEP
Indicator Status
OSEP Analysis
and Next Steps
Michigan Response
INDICATOR
FFY 2010 DATA
FFY 2011 DATA
FFY 2011 TARGET
3A. Percent of Districts Meeting AYP for Disability Subgroup
96.6% 72.3% > 98%
INDICATOR 3A: The State revised the improvement activities for FFY 2011 and FFY 2012 for this indicator and OSEP accepts those revisions.
The State has chosen to continue to report AYP data based on targets established under the No Child Left Behind Act.
The OSEP listed no required actions in the FFY 2011 Response Table for Indicator 3A.
None required at this time.
3B. Statewide Assessments: Participation rate for children with IEPs.*
Grade FFY 2011 Data
Reading FFY 2011 Target Reading
FFY 2011 Data Math
FFY 2011 Target Math
3 98.4% > 95% 98.3% > 95% 4 97.7% > 95% 98.6% > 95% 5 98.8% > 95% 98.8% > 95% 6 98.7% > 95% 98.7% > 95% 7 98.3% > 95% 98.3% > 95% 8 98.1% > 95% 98.1% > 95% HS 92.5% > 95% 91.3% > 95%
*The FFY 2010 columns were removed from the Michigan Part B FFY 2011 SPP/APR Response Table.
INDICATOR 3B: The State revised the improvement activities for FFY 2011 and FFY 2012 for this indicator and OSEP accepts those revisions.
The State provided a Web link to 2011 publicly-reported assessment results.
The OSEP listed no required actions in the FFY 2011 Response Table for Indicator 3B.
None required at this time.

APR – Part B Updated 4-23-14 Michigan
Part B State Annual Performance Report for FFY 2012 (2012-2013) Indicator 3 Page 48 (OMB NO: 1820-0624 / Expiration Date: 7/31/2015)
Indicator Status
OSEP Analysis
and Next Steps
Michigan Response
3C. Statewide Assessments: Proficiency rate for children with IEPs against grade level, modified and alternate academic achievement standards.
Grade FFY 2011
Data Reading
FFY 2011 Target Reading
FFY 2011 Data Math
FFY 2011 Target Math
3 34.1% New Baseline 30.8% New Baseline 4 34.7% New Baseline 32.0% New Baseline 5 35.5% New Baseline 30.0% New Baseline 6 32.3% * New Baseline 27.7% New Baseline 7 25.2% New Baseline 23.5% New Baseline 8 25.9% New Baseline 22.5% New Baseline HS 21.0% New Baseline 18.3% New Baseline
*The FFY 2010 columns were removed from the Michigan Part B FFY 2011 SPP/APR Response Table.
INDICATOR 3C: The State revised the targets for FFY 2011 and FFY 2012, improvement activities for FFY 2011 and FFY 2012, and baseline for this indicator and OSEP accepts those revisions.
The State provided a Web link to 2011 publicly-reported assessment results.
The OSEP listed no required actions in the FFY 2011 Response Table for Indicator 3C.
None required at this time.


APR – Part B Michigan
Part B State Annual Performance Report for FFY 2012 (2012-2013) Indicator 4A Page 50 (OMB NO: 1820-0624 / Expiration Date: 7/31/2015)
Part B State Annual Performance Report (APR) for FFY23 2012 (2012-2013)
Overview of Indicator 4A (Suspension/Expulsion) Report Development: 1. See General Overview pages 6-12. 2. Michigan continues to require all districts to report suspension and expulsion
data for students with an individualized education program (IEP) in the state’s Michigan Student Data System (MSDS).
3. Significant discrepancy was calculated using only data on students with an IEP since comparable data are not available for the general school population.
4. School year 2011-2012 data are reported in this indicator for the FFY 2012 APR.
Monitoring Priority: FAPE in the LRE24/Suspension/Expulsion
(Results Indicator)
Indicator 4A: Percent of districts that have a significant discrepancy in the rate of suspensions and expulsions of greater than 10 days in a school year for children with an IEP. (20 U.S.C. 1416(a)(3)(A); 1412(a)(22))
Measurement:
Percent = [(# of districts that have a significant discrepancy in the rates of suspensions and expulsions for greater than 10 days in a school year of children with an IEP) divided by the (# of districts in the State)] times 100. Include State’s definition of “significant discrepancy.” Definition of Significant Discrepancy: A district was identified as having a significant discrepancy in rates of suspensions and/or expulsions if more than five percent of its students with an IEP received out-of-school suspensions/expulsions for greater than ten days cumulatively during the school year. Districts that met the five percent threshold, but had fewer than five students with an IEP suspended/expelled for more than ten days, were exempt from consideration as having a significant discrepancy.
23 Federal Fiscal Year 24 Free Appropriate Public Education in the Least Restrictive Environment.

APR – Part B Michigan
Part B State Annual Performance Report for FFY 2012 (2012-2013) Indicator 4A Page 51 (OMB NO: 1820-0624 / Expiration Date: 7/31/2015)
Measurable and Rigorous Targets
FFY Baseline Target Actual
Calculations Using Previous Definition of Significant Discrepancy
2005 1.2%
2006 < 10.0% 1.5%
2007 < 9.0% 1.4%
OSEP25 Prescribed a One Year Data Lag for This Indicator
2008 (2007-2008 data)
< 9.0% 1.4%
Calculations Using Current Definition of Significant Discrepancy
2009 (2008-2009 data)
5.1% < 5.5% 5.1%
2010 (2009-2010 data)
< 5.0% 2.8%
2011 (2010-2011 data)
< 4.5% 3.1%
2012 (2011-2012 data)
< 4.5% 2.2%*
Percent = [(# of districts that have a significant discrepancy in the rates of suspensions and expulsions for greater than 10 days in a school year of children with an IEP) divided by the (# of districts in the state26)] times 100.
*[19 ÷ 848] X 100 Source: Michigan Student Data System (MSDS) Explanation of Progress or Slippage that occurred for FFY 2012: Michigan met its FFY 2012 target of less than 4.5 percent for Indicator 4A. During the 2011-2012 school year, 2.2 percent of the districts in the state that met the minimum “n” size had more than 5 percent of their students with an IEP suspended/expelled for more than ten days cumulatively. Thirteen districts were excluded from the significant discrepancy calculation because they had fewer than five students with an IEP suspended/expelled for greater than ten days. Michigan continues to provide monitoring and technical assistance (TA) to ensure identified districts are compliant with the Individuals with Disabilities Education Act
25 Office of Special Education Programs 26 Number of districts in the state that reported students with an IEP.

APR – Part B Michigan
Part B State Annual Performance Report for FFY 2012 (2012-2013) Indicator 4A Page 52 (OMB NO: 1820-0624 / Expiration Date: 7/31/2015)
(IDEA). Targeted initiatives, such as the Michigan’s Integrated Behavior and Learning Support Initiative (MiBLSi) activities, emphasize alternatives to suspension (e.g., using positive behavioral interventions and supports (PBIS), the use of suspension/expulsion tracking systems and the sharing of discipline data among local staff members). Review of Policies, Procedures and Practices Seven of the nineteen districts were newly identified for focused monitoring. During February and March of 2013, the Office of Special Education (OSE) conducted focused monitoring on-site reviews of these districts' policies, procedures and practices related to the development and implementation of IEPs, the use of PBIS, and procedural safeguards to ensure compliance with the IDEA. All seven of the districts that were focused monitored were issued findings of noncompliance due to their policies, procedures and/or practices. These seven districts were required to submit and implement a corrective action plan (CAP). One newly identified school district closed and was no longer providing educational services to students prior to monitoring activities being conducted. Eleven of the nineteen districts had been focused monitored for suspension/ expulsion during the previous year. Out of the eleven districts, two had no findings of noncompliance specific to Indicator 4A, eight districts had findings of noncompliance and have corrected the noncompliance and their CAPs were verified and closed by the OSE. One district has no student enrollment and provides no educational services. Discussion of Activities Completed:
Timelines Activities Status
IMPROVE COLLABORATION/COORDINATION 2011-2013 1. The OSE will work with MiBLSi
personnel to identify districts with high rates of suspension and expulsion. This information will be used to identify districts in need of support and give them priority for selection in MiBLSi participation.
Reference Improvement Activity details below.
Improvement Activity 1 Details: The OSE and MiBLSi have developed a document that outlines the ways in which the project adds value to partnering intermediate school districts (ISDs) and districts to help them address high priority needs. The collaboration of MiBLSi, the OSE, and ISDs addressing suspension and expulsion for students with an IEP is included in this document and is available on the web at: http://miblsi.cenmi.org/LinkClick.aspx?fileticket=WalZjI3VhkQ%3d&tabid=2238. In March 2013, the OSE provided MiBLSi with a list of districts that were identified in 2013 with a significant discrepancy in the rate of suspensions and expulsions greater than 10 days in a school year for children with an IEP. MiBLSi reviewed this
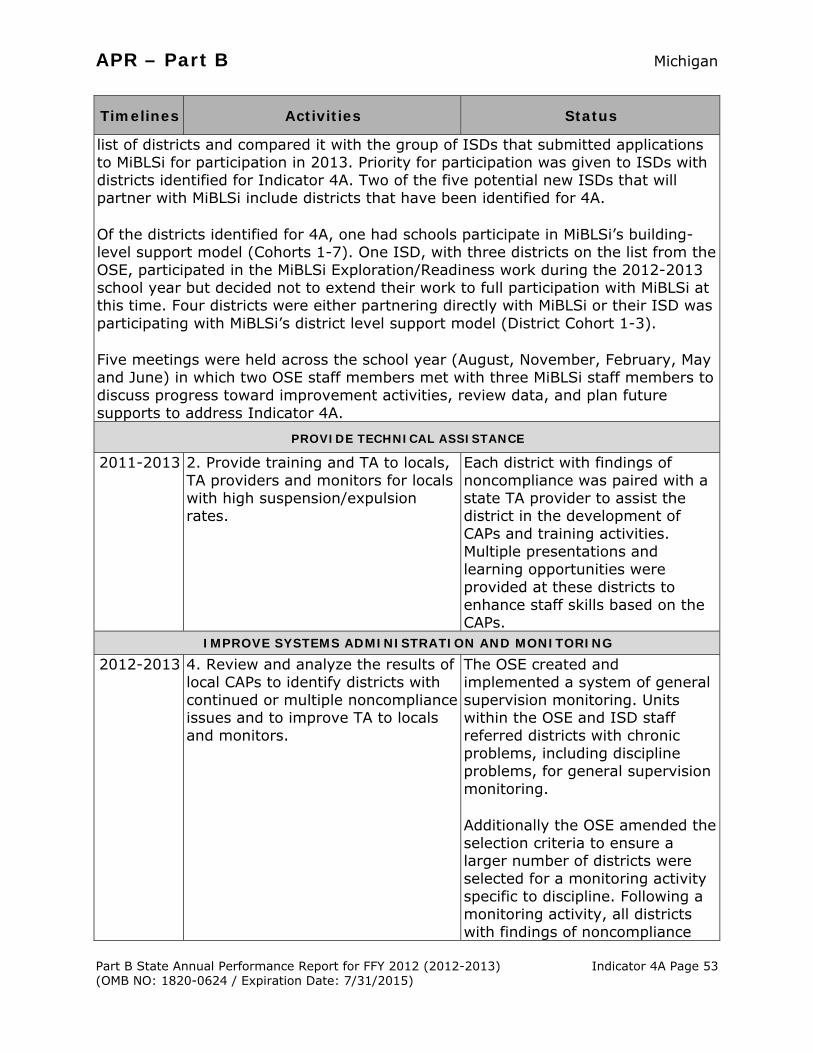
APR – Part B Michigan
Part B State Annual Performance Report for FFY 2012 (2012-2013) Indicator 4A Page 53 (OMB NO: 1820-0624 / Expiration Date: 7/31/2015)
Timelines Activities Status
list of districts and compared it with the group of ISDs that submitted applications to MiBLSi for participation in 2013. Priority for participation was given to ISDs with districts identified for Indicator 4A. Two of the five potential new ISDs that will partner with MiBLSi include districts that have been identified for 4A.
Of the districts identified for 4A, one had schools participate in MiBLSi’s building-level support model (Cohorts 1-7). One ISD, with three districts on the list from the OSE, participated in the MiBLSi Exploration/Readiness work during the 2012-2013 school year but decided not to extend their work to full participation with MiBLSi at this time. Four districts were either partnering directly with MiBLSi or their ISD was participating with MiBLSi’s district level support model (District Cohort 1-3).
Five meetings were held across the school year (August, November, February, May and June) in which two OSE staff members met with three MiBLSi staff members to discuss progress toward improvement activities, review data, and plan future supports to address Indicator 4A.
PROVIDE TECHNICAL ASSISTANCE 2011-2013 2. Provide training and TA to locals,
TA providers and monitors for locals with high suspension/expulsion rates.
Each district with findings of noncompliance was paired with a state TA provider to assist the district in the development of CAPs and training activities. Multiple presentations and learning opportunities were provided at these districts to enhance staff skills based on the CAPs.
IMPROVE SYSTEMS ADMINISTRATION AND MONITORING 2012-2013 4. Review and analyze the results of
local CAPs to identify districts with continued or multiple noncompliance issues and to improve TA to locals and monitors.
The OSE created and implemented a system of general supervision monitoring. Units within the OSE and ISD staff referred districts with chronic problems, including discipline problems, for general supervision monitoring.
Additionally the OSE amended the selection criteria to ensure a larger number of districts were selected for a monitoring activity specific to discipline. Following a monitoring activity, all districts with findings of noncompliance

APR – Part B Michigan
Part B State Annual Performance Report for FFY 2012 (2012-2013) Indicator 4A Page 54 (OMB NO: 1820-0624 / Expiration Date: 7/31/2015)
Timelines Activities Status
were provided with TA and required to develop and implement CAPs specific to the noncompliance.
PROGRAM DEVELOPMENT
2012-2013 5. Develop, implement and refine a scalable statewide model of a MTSS to address suspension/expulsion statewide.
The OSE and MiBLSi have designed a comprehensive support structure in Michigan by partnering with ISDs to develop the capacity of local school districts to implement an integrated MTSS, with fidelity, that results in improved academic achievement and behavior for all students. This framework and the statewide professional development model included schoolwide positive behavior support as a foundational component that addressed needs that had been identified in part through suspension and expulsion data.
As of June 2013, 20 ISDs and 2 local school districts were partnering with the OSE and MiBLSi across three cohorts. This represents the potential to impact 193 local school districts and 1,199 schools in Michigan.
PROVIDE TRAINING/PROFESSIONAL DEVELOPMENT 2012-2013 6.MiBLSi will provide training,
coaching and TA to participating districts to reduce the number or duration of out-of-school suspensions/expulsions.
Reference Improvement Activity details below.
Improvement Activity 6 Details: Schools participating in MiBLSi Cohort 7 finished their third and final year of the formal training sequence during the 2012-2013 school year. ISDs in District Cohorts 1 and 2 participated in focused planning sessions during the 2012-2013 school year. These sessions were designed to help ISDs install the necessary systems to support implementation at the district and school level in future years.

APR – Part B Michigan
Part B State Annual Performance Report for FFY 2012 (2012-2013) Indicator 4A Page 55 (OMB NO: 1820-0624 / Expiration Date: 7/31/2015)
Timelines Activities Status
This resulted in more than 144 trainings and coaching meetings provided to school leadership teams in the areas of schoolwide positive behavior support, schoolwide reading, and data-driven decision making in the 2012-2013 school year. ISDs in District Cohort 3 began ISD level training during the summer of 2013. The 2012-2013 school year focused on exploration/adoption and installation stages of implementation. Some schools have collected baseline data this year that has been used to help refine data collection, sharing and analysis procedures for the future. This data does not reflect the full group of participating ISDs, districts and schools. The following data depicts implementation fidelity and student outcomes for schools participating in the school level model. PBIS fidelity data, discipline referral data, and out-of-school suspension data were gathered from the PBIS Evaluation for schools that participated with MiBLSi and reflect data from all students enrolled in a school that has voluntarily participated with MiBLSi. Reading outcome data were gathered from the Dynamic Indicators of Basic Early Literacy Skills (DIBELS) Data System or requested directly from schools participating with MiBLSi. All districts in the state were required to report suspensions for students with an IEP in the MSDS to the Michigan Department of Education. The Benchmarks of Quality (BOQ) is a team self-assessment used to evaluate the extent to which universal PBIS is being implemented. There were 180 schools that submitted BOQ data during the 2012-2013 school year. For these 180 schools, the mean BOQ total score was 78 percent. Seventy-eight percent of schools met or exceeded the BOQ criterion total score of 70 percent. A total score of 70 percent on the BOQ indicates a minimum threshold for implementation fidelity of schoolwide PBIS. Schools with total scores below 70 percent should not expect to see improvements in student behavior because a score below 70 percent is one indicator that a school is not implementing schoolwide PBIS with fidelity. Discipline Referrals: For schools that met criterion on the BOQ, the mean rate of discipline referrals per 100 students per day was 0.48. The median rate of discipline referrals for schools that did not meet criterion on the BOQ was 0.68. This demonstrates that schools implementing PBIS with fidelity had lower rates of problem behaviors than schools not implementing PBIS with fidelity. Out-of-School Suspensions: For schools that met criterion on the BOQ, the average percent of students with at least one out-of-school suspension was 5 percent. On average, 12 percent of all students were suspended in schools that did not meet criterion on the BOQ. Based on data gathered through MSDS, the median percent of students with at least one out-of-school suspension was 5.6 percent for schools that met criterion on the BOQ (74 of 123). On average, 16.9 percent of students were suspended in schools that did not meet criterion on the BOQ (25 of 37). (Reflected in Table 1 below are the MSDS data for both districts that met criterion on the BOQ and those districts that did not.) This demonstrates that schools

APR – Part B Michigan
Part B State Annual Performance Report for FFY 2012 (2012-2013) Indicator 4A Page 56 (OMB NO: 1820-0624 / Expiration Date: 7/31/2015)
Timelines Activities Status
implementing PBIS with fidelity suspended a smaller proportion of students than schools not implementing PBIS with fidelity. Table 1:
Criterion on BOQ Descriptive Statistic School Year
2011-2012 School Year 2012-2013
Met Median 7.4 5.6 Met Mean 10.3 8.95
Met Number of schools with out-of-school suspensions 78 74
Met Number of schools for 2012-2013 123 123
Met Percent of schools with no out-of-school suspensions 36.6% 39.8%
Not Met Median 19.3 16 Not Met Mean 19.2 16.9
Not Met Number of schools with out-of-school suspensions 21 25
Not Met Number of schools for 2012-2013 37 37
Not Met Percent of schools with no out-of-school suspensions 43.2% 32.4%
Source: MSDS
Reading Achievement: For schools that met criterion on the BOQ, the mean percent of students that were on track in the area of reading was 65 percent compared to only 53 percent in schools that did not meet criterion on the BOQ.
The above data demonstrates the positive outcomes achieved by schools participating with MiBLSi when those schools are implementing PBIS with fidelity. In the future, MiBLSi plans to evaluate the impact on student outcomes when schools implement an integrated model of multi-tiered system of support (MTSS) (behavior and reading) and when districts and ISDs have the internal capacity to support and sustain implementation of MTSS. Timely Correction of FFY 2011 Findings of Noncompliance (corrected within one year from identification of the noncompliance): 1. Number of findings of noncompliance the state made during
FFY 2011 (the period from July 1, 2011 through June 30, 2012) 26
2. Number of FFY 2011 findings the state verified as timely corrected (corrected within one year from the date of notification to the local educational agencies (LEAs) of the finding)
25
3. Number of FFY 2011 findings not verified as corrected within one year [(1) minus (2) above] 1*

APR – Part B Michigan
Part B State Annual Performance Report for FFY 2012 (2012-2013) Indicator 4A Page 57 (OMB NO: 1820-0624 / Expiration Date: 7/31/2015)
FFY 2011 Findings of Noncompliance Not Timely Corrected (corrected more than one year from identification of the noncompliance and/or Not Corrected): 4. Number of FFY 2011 findings not timely corrected (same as the
number from (3) above) 1
5. Number of FFY 2011 findings the state has verified as corrected beyond the one-year timeline (“subsequent correction”) 1
6. Number of FFY 2011 findings not verified as corrected [(4) minus (5) above] 0
* This number reflects one district with noncompliance which is also reported in the Indicator 4B report. Correction of FFY 2011 Findings of Noncompliance (See Indicator 15)
FFY 2011 Correction of Noncompliance
Finding Indicator District Identifier
Nature of Noncompliance
Program-Specific Follow-Up Activities Related To The
Uncorrected Noncompliance 2 4A/B 772 The district’s
practices related to the suspension/ expulsion of students with an IEP were not compliant with IDEA regulations.
Finding issued: April 15, 2012 as a result of a focused monitoring activity. Summary of Activities: The OSE required a CAP based on a root cause analysis and submission of a progress report. State supervision and TA providers were assigned and were under close OSE supervision. The status of the correction of noncompliance was included in monthly meetings and conference calls. Status: Verified as corrected by TA provider and ISD monitors and closed by the OSE on December 30, 2013.

APR – Part B Michigan
Part B State Annual Performance Report for FFY 2012 (2012-2013) Indicator 4A Page 58 (OMB NO: 1820-0624 / Expiration Date: 7/31/2015)
Revisions, with Justification, to Proposed Targets/Improvement Activities/ Timelines/Resources for FFY 2012
Timelines New and Revised Activities Justification 2012-2014 Revision of Activity #3: MiBLSi will provide
training, coaching and TA to participating districts to implement an MTSS with fidelity in order to reduce the number or duration of out-of-school suspensions/ expulsions and increase students' academic achievement in reading.
This activity was rewritten to include an expectation to increase students’ academic achievement in reading.
Michigan Part B FFY 2011 State Performance Plan (SPP)/APR Response Table from OSEP
Indicator Status OSEP Analysis and Next Steps Michigan Response
Percent of Districts with Significant Discrepancy in Suspension/ Expulsion
FFY 2010 Data
FFY 2011 Data
FFY 2011 Target
2.8% 3.1% < 4.5% The State revised the improvement activities for FFY 2011 and FFY 2012 for this indicator and OSEP accepts those revisions. The State reported its definition of “significant discrepancy.” The State reported that 26 districts were identified as having a significant discrepancy in the rate of suspensions and expulsions of greater than ten days in a school year for children with IEPs. The State reported that ten of 832 districts did not meet the State-established minimum “n” size requirement of less than five students with an IEP who were suspended/ expelled for greater than ten days. The State reported that it reviewed the districts’ policies, procedures, and practices relating to the
The State must report, in its FFY 2012 APR, on the correction of noncompliance that the State identified in FFY 2011 as a result of the review it conducted pursuant to 34 CFR §300.170(b). When reporting on the correction of this noncompliance, the State must report that it has verified that each LEA with noncompliance identified by the State: (1) is correctly implementing the specific regulatory requirements (i.e., achieved 100% compliance) based on a review of updated data such as data subsequently collected through on-site monitoring or a State data system; and (2) has corrected each individual case of noncompliance, unless the child is no
Michigan identified 26 districts that were found to have noncompliant policies, procedures and/or practices that contributed to the significant discrepancy in FFY 2011. Twenty-five districts corrected within one year of notification. One district corrected beyond one year. All correction of noncompliance was verified by the state that each LEA with noncompliance: (1) has corrected each individual case of noncompliance, unless the child is no longer within the jurisdiction of the LEA, consistent with OSEP Memo 09-02, dated October 17, 2008; and (2) is

APR – Part B Michigan
Part B State Annual Performance Report for FFY 2012 (2012-2013) Indicator 4A Page 59 (OMB NO: 1820-0624 / Expiration Date: 7/31/2015)
Indicator Status OSEP Analysis and Next Steps Michigan Response
development and implementation of IEPs, the use of positive behavioral interventions and supports, and procedural safeguards to ensure compliance with the IDEA, as required by 34 CFR §300.170(b) for the districts identified with significant discrepancies in FFY 2011. The State identified noncompliance through this review. The State reported that it revised (or required the affected districts to revise), the districts’ policies, procedures, and practices relating to the development and implementation of IEPs, the use of positive behavioral interventions and supports, and procedural safeguards to ensure compliance with the IDEA, pursuant to 34 CFR §300.170(b) for the districts identified with significant discrepancies in FFY 2011. The State reported that noncompliance identified in FFY 2010 through the review of policies, procedures, and practices, pursuant to 34 CFR §300.170(b), was corrected.
longer within the jurisdiction of the LEA, consistent with OSEP Memo 09-0227. In the FFY 2012 APR, the State must describe the specific actions that were taken to verify the correction.
correctly implementing the specific regulatory requirements (i.e., achieved 100 percent compliance) based on a review of updated data such as data subsequently collected through on-site monitoring or the state data system. For additional information pertaining to the correction of noncompliance, reference Michigan’s Continuous Improvement and Monitoring System in Appendix C.
27 OSEP Memorandum 09-02 (OSEP Memo 09-02), dated October 17, 2008, requires that the State report that it verified that each LEA with noncompliance: (1) is correctly implementing the specific regulatory requirements (i.e., achieved 100% compliance) based on a review of updated data such as data subsequently collected through on-site monitoring or a State data system; and (2) has corrected each individual case of noncompliance, unless the child is no longer within the jurisdiction of the LEA.

APR – Part B Michigan
Part B State Annual Performance Report for FFY 2012 (2012-2013) Indicator 4B Page 60 (OMB NO: 1820-0624 / Expiration Date: 7/31/2015)
Part B State Annual Performance Report (APR) for FFY 2012 (2012-2013)
Overview of Indicator 4B (Suspension/Expulsion by Race/Ethnicity) Report Development: 1. See General Overview pages 6-12. 2. In accordance with federal reporting requirements, the 2011-2012 school year
data were reviewed using the seven race and ethnicity codes specified by the United States Department of Education, specifically:
a. A student coded as Hispanic, is reported as Hispanic, regardless of any additional race codes indicated.
b. All other students coded in the Michigan Student Data System (MSDS) with multiple races are counted in the “Two or More Races” category.
3. Findings of noncompliance were reported and corrective action plans (CAPs) were submitted and monitored through the Continuous Improvement and Monitoring System (CIMS) Workbook. For additional information pertaining to timely correction of noncompliance please refer to Appendix C.
Monitoring Priority: Suspension/Expulsion by Race/Ethnicity
(Compliance Indicator)
Indicator 4B: Percent of districts that have: (a) a significant discrepancy, by race or ethnicity, in the rate of suspensions and expulsions of greater than ten days in a school year for children with an individualized education program (IEP); and (b) policies, procedures or practices that contribute to the significant discrepancy and do not comply with requirements relating to the development and implementation of IEPs, the use of positive behavioral interventions and support, and procedural safeguards. (20 U.S.C. 1416(a)(3)(A); 1412(a)(22)) Measurement: Percent = [(# of districts that have: (a) a significant discrepancy, by race or ethnicity, in the rate of suspensions and expulsions of greater than ten days in a school year of children with an IEP; and (b) policies, procedures or practices that contribute to the significant discrepancy and do not comply with requirements relating to the development and implementation of IEPs, the use of positive behavioral interventions and support, and procedural safeguards) divided by the (#of districts in the state times 100)]. Include State’s definition of “significant discrepancy.”

APR – Part B Michigan
Part B State Annual Performance Report for FFY 2012 (2012-2013) Indicator 4B Page 61 (OMB NO: 1820-0624 / Expiration Date: 7/31/2015)
Definition of Significant Discrepancy: Michigan defined “significant discrepancy” as a suspension/expulsion rate greater than or equal to 3.6 percent for students with an IEP in any racial/ethnic group who received out-of-school suspensions/expulsions for greater than ten days cumulatively during the school year. In the 2009-2010 school year, 1.8 percent of students with an IEP were suspended/expelled for greater than ten days and that number was doubled to create the 3.6 percent threshold for calculating significant discrepancy. In order for a district to be included in the analyses, there needed to be at least 30 students with an IEP enrolled in the district. For these selected districts the data were analyzed for each race/ethnicity with ten or more students with an IEP enrolled in the district.
Measurable and Rigorous Targets
FFY Baseline Target Actual
Old Methodology Using Risk Ratio 2009
(2008-2009 data) 6.5% 0% 6.5%
Using New Acceptable Methodology per the Office of Special Education Programs (OSEP)
2010 (2009-2010 data) 3.3% 0% 3.3%
2011 (2010-2011 data) 0% 4.9%
2012 (2011-2012 data) 0% 2.9%*
Percent = [(#of districts that have: (a) a significant discrepancy, by race or ethnicity, in the rates of suspensions and expulsions of greater than ten days in a school year of children with an IEP; and (b) policies, procedures or practices that contribute to the significant discrepancy and do not comply with requirements relating to the development and implementation of IEPs, the use of positive behavioral interventions and support, and procedural safeguards) divided by the (#of districts in the state times 100)].
*[25 848] X 100
Source: Michigan Student Data System (MSDS), verification review, CIMS Explanation of Progress or Slippage that occurred for FFY 2012: Michigan did not meet its FFY 2012 zero percent target for Indicator 4B. During the 2011-2012 school year, 2.9 percent of the districts in the state that met the minimum “n” size had more than or equal to 3.6 percent of their students with an IEP suspended/expelled for more than ten days cumulatively in one or more racial/ethnic groups with noncompliant policies, procedures and/or practices that

APR – Part B Michigan
Part B State Annual Performance Report for FFY 2012 (2012-2013) Indicator 4B Page 62 (OMB NO: 1820-0624 / Expiration Date: 7/31/2015)
may have contributed to the significant discrepancy. While this rate did not meet the zero percent target, it is a 2 percent decrease from the previous year’s rate of 4.9 percent. There were 103 districts that had fewer than 30 students with an IEP. Michigan does not collect universal suspension/expulsion data on general education students; therefore, comparison data with that population is not available. Review of Policies, Procedures and Practices For FFY 2012, reporting is based on the 2011-2012 school year data. There were 112 districts identified as having a significant discrepancy by race or ethnicity in the rates of suspension and expulsion prior to monitoring. During February and March, based on the focused monitoring criteria, the Office of Special Education (OSE) conducted on-site reviews, desk audits and state verified self-reviews of these districts’ policies, procedures and practices related to the development and implementation of IEPs, the use of Positive Behavioral Interventions and Supports (PBIS), and procedural safeguards to ensure compliance with the Individuals with Disabilities Education Act (IDEA). After monitoring, 25 districts were found to have noncompliant policies, procedures and/or practices that contributed to the significant discrepancy. Each of these districts was issued a finding of noncompliance in April 2013 and was required to develop and implement a CAP to come into compliance as soon as possible, but in no case later than one year including verification. Displayed in the table below is the number of districts with findings of noncompliance by racial/ethnic groups which had a significant discrepancy.
Racial/Ethnic Group with Significant Discrepancy
Number of Districts28 With Significant
Discrepancy American Indian 2
Asian 1
Black 16
Hispanic 6
White 10
Two or More Races 1 Sources: MSDS, monitoring data from the CIMS
Forty-two districts monitored in the past year were identified as having policies, procedures or practices that contributed to the significant discrepancy and were implementing a CAP to come into compliance within one year including verification. These districts were notified through the CIMS Workbook of the continuing discrepant data and the need to continue to implement the activities of the CAP. These districts continued to receive targeted technical assistance (TA) from state providers until compliance was verified by the OSE and the CAPs were closed. 28 Eight districts had a significant discrepancy in more than one racial/ethnic group.

APR – Part B Michigan
Part B State Annual Performance Report for FFY 2012 (2012-2013) Indicator 4B Page 63 (OMB NO: 1820-0624 / Expiration Date: 7/31/2015)
Discussion of Improvement Activities Completed:
Timelines Activities Status
PROVIDE TECHNICAL ASSISTANCE 2011-2013 1. Provide training and TA to
locals, TA providers and monitors for locals with high suspension/expulsion rates.
Each district with findings of noncompliance was paired with a state TA provider to assist the district in the development of CAPs and training activities. Multiple presentations and learning opportunities were provided to these districts to enhance staff skills related to suspension and expulsion.
IMPROVE COLLABORATION/COORDINATION 2011-2013 3. The OSE will work with
Michigan’s Integrated Behavior and Learning Support Initiative (MiBLSi) personnel to identify districts with high rates of suspension and expulsion. This information will be used to identify districts in need of support and give them priority for selection in MiBLSi participation.
Reference Improvement Activity details below.
Improvement Activity 3 Details:
The OSE and MiBLSi have developed a document that outlines the ways in which the project adds value to partnering intermediate school districts (ISDs) and districts to help them address high priority needs. The collaboration among MiBLSi, the OSE and ISDs around addressing suspension and expulsion for students with an IEP is included in this document and is available on the web at http://miblsi.cenmi.org/LinkClick.aspx?fileticket=WalZjI3VhkQ%3d&tabid=2238. In March 2013, the OSE provided MiBLSi with a list of districts that were identified in 2013 with a significant discrepancy in the rate of suspensions and expulsions of greater than ten days in a school year for students with an IEP. MiBLSi reviewed this list of districts and compared it with the group of ISDs that submitted applications to MiBLSi for participation in 2013. Priority for participation was given to ISDs with districts identified for Indicator 4B. Of the districts identified for Indicator 4B, five previously had schools participate in MiBLSi’s building level support model (Cohorts 1-7) in prior years. One ISD, with three districts identified for Indicator 4B participated in the MiBLSi Exploration/Readiness work during the 2012-2013 school year, but decided not to extend their work to full
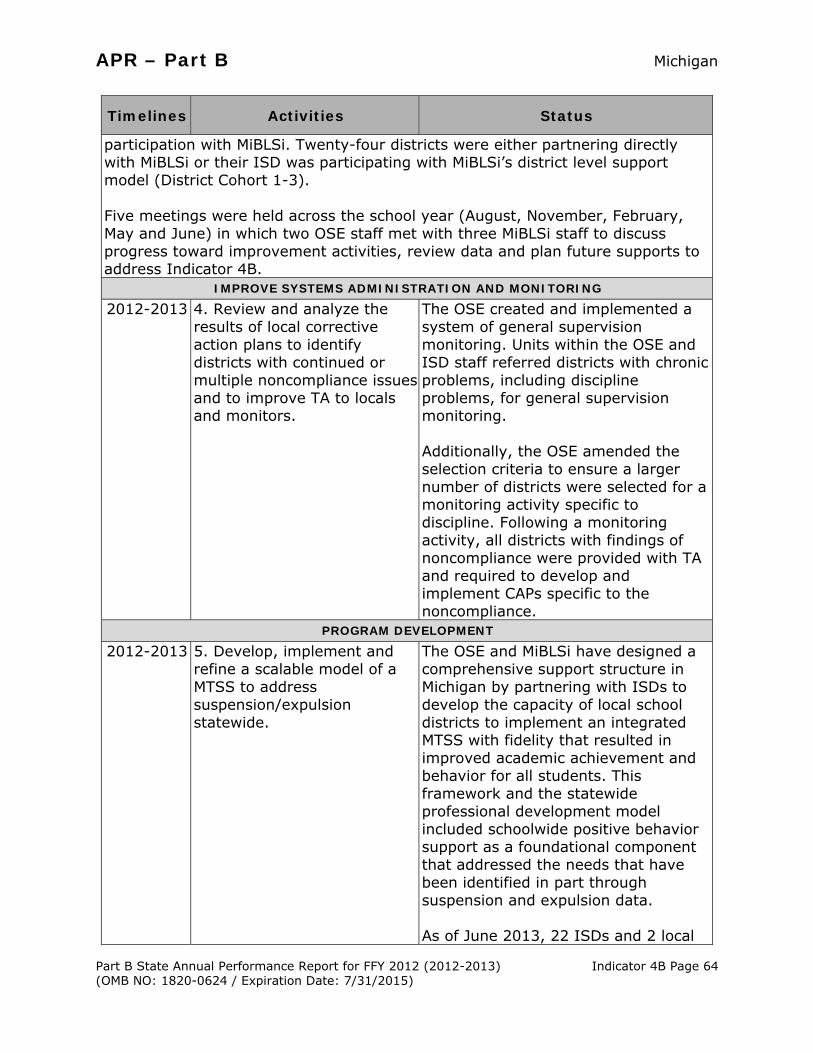
APR – Part B Michigan
Part B State Annual Performance Report for FFY 2012 (2012-2013) Indicator 4B Page 64 (OMB NO: 1820-0624 / Expiration Date: 7/31/2015)
Timelines Activities Status
participation with MiBLSi. Twenty-four districts were either partnering directly with MiBLSi or their ISD was participating with MiBLSi’s district level support model (District Cohort 1-3). Five meetings were held across the school year (August, November, February, May and June) in which two OSE staff met with three MiBLSi staff to discuss progress toward improvement activities, review data and plan future supports to address Indicator 4B.
IMPROVE SYSTEMS ADMINISTRATION AND MONITORING 2012-2013 4. Review and analyze the
results of local corrective action plans to identify districts with continued or multiple noncompliance issues and to improve TA to locals and monitors.
The OSE created and implemented a system of general supervision monitoring. Units within the OSE and ISD staff referred districts with chronic problems, including discipline problems, for general supervision monitoring. Additionally, the OSE amended the selection criteria to ensure a larger number of districts were selected for a monitoring activity specific to discipline. Following a monitoring activity, all districts with findings of noncompliance were provided with TA and required to develop and implement CAPs specific to the noncompliance.
PROGRAM DEVELOPMENT 2012-2013 5. Develop, implement and
refine a scalable model of a MTSS to address suspension/expulsion statewide.
The OSE and MiBLSi have designed a comprehensive support structure in Michigan by partnering with ISDs to develop the capacity of local school districts to implement an integrated MTSS with fidelity that resulted in improved academic achievement and behavior for all students. This framework and the statewide professional development model included schoolwide positive behavior support as a foundational component that addressed the needs that have been identified in part through suspension and expulsion data. As of June 2013, 22 ISDs and 2 local

APR – Part B Michigan
Part B State Annual Performance Report for FFY 2012 (2012-2013) Indicator 4B Page 65 (OMB NO: 1820-0624 / Expiration Date: 7/31/2015)
Timelines Activities Status
school districts were partnering with the OSE and MiBLSi across 3 cohorts. This represents the potential to impact 282 local school districts and public school academies for a total of 1,412 schools and 601,412 students in Michigan.
PROVIDE TRAINING/PROFESSIONAL DEVELOPMENT 2012-2013 6. MiBLSi will provide training,
coaching and TA to participating districts to reduce the number or duration of out-of-school suspensions/expulsions.
Reference Improvement Activity details below.
Improvement Activity 6 Details:
Schools participating in MiBLSi Cohort 7 finished their third and final year of the formal training sequence during the 2012-2013 school year. ISDs in District Cohorts 1 and 2 participated in focused planning sessions during the 2012-2013 school year. These sessions were designed to help ISDs install the necessary systems to support implementation at the district and school level in future years. This resulted in more than 144 trainings and coaching meetings provided to school leadership teams in the areas of schoolwide positive behavior support, schoolwide reading and data driven decision making in the 2012-2013 school year. ISDs in District Cohort 3 began ISD level training during the summer of 2013.
The 2012-2013 school year focused on exploration, adoption and installation stages of implementation. Schools supported by five of the six District Cohort partners have collected baseline data this year that has been used to help refine future data collection, sharing and analysis procedures. This data does not reflect the full cohort group of participating ISDs, districts and schools.
The following data depicts implementation fidelity and student outcomes for schools participating in the school level model. PBIS fidelity data, discipline referral data, and out-of-school suspension data were gathered from the PBIS Evaluation (www.pbisapps.org) for schools that participated with MiBLSi, and reflect data from all students enrolled in a school that has voluntarily participated with MiBLSi. Literacy outcome data were gathered from the Dynamic Indicators of Basic Early Literacy Skills (DIBELS) Data System or requested directly from schools participating with MiBLSi. All districts in the state are required to report suspensions and expulsions of students with an IEP in the MSDS to the Michigan Department of Education. The Benchmarks of Quality (BOQ) is a team self-assessment used to evaluate the extent to which universal PBIS is being implemented. There were 180 schools

APR – Part B Michigan
Part B State Annual Performance Report for FFY 2012 (2012-2013) Indicator 4B Page 66 (OMB NO: 1820-0624 / Expiration Date: 7/31/2015)
Timelines Activities Status
that submitted BOQ data during the 2012-2013 school year. For these 180 schools, the mean BOQ total score was 78 percent. Seventy-eight percent of schools met or exceeded the BOQ criterion total score of 70 percent. A total score of 70 percent on the BOQ indicates a minimum threshold for implementation fidelity of schoolwide PBIS. Schools with total scores below 70 percent should not expect to see improvements in student behavior because a score below 70 percent is one indicator that a school is not implementing schoolwide PBIS with fidelity. Office Discipline Referrals (ODR): For schools that met criterion on the BOQ, the mean rate of discipline referrals per 100 students per day was 0.48 percent. The median rate of discipline referrals for schools that did not meet criterion on the BOQ was 0.68 percent. This demonstrates that schools implementing PBIS with fidelity had lower rates of office discipline referrals than schools not implementing PBIS with fidelity. Table 1:
Student Race/Ethnicity
Schools Implementing PBIS with Fidelity (BOQ Total Score at or
above 70%)
Schools Not Implementing PBIS with
Fidelity (BOQ Total Score below 70%)
Percent of Enrollment
Percent of students from each racial/
ethnic group with at least one ODR
Percent of Enrollment
Percent with at
least one ODR
American Indian or Alaskan Native
1% <1% 1% <1%
Asian 3% 1% 1% <1% African American/Black 16% 27% 37% 54%
Hispanic/Latino 11% 9% 13% 11% Native Hawaiian or Other Pacific Islander
<1% <1% <1% <1%
White 68% 61% 45% 32% Two or More Races 2% 2% 3% 2%
Source: MiBLSi Database Revealed in Table 1 is that whether or not a school implements PBIS with fidelity, Black students were still over-referred for disciplinary infractions compared to their White peers (over-referred by 11 percent for schools implementing PBIS with fidelity and over-referred by 17 percent for schools not implementing PBIS

APR – Part B Michigan
Part B State Annual Performance Report for FFY 2012 (2012-2013) Indicator 4B Page 67 (OMB NO: 1820-0624 / Expiration Date: 7/31/2015)
Timelines Activities Status
with fidelity). However, when a school is implementing PBIS with fidelity, as evidenced by a BOQ total score at or above 70 percent, the magnitude of over-referrals is less than for schools not implementing PBIS with fidelity. This data indicates that PBIS may have a positive impact on disproportionate disciplinary outcomes by race/ethnicity. MiBLSi is currently developing a pilot model that may help to better address equitable disciplinary practices in schools. Out-of-School Suspensions: For schools that met criterion on the BOQ, the average percent of students with at least one out-of-school suspension was 5 percent. On average, 12 percent of students were suspended in schools that did not meet criterion on the BOQ. Based on data gathered through MSDS, the median percent of students with at least one out-of-school suspension was 5.6 percent for schools that met criterion on the BOQ (74 of 123). On average, 16.9 percent of students were suspended in schools that did not meet criterion on the BOQ (25 of 37). Reflected in Table 2 below are the MSDS data for both districts that met criterion on the BOQ and those districts that did not. This demonstrates that schools implementing PBIS with fidelity suspended a smaller proportion of students than schools not implementing PBIS with fidelity. This is the first step towards reducing disproportionality in suspensions and expulsions. Table 2:
Criterion on BOQ Descriptive Statistic School Year
2011-2012 School Year 2012-2013
Met Median 7.4 5.6 Met Mean 10.3 8.95
Met Number of Schools with out-of-school suspensions 78 74
Met Number of Schools for 2012-2013 123 123
Met Percent of Schools with no out-of-school suspensions 36.6% 39.8%
Not Met Median 19.3 16 Not Met Mean 19.2 16.9
Not Met Number of Schools with out-of-school suspensions 21 25
Not Met Number of Schools for 2012-2013 37 37
Not Met Percent of Schools with no out-of-school suspensions 43.2% 32.4%
Source: MSDS Reading Achievement: For schools that met criterion on the BOQ, the mean percent of students that were reading at grade level was 65 percent compared to only 53 percent in schools that did not meet criterion on the BOQ. The above data demonstrates the positive outcomes achieved by schools participating with MiBLSi when those schools are implementing PBIS with fidelity.

APR – Part B Michigan
Part B State Annual Performance Report for FFY 2012 (2012-2013) Indicator 4B Page 68 (OMB NO: 1820-0624 / Expiration Date: 7/31/2015)
Timelines Activities Status
MiBLSi plans to evaluate the impact on student outcomes when schools implement an integrated model of multi-tiered system of support (MTSS) (behavior and reading) and when districts and ISDs have the internal capacity to support and sustain implementation of MTSS.
Timely Correction of FFY 2011 Findings of Noncompliance (corrected within one year from identification of the noncompliance): 1. Number of findings of noncompliance the state made during FFY 2011
(the period from July 1, 2011 through June 30, 2012) 57
2. Number of FFY 2011 findings the state verified as timely corrected [corrected within one year from the date of notification to the LEA of the finding]
56
3. Number of FFY 2011 findings not verified as corrected within one year [(1) minus (2) above] 1*
*This number reflects one district with noncompliance which is also reported in the Indicator 4A report.
FFY 2011 Findings of Noncompliance Not Timely Corrected (corrected more than one year from identification of the noncompliance and/or Not Corrected): 4. Number of FFY 2011 findings not timely corrected [same as the number
from (3) above] 1
5. Number of FFY 2011 findings the state has verified as corrected beyond the one-year timeline (“subsequent correction”) 1
6. Number of FFY 2011 findings not verified as corrected [(4) minus (5) above] 0
Correction of FFY 2011 Findings of Noncompliance (See Indicator 15)
FFY 2011 Correction of Noncompliance
Finding Indicator District Identifier
Nature of Noncompliance
Program-Specific Follow-Up Activities Related To The
Uncorrected Noncompliance 2 4A/B 772 The district’s
practices related to the suspension/ expulsion of students with an IEP were not compliant with IDEA regulations.
Finding issued: April 15, 2012 as a result of a focused monitoring activity. Summary of Activities: The OSE required a CAP based on a root cause analysis and submission of a progress report. State supervision and TA providers were assigned and were under close OSE supervision. The status of the correction of noncompliance was included in monthly meetings and

APR – Part B Michigan
Part B State Annual Performance Report for FFY 2012 (2012-2013) Indicator 4B Page 69 (OMB NO: 1820-0624 / Expiration Date: 7/31/2015)
FFY 2011 Correction of Noncompliance
Finding Indicator District Identifier
Nature of Noncompliance
Program-Specific Follow-Up Activities Related To The
Uncorrected Noncompliance conference calls. Status: Verified as corrected by TA provider and ISD monitors and closed by the OSE on December 30, 2013.
Revisions, with Justification, to Proposed Targets / Improvement Activities / Timelines / Resources for FFY 2012
Timelines New and Revised Activities Justification
2012-2014 Revision of Activity #6: MiBLSi will provide training, coaching and TA to participating districts to implement a MTSS with fidelity in order to reduce the number or duration of out-of-school suspensions/expulsions and increase students' academic achievement in reading.
This activity was rewritten to include an expectation to increase students’ academic achievement in reading.
Michigan Part B FFY 2011 State Performance Plan (SPP)/APR Response Table from OSEP
Indicator Status OSEP Analysis and Next Steps
Michigan Response
The State revised the improvement activities for FFY 2011 and FFY 2012 for this indicator and OSEP accepts those revisions. The State reported its definition of “significant discrepancy.” For FFY 2011, the State reported that 138 districts were identified as having a significant discrepancy, by race or ethnicity, in the rate of suspensions and expulsions of greater than ten days in a school year for children with IEPs. The State reported that it reviewed the districts’ policies,
Because the State reported less than 100% compliance (greater than 0% actual target data for this indicator) for FFY 2011, the State must report on the status of correction of noncompliance identified in FFY 2011 for this indicator. The State must demonstrate, in the FFY 2012 APR, that the districts identified with noncompliance in FFY 2011 have corrected the noncompliance, including that the State verified that each district with
The state identified 41 districts that were found to have noncompliant policies, procedures and/or practices that contributed to the significant discrepancy in FFY 2011. Forty districts corrected within one year of notification. One district corrected beyond one year. All correction of noncompliance was verified by the state

APR – Part B Michigan
Part B State Annual Performance Report for FFY 2012 (2012-2013) Indicator 4B Page 70 (OMB NO: 1820-0624 / Expiration Date: 7/31/2015)
Indicator Status OSEP Analysis and Next Steps
Michigan Response
procedures, and practices relating to the development and implementation of IEPs, the use of positive behavioral interventions and supports, and procedural safeguards to ensure compliance with the IDEA, as required by 34 CFR §300.170(b) for the districts identified with significant discrepancies. The State also reported that 41 districts were identified as having policies, procedures or practices that contribute to the significant discrepancy and do not comply with requirements relating to the development and implementation of IEPs, the use of positive behavioral interventions and supports, and procedural safeguards. The State reported that 110 of 832 districts did not meet the State-established minimum “n” size requirement of 30 students with an IEP. The State reported that it revised (or required the affected districts to revise), the districts’ policies, procedures, and practices relating to the development and implementation of IEPs, the use of positive behavioral interventions and supports, and procedural safeguards to ensure compliance with the IDEA, pursuant to 34 CFR §300.170(b) for the districts identified with significant discrepancies in FFY 2011. The State reported that noncompliance identified in FFY
noncompliance: (1) is correctly implementing the specific regulatory requirement(s) (i.e., achieved 100% compliance) based on a review of updated data such as data subsequently collected through on-site monitoring or a State data system; and (2) has corrected each individual case of noncompliance, unless the child is no longer within the jurisdiction of the district, consistent with OSEP Memo 09-02. In the FFY 2012 APR, the State must describe the specific actions that were taken to verify the correction.
that each LEA with noncompliance: (1) has corrected each individual case of noncompliance, unless the child is no longer within the jurisdiction of the LEA, consistent with OSEP Memo 09-02, dated October 17, 2008; and (2) is correctly implementing the specific regulatory requirements (i.e., achieved 100 percent compliance) based on a review of updated data such as data subsequently collected through on-site monitoring or the state data system. For additional information pertaining to the correction of noncompliance, reference Michigan’s Continuous Improvement and Monitoring System in Appendix C.

APR – Part B Michigan
Part B State Annual Performance Report for FFY 2012 (2012-2013) Indicator 4B Page 71 (OMB NO: 1820-0624 / Expiration Date: 7/31/2015)
Indicator Status OSEP Analysis and Next Steps
Michigan Response
2010 through the review of policies, procedures, and practices, pursuant to 34 CFR §300.170(b), was corrected.

APR – Part B Michigan
Part B State Annual Performance Report for FFY 2012 (2012-2013) Indicator 5 Page 72 (OMB NO: 1820-0624 / Expiration Date: 7/31/2015)
Part B State Annual Performance Report (APR) for FFY29 2012 (2012-2013) Overview of Indicator 5 (Educational Environments) Report Development: 1. See General Overview pages 6-12. 2. The Office of Special Education (OSE) continues to prioritize focused monitoring
activities for educational environments for districts that have low percentages of students with an individualized education program (IEP) inside the regular class 80 percent or more of the day.
Monitoring Priority: FAPE in the LRE30 / Educational Environments: Ages 6 through 21
(Results Indicator)
Indicator 5: Percent of children with an IEP aged 6 through 21 served:
A. Inside the regular class 80 percent or more of the day;
B. Inside the regular class less than 40 percent of the day; and
C. In separate schools, residential facilities, or homebound/hospital placements. (20 U.S.C. 1416(a)(3)(A))
Measurement:
A. Percent = [(# of children with an IEP served inside the regular class 80 percent or more of the day) divided by the (total # of students aged 6 through 21 with an IEP)] times 100.
B. Percent = [(# of children with an IEP served inside the regular class less than 40 percent of the day) divided by the (total # of students aged 6 through 21 with an IEP)] times 100.
C. Percent = [(# of children with an IEP served in separate schools, residential facilities, or homebound/hospital placements) divided by the (total # of students aged 6 through 21 with an IEP)] times 100.
29 Federal Fiscal Year 30 Free Appropriate Public Education in the Least Restrictive Environment

APR – Part B Michigan
Part B State Annual Performance Report for FFY 2012 (2012-2013) Indicator 5 Page 73 (OMB NO: 1820-0624 / Expiration Date: 7/31/2015)
Measurable and Rigorous Targets A. Increase the percentage of students served inside the regular class 80% or more of the day
FFY Baseline Target Actual
2005 54.0%
2006 > 55.0% 50.3%
2007 > 57.0% 53.5%
2008 > 59.0% 57.6%
2009 > 61.0% 61.1%
2010 > 63.0% 61.6%
2011 > 63.0% 62.7%
2012 > 63.0% 64.3%* Percent = [(# of children with an IEP served in the regular class 80% or more of the day) divided by the (total # of students aged 6 through 21 with an IEP)] times 100.
*[117,319 ÷ 182,596] X 100
Measurable and Rigorous Targets B. Decrease the percentage of students served inside the regular class less than 40% of the day
FFY Baseline Target Actual
2005 17.9%
2006 < 16.9% 18.5%
2007 < 15.4% 16.8%
2008 < 13.9% 15.0%
2009 < 12.4% 14.0%
2010 < 11.9% 12.5%
2011 < 11.9% 11.9%
2012 < 11.9% 11.4%* Percent = [(# of children with an IEP served in the regular class less than 40% of the day) divided by the (total # of students aged 6 through 21 with an IEP)]
times 100.
*[20,789 ÷ 182,596] X 100

APR – Part B Michigan
Part B State Annual Performance Report for FFY 2012 (2012-2013) Indicator 5 Page 74 (OMB NO: 1820-0624 / Expiration Date: 7/31/2015)
Measurable and Rigorous Targets C. Decrease the percentage of students served in separate facilities
FFY Baseline Target Actual
2005 5.2%
2006 < 5.1% 5.0%
2007 < 5.1% 4.8%
2008 < 5.0% 4.9%
2009 < 4.9% 4.9%
2010 < 4.8% 5.2%
2011 < 4.8% 5.5%
2012 < 4.8% 5.3%* Percent = [(# of children with an IEP served in public or private separate schools, residential placements, or homebound or hospital placements) divided by the (total # of students aged 6 through 21 with an IEP)] times 100.
*[9,634 ÷ 182,596] X 100 Source for A-C: Michigan Student Data System
Explanation of Progress or Slippage that occurred for FFY 2012: Michigan met its FFY 2012 target for Indicator 5 in two of the three measurement categories. The percentage of students served inside the general education class 80 percent or more of the day increased by more than a full percentage point compared to the prior year; Target A was met. The percentage of students served inside the general education class for less than 40 percent of the day decreased by a half of a percent when compared to the prior year’s data; Target B was met. There was a slight decrease in the percentage of students reported as being served in separate facilities; Target C was not met. A comparison of the numbers of students reported as being served in separate facilities in FFY 2011 and FFY 2012 shows that there has been a decrease of 812 students, resulting in a 0.2 percent decrease statewide. Focused Monitoring Activities Eleven districts participated in on-site focused monitoring for educational environments during FFY 2012. The districts were selected based on their low percentages of students with an IEP in a general education class for 80 percent or more of the day (Target A). Ten of the eleven districts had findings related to educational environments. Districts that did not meet all three targets for FFY 2011 were requested through the April 15, 2013 Continuous Improvement and Monitoring System (CIMS) Workbook to convene a Review and Analysis Process (RAP) team. The RAP team

APR – Part B Michigan
Part B State Annual Performance Report for FFY 2012 (2012-2013) Indicator 5 Page 75 (OMB NO: 1820-0624 / Expiration Date: 7/31/2015)
reviews and analyzes their data as well as the underlying issues, strategies for improvement and methods for monitoring progress. The teams were then requested to prepare a report for their district school improvement team. A review of reports received indicated that there were a number of factors involved:
Data reporting errors. Lack of professional development for staff. Districts operating regional center programs or regional separate facilities as
a part of a consortium for students with more severe impairments (students from other districts placed into these programs were included in the operating district’s educational environments data).
In very small districts with small numbers of students with an IEP the movement in or out of the district of one or two students caused a significant change in percentages.
Districts using a traditional pull-out model of service delivery. Budget reductions eliminating or reducing co-teaching opportunities. Scheduling issues at middle schools and high schools, including trimesters
and block scheduling. Small districts having difficulty scheduling co-teaching opportunities due to
limited numbers of special education teachers. More rigorous graduation requirements of the Michigan Merit Curriculum
affecting the class of 2012 and beyond resulting in more intensive programming.
Districts that identified these factors developed improvement activities to address these concerns. All ten districts with findings have corrected their noncompliance within one year. Changing Practices More districts report moving away from the traditional pull-out model of service delivery as a result of reviewing their educational environments data. Many districts use team teaching and co-teaching models, as well as differentiated instruction, to support students with an IEP and other at-risk students in general education settings. The widespread adoption of a multi-tiered system of support (MTSS), including Michigan’s Integrated Behavior and Learning Support Initiative, has increased data-based decision-making for instruction. Data Reporting Targeted technical assistance (TA) from the OSE for special education administrators and data entry personnel has continued to help districts improve accuracy in their educational environments data reporting. In particular, the OSE has provided TA on the accurate reporting of students with an IEP in separate facilities, correctional facilities, residential facilities and virtual schools.

APR – Part B Michigan
Part B State Annual Performance Report for FFY 2012 (2012-2013) Indicator 5 Page 76 (OMB NO: 1820-0624 / Expiration Date: 7/31/2015)
Discussion of Improvement Activities Completed:
Timelines Activities Status
IMPROVE SYSTEMS ADMINISTRATION AND MONITORING
2011-2013
1. Verify and analyze data for the districts whose percentage of students with an IEP in general education greater than or equal to 80 percent of the day and those in separate facilities are furthest below the state target. Help districts review policies, procedures and practices related to environment data and require them, as needed, to develop and implement improvement plans.
In the 2012-2013 school year, the OSE used on-site visits to monitor 10 districts’ policies, procedures and practices related to educational environment data. Noncompliance was found in all 10 districts. Upon notification of findings, these districts were required to develop and implement corrective action plans (CAPs) to come into compliance as soon as possible, but in no case later than one year including verification. All 10 districts are currently in their year of correction.
2011-2013 2. Districts which fail to correct instances of noncompliance within one year will be required to revise their CAPs to achieve compliance. The districts will receive increased OSE on-site TA including close supervision of the implementation of the revised CAP.
All districts with identified noncompliance for this reporting period have completed their corrective action plans within one year, submitted their proof of correction of noncompliance and the compliance has been verified and accepted by the OSE.
PROVIDE TECHNICAL ASSISTANCE
2011-2013
3. Provide TA to districts to assist them with issues such as: Understanding how to report
educational environment data accurately, focusing on defining what constitutes time in special education environments and time in general education.
Helping district data entry staff to improve the accuracy and consistency of student data reporting.
Emphasizing accuracy of data reported for separate facilities.
The Center for Educational Performance and Information (CEPI) and the OSE provided TA to districts through conference calls, the CEPI Help Desk, workshops, intermediate school district director meetings, individualized TA by phone or email and memoranda highlighting correct procedures for common data reporting errors. TA also included how to correctly report students in separate facilities, correctional facilities, residential facilities, and virtual schools. The OSE continued to provide TA for the districts to ensure accuracy in future Educational Environments

APR – Part B Michigan
Part B State Annual Performance Report for FFY 2012 (2012-2013) Indicator 5 Page 77 (OMB NO: 1820-0624 / Expiration Date: 7/31/2015)
Timelines Activities Status reporting.
Revisions, with Justification, to Proposed Targets/Improvement Activities/Timelines/Resources for FFY 2012
Timelines New and Revised Activities Justification
2011-2014
Revision of Activity #1: Review data for the districts whose percentage of students with an IEP in general education greater than or equal to 80 percent of the day and for those districts whose students with an IEP in separate facilities did not meet the state targets. Apply selection criteria to determine level of monitoring activity needed to help districts review policies, procedures and practices related to educational environment data and require them, as needed, to develop and implement improvement activities.
This activity was revised to more specifically identify what the OSE does in response to Indicator 5 data.
2011-2013
Deletion of Activity #2: Districts which fail to correct instances of noncompliance within one year will be required to revise their CAPs to achieve compliance. The districts will receive increased OSE on-site TA including close supervision of the implementation of the revised CAP.
This activity has been completed.
2011-2014 Revision of Activity #3: For 100 percent of districts whose monitoring activity has led to the issuance of a finding of noncompliance, assign a TA provider and provide professional development to the district team to assist them with identifying resources, including programs available through the OSE Mandated Activities Projects (MAPs) which may align with their improvement activities.
This activity was revised to be more explicit about available resources and more fully integrate the work of MAPs into the TA process for districts with Indicator 5 findings.

APR – Part B Michigan
Part B State Annual Performance Report for FFY 2012 (2012-2013) Indicator 5 Page 78 (OMB NO: 1820-0624 / Expiration Date: 7/31/2015)
Michigan Part B FFY 2011 State Performance Plan (SPP)/APR Response Table from the Office of Special Education Programs (OSEP)
Indicator Status OSEP Analysis and Next Steps
Michigan Response
Percent of children with IEPs aged 6 through 21 served:
FFY 2010 Data
FFY 2011 Data
FFY 2011 Target
A. In Regular Education 80% or More of Day 61.6% 62.7% > 63.0%
B. In Regular Education Less than 40% of Day 12.5% 11.9% < 11.9%
C. In Separate Schools, Residential Facilities, or Homebound/ Hospitals
5.2% 5.5% < 4.8%
The OSEP listed no required actions in the FFY 2011 Response Table for Indicator 5.
None required at this time.


APR – Part B Updated 4-23-14 Michigan
Part B State Annual Performance Report for FFY 2012 (2012-2013) Indicator 6 Page 80 (OMB NO: 1820-0624 / Expiration Date: 7/31/2015)
Part B State Annual Performance Report (APR) for FFY31 2012 (2012-2013) Overview of Indicator 6 (Early Childhood Educational Environments: Ages 3 through 5) Report Development:
1. See General Overview pages 6-12. 2. FFY 2011 was the first year data were collected and used to establish
baseline. 3. FFY 2011 was the first year targets were set for this indicator. Targets were
set for FFY 2012 with stakeholder input. 4. The stakeholder team will continue to review the data collection and
reporting processes in order to determine any necessary changes or to reset targets pending subsequent data collection.
5. Data used in reporting this indicator includes kindergarten students who were five years old as of the fall child count date.
Monitoring Priority: FAPE in the LRE32/ Early Childhood Educational Environments: Ages 3 through 5 (Results Indicator) Indicator 6: Percent of children aged 3 through 5 with an individualized education program (IEP) attending a:
A. Regular early childhood program and receiving the majority of special education and related services in the regular early childhood program; and
B. Separate special education class, separate school or residential facility. (20 U.S.C. 1416(a)(3)(A)) Measurement: A. Percent = [(# of children aged 3 through 5 with an IEP attending a regular early
childhood program and receiving the majority of special education and related services in the regular early childhood program) divided by the (total # of children aged 3 through 5 with an IEP)] times 100.
B. Percent = [(# of children aged 3 through 5 with an IEP attending a separate special education class, separate school or residential facility) divided by the (total # of children aged 3 through 5 with an IEP)] times 100.
31 Federal Fiscal Year 32 Free Appropriate Public Education in the Least Restrictive Environment

APR – Part B Updated 4-23-14 Michigan
Part B State Annual Performance Report for FFY 2012 (2012-2013) Indicator 6 Page 81 (OMB NO: 1820-0624 / Expiration Date: 7/31/2015)
Measurable and Rigorous Targets A. Percent of children aged 3 through 5 with an IEP attending a
regular early childhood program and receiving the majority of special education and related services in the regular early childhood program.
FFY Baseline Target Actual
2011 (2011-2012) 27.2%
2012 (2012-2013) >28.2% 28.4%* Percent = [(# of children aged 3 through 5 with an IEP attending a regular early childhood program (1) at least 10 hours per week or (2) less than 10 hours per week and receiving the majority of special education and related services in the regular early childhood program) divided by the (total # of children aged 3 through 5 with an IEP)] times 100.
*((5,173 + 753) ÷ 20,831) X 100 = 28.4%
Measurable and Rigorous Targets
B. Percent of children aged 3 through 5 with an IEP attending a separate special education class, separate school or residential facility.
FFY Baseline Target Actual
2011 (2011-2012) 44.2%
2012 (2012-2013) <43.2% 43.9%* Percent = [(# of children aged 3 through 5 with an IEP attending a (1) separate special education class, (2) separate school or (3) residential facility) divided by
the (total # of children aged 3 through 5 with an IEP)] times 100.
*((8,696 + 438 + 11) ÷ 20,831) X 100 = 43.9% Source for A & B: Michigan Student Data System (MSDS)
Explanation of Progress or Slippage that occurred for FFY 2012: Michigan met its FFY 2012 target of greater than or equal to 28.2 percent for Indicator 6A. The overall percentage increase from FFY 2011 to FFY 2012 was 1.2 percent, exceeding the established target by .2 percent. In comparing the FFY 2012 data to the FFY 2011 baseline data, the following trends were noted with regard to educational environment and age. Of the children aged three through five with an IEP attending a regular early childhood program and receiving the majority of special education and related services in the regular early childhood program, Michigan increased the percentage of each age group three, four and five year old children by .2, .3, and .7 percent respectively who received the majority of services in the general education setting (see Table 1 below). These

APR – Part B Updated 4-23-14 Michigan
Part B State Annual Performance Report for FFY 2012 (2012-2013) Indicator 6 Page 82 (OMB NO: 1820-0624 / Expiration Date: 7/31/2015)
increases may be attributed to the statewide trainings and technical assistance (TA) provided. The training and TA included in-person trainings, online training, and the development and dissemination of guidance documents to assist school personnel in reporting the appropriate education environment for students with an IEP. Analysis of the Indicator 6A data revealed that of the 5,926 total children, 3,856 or 65.1 percent, were four and five year old children. These four and five year old children may be in one of three settings; a developmental kindergarten, kindergarten or first grade classroom. Michigan has few publically funded regular early childhood programs for three year old children. Head Start and a state-funded preschool program for four year old children at risk of school failure are the only publically funded preschool options available in Michigan. With only these two programs, opportunities for children with an IEP are limited. Michigan continues with targeted state and local efforts to embed interventions in the regular early childhood program. Table 1: A. Percent of children with an IEP attending a regular early
childhood program and receiving the majority of special education and related services in the regular early childhood program
(Michigan FFY 2012 target > 28.2%) FFY Age 3 Age 4 Age 5 Total %
2011 (2011-2012) 3.6% 7.1% 16.5% 27.2%
2012 (2012-2013) 3.8% 7.4% 17.2% 28.4% Percent = [(# of children at each age with an IEP attending a regular early childhood program (1) at least 10 hours per week or (2) less than 10 hours
per week and receiving the majority of special education and related services in the regular early childhood program) divided by the (total # of children
aged 3 through 5 with an IEP)] times 100. Source: MSDS
Michigan did not meet its FFY 2012 target of less than or equal to 43.2 percent for Indicator 6B. Although the target was not met for this indicator, there was a decrease in the percentage of three and four year old children with an IEP attending a separate special education class, separate school or residential facility (see Table 2). The decrease in Target B may be attributed to the heightened awareness of the Office of Special Education Program’s (OSEP) memo dated February 29, 2012, (http://www2.ed.gov/policy/speced/guid/idea/memosdcltrs/preschoollre22912.pdf) as well as additional statewide guidance and TA that reiterated the LRE requirements apply to placement of preschool children with an IEP. Training and TA was provided throughout the state on Preschool Outcomes. LRE considerations were integrated into both the in-person and online outcomes trainings. In the outcomes trainings, it was discussed and understood by educators

APR – Part B Updated 4-23-14 Michigan
Part B State Annual Performance Report for FFY 2012 (2012-2013) Indicator 6 Page 83 (OMB NO: 1820-0624 / Expiration Date: 7/31/2015)
and administrators that collaboration between the classroom teachers and the specialists providing the services to students with an IEP result in higher quality assessment and collection of Preschool Outcomes data. As indicated in Table 2, the progress made by three and four year old children was not realized for the five year old population who are in the K-12 system as they are not assessed on Preschool Child Outcomes. The collaborative training referenced in the above paragraph was provided only to early childhood and early childhood special education staff. The K-12 staff did not have the same access to the training and TA that was available for the early childhood/early childhood special education field which may help explain why the five year olds did not experience the same decrease as the three and four year old children.
Table 2: B. Percent of children with an IEP attending a separate special
education class, separate school or residential facility (Michigan FFY 2012 target < 43.2%)
FFY Age 3 Age 4 Age 5 Total %
2011 (2011-2012) 14.6% 16.5% 13.1% 44.2%
2012 (2012-2013) 14.4% 16.2% 13.3% 43.9%
Percent = [(# of children aged with an IEP attending a (1) separate special education class, (2) separate school or (3) residential facility) divided by
the (total # of children aged 3 through 5 with an IEP)] times 100. Source: MSDS Discussion of Improvement Activities Completed:
Timelines Activities Status
PROVIDE TRAINING/PROFESSIONAL DEVELOPMENT 2012-2013
1. Provide professional development on inclusive opportunities in a variety of formats at early learning forums such as the Michigan Collaborative Early Childhood Conference, Michigan Division for Early Childhood, and the Upper Peninsula Early Childhood Conference.
The Office of Great Start/Early Childhood Education & Family Services (OGS/ECE&FS) and its TA grantee, Clinton County Regional Educational Service Agency (CCRESA), provided 90-minute breakout sessions at the conferences listed in this activity. Keynote and/or breakout sessions on inclusive practices were offered at the Michigan Council for Exceptional Children Conference, the Michigan Collaborative Early Childhood Conference and the Michigan Division for Early

APR – Part B Updated 4-23-14 Michigan
Part B State Annual Performance Report for FFY 2012 (2012-2013) Indicator 6 Page 84 (OMB NO: 1820-0624 / Expiration Date: 7/31/2015)
Timelines Activities Status
Childhood Conference.
2012-2013 2. Provide TA to school districts in determining appropriate educational environment codes for preschool children with an IEP.
OGS/ECE&FS developed and disseminated two TA documents that helped districts to determine appropriate educational environment codes. The educational environment worksheet provided a detailed explanation of each code. The second document was an educational environment decision tree document which assisted districts to select the appropriate environment codes. OGS/ECE&FS and its TA grantee CCRESA recorded a webinar to help districts understand and utilize the developed documents on determining appropriate educational environments and made the document available on CCRESA’s website.
2012-2013 3. Identify intermediate school districts (ISDs) that have established successful working relationships between Early Childhood Special Education personnel, general preschool education and childcare. These ISDs will then share successful practices with key Section 619 contacts through a forum that will allow questions and answers and follow-up communication on the topic of Least Restrictive Environment.
OGS/ECE&FS and its TA grantee CCRESA hosted meetings (Preschool Inclusion Pilot Project) that provided ISDs with the opportunity to share the successful working relationships they developed around inclusionary practices for preschool aged children with an IEP. An inclusion policy paper titled Aiming for Success: Improving Outcomes and School Readiness for Young Children with Disabilities was developed based on stakeholder input and disseminated. This document highlighted concerns and strengths around inclusionary practices in Michigan and concluded with recommendations for improvement.

APR – Part B Updated 4-23-14 Michigan
Part B State Annual Performance Report for FFY 2012 (2012-2013) Indicator 6 Page 85 (OMB NO: 1820-0624 / Expiration Date: 7/31/2015)
Revisions, with Justification, to Proposed Targets / Improvement Activities / Timelines / Resources for FFY 2012
Timelines New and Revised Activities Justification
PROVIDE TRAINING/PROFESSIONAL DEVELOPMENT 2012-2014 Revision of Activity #1: Increase access
to professional development on the benefits of educating preschool children in inclusive settings with typically developing peers. These professional development opportunities will include: conference presentations, online training and webinars.
Improvement activity clarification was needed to develop improvement activities that were specific to the indicator, measured student outcomes, and could be achieved in the short-term.
PROVIDE TECHNICAL ASSISTANCE
2012-2014 Revision of Activity #2: Provide targeted TA to participating ISDs pertaining to 1) options for settings for preschool aged children with IEPs, and 2) assisting in the identification of appropriate placements for preschool aged children with IEPs based on the individual needs of the child for the LRE.
Targeted TA will occur in the following phases:
Phase I: Indicator 6 and Indicator 7 data will be reviewed and shared with all ISDs in the state.
Phase II: Of the interested ISDs, 4 will be selected for individualized intensive TA based on Indicator 6 and 7 data to be provided over the next two years. Effectiveness of the TA will be measured over 2 years.
Improvement activity clarification was needed to develop improvement activities that were specific to the indicator, measured student outcomes, and could be achieved in the short-term.
New Resources: Center for Educational Performance and Information, Statewide Autism Resources and Training
IMPROVE COLLABORATION/COORDINATION 2013-2014 New Activity: Development of tiered
workgroups to focus on state level and local level challenges to inclusion. Phase I - Recruit and convene a
workgroup of decision makers at the
Based on feedback from stakeholders involved in the Preschool Inclusion Pilot Project, Michigan Association of

APR – Part B Updated 4-23-14 Michigan
Part B State Annual Performance Report for FFY 2012 (2012-2013) Indicator 6 Page 86 (OMB NO: 1820-0624 / Expiration Date: 7/31/2015)
Timelines New and Revised Activities Justification
state level who are in charge of and responsible for Early Childhood Special Education (ECSE), Great Start Readiness Program (GSRP), Office of Special Education (OSE), Head Start, Great Start Regional Resource Centers, Great Start to Quality team, State Aid, Pupil Accounting to initiate an open dialogue and discussion to identify and address barriers, including funding logistics, to include preschool aged children with IEPs in these general education programs/settings.
Phase II – Upon completion of Phase I, develop and convene a separate workgroup that represents the district and local levels to focus on identification of strategies for including children with IEPs in state and federally funded preschool programs as well as in other general education preschool settings.
Phase III – Upon completion of Phase I and Phase II Collaboration of the two workgroups outlined above in the two phases to focus on identifying solutions for overcoming additional barriers, sharing of inclusionary practices and funding logistics. Statewide distribution of best practice documents garnered from Phase I and Phase II.
Administrators of Special Education Early Childhood Community of Practice, and those interviewed for the inclusion policy paper, as well as our rate of progress on improving on indicator data, it was evident that Michigan needed to improve collaboration and coordination of efforts at the state level to break down regulatory and policy-related barriers to serving children with an IEP in regular settings and to increase inclusion options for preschool aged children with special needs at the local level.
Resources: OGS/ECE&FS, CCRESA New Resources: Center for Educational Performance and Information, Statewide Autism Resources and Training
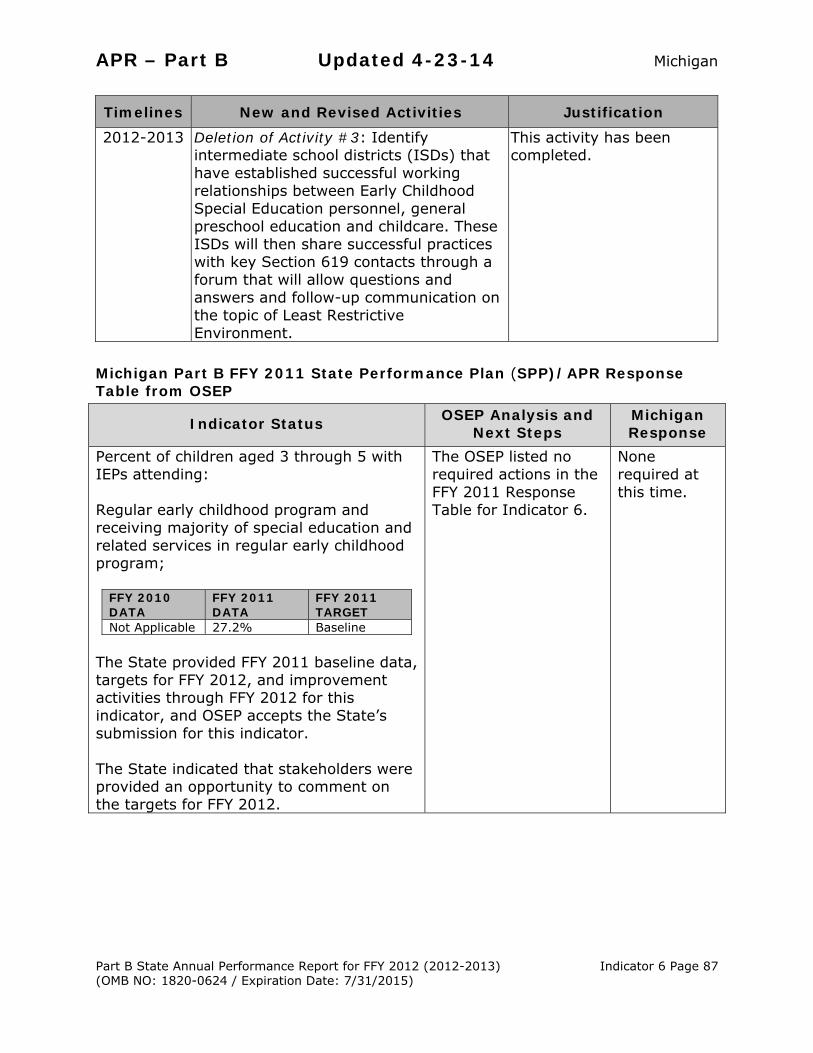
APR – Part B Updated 4-23-14 Michigan
Part B State Annual Performance Report for FFY 2012 (2012-2013) Indicator 6 Page 87 (OMB NO: 1820-0624 / Expiration Date: 7/31/2015)
Timelines New and Revised Activities Justification
2012-2013 Deletion of Activity #3: Identify intermediate school districts (ISDs) that have established successful working relationships between Early Childhood Special Education personnel, general preschool education and childcare. These ISDs will then share successful practices with key Section 619 contacts through a forum that will allow questions and answers and follow-up communication on the topic of Least Restrictive Environment.
This activity has been completed.
Michigan Part B FFY 2011 State Performance Plan (SPP)/APR Response Table from OSEP
Indicator Status OSEP Analysis and Next Steps
Michigan Response
Percent of children aged 3 through 5 with IEPs attending: Regular early childhood program and receiving majority of special education and related services in regular early childhood program;
FFY 2010 DATA
FFY 2011 DATA
FFY 2011 TARGET
Not Applicable 27.2% Baseline The State provided FFY 2011 baseline data, targets for FFY 2012, and improvement activities through FFY 2012 for this indicator, and OSEP accepts the State’s submission for this indicator. The State indicated that stakeholders were provided an opportunity to comment on the targets for FFY 2012.
The OSEP listed no required actions in the FFY 2011 Response Table for Indicator 6.
None required at this time.

APR – Part B Michigan
Part B State Annual Performance Report for FFY 2012 (2012-2013) Indicator 7 Page 88 (OMB NO: 1820-0624 / Expiration Date: 7/31/2015)
Part B State Annual Performance Report (APR) for FFY 2012 (2012-2013)
Overview of Indicator 7 (Preschool33 Outcomes) Report Development: 1. See General Overview pages 6-12. 2. Targets were established by an examination of trend data and through advisory
stakeholder input. 3. Summary statements are included in this report and in local level reports. The
Early Childhood Outcomes Center created summary statements in order to reduce data burden for all states for this indicator.
Monitoring Priority: FAPE in the LRE34/ Preschool Outcomes
(Results Indicator)
Indicator 7: Percent of preschool children aged 3 through 5 with an individualized education programs (IEP) who demonstrate improved:
A. Positive social-emotional skills (including social relationships); B. Acquisition and use of knowledge and skills (including early language/
communication and early literacy); and C. Use of appropriate behaviors to meet their needs. (20 U.S.C. 1416 (a)(3)(A))
Measurement:
Outcomes:
A. Positive social-emotional skills (including social relationships);
B. Acquisition and use of knowledge and skills (including early language/communication and early literacy); and
C. Use of appropriate behaviors to meet their needs.
Progress categories for A, B and C:
a. Percent of preschool children who did not improve functioning = [(# of preschool children who did not improve functioning) divided by (# of preschool children with an IEP assessed)] times 100.
b. Percent of preschool children who improved functioning but not sufficient to move nearer to functioning comparable to same-aged peers = [(# of preschool children who improved functioning but not sufficient to move nearer to functioning comparable to same-aged peers) divided by (# of preschool children with an IEP assessed)] times 100.
c. Percent of preschool children who improved functioning to a level nearer to same-aged peers but did not reach it = [(# of preschool children who
33 Data collection is for children, ages 2 years, 6 months through age 5, who received services for a minimum of six consecutive months. The Preschool Outcomes data collection ends at either 6 years of age or kindergarten entry, whichever comes first. 34 Free Appropriate Public Education in the Least Restrictive Environment

APR – Part B Michigan
Part B State Annual Performance Report for FFY 2012 (2012-2013) Indicator 7 Page 89 (OMB NO: 1820-0624 / Expiration Date: 7/31/2015)
improved functioning to a level nearer to same-aged peers but did not reach it) divided by (# of preschool children with an IEP assessed)] times 100.
d. Percent of preschool children who improved functioning to reach a level comparable to same-aged peers = [(# of preschool children who improved functioning to reach a level comparable to same-aged peers) divided by (# of preschool children with an IEP assessed)] times 100.
e. Percent of preschool children who maintained functioning at a level comparable to same-aged peers = [(# of preschool children who maintained functioning at a level comparable to same-aged peers) divided by (# of preschool children with an IEP assessed)] times 100.
Summary Statements for Each of the Three Outcomes
Summary Statement 1: Of those preschool children who entered or exited the preschool program below age expectations in each Outcome, the percent who substantially increased their rate of growth by the time they turned 6 years of age or exited the program.
Measurement for Summary Statement 1: Percent = [# of preschool children reported in progress category (c) plus # of preschool children reported in category (d)] divided by [# of preschool children reported in progress category (a) plus # of preschool children reported in progress category (b) plus # of preschool children reported in progress category (c) plus # of preschool children reported in progress category (d)] times 100.
Summary Statement 2: The percent of preschool children who were functioning within age expectations in each Outcome by the time they turned 6 years of age or exited the program.
Measurement for Summary Statement 2: Percent = [# of preschool children reported in progress category (d) plus # of preschool children reported in progress category (e)] divided by [the total # of preschool children reported in progress categories (a) + (b) + (c) + (d) + (e)] times 100.

APR – Part B Michigan
Part B State Annual Performance Report for FFY 2012 (2012-2013) Indicator 7 Page 90 (OMB NO: 1820-0624 / Expiration Date: 7/31/2015)
Measurable and Rigorous Targets for Outcome A: Positive Social-Emotional Skills (including social relationships)
Summary Statement 1: Of those children who entered the program below expectation in Outcome A, the percent who substantially increased their rate of growth by the time they turned 6 years of age or exited the program.
FFY Baseline Target Actual 2008 86.8%
2009 >86.0% 85.5%
2010 >87.0% 81.1%
2011 >87.0% 81.1%
2012 >87.0% 84.5%* Percent = [# of preschool children reported in progress category (c) plus # of preschool children reported in category (d)] divided by [# of preschool children reported in progress category (a) plus # of preschool children reported in progress category (b) plus # of preschool children reported in progress category (c) plus # of preschool children reported in progress category (d)] times 100.
*[(1,134 + 1,328) ÷ (68 + 382 + 1,134 + 1,328)] X 100
Summary Statement 2: The percent of children who were functioning within age expectations in Outcome A by the time they turned 6 years of age or exited the program.
FFY Baseline Target Actual
2008 60.7%
2009 >60.0% 59.8%
2010 >61.0% 56.5%
2011 >61.0% 54.0%
2012 >61.0% 55.4%* Percent = [# of preschool children reported in progress category (d) plus # of preschool children reported in progress category (e)] divided by [the total # of preschool children reported in progress categories (a) + (b) + (c) + (d) + (e)] times 100.
*[(1,328 + 639) ÷ (68 + 382 + 1,134 + 1,328 + 639)] X 100 Source: Michigan Student Data System (MSDS), HighScope Education Research Foundation

APR – Part B Michigan
Part B State Annual Performance Report for FFY 2012 (2012-2013) Indicator 7 Page 91 (OMB NO: 1820-0624 / Expiration Date: 7/31/2015)
Measurable and Rigorous Targets for Outcome B: Acquiring and Using Knowledge and Skills
Summary Statement 1: Of those children who entered the program below expectation in Outcome B, the percent who substantially increased their rate of growth by the time they turned 6 years of age or exited the program.
FFY Baseline Target Actual
2008 86.5%
2009 >86.0% 86.8%
2010 >87.0% 82.2%
2011 >87.0% 82.2%
2012 >87.0% 85.5%* Percent = [# of preschool children reported in progress category (c) plus # of preschool children reported in category (d)] divided by [# of preschool children reported in progress category (a) plus # of preschool children reported in progress category (b) plus # of preschool children reported in progress category (c) plus # of preschool children reported in progress category (d)] times 100.
*[(1,134 + 1,491) ÷ (67 + 377 + 1,134 + 1,491)] X 100
Summary Statement 2: The percent of children who were functioning within age expectations in Outcome B by the time they turned 6 years of age or exited the program.
FFY Baseline Target Actual
2008 58.0%
2009 >58.0% 58.2%
2010 >59.0% 56.6%
2011 >59.0% 53.7%
2012 >59.0% 55.5%* Percent = [# of preschool children reported in progress category (d) plus # of preschool children reported in progress category (e)] divided by [the total # of preschool children reported in progress categories (a) + (b) + (c) + (d) + (e)] times 100.
*[(1,491 + 481) ÷ (67 + 377 + 1,134 + 1,491 + 481)] X 100 Source: MSDS, HighScope Education Research Foundation

APR – Part B Michigan
Part B State Annual Performance Report for FFY 2012 (2012-2013) Indicator 7 Page 92 (OMB NO: 1820-0624 / Expiration Date: 7/31/2015)
Measurable and Rigorous Targets for Outcome C: Use of Appropriate Behaviors to Meet their Needs
Summary Statement 1: Of those children who entered the program below expectation in Outcome C, the percent who substantially increased their rate of growth by the time they turned 6 years of age or exited the program.
FFY Baseline Target Actual
2008 88.2%
2009 >88.0% 87.7%
2010 >89.0% 80.6%
2011 >89.0% 81.3%
2012 >89.0% 84.8%* Percent = [# of preschool children reported in progress category (c) plus # of preschool children reported in category (d)] divided by [# of preschool children reported in progress category (a) plus # of preschool children reported in progress category (b) plus # of preschool children reported in progress category (c) plus # of preschool children reported in progress category (d)] times 100.
*[(1,018 + 1,422) ÷ (63 + 373 + 1,018 + 1,422)] X 100
Summary Statement 2: The percent of children who were functioning within age expectations in Outcome C by the time they turned 6 years of age or exited the program.
FFY Baseline Target Actual
2008 72.3%
2009 >72.0% 71.6%
2010 >73.0% 62.5%
2011 >73.0% 58.7%
2012 >73.0% 59.0%* Percent = [# of preschool children reported in progress category (d) plus # of preschool children reported in progress category (e)] divided by [the total # of preschool children reported in progress categories (a) + (b) + (c) + (d) + (e)] times 100.
*[(1,422 + 674) ÷ (63 + 373 + 1,018 + 1,422 + 674)] X 100 Source: MSDS, HighScope Education Research Foundation

APR – Part B Michigan
Part B State Annual Performance Report for FFY 2012 (2012-2013) Indicator 7 Page 93 (OMB NO: 1820-0624 / Expiration Date: 7/31/2015)
Explanation of Progress or Slippage that occurred for FFY 2012: Michigan did not meet its FFY 2012 targets for any of the six Indicator 7 summary statements. The 2012-2013 school year was the third year in which the OSEP Part B data were collected through the Michigan Student Data System (MSDS). As anticipated, the transition of data collection from Scantron sheets to the MSDS improved data consistency, reduced errors, tracked and matched multiple records for individual child-level data. Displayed in Table 1 are the number of records received this year which are similar to that of last year. However, exit records received decreased by 14 percent compared to the previous year (4,955 vs. 5,743). As a result, the total number of children with exit records available to match with entry records was reduced by 12 percent (4,920 vs. 5,602), as shown in Table 2. We attribute the decrease to Michigan’s declining student enrollment. Table 1:
Number of Records Received by Year
Year Data Source Exit Entry Unclear* Total
2007-2008 Scan Sheets 2,157 5,777 101 8,035
2008-2009 Scan Sheets 4,513 8,267 276 13,056
2009-2010 Scan Sheets 6,162 8,457 241 14,860
2010-2011 MSDS 3,738 5,618 194 9,550
2011-2012 MSDS 5,743 7,811 0 13,554
2012-2013 MSDS 4,955 8,150 0 13,105 Source: MSDS, HighScope Education Research Foundation *No indication on the Scantron sheets indicating whether the data were exit or entry. Presented in Table 2 are the number of children who had matched entry and exit assessment data by year. Among the 4,920 children with exit assessment data this year, 3,907 (356 + 3,551) were found to have entry assessment data received and stored in the MSDS. The matching rate of 79.4 percent for this year was the highest since the 2007-2008 school year; the first year child outcomes were collected, revealing the advantage of using the MSDS over Scantron sheets for data collection. As in previous years, only children with a minimum of six months between entry and exit assessment dates were included in the reported sample. Given a higher matching rate this year, the reported sample was only seven percent smaller than that of last year (3,551 vs. 3,825), despite the 14 percent reduction in the exit records received.

APR – Part B Michigan
Part B State Annual Performance Report for FFY 2012 (2012-2013) Indicator 7 Page 94 (OMB NO: 1820-0624 / Expiration Date: 7/31/2015)
Table 2:
Year
Number of children with exit data**
Number of Matched Children
% of Matching
Not included (months
between entry and exit < 6)
Included (months
between entry and exit >=6)
2007-2008 2,154 161 1,107 58.9% 2008-2009 4,243 311 2,691 70.8% 2009-2010 6,333 443 4,462 77.5% 2010-2011 3,882 127 2,648 71.5% 2011-2012 5,602 398 3,825 75.4% 2012-2013 4,920 356 3,551 79.4%
Source: MSDS, HighScope Education Research Foundation **The number of children reported in the exit data column contains unduplicated data. For the 2009-2011 years additional records were corrected and included in these counts.
Presented in Table 3 are the rates for Summary Statements 1 and 2 by outcome for the 2012-2013 school year, as well as the previous five years. As shown, rates for the three outcomes for Statement 1 increased compared to the last two years, with two outcomes almost reaching the level attained in 2009-10 (the first year targets were in place). For Summary Statement 2, this year’s rates for the three outcomes were also higher than those of last year. The rates for Summary Statement 2 in the most recent three years were substantially lower than those in the 2009-2010 school year, especially for the Appropriate Action to Meet the Needs outcome. Table 3:
Summary Statements by Year (%) Summary Statement Outcome 2007-
2008 2008-2009
2009-2010
2010-2011
2011-2012
2012-2013
Statement 1 Below expectation at entry, increased growth at exit
Social/Emotional 85.9% 86.3% 85.5% 81.1% 81.1% 84.5% Knowledge/Skill 83.8% 86.3% 86.8% 82.2% 82.2% 85.5% Appropriate Action
85.1% 88.0% 87.7% 80.6% 81.3% 84.8%
Statement 2 Functioning within age expectation at exit
Social/Emotional 60.0% 60.1% 59.8% 56.5% 54.0% 55.4% Knowledge/Skill 55.7% 57.6% 58.2% 56.6% 53.7% 55.5% Appropriate Action
70.7% 72.2% 71.6% 62.5% 58.7% 59.0%
Source: MSDS, HighScope Education Research Foundation Summary of the Findings for This Year's Performance In order to understand why FFY 2012 increased from FFY 2011 in each of the six summary statements but did not reach targets, the Michigan Department of Education examined the potential impact of changes in children’s demographic characteristics including eligibility between FFY 2008 (our baseline year) and FFY 2012.

APR – Part B Michigan
Part B State Annual Performance Report for FFY 2012 (2012-2013) Indicator 7 Page 95 (OMB NO: 1820-0624 / Expiration Date: 7/31/2015)
Provided in Table 4 are the eligibility categories of the population of children assessed (with entry and exit) as a percentage. Analysis of five years of data indicates that children with speech and language impairment as a primary eligibility category were more likely to progress to or maintain at age appropriate levels in the three outcome areas, compared to children with other disabilities. Children with a cognitive impairment or multiple impairments were less likely to be functioning at a level equal to typically developing peers at program exit. Table 4:
Eligibility Category
FFY 2008 n=2,691
FFY 2009 n=4,462
FFY 2010
n=2,648
FFY 2011
n=3,825
FFY 2012
n=3,551 Autism Spectrum Disorder
6.8% 7.3% 7.2% 9.0% 9.9%
Cognitive Impairment 2.4% 2.9% 3.6% 4.2% 3.9%
Deaf/ Blindness 0.0% 0.0% 0.1% 0.0% 0.0% Early Childhood Developmental Delay
18.3% 18.1% 19.9% 17.1% 18.1%
Emotional Impairment 0.4% 0.5% 0.2% 0.3% 0.3% Hearing Impairment 1.0% 0.8% 0.8% 0.8% 0.7% Other Health Impairment 4.1% 3.2% 4.0% 4.7% 4.4% Physical Impairment 1.4% 1.6% 1.8% 1.9% 1.5% Severe Multiple Impairment 0.9% 0.9% 1.7% 1.7% 1.7% Specific Learning Disability
0.7% 1.0% 0.1% 0.2% 0.3%
Speech and Language Impairment
64.7% 64.1% 60.4% 59.7% 58.9%
Traumatic Brain Injury 0.2% 0.2% 0.1% 0.1% 0.1% Visual Impairment 0.3% 0.4% 0.1% 0.3% 0.3% Source: MSDS, HighScope Education Research Foundation These data reveal a change in the needs of children served in Early Childhood Special Education programs. Consistently, fewer children with hearing impairment, speech and language impairment, and traumatic brain injury were served since FFY 2008 while there was an increase in the percentage of children in five of the categories (note bolded numbers in the table).

APR – Part B Michigan
Part B State Annual Performance Report for FFY 2012 (2012-2013) Indicator 7 Page 96 (OMB NO: 1820-0624 / Expiration Date: 7/31/2015)
While progress is noted, given minimal change in the rates from the previous year for Summary Statement 2, Michigan focused the analysis on understanding the change observed in rates for Summary Statement 1. The first step was to examine whether the change in the rates from the previous year was related to any differences in the sample characteristics, developmental level at program entry, and duration of services received (represented by the number of months between entry and exit assessments). No major differences were found in demographic characteristics or primary disability in the samples between the two past years. Differences by category for gender, race/ethnicity, and primary disability were all within one percentage point. Children’s average age at entry and exit tests were also almost identical across the two years. There was also no difference in the number of months between the entry and exit assessments. In addition, there were no major changes in the sample associated with the children’s developmental level at program entry. Among the 21 categories examined for the three outcomes (7 levels each), 16 had a difference within one percentage point and five had a difference approximately 1.5 percentage points. In FFY 2008, Michigan’s targets were based on matched entry and exit records for 2,691 children. Of these children nearly 65 percent were speech and language eligible. Comparing Michigan to the national average for each of the summary statements it became evident that there was not enough trend data when determining the initial targets. In addition, the population initially examined was not reflective of the children currently served. Michigan plans to establish new targets taking into consideration all available state data, stakeholder input and national data. Displayed in Table 5 is a comparison of Michigan’s targets and reported data to the national averages for the past two years. As highlighted in this table, Michigan’s data are similar to the national averages. For FFY 2012, Michigan’s data are higher in four of the six summary statements (note the bolded numbers) compared to the national averages. This analysis supports the need to reassess Michigan’s targets. Table 5:
Summary Statements by Year Comparing Michigan’s Targets and Actual Data with National Averages
Summary Statement Outcome MI
Targets
FFY 2010 MI
Data
FFY 2010 National Average
FFY 2011 MI Data
FFY 2011 National Average
FFY 2012 MI Data
Statement 1 Below expectation at entry, increased growth at exit
Social/ emotional
87.0% 81.1% 81.0% 81.1% 81.0% 84.5%
Knowledge/ skill
87.0% 82.2% 81.0% 82.2% 81.0% 85.5%
Appropriate action
81.0% 80.6% 81.0% 81.3% 80.0% 84.8%
Statement 2 Functioning within age expectation at exit
Social/ emotional
60.0% 56.5% 60.0% 54.0% 59.0% 55.4%
Knowledge/ skill
53.0% 56.6% 53.0% 53.7% 53.0% 55.5%
Appropriate action
66.0% 62.5% 66.0% 58.7% 66.0% 59.0%
Source: MSDS, HighScope Education Research Foundation, DaSy Center

APR – Part B Michigan
Part B State Annual Performance Report for FFY 2012 (2012-2013) Indicator 7 Page 97 (OMB NO: 1820-0624 / Expiration Date: 7/31/2015)
Discussion of Improvement Activities Completed:
Timelines Activities Status
PROVIDE TECHNICAL ASSISTANCE
2011-2013 1. Implement technical assistance and professional development for all service areas to improve early childhood outcomes, targeting service areas not meeting targets.
Professional development for all service areas included the provision of an online Preschool Child Special Education Outcomes training (eotta.ccresa.org). This training was offered free of charge and was made available for administrators and personnel in the field. There were 98 participants registered for this training during FFY 2012. Regional trainings on preschool child outcomes were provided throughout the state between July 1, 2012 and June 30, 2013. The locations of these two trainings were selected based on targeted school districts that reported low outcome data, reflected missing data, or requested the training. There were 68 participants registered for these trainings. Additional trainings were developed and implemented on Preschool Child Special Education Outcomes. First, collaboration between Part C and 619 resulted in a Birth through age 5 Child Outcomes Training that was presented in 6 locations throughout the state for 268 registered participants. To assist Intermediate School District (ISD) personnel in utilizing the data provided to them, correspondence was sent to each ISD special education director that provided both the overall ISD data as well as all local educational agencies that submitted data. Understanding the Preschool Child Outcomes Data training was developed and implemented for administrators in three locations between January and June 2013. There were 117 participants registered for these trainings which were conducted in metropolitan Detroit, mid-Michigan, and the Upper Peninsula. In addition to these face-to-face and online
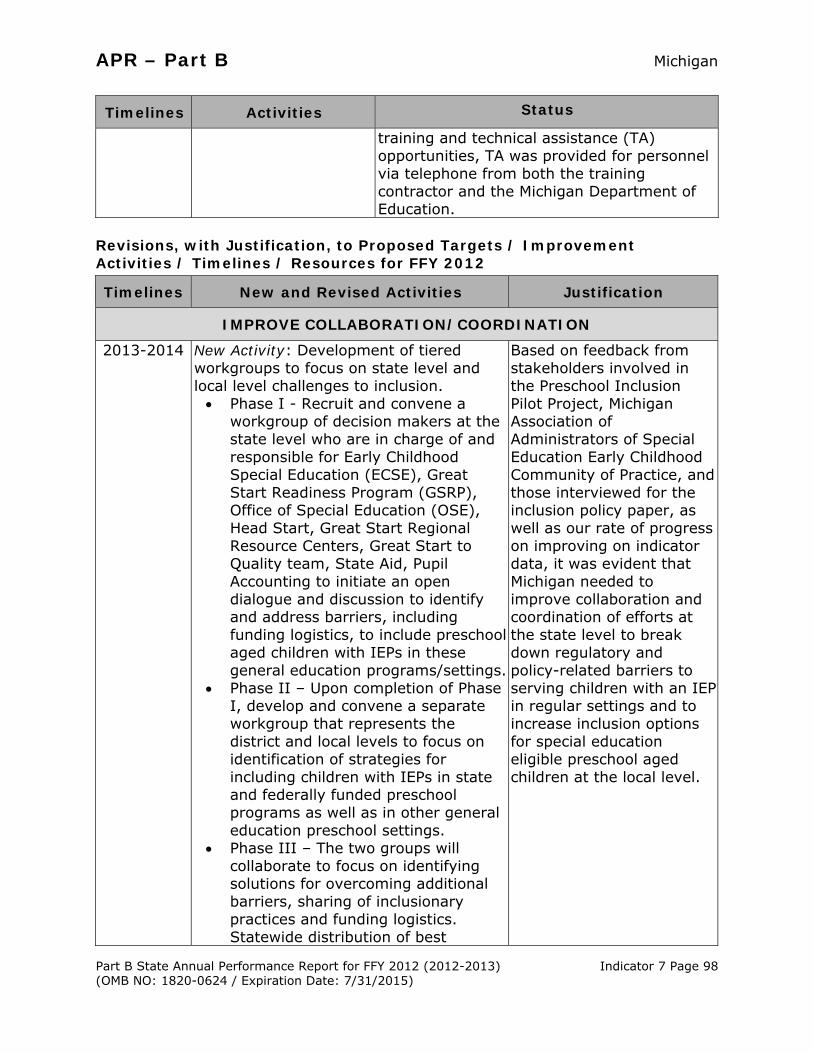
APR – Part B Michigan
Part B State Annual Performance Report for FFY 2012 (2012-2013) Indicator 7 Page 98 (OMB NO: 1820-0624 / Expiration Date: 7/31/2015)
Timelines Activities Status training and technical assistance (TA)
opportunities, TA was provided for personnel via telephone from both the training contractor and the Michigan Department of Education.
Revisions, with Justification, to Proposed Targets / Improvement Activities / Timelines / Resources for FFY 2012
Timelines New and Revised Activities Justification
IMPROVE COLLABORATION/COORDINATION
2013-2014 New Activity: Development of tiered workgroups to focus on state level and local level challenges to inclusion. Phase I - Recruit and convene a
workgroup of decision makers at the state level who are in charge of and responsible for Early Childhood Special Education (ECSE), Great Start Readiness Program (GSRP), Office of Special Education (OSE), Head Start, Great Start Regional Resource Centers, Great Start to Quality team, State Aid, Pupil Accounting to initiate an open dialogue and discussion to identify and address barriers, including funding logistics, to include preschool aged children with IEPs in these general education programs/settings.
Phase II – Upon completion of Phase I, develop and convene a separate workgroup that represents the district and local levels to focus on identification of strategies for including children with IEPs in state and federally funded preschool programs as well as in other general education preschool settings.
Phase III – The two groups will collaborate to focus on identifying solutions for overcoming additional barriers, sharing of inclusionary practices and funding logistics. Statewide distribution of best
Based on feedback from stakeholders involved in the Preschool Inclusion Pilot Project, Michigan Association of Administrators of Special Education Early Childhood Community of Practice, and those interviewed for the inclusion policy paper, as well as our rate of progress on improving on indicator data, it was evident that Michigan needed to improve collaboration and coordination of efforts at the state level to break down regulatory and policy-related barriers to serving children with an IEP in regular settings and to increase inclusion options for special education eligible preschool aged children at the local level.

APR – Part B Michigan
Part B State Annual Performance Report for FFY 2012 (2012-2013) Indicator 7 Page 99 (OMB NO: 1820-0624 / Expiration Date: 7/31/2015)
Timelines New and Revised Activities Justification
practice documents garnered from Phase I and Phase II.
Resources: OGS/ECE&FS, CCRESA New Resources: Center for Educational Performance and Information, Statewide Autism Resources and Training

APR – Part B Michigan
Part B State Annual Performance Report for FFY 2012 (2012-2013) Indicator 7 Page 100 (OMB NO: 1820-0624 / Expiration Date: 7/31/2015)
Michigan Part B FFY 2011 State Performance Plan (SPP)/APR Response Table from the Office of Special Education Programs (OSEP)
Indicator Status OSEP
Analysis and Next Steps
Michigan Response
Percent of Preschool Children Age 3 through 5 with IEPs Who Demonstrate Improved Outcomes
Summary Statement 13
FFY 2010 Data
FFY 2011 Data
FFY 2011 Target
Outcome A:
Positive social-emotional skills (including social relationships)
81.1%
81.1%
> 87.0%
Outcome B:
Acquisition and use of knowledge and skills (including early language/ communication)
82.2%
82.2%
> 87.0%
Outcome C:
Use of appropriate behaviors to meet their needs
80.6%
81.3%
> 89.0%
Summary Statement 24
FFY 2010 Data
FFY 2011 Data
FFY 2011 Target
Outcome A:
Positive social-emotional skills (including social relationships)
56.5%
54.0%
> 61.0%
Outcome B:
Acquisition and use of knowledge and skills (including early language/ communication)
56.6%
53.7%
> 59.0%
Outcome C:
Use of appropriate behaviors to meet their needs
62.5%
58.7%
> 73.0
3 Summary Statement 1: Of those preschool children who entered or exited the preschool program below age expectations in each Outcome, the percent who substantially increased their rate of growth by the time they turned 6 years of age or exited the program. 4 Summary Statement 2: The percent of preschool children who were functioning within age expectations in each Outcome by the time they turned 6 years of age or exited the program.
The State must report
progress data and actual
target data for FFY 2012 in
the FFY 2012 APR.
Progress data and actual
target data for FFY 2012 are presented on the previous
pages.


APR – Part B Michigan
Part B State Annual Performance Report for FFY 2012 (2012-2013) Indicator 8 Page 102 (OMB NO: 1820-0624 / Expiration Date: 7/31/2015)
Part B State Annual Performance Report (APR) for FFY 2012 (2012-2013)
Overview of Indicator 8 (Facilitated Parent Involvement) Report Development: 1. See General Overview pages 6-12. 2. Statewide surveys were mailed to all parents of children ages 3 through 5 years
who received special education services and approximately one-third of all parents of students ages 6 through 21 years who received special education services.
3. Both surveys were developed by the National Center for Special Education Accountability Monitoring (NCSEAM) and were available in English, Spanish and Arabic. Families also were given the option to complete the survey online or via a telephone interview using Computer Assisted Telephone Interviewing technology.
4. With the exception of racial/ethnic composition, the survey responses comparing the child/student characteristics to the special education population were representative. Additional analyses of the racial/ethnic responses determined that the differences were not statistically significant.
Monitoring Priority: FAPE in the LRE35/Facilitated Parent Involvement
(Results Indicator)
Indicator 8: Percent of parents with a child receiving special education services who report that schools facilitated parent involvement as a means of improving services and results for children with disabilities. (20 U.S.C. 1416(a) (3) (A))
Measurement: Percent = [(# of respondent parents who report schools facilitated parent involvement as a means of improving services and results for children with disabilities) divided by the (total # of respondent parents of children with disabilities)] times 100.
35 Free Appropriate Public Education in the Least Restrictive Environment

APR – Part B Michigan
Part B State Annual Performance Report for FFY 2012 (2012-2013) Indicator 8 Page 103 (OMB NO: 1820-0624 / Expiration Date: 7/31/2015)
Measurable and Rigorous Targets Children Ages 3-5 years
FFY Baseline36 Target Actual
2007 34.0%
2008 >34.5% 36.8%
2009 >35.0% 47.8%
2010 >35.5% 50.1%
2011 >35.5% 48.0%
2012 >35.5% 49.0%* Percent = [(# of respondent parents who report schools facilitated parent involvement as a means of improving services and results for children with disabilities) divided by the (total # of respondent parents of children with disabilities)] times 100.
*[2,324 ÷ 4,742] X 100 Source: The NCSEAM Parent Survey and Wayne State University (WSU) Center for Urban Studies
Measurable and Rigorous Targets Students Ages 6-21 years
FFY Baseline37 Target Actual
2007 20.5%
2008 >21.0% 25.1%
2009 >21.5% 26.2%
2010 >22.0% 25.9%
2011 >22.0% 27.3%
2012 >22.0% 29.5%* Percent = [(# of respondent parents who report schools facilitated parent involvement as a means of improving services and results for children with disabilities) divided by the (total # of respondent parents of children with disabilities)] times 100.
*[4,215 ÷ 14,302] X 100 Source: The NCSEAM Parent Survey and WSU Center for Urban Studies 36 New baseline was set in FFY 2007 37 New baseline was set in FFY 2007

APR – Part B Michigan
Part B State Annual Performance Report for FFY 2012 (2012-2013) Indicator 8 Page 104 (OMB NO: 1820-0624 / Expiration Date: 7/31/2015)
Explanation of Progress or Slippage that occurred for FFY 2012: Michigan met both of the Indicator 8 FFY 2012 targets for children ages 3 through 5 years and for students ages 6 through 21 years. Compared to the FFY 2011 Part B parent surveys, the percentage of parents of children ages 3 through 5 years at or above the standard in FFY 2012 was higher. There is insufficient information available to determine if the change is attributable to specific activities or to normal variation. Compared to the FFY 2011 Part B parent surveys, the percentage of parents of students ages 6 through 21 years at or above the standard in FFY 2012 was higher. There is insufficient information to attribute the increase in percentage to specific activities at this time. Discussion of FFY 2012 Data Survey Instrument There were two versions of the survey for parents of children/students receiving special education services:
One for parents of children ages 3 through 5. One for parents of students ages 6 through 21.
The parent survey for children ages 3 through 5 years contained 37 NCSEAM items measuring “Efforts to Partner with Parents”, while the parent survey for students ages 6 through 21 included 25 items measuring this same construct. The survey for children ages 3 through 5 years also contained an additional 13 NCSEAM items measuring “Quality of Services” for a total of 50 items. Sampling Surveys were disseminated to all parents of children ages 3 through 5 years who received special education services and approximately one-third of all parents of students ages 6 through 21 years who received special education services.38 Parents of students ages 6 through 21 years were selected to participate in the survey using an Office of Special Education Programs (OSEP) approved cohort sampling plan. Approximately one-third of local school districts within every intermediate school district (ISD) were selected to participate in the survey for students ages 6 through 21 years. The exception is the one district with a student population greater than 50,000 that participates on an annual basis.
Response Rates There were 4,766 respondents for the children ages 3 through 5 years survey (28.3 percent response rate) and 14,442 for the students ages 6 through 21 years survey (23.3 percent response rate), for a total number of 19,208 responses
38 In households with more than one child/student receiving special education services, one child/student was randomly selected and parents were asked to respond to the survey based on their experiences with that child/student.

APR – Part B Michigan
Part B State Annual Performance Report for FFY 2012 (2012-2013) Indicator 8 Page 105 (OMB NO: 1820-0624 / Expiration Date: 7/31/2015)
(24.4 percent total response rate). Rasch analysis was used to generate a score for 19,044 respondents; 24 respondents to the ages 3 through 5 years survey and 140 respondents to the ages 6 through 21 years survey did not answer a sufficient number of scale items to generate a score. Representativeness of the Sample Comparisons of child/student characteristics between the statewide population and respondent sample revealed that the responses are representative of the entire Michigan Part B special education population with the exception of the proportion of children ages 3 through 5 years and students ages 6 through 21 years in terms of racial/ethnic composition. Due to the sampling procedure used, the ratio of survey respondents with children ages 3 through 5 years to respondents with students ages 6 through 21 years is greater than the ratio found in the state. However, because results are presented for each sample separately, there is no need to apply weights39 to each sample in order to adjust these proportions.
FFY 2012 Parent Survey Respondents' Child
Race/Ethnicity Compared to the State
Race/Ethnicity 3-5 Years Sample
3-5 Years Statewide Population
6-21 Years Sample
6-21 Years Cohort 3
Population American Indian or Alaska Native
0.67% (n=32)
0.78% (n=131)
0.76% (n=110)*
0.94% (n=582)
Asian 2.98% (n=142)*
2.18% (n=367)
1.83% (n=264)*
1.41% (n=875)
African American/Black
11.16% (n=532)*
14.18% (n=2,391)
21.52% (n=3,108)*
25.98% (n=16,079)
Hispanic/Latino 6.76% (n=322)
7.01% (n=1,182)
4.57% (n=660)*
5.80% (n=3,590)
Native Hawaiian or Other Pacific Islander
0.17% (n=8)
0.15% (n=25)
0.03% (n=5)
0.08% (n=49)
White 75.89% (n=3,617)*
73.02% (n=12,312)
69.13% (n=9,984)*
63.50% (n=39,298)
Two or More Races 2.37% (n=113)
2.68% (n=452)
2.15% (n=311)
2.29% (n=1,415)
Source: The NCSEAM Parent Survey and WSU Center for Urban Studies *Difference between sample and statewide is statistically significant. The table above summarizes respondents’ children’s/student’s race/ethnicity in comparison to statewide demographics. To determine if the difference in
39 Weights are commonly used to adjust survey results for under- and over-representation of specific subgroups in a sample population. Weighting provides an estimate of the results that would be found if the distribution of a particular characteristic in the sample were identical to the distribution in the overall population.

APR – Part B Michigan
Part B State Annual Performance Report for FFY 2012 (2012-2013) Indicator 8 Page 106 (OMB NO: 1820-0624 / Expiration Date: 7/31/2015)
racial/ethnic distribution made a significant impact on the findings related to this indicator, weights were applied to adjust the sample sizes for each racial/ethnic group. Weights were calculated by dividing the proportion of each group in the Part B population by the corresponding proportion in the sample. A comparison of the unweighted results and results after weighting by race/ethnicity showed no statistically significant difference in the scores (see table below). Therefore, even though the sample was not representative in terms of race/ethnicity, the results were not statistically significant. Indicator 8 Results Before and After Weighting for Race/Ethnicity
Unweighted Weighted by Race/Ethnicity
n
% at or above
standard n
% at or above
standard Children Ages 3-5 Years Sample 4,742 49.0% 4,735 48.7%
Students Ages 6-21 Years Sample 14,302 29.5% 14,322 29.1% mean standard
deviation mean standard deviation
Children Ages 3-5 Years Sample 618.99 138.43 618.14 138.16
Students Ages 6-21 Years Sample 543.96 134.50 542.83 134.59 Source: The NCSEAM Parent Survey and WSU Center for Urban Studies
Additional details regarding the sampling and weighting procedures are available in the State Performance Plan (SPP) Extension at www.michigan.gov/documents/mde/SPP_2012_Extension_PartB_375032_7.pdf. Results A final score was derived from responses to all the items in the “Efforts to Partner with Parents” scale.40 Scores ranged from 192 to 896, with an average of 619 for the children ages 3 through 5 years sample and from 169 to 836 with an average of 544 for the students ages 6 through 21 years sample. Through stakeholder input garnered from focus groups, the NCSEAM set a national standard score of 600. According to the NCSEAM, “The standard is not about agreement with a single item. Given the consistent pattern in families’ responses to the items, a high likelihood of agreement with the threshold item implies the same or greater likelihood of agreement with items located ‘below’ this one on the scale.”41 The percentage of parent survey scores of 600 or higher is used to measure this indicator.
40 From the Avatar International, Inc. report, “Individuals with Disabilities Education Act Part B Special Education Parent Survey Results Pertaining to OSEP SPP/APR Indicator 8.” 41 NCSEAM (2006). Use of the NCSEAM Family Survey to Address the SPP/APR Indicator on Family Outcomes available at http://www.accountabilitydata.org/ParentFamily%20Involvement%20Measures/June%206.pdf.

APR – Part B Michigan
Part B State Annual Performance Report for FFY 2012 (2012-2013) Indicator 8 Page 107 (OMB NO: 1820-0624 / Expiration Date: 7/31/2015)
Discussion of Improvement Activities Completed:
Timelines Activities Status
IMPROVE COLLABORATION/COORDINATION
2011-2013 1. Coordinate parent involvement activities with the state Parent Training and Information Center (PTI) and other parent initiatives.
The Michigan Alliance for Families (MAF)42 (federal and state funded) continued to work toward the goal of increasing involvement of families in their children's education by offering learning opportunities statewide.
The MAF provided training opportunities for parents across Michigan partnering with The Arc Michigan, the Michigan Special Education Mediation Program, the Michigan Protection and Advocacy Services, the Learning Disabilities Association of Michigan and the Epilepsy Foundation of Michigan. This improvement activity has been completed.
EVALUATION
2011-2013
2. Evaluate progress on activities and resources needed to affect systems change on this indicator.
The Office of Special Education (OSE) continued to identify parent involvement as a priority. Each Mandated Activities Project (MAP)43 was required to address parent involvement in their yearly application. A summary of the MAPs’ applications revealed they continued their efforts to work with parents to increase their involvement in their child’s education and educational outcomes through:
Parent involvement on teams (e.g., IT, IEP, transition)
Attendance at various meetings, trainings, conferences, summer institutes and other trainings
Involvement in material development Community conversations with
families
42 Michigan’s PTI (Disabilities) 43 Michigan’s state improvement and compliance initiatives, funded with Individuals with Disabilities Education Act administrative set-aside funds.

APR – Part B Michigan
Part B State Annual Performance Report for FFY 2012 (2012-2013) Indicator 8 Page 108 (OMB NO: 1820-0624 / Expiration Date: 7/31/2015)
Timelines Activities Status
Workshops and training for parents Engaging parents in collaborative
problem solving and learning experiences.
Toolkits and other materials included resources which are data driven and student and family centered. There are also sections of the MAP websites that were targeted to parents and families. This improvement activity has been completed.
2011-2013 3. Provide evidence-based resource materials to districts regarding strategies to facilitate parent involvement and a supportive school climate.
Michigan's Integrated Behavior and Learning Support Initiative, MAF and Reaching and Teaching for Struggling Learners have agreed on the same six best practices, based on the research from The Harvard Family Research Project, to utilize in their projects: 1) Goal setting talks, 2) Weekly data-sharing folders, 3) Home visits, 4) Classroom observations or mini-lessons, 5) Positive phone calls home and 6) Regular personalized communication. This improvement activity has been completed.
Revisions, with Justification, to Proposed Targets / Improvement Activities / Timelines / Resources for FFY 2012
Timelines New and Revised Activities Justification
PROVIDE TRAINING/PROFESSIONAL DEVELOPMENT 2013-2014 New Activity: MDE staff and ISD
monitors will develop tools to support Local Education Agencies that decide to hold consistent and regular (monthly or quarterly, including online) joint trainings for educators and parents using "a cooperative team approach". Key parent organizations, Parent Advisory Committees, and other stakeholders will be included in the development of the training.
A new improvement activity was developed with broad stakeholder input to develop improvement activities that were specific to the indicator, measured student outcomes, and could be achieved in the short-term.

APR – Part B Michigan
Part B State Annual Performance Report for FFY 2012 (2012-2013) Indicator 8 Page 109 (OMB NO: 1820-0624 / Expiration Date: 7/31/2015)
Timelines New and Revised Activities Justification
Resources: Michigan Alliance for Families and the OSE
2011-2013 Deletion of Activity #1: Coordinate parent involvement activities with the state Parent Training and Information Center (PTI) and other parent initiatives.
Activity has been completed.
2011-2013 Deletion of Activity #2: Evaluate progress on activities and resources needed to affect systems change on this indicator.
Activity has been completed.
2011-2013 Deletion of Activity #3: Provide evidence-based resource materials to districts regarding strategies to facilitate parent involvement and a supportive school climate.
Activity has been completed.
2013-2014 New Activity: By January 2015, ISD monitors will provide quarterly training sessions to improve communication and the dissemination of materials for parents in order to increase parental understanding of student progress toward achieving quality goals. Activities include: Continue to provide professional
development for teachers on how to write quality goals, where progress monitoring accurate and meaningful.
Continue to provide professional development for teachers on how to monitor student goals using audience friendly graphic displays of data.
Begin to provide accessible professional development for parents on:
o How to request up-to-date progress monitoring data.
o How to read basic information provided in graph form.
o The parents' role in students' progress toward goals.
o How parents and educators can work together to help each student achieve his/her goals.
A new improvement activity was developed with broad stakeholder input to develop improvement activities that were specific to the indicator, measured student outcomes, and could be achieved in the short-term.
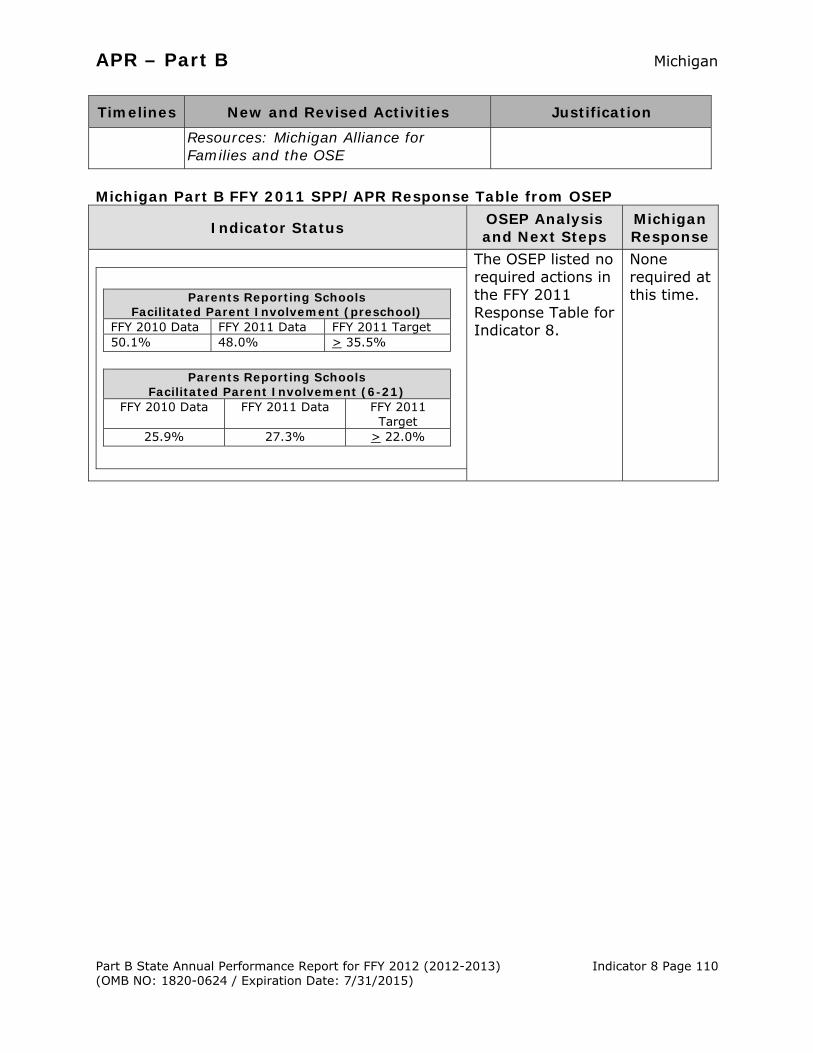
APR – Part B Michigan
Part B State Annual Performance Report for FFY 2012 (2012-2013) Indicator 8 Page 110 (OMB NO: 1820-0624 / Expiration Date: 7/31/2015)
Timelines New and Revised Activities Justification
Resources: Michigan Alliance for Families and the OSE
Michigan Part B FFY 2011 SPP/APR Response Table from OSEP
Indicator Status OSEP Analysis and Next Steps
Michigan Response
Parents Reporting Schools Facilitated Parent Involvement (preschool)
FFY 2010 Data FFY 2011 Data FFY 2011 Target 50.1% 48.0% > 35.5%
Parents Reporting Schools Facilitated Parent Involvement (6-21)
FFY 2010 Data FFY 2011 Data FFY 2011 Target
25.9% 27.3% > 22.0%
The OSEP listed no required actions in the FFY 2011 Response Table for Indicator 8.
None required at this time.


APR – Part B Michigan
Part B State Annual Performance Report for FFY 2012 (2012-2013) Indicator 9 Page 112 (OMB NO: 1820-0624 / Expiration Date: 7/31/2015)
Part B State Annual Performance Report (APR) for FFY 2012 (2012-2013) Overview of Indicator 9 (Disproportionate Representation—Child with a Disability) Report Development: 1. See General Overview pages 6-12. 2. Business rules for data collection are reviewed and updated annually. Please see
Appendix D for latest Business Rules applied to the FFY 2011-2012 APR for this indicator.
3. Findings of noncompliance were issued and corrective action plans (CAPs) were submitted and monitored through the Continuous Improvement and Monitoring System (CIMS) Workbook. For additional information pertaining to timely correction of noncompliance please refer to Appendix C.
Monitoring Priority: Disproportionate Representation—Child with a Disability
(Compliance Indicator)
Indicator 9: Percent of districts with disproportionate representation of racial and ethnic groups in special education and related services that is the result of inappropriate identification. (20 U.S.C. 1416(a)(3)(C))
Measurement:
Percent = [(# of districts with disproportionate representation of racial and ethnic groups in special education and related services that is the result of inappropriate identification) divided by the (# of districts in the State)] times 100.
Include State’s definition of “disproportionate representation.”
Based on its review of the 618 data for FFY 2012, describe how the State made its annual determination that the disproportionate over-representation it identified of racial and ethnic groups in special education and related services was the result of inappropriate identification as required by §§300.600(d)(3) and 300.602(a); e.g., using monitoring data; reviewing policies, practices and procedures, etc. In determining disproportionate representation, analyze data, for each district, for all racial and ethnic groups in the district, or all racial and ethnic groups in the district that meet a minimum “n” size set by the State. Report on the percent of districts in which disproportionate representation of racial and ethnic groups in special education and related services is the result of inappropriate identification, even if the determination of inappropriate identification was made after the end of the FFY 2012 reporting period; i.e., after June 30, 2013. If inappropriate identification is identified, report on corrective actions taken.

APR – Part B Michigan
Part B State Annual Performance Report for FFY 2012 (2012-2013) Indicator 9 Page 113 (OMB NO: 1820-0624 / Expiration Date: 7/31/2015)
Definition of Disproportionate Representation: Michigan’s operational definition of districts with disproportionate representation as a result of inappropriate identification includes:
Over-Representation
Step 1: Identify Districts with Disproportionate Representation
For the FFY 2012 APR, the two school years considered were FFY 2011 (2011-2012) and FFY 2012 (2012-2013). A verified ratio44 greater than 2.5 for two consecutive years for any racial/ethnic group in one of six eligibility categories was used to identify districts for focused monitoring activities.
Step 2: Analysis of Identification Policies, Procedures and Practices
As a result of analyzing disproportionate data and applying selection criteria, the Office of Special Education (OSE) completed a focused monitoring activity including either an on-site visit, desk audit, or issued a Monitoring Activities Report (MAR) for districts that had a risk ratio (RR) greater than 2.5 for both years. The OSE reviewed district processes and student records, and conducted interviews to determine if the disproportionate representation was the result of inappropriate identification policies, procedures or practices. This resulted in a focused monitoring report that included any findings of noncompliance.
44 In cases where the sum of all other students with an individualized education program (IEP) equals fewer than ten, an alternate risk ratio (ARR) was calculated for the race under consideration, per Data Accountability Center’s recommendation. A RR was calculated when the racial/ethnic distribution of the district’s student population varied significantly from the state racial distribution which was used to calculate weighted risk ratios/ARR. The RR compared identification rates by race/ethnicity with the district’s student population.

APR – Part B Michigan
Part B State Annual Performance Report for FFY 2012 (2012-2013) Indicator 9 Page 114 (OMB NO: 1820-0624 / Expiration Date: 7/31/2015)
Measurable and Rigorous Targets
FFY Baseline Target Actual
2006 0.3% 0%
2007 0% 0.3%
2008 0% 0.1%
2009 0% 0.1%
2010 0% 0.2%
2011 0% 0.1%
2012 0% 0.2%* Percent = [(# of districts with disproportionate representation of racial and ethnic groups in special education and related services that is the result of inappropriate identification) divided by the (# of districts in the state)] times 100.
*[2 ÷ 820] X 100 Source: Michigan Student Data System , CIMS During the 2012-2013 school year, the OSE analyzed FFY 2011 and FFY 2012 data for 820 districts. There were 182 districts excluded from the disproportionate representation calculations because they had fewer than 30 students with an individualized education program (IEP) enrolled. Explanation of Progress or Slippage that occurred for FFY 2012: Michigan did not meet its FFY 2012 target of zero percent for Indicator 9. For FFY 2012, three districts were identified for disproportionate representation. One of the districts was identified with disproportionate representation for American Indian students. The district participated in a focused monitoring on-site visit and had no findings of noncompliance. The other two districts were identified for over-representation of Black students. Both districts participated in an on-site review and were found to have inappropriate identification policies, procedures and/or practices. Discussion of Improvement Activities Completed:
Timelines Activities Status
IMPROVE DATA COLLECTION 2011-2013 1. Examine and update as
necessary the procedures for analyzing data in the determination of disproportionate representation including a review
The OSE met with Wayne State University researchers who conduct the disproportionate representation analysis and reviewed the procedures for data collection and processing.

APR – Part B Michigan
Part B State Annual Performance Report for FFY 2012 (2012-2013) Indicator 9 Page 115 (OMB NO: 1820-0624 / Expiration Date: 7/31/2015)
Timelines Activities Status
of any impact of the transition in data collection from the Single Record Student Database (SRSD) to the MSDS.
No updates were needed.
PROGRAM DEVELOPMENT 2011-2013
2. Ensure involvement of districts in: Review of the data that
resulted in their identification for disproportionate representation;
Review of their policies, procedures and practices used to identify whether these are determinants of the disproportionate data; and
Development of any necessary CAP.
The OSE: Districts were notified of the data
results in May and provided login information that would allow district access to their data.
Reviewed district policies, procedures and practices used to identify whether these are determinants of the disproportionate data.
Required district development of CAPs as necessary.
PROVIDE TECHNICAL ASSISTANCE
2011-2013 3. Provide technical assistance (TA) in the development and implementation of a CAP to districts whose identification policies, procedures and practices are a determinant for the disproportionate representation of students from racial/ethnic groups.
As part of the CIMS process, a TA provider was assigned to each district identified with findings of noncompliance to assist with the development and implementation of a CAP to ensure appropriate policies, procedures and practices. The TA provider worked with the district until correction was verified and the finding closed by the OSE.
Timely Correction of FFY 2011 Findings of Noncompliance (corrected within one year from identification of the noncompliance): 1. Number of findings of noncompliance the state made during FFY 2011 (the
period from July 1, 2011 through June 30, 2012) 3
2. Number of FFY 2011 findings the state verified as timely corrected (corrected within one year from the date of notification to the local educational agency (LEA) of the finding)
3
3. Number of FFY 2011 findings not verified as corrected within one year [(1) minus (2)] 0

APR – Part B Michigan
Part B State Annual Performance Report for FFY 2012 (2012-2013) Indicator 9 Page 116 (OMB NO: 1820-0624 / Expiration Date: 7/31/2015)
Revisions, with Justification, to Proposed Targets / Improvement Activities / Timelines / Resources for FFY 2012
Timelines New and Revised Activities Justification
IMPROVE DATA COLLECTION 2011-2014 Revision of Activity #1: Review and
update as necessary the procedures for extracting and analyzing data in the determination of disproportionate representation.
The portion of the previous improvement activity pertaining to review the impact of the transition from the SRSD to the MSDS has been completed.
Michigan Part B FFY 2011 State Performance Plan (SPP)/APR Response Table from OSEP
Indicator Status OSEP Analysis and Next Steps
The State reported that four districts were identified with disproportionate representation of racial and ethnic groups in special education and related services. The State also reported that one district was identified with disproportionate representation of racial and ethnic groups in special education and related services that was the result of inappropriate identification. The State provided its definition of “disproportionate representation.” The State reported that 171 of 820 districts did not meet the State-established minimum “n” size requirement of 30 students with an IEP and were
FFY 2010 Data
FFY 2011 Data
FFY 2011
Target
Correction of Findings of Noncompliance Identified
In FFY 2010 0.2% 0.1% 0% The State reported that both
of its findings of noncompliance identified in FFY 2010 were corrected in a timely manner.
Because the State reported less than 100% compliance for FFY 2011 (greater than 0% actual target data for this indicator), the State must report on the status of correction of noncompliance identified in FFY 2011 for this indicator. The State must demonstrate, in the FFY 2012 APR, that the districts identified in FFY 2011 with disproportionate representation of racial and ethnic groups in special education and related services that was the result of inappropriate identification are in compliance with the requirements in 34 CFR §§300.111, 300.201, and 300.301 through 300.311, including that the State verified that each district with noncompliance: (1) is
FFY 2011 Findings of Noncompliance Not Timely Corrected (corrected more than one year from identification of the noncompliance and/or Not Corrected): 4. Number of FFY 2011 findings not timely corrected (same as the number
from (3) above) 0
5. Number of FFY 2011 findings the state has verified as corrected beyond the one-year timeline (“subsequent correction”) 0
6. Number of FFY 2011 findings not verified as corrected [(4) minus (5)] 0

APR – Part B Michigan
Part B State Annual Performance Report for FFY 2012 (2012-2013) Indicator 9 Page 117 (OMB NO: 1820-0624 / Expiration Date: 7/31/2015)
Indicator Status OSEP Analysis and Next Steps
excluded from the calculation. correctly implementing the specific regulatory requirement(s) (i.e., achieved 100% compliance) based on a review of updated data such as data subsequently collected through on-site monitoring or a State data system; and (2) has corrected each individual case of noncompliance, unless the child is no longer within the jurisdiction of the district, consistent with OSEP Memo 09-02. In the FFY 2012 APR, the State must describe the specific actions that were taken to verify the correction.
Michigan Response: Three districts were identified in FFY 2011 as having disproportionate representation of racial/ethnic subgroups in special education and related services that was the result of inappropriate identification policies, procedures and/or practices. The OSE verified, through on-site visits and the completion of the district’s CAP activities, that all three districts: 1) has corrected each individual case of noncompliance within one year of notification, unless the child is no longer within the jurisdiction of the Local Education Agency, and 2) is correctly implementing the specific regulatory requirements (i.e., achieved 100 percent compliance) based on a review of updated data consistent with OSEP Memo 09-02, dated October 17, 2008.

APR – Part B Updated 4-23-14 Michigan
Part B State Annual Performance Report for FFY 2012 (2012-2013) Indicator 10 Page 118 (OMB NO: 1820-0624 / Expiration Date: 7/31/2015)
Part B State Annual Performance Report (APR) for FFY 2012 (2012-2013) Overview of Indicator 10 (Disproportionate Representation—Eligibility Categories) Report Development: 1. See General Overview pages 6-12. 2. Business rules for data collection were reviewed and updated. Please see
Appendix D for latest Business Rules applied to the FFY 2012 APR for this indicator.
3. Findings of noncompliance were reported and corrective action plans (CAPs) were submitted and monitored through the Continuous Improvement and Monitoring System (CIMS) Workbook. For additional information pertaining to timely correction of noncompliance please refer to Appendix C.
Monitoring Priority: Disproportionate Representation—Eligibility Categories
(Compliance Indicator)
Indicator 10: Percent of districts with disproportionate representation of racial and ethnic groups in specific disability categories that is the result of inappropriate identification. (20 U.S.C. 1416(a)(3)(C))
Measurement: Percent = [(# of districts with disproportionate representation of racial and ethnic groups in specific disability categories that is the result of inappropriate identification) divided by the (# of districts in the State)] times 100.
Include State’s definition of “disproportionate representation.”
Based on its review of the 618 data for FFY 2012, describe how the State made its annual determination that the disproportionate over-representation it identified of racial and ethnic groups in specific disability categories was the result of inappropriate identification as required by §§300.600(d)(3) and 300.602(a); e.g., using monitoring data; reviewing policies, practices and procedures, etc. In determining disproportionate representation, analyze data, for each district, for all racial and ethnic groups in the district, or all racial and ethnic groups in the district that meet a minimum “n” size set by the State. Report on the percent of districts in which disproportionate representation of racial and ethnic groups in specific disability categories is the result of inappropriate identification, even if the determination of inappropriate identification was made after the end of the FFY 2012; i.e., after June 30, 2013. If inappropriate identification is identified, report on corrective actions taken.

APR – Part B Updated 4-23-14 Michigan
Part B State Annual Performance Report for FFY 2012 (2012-2013) Indicator 10 Page 119 (OMB NO: 1820-0624 / Expiration Date: 7/31/2015)
Definition of Disproportionate Representation: Michigan’s operational definition of districts with disproportionate representation as a result of inappropriate identification includes:
Over-Representation
Step 1: Identify Districts with Disproportionate Representation
For the FFY 2012 APR, the two school years considered were FFY 2011 (2011-2012) and FFY 2012 (2012-2013). A verified ratio45 greater than 2.5 for two consecutive years for any racial/ethnic group in one of six eligibility categories was used to identify districts for focused monitoring activities.
Step 2: Analysis of Identification Policies, Procedures and Practices
As a result of analyzing disproportionate data and applying selection criteria, the Office of Special Education (OSE) completed a focused monitoring activity including either an on-site visit, desk audit, or issued a Monitoring Activities Report (MAR) for districts that had a risk ratio (RR) greater than 2.5 for both years. The OSE reviewed district processes and student records and conducted interviews to determine if the disproportionate representation was the result of inappropriate identification policies, procedures or practices. This resulted in a focused monitoring report that included any findings of noncompliance.
45 In cases where the sum of all other students with an individualized education program (IEP) equals fewer than ten, an alternate risk ratio (ARR) was calculated for the race under consideration, per Data Accountability Center’s recommendation. A RR was calculated when the racial/ethnic distribution of the district’s student population varied significantly from the state racial distribution which was used to calculate weighted risk ratios/ARR. The RR compared identification rates by race/ethnicity with the district’s student population.

APR – Part B Updated 4-23-14 Michigan
Part B State Annual Performance Report for FFY 2012 (2012-2013) Indicator 10 Page 120 (OMB NO: 1820-0624 / Expiration Date: 7/31/2015)
Measurable and Rigorous Targets
FFY Baseline Target Actual
2005 1.7%
2006 0% 3.2%
2007 0% 1.7%
2008 0% 1.4%
2009 0% 0.9%
2010 0% 0.7%
2011 0% 1.1%
2012 0% 1.3%* Percent = [(# of districts with disproportionate representation of racial and ethnic groups in specific disability categories that is the result of inappropriate identification) divided by the (# of districts in the state)] times 100.
*[11 ÷ 820] X 100 Source: Michigan Student Data System, CIMS During the 2012-2013 school year, the OSE analyzed FFY 2011 and FFY 2012 data for 820 districts; of those districts, 182 were excluded from the disproportionate representation calculations because they had fewer than 30 students with an IEP enrolled. Based on the focused monitoring selection criteria, 23 districts were identified for a focused monitoring activity. Three districts had disproportionate representation data, but had been monitored the previous year and were either in the year of correction, or had been found to have compliant identification procedures. Eleven of the remaining twenty districts were found to have disproportionate over-representation due to inappropriate identification policies, procedures and/or practices. Explanation of Progress or Slippage that occurred for FFY 2012: Michigan did not meet its FFY 2012 target of zero percent for Indicator 10. Of the 23 districts with data indicating over-representation, eleven districts were identified with disproportionate representation due to over-representation as a result of inappropriate identification policies, procedures and/or practices. One district was identified because of over-representation of American Indian students in the category of other health impairment. One district was identified for over-representation of Black students in the category of cognitive impairment. Three districts were identified because of over-representation of Black students in the category of specific learning disability. One district was identified because of over-representation of Hispanic students in the category of specific learning disability. One district was identified for over-representation of White students in the category of autism spectrum disorder. Two districts were identified for over-representation of

APR – Part B Updated 4-23-14 Michigan
Part B State Annual Performance Report for FFY 2012 (2012-2013) Indicator 10 Page 121 (OMB NO: 1820-0624 / Expiration Date: 7/31/2015)
White students in the category of emotional impairment. Two districts were identified for over-representation of White students in the category of other health impairment. Each of the districts with findings of noncompliance developed a CAP with technical assistance (TA) provided by the OSE.
46 A district may appear more than once in the table due to multiple findings.
FFY 2012 Disproportionate Over-Representation Analysis: Number and percent of identified districts46 with findings by disability category and racial/ethnic group.
Race/ Ethnicity
Autism Spectrum Disorder
Cognitive Impairment
Emotional Impairment
Other Health Impairment
Specific Learning Disability
Speech and Language
Impairment # % # % # % # % # % # %
American Indian or
Alaska Native
0 0.0% 0 0.0% 0 0.0% 1 0.1% 0 0.0% 0 0.0%
Asian 0 0.0% 0 0.0% 0 0.0% 0 0.0% 0 0.0% 0 0.0%
African American/
Black 0 0.0% 1 0.1% 0 0.0% 0 0.0% 3 0.4% 0 0.0%
Hispanic/ Latino 0 0.0% 0 0.0% 0 0.0% 0 0.0% 1 0.1% 0 0.0%
Native Hawaiian
or Other Pacific
Islander
0 0.0% 0 0.0% 0 0.0% 0 0.0% 0 0.0% 0 0.0%
White 1 0.1% 0 0.0% 2 0.2% 2 0.2% 0 0.0% 0 0.0%
Two or More Races
0 0.0% 0 0.0% 0 0.0% 0 0.0% 0 0.0% 0 0.0%

APR – Part B Updated 4-23-14 Michigan
Part B State Annual Performance Report for FFY 2012 (2012-2013) Indicator 10 Page 122 (OMB NO: 1820-0624 / Expiration Date: 7/31/2015)
Discussion of Improvement Activities Completed:
Timelines Activities Status
IMPROVE DATA COLLECTION
2011-2013 1. Examine and update, as necessary, procedures for analyzing data in the determination of disproportionate representation including a review of any impact in collection of data from the Single Record Student Database (SRSD)/MSDS to only the MSDS.
The OSE met with Wayne State University researchers who conduct the disproportionate representation analysis and reviewed the procedures for data collection and processing. No updates were needed.
PROGRAM DEVELOPMENT
2011-2013 2. Ensure involvement of districts in: Review of the data that resulted
in their identification for disproportionate representation;
Review of their policies, procedures and practices used to identify whether these are determinants of the disproportionate data; and
Development of any necessary CAP.
The OSE: Districts were notified of the
data results in May and provided login information that would allow districts access to their data.
Reviewed district policies, procedures and practices used to identify whether these are determinants of the disproportionate data.
Required districts to develop CAPs as necessary.
PROVIDE TECHNICAL ASSISTANCE
2011-2013 3. Provide TA in the development and implementation of a CAP to districts whose identification policies, procedures and practices are a determinant for the disproportionate representation of students from racial/ethnic groups in specific disabilities.
As part of the CIMS process, a TA provider was assigned to each district identified with findings of noncompliance to assist with the development and implementation of a CAP to ensure appropriate policies, procedures and practices. The TA provider worked with the district until correction was verified and the finding was closed by the OSE.

APR – Part B Updated 4-23-14 Michigan
Part B State Annual Performance Report for FFY 2012 (2012-2013) Indicator 10 Page 123 (OMB NO: 1820-0624 / Expiration Date: 7/31/2015)
Timely Correction of FFY 2011 Findings of Noncompliance (corrected within one year from identification of the noncompliance): 1. Number of findings of noncompliance the state made during FFY 2011
(the period from July 1, 2011 through June 30, 2012) 9
2. Number of FFY 2011 findings the state verified as timely corrected (corrected within one year from the date of notification to the local educational agency (LEA) of the finding)
9
3. Number of FFY 2011 findings not verified as corrected within one year [(1) minus (2)] 0
FFY 2011 Findings of Noncompliance Not Timely Corrected (corrected more than one year from identification of the noncompliance and/or Not Corrected): 4. Number of FFY 2011 findings not timely corrected (same as the number
from (3) above) 0
5. Number of FFY 2011 findings the state has verified as corrected beyond the one-year timeline (“subsequent correction”) 0
6. Number of FFY 2011 findings not verified as corrected [(4) minus (5)] 0
Revisions, with Justification, to Proposed Targets / Improvement Activities / Timelines / Resources for FFY 2012
Timelines New and Revised Activities Justification
IMPROVE DATA COLLECTION 2011-2014 Revision of Activity #1: Review and
update as necessary the procedures for extracting and analyzing data in the determination of disproportionate representation.
The portion of the previous improvement activity pertaining to review the impact of the transition from the SRSD/MSDS to only the MSDS has been completed.
Michigan Part B FFY 2011 State Performance Plan (SPP)/APR Response Table from OSEP
Indicator Status OSEP Analysis and Next Steps
The State reported that 20 districts were
FFY 2010 Data
FFY 2011 Data
FFY 2011
Target
Correction of Findings of Noncompliance Identified
In FFY 2010
0.7% 1.1% 0% The State reported that all 11 of its findings of noncompliance identified in FFY 2010 were corrected in a timely manner.
Because the State reported less than 100% compliance for FFY 2011 (greater than 0% actual target data for this indicator), the State must report on the status of correction of noncompliance identified in FFY 2011 for this indicator. The State must demonstrate, in the FFY 2012 APR, that the districts identified in FFY 2011 with disproportionate
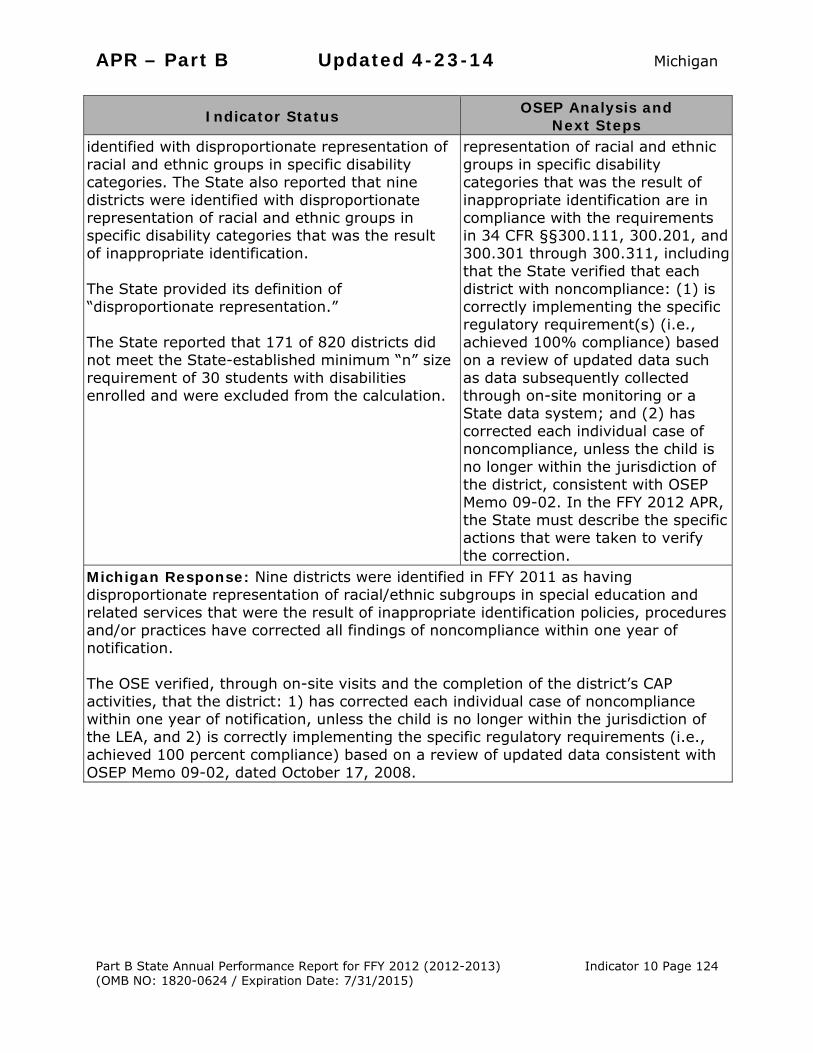
APR – Part B Updated 4-23-14 Michigan
Part B State Annual Performance Report for FFY 2012 (2012-2013) Indicator 10 Page 124 (OMB NO: 1820-0624 / Expiration Date: 7/31/2015)
Indicator Status OSEP Analysis and Next Steps
identified with disproportionate representation of racial and ethnic groups in specific disability categories. The State also reported that nine districts were identified with disproportionate representation of racial and ethnic groups in specific disability categories that was the result of inappropriate identification. The State provided its definition of “disproportionate representation.” The State reported that 171 of 820 districts did not meet the State-established minimum “n” size requirement of 30 students with disabilities enrolled and were excluded from the calculation.
representation of racial and ethnic groups in specific disability categories that was the result of inappropriate identification are in compliance with the requirements in 34 CFR §§300.111, 300.201, and 300.301 through 300.311, including that the State verified that each district with noncompliance: (1) is correctly implementing the specific regulatory requirement(s) (i.e., achieved 100% compliance) based on a review of updated data such as data subsequently collected through on-site monitoring or a State data system; and (2) has corrected each individual case of noncompliance, unless the child is no longer within the jurisdiction of the district, consistent with OSEP Memo 09-02. In the FFY 2012 APR, the State must describe the specific actions that were taken to verify the correction.
Michigan Response: Nine districts were identified in FFY 2011 as having disproportionate representation of racial/ethnic subgroups in special education and related services that were the result of inappropriate identification policies, procedures and/or practices have corrected all findings of noncompliance within one year of notification. The OSE verified, through on-site visits and the completion of the district’s CAP activities, that the district: 1) has corrected each individual case of noncompliance within one year of notification, unless the child is no longer within the jurisdiction of the LEA, and 2) is correctly implementing the specific regulatory requirements (i.e., achieved 100 percent compliance) based on a review of updated data consistent with OSEP Memo 09-02, dated October 17, 2008.


APR – Part B Michigan
Part B State Annual Performance Report for FFY 2012 (2012-2013) Indicator 11 Page 126 (OMB NO: 1820-0624 / Expiration Date: 7/31/2015)
Part B State Annual Performance Report (APR) for FFY 2012 (2012-2013)
Overview of Indicator 11 (Child Find) Report Development: 1. See General Overview pages 6-12. 2. The Office of Special Education (OSE) continued to intensify collaborative efforts
within and across the Performance Reporting (PR) and Program Accountability (PA) units to collect and verify data, disseminate accurate information and provide technical assistance (TA) to all stakeholders about Child Find and the timely completion of initial evaluations and individualized education programs (IEPs).
3. Per the Office of Special Education Programs (OSEP’s) guidance, Michigan included student records reported with an evaluation outcome in FFY 2012 and parental consent obtained at the end of the previous school year.
4. Findings of noncompliance were reported and corrective action plans (CAPs) were submitted and monitored through the Continuous Improvement and Monitoring System (CIMS) Workbook. For additional information pertaining to timely correction of noncompliance please refer to Appendix C.
Monitoring Priority: General Supervision/Child Find (Compliance Indicator)
Indicator 11: Percent of children who were evaluated within 60 days of receiving parental consent for initial evaluation or, if the State establishes a timeframe within which the evaluation must be conducted, within that timeframe. (20 U.S.C. 1416(a)(3)(B))
Measurement: a. # of children for whom parental consent to evaluate was received. b. # of children whose evaluations were completed within 60 days (or State-
established timeline).
Account for children included in a but not included in b. Indicate the range of days beyond the timeline when the evaluation was completed and any reasons for the delays.
Percent = [(b) divided by (a)] times 100.

APR – Part B Michigan
Part B State Annual Performance Report for FFY 2012 (2012-2013) Indicator 11 Page 127 (OMB NO: 1820-0624 / Expiration Date: 7/31/2015)
Measurable and Rigorous Targets
FFY Baseline Target Actual
2005 80.5%47
2006 100% 96.2%
2007 100% 87.1%
2008 100% 95.3%
2009 100% 99.1%
2010 100% 99.4%
2011 100% 99.4%
2012 100% 99.6%* Percent = [(# of children whose evaluations were completed within 30 school days or agreed upon extension) divided by (# of children for whom parental consent to evaluate was received)] times 100.
*[25,506 ÷ 25,600] X 100 Source: Michigan Student Data System (MSDS) Explanation of Progress or Slippage that occurred for FFY 2012: Michigan did not meet its FFY 2012 target of 100 percent for Indicator 11. Michigan had a decrease (2,036) in the number of children for whom parental consent to evaluate was received and an increase in the rate of compliance. Michigan’s consistent high percentage of student evaluations within the 30 school day timeline or an agreed upon extension for this indicator is due in part to the continued TA and outreach provided through the OSE PR and PA Units. Through the CIMS, districts were provided with ongoing supports and access to current and consistent information.
47 Based on the OSEP approved cohort with data from one-third of the state. Since that time, Michigan has moved to a statewide data collection.

APR – Part B Michigan
Part B State Annual Performance Report for FFY 2012 (2012-2013) Indicator 11 Page 128 (OMB NO: 1820-0624 / Expiration Date: 7/31/2015)
Child Find Data for FFY 2011 – FFY 2012
Child Find Categories FFY 2011
FFY 201248
(a) # of children for whom parental consent to evaluate was received.
27,636 25,600
(b) # of children whose evaluations were completed within 30 school days or a mutually agreed upon extension.
27,468 25,506
# of children included in (a) but not included in (b). 168 94 Source: MSDS For the late IEPs, the following table presents the reasons districts gave and the number and percent of eligible and ineligible children reported for each reason.
Reason for Late IEP Eligible
Children with a Late IEP
Ineligible Children with
a Late IEP IEP Not Timely: External report not available 19 4 IEP Not Timely: Personnel not available for evaluation 24 6
IEP Not Timely: Personnel not available for IEP 31 10
Total 74 20 Source: MSDS For the late IEPs, the number of calendar days beyond the required 30 school day timeline49 (or agreed-upon extension) ranged from one day to 90 days. The following table presents the number and percent of late IEPs by range of days late.
Range of Days Beyond 30 Number of Late IEPs
Percent of Late IEPs
1-5 days 35 37.2% 6-10 days 19 20.2% 11-15 days 13 13.8% 16-20 days 9 9.6% 21-25 days 3 3.2% 26-30 days 4 4.3% > 30 days 11 11.7%
Source: MSDS
48 Includes student records reported with an evaluation outcome in FFY 2012 and parental consent obtained at the end of the previous school year. 49 Michigan’s state established timeframe within which the evaluation must be completed.

APR – Part B Michigan
Part B State Annual Performance Report for FFY 2012 (2012-2013) Indicator 11 Page 129 (OMB NO: 1820-0624 / Expiration Date: 7/31/2015)
Discussion of Improvement Activities Completed:
Timelines Activities Status
IMPROVE COLLABORATION/COORDINATION
2011-2013
1. Continue to collaborate with targeted stakeholders to review and update, as necessary, Michigan’s Child Find policies, procedures and practices.
Personnel from the Office of Great Start, Early Childhood Education and Family Services and the OSE PR and PA Units continued to review Michigan’s Child Find policies, procedures and practices for potential updates. No updates were identified.
CLARIFY/EXAMINE/DEVELOP POLICIES AND PROCEDURES
2011-2013
2. Review and refine an integrated set of general supervision activities across the general supervision indicators, Mandated Activities Projects50 and Michigan’s monitoring system in order to improve compliance.
Michigan’s Child Find Project continued to disseminate products to primary referral sources and provided outreach at statewide conferences and meetings. Michigan’s Child Find Project also processed 2,104 inquiries regarding individuals who may have a disability. State monitors offered TA to districts with noncompliant data. The monitoring system website included improved TA about Child Find federal requirements. Training, TA and supports were also provided to districts through the OSE PA Unit and Project Find. The PA Unit provided TA for 119 inquiries that were received regarding the identification of children and students.
Revisions, with Justification, to Proposed Targets / Improvement
Timelines New and Revised Activities Justification
IMPROVE COLLABORATION/COORDINATION
2013-2014 New Activity: The OSE will collaborate with targeted stakeholders to develop and continuously review an internal system of communication, data collection and follow-up to ensure the implementation of Michigan's Child Find policies, procedures and practices.
The OSE has completed an internal restructuring process for Michigan’s Child Find activities. As a result of this restructuring, updated communication, data collection and follow-up
50 Michigan’s state improvement and compliance initiatives, funded with Individuals with Disabilities Education Act administrative set-aside funds.

APR – Part B Michigan
Part B State Annual Performance Report for FFY 2012 (2012-2013) Indicator 11 Page 130 (OMB NO: 1820-0624 / Expiration Date: 7/31/2015)
Timelines New and Revised Activities Justification
Resources: The OSE, Intermediate School Districts (ISD), and appropriate LEA Grantees
systems/processes need to be developed.
2011-2013 Deletion of Activity #1: Continue to collaborate with targeted stakeholders to review and update, as necessary, Michigan’s Child Find policies, procedures and practices.
Redundancy due to internal restructuring.
2011-2013 Deletion of Activity #2: Review and refine an integrated set of general supervision activities across the general supervision indicators, Mandated Activities Projects51 and Michigan’s monitoring system in order to improve compliance.
Redundancy due to internal restructuring.
Timely Correction of FFY 2011 Findings of Noncompliance (corrected within one year from identification of the noncompliance): 1. Number of findings of noncompliance the state made during FFY 2011
(the period from July 1, 2011 through June 30, 2012) 59
2. Number of FFY 2011 findings the state verified as timely corrected (corrected within one year from the date of notification to the LEA of the finding)
58
3. Number of FFY 2011 findings not verified as corrected within one year [(1) minus (2)] 1
FFY 2011 Findings of Noncompliance Not Timely Corrected (corrected more than one year from identification of the noncompliance and/or Not Corrected): 4. Number of FFY 2011 findings not timely corrected (same as the
number from (3) above) 1
5. Number of FFY 2011 findings the state has verified as corrected beyond the one-year timeline (“subsequent correction”) 1
6. Number of FFY 2011 findings not verified as corrected [(4) minus (5)] 0 51 Michigan’s state improvement and compliance initiatives, funded with Individuals with Disabilities Education Act administrative set-aside funds.

APR – Part B Michigan
Part B State Annual Performance Report for FFY 2012 (2012-2013) Indicator 11 Page 131 (OMB NO: 1820-0624 / Expiration Date: 7/31/2015)
Correction of FFY 2011 Findings of Noncompliance (See Indicator 15) FFY 2011 Correction of Noncompliance
Finding Indicator District Identifier
Nature of Noncompliance
Program-Specific Follow-Up Activities Related To The
Uncorrected Noncompliance 4 11 440 Child Find (failure
to evaluate for all suspected disabilities.)
Finding issued: December 15, 2011 as a result of data submitted through MSDS. Summary of Activities: As a result of Child Find noncompliance, the district developed a system for accurate data collection that included having multiple staff thoroughly review the initial IEP dates and timelines. Additionally, the district implemented a monthly review of all initial IEP data to ensure that all identified evaluations noted on the REED document were conducted accordingly. The district provided Professional Development (PD) on three separate occasions for all administrators and staff. Procedure forms were developed that included an IEP checklist and a formal referral process. Additional one-on-one PD was provided regarding MSDS data to the secretary who is responsible for the inputting of data. Status: The finding was verified and closed by the OSE on September 18, 2013.

APR – Part B Michigan
Part B State Annual Performance Report for FFY 2012 (2012-2013) Indicator 11 Page 132 (OMB NO: 1820-0624 / Expiration Date: 7/31/2015)
Michigan Part B FFY 2011 State Performance Plan (SPP)/APR Response Table from OSEP
Indicator Status OSEP Analysis and Next Steps
Michigan Response
FFY 2010 Data
FFY 2011 Data
FFY 2011 Target
Correction of Findings of Noncompliance Identified In FFY 2010
99.4%
99.4%
100%
The State reported that all 58 of its findings of noncompliance identified in FFY 2010 were corrected in a timely manner.
Because the State reported less than 100% compliance for FFY 2011, the State must report on the status of correction of noncompliance identified in FFY 2011 for this indicator. When reporting on the correction of noncompliance, the State must report, in its FFY 2012 APR, that it has verified that each LEA with noncompliance identified in FFY 2011 for this indicator: (1) is correctly implementing the specific regulatory requirements (i.e., achieved 100% compliance) based on a review of updated data such as data subsequently collected through on-site monitoring or a State data system; and (2) has corrected each individual case of noncompliance, unless the child is no longer within the jurisdiction of the LEA, consistent with
Noncompliance with the timely initial evaluation requirements that the state identified in FFY 2011 as a result of the review conducted was corrected and verified in 58 districts within one year of notification. One district was corrected beyond one year. The state verified that each LEA with noncompliance identified by the state: (1) had corrected each individual case of noncompliance, unless the child was no longer within the jurisdiction of the LEA, consistent with OSEP Memo 09-02, dated October 17, 2008; and (2) is correctly implementing the specific regulatory requirements (i.e., achieved 100 percent compliance) based on a review of updated data subsequently collected through

APR – Part B Michigan
Part B State Annual Performance Report for FFY 2012 (2012-2013) Indicator 11 Page 133 (OMB NO: 1820-0624 / Expiration Date: 7/31/2015)
Indicator Status OSEP Analysis and Next Steps
Michigan Response
OSEP Memo 09-02. In the FFY 2012 APR, the State must describe the specific actions that were taken to verify the correction.
on-site monitoring and/or entered into the state data system.

APR – Part B Michigan
Part B State Annual Performance Report for FFY 2012 (2012-2013) Indicator 12 Page 134 (OMB NO: 1820-0624 / Expiration Date: 7/31/2015)
Part B State Annual Performance Report (APR) for FFY 2012 (2012-2013)
Overview of Indicator 12 (Early Childhood Transition) Report Development: 1. See General Overview pages 6-12. 2. Findings of noncompliance were reported and corrective action plans (CAPs)
were submitted and monitored through the Continuous Improvement and Monitoring System (CIMS) Workbook. For additional information pertaining to timely correction of noncompliance, please refer to Appendix C.
3. The 2012-2013 school year was the first time data for this indicator were collected via the Michigan Student Data System (MSDS).
Monitoring Priority: General Supervision/Early Childhood Transition
(Compliance Indicator)
Indicator 12: Percent of children referred by Part C prior to age 3, who are found eligible for Part B, and who have an individualized education program (IEP) developed and implemented by their third birthdays. (20 U.S.C. 1416(a)(3)(B))
Measurement:
a) # of children who have been served in Part C and referred to Part B for Part B eligibility determination.
b) # of those referred determined to be NOT eligible and whose eligibility was determined prior to their third birthdays.
c) # of those found eligible who have an IEP developed and implemented by their third birthdays.
d) # of children for whom parent refusal to provide consent caused delays in evaluation or initial services or to whom exceptions under 34 CFR §300.301(d) applied.
e) # of children determined to be eligible for early intervention services under Part C less than 90 days before their third birthdays.
Account for children included in a but not included in b, c, d or e. Indicate the range of days beyond the third birthday when eligibility was determined and the IEP developed and the reasons for the delays.
Percent = [(c) divided by (a - b - d - e)] times 100.

APR – Part B Michigan
Part B State Annual Performance Report for FFY 2012 (2012-2013) Indicator 12 Page 135 (OMB NO: 1820-0624 / Expiration Date: 7/31/2015)
Measurable and Rigorous Targets
FFY Baseline Target Actual
2005 92.1%
2006 100% 91.5%
2007 100% 93.9%
2008 100% 97.8%
2009 100% 98.7%
2010 100% 98.6%
2011 100% 99.4%
2012 100% 98.4%*
Percent = [(c) divided by (a - b - d - e)] times 100.
*[4,566 ÷ (4,973 – 222 – 108 - 5)] X 100 Source: Michigan Student Database System (MSDS), data verification survey
Explanation of Progress or Slippage that occurred for FFY 2012: Michigan did not meet its FFY 2012 target of 100 percent for Indicator 12. In the 2012-2013 school year, there were 4,973 children being served in Part C who also participated in Michigan birth through three special education programs and services. Of these, 4,566 were found eligible for Part B services, and had an IEP developed and implemented by their third birthday. There were 72 children that had late IEPs. These were distributed across 28 local school districts located within 13 of Michigan’s intermediate school districts (ISDs). All 72 children with a late IEP had an IEP developed and implemented during the 2012-2013 school year. Districts identified the following reasons for noncompliance: personnel unavailable, late notification from Part C, timeline began in a previous district or unknown (reference Table 2 for details). Districts noted that lack of available staff was a result of the funding cuts experienced over the past several years. Increased training and technical assistance (TA) opportunities offered by the Office of Special Education (OSE) and the Office of Great Start, Early Childhood Education & Family Services (OGS/ECE&FS) staff improved districts’ ability to identify and ensure correction of noncompliance and increase collaboration between the Part C and Part B systems. Through the CIMS, districts were notified, offered tools for systemic data improvement, and required to review and revise, if

APR – Part B Michigan
Part B State Annual Performance Report for FFY 2012 (2012-2013) Indicator 12 Page 136 (OMB NO: 1820-0624 / Expiration Date: 7/31/2015)
necessary, the transition process. Many ISDs developed plans and interagency agreements that led to stronger compliance and improved transitions of children from Part C to Part B. Additionally, there was an increase in training and TA sessions offered, both on-site to ISDs and throughout the state at preschool conferences, focusing on the revised definition of potentially eligible. This updated definition specifies the population of children in Part C who are also currently receiving special education programs and services. Since those children are already receiving special education services, there is a greater likelihood that they will be eligible for special education services at age three. During data verification, the OGS/ECE&FS confirmed that the majority of the districts do have clear procedures and protocols for the transition between Part C exit and Part B entry. However, specific issues did surface that could have contributed to the decreased percent of compliance this year. The 2012-2013 school year was the first year data for this indicator were collected in the Michigan Student Data System (MSDS). Previously, data were collected in the Michigan Compliance Information System (MI-CIS), which was decommissioned on September 30, 2012. Without MI-CIS districts contracted with data system vendors to assist with data collection and reporting requirements. It was determined the business rules for some of the local district’s data systems were not aligned with the MSDS business rules thus affecting their data collection and reporting fields. IEPs assigned to this unknown category (55 IEPs) may have an earlier IEP on file on a combined IFSP/IEP form; however, the districts did not enter the data into the MSDS. Districts receiving findings of noncompliance for Part C to Part B transition were required to complete a CAP to ensure correction of noncompliance. Districts were required to address personnel issues in CAPs and ensure on-time completion of IEPs even with staff shortages. Additionally, districts were required as part of their CAP activity to review the Transition webinar which emphasizes the updated business rules for the MSDS. This will enable districts to collaborate with their local data system vendors to ensure alignment with the MSDS data collection fields. Completed CAPs were verified by ISD monitors through a data sample. Districts were required to correct noncompliance as soon as possible, but in no case later than one year including verification.

APR – Part B Michigan
Part B State Annual Performance Report for FFY 2012 (2012-2013) Indicator 12 Page 137 (OMB NO: 1820-0624 / Expiration Date: 7/31/2015)
Table 1: Analysis of Early Childhood Transition Data for FFY 2012
Early Childhood Transition Categories FFY 2011 FFY 2012
a. # of children who have been served in Part C and referred to Part B for eligibility determination. 4,030 4,973
b. # of those referred determined to be NOT eligible and whose eligibilities were determined prior to their third birthdays.
38 222
c. # of those found eligible who have an IEP developed and implemented by their third birthdays. 3,924 4,566
d. # of children for whom parent refusal to provide consent caused delays in evaluation or initial services. 26 108
e. # of children who were referred to Part C less than 90 days before their third birthdays. 17 5
Source: MSDS, data verification survey Presented in Table 2 are the reasons districts gave for late IEPs and the number of eligible and ineligible children reported with each reason: Table 2: Reported Reasons for Late IEP
Reason for Late IEP
Number of Eligible
Children with Late IEPs
Number of Ineligible
Children with Late IEPs
Late notification from Part C (less than 90 days before third birthday) 7 0
Extenuating family circumstances 0 0
Unable to arrange mutually agreeable evaluation/IEP times 0 0
Personnel unavailable to complete within timeline 9 0
Timeline began in previous district 1 0
Unknown 47 8
Total 64 8
Source: MSDS, data verification survey

APR – Part B Michigan
Part B State Annual Performance Report for FFY 2012 (2012-2013) Indicator 12 Page 138 (OMB NO: 1820-0624 / Expiration Date: 7/31/2015)
Displayed in Table 3 are the number of ISDs with late IEPs and Table 4 includes the number and percent of late IEPs by days beyond a child’s third birthday: Table 3: Table 4:
Discussion of Improvement Activities Completed:
Timelines Activities Status
PROVIDE TRAINING/PROFESSIONAL DEVELOPMENT
2011-2013 1. Develop and monitor districts’ transition training and TA activities from Part C to Part B.
Personnel from the OSE Performance Reporting Monitoring and Technical Assistance Team (OSE/PR/MTAT), the CIMS Team and the Office of Great Start/Early Childhood Education & Family Services (OGS/ECE&FS) provided on-site TA assistance to Local Education Agencies (LEA) staff members which incorporated review of their transition policies and procedures and suggested recommendations for changes to current practices.
2012-2013 2. The OGS/ECE&FS will work with the OSE Performance Reporting (PR) CIMS Team, districts, and a contracted ISD to develop and deliver professional development pertaining to children’s transition from Part C to Part B including IEP implementation by the child’s third birthday.
The OGS/ECE&FS, the OSE/PR/MTAT, and the CIMS Team provided breakout sessions at several conferences throughout Michigan. Breakout sessions on transition practices and guidelines were offered at the Michigan Council for Exceptional Children Conference, the Michigan Collaborative Early Childhood Conference, the Michigan Division for Early Childhood Conference, and the Upper Peninsula Early Childhood Conference. The OGS/ECE&FS and the OSE developed and disseminated transition guidance documents to the field to assist in answering commonly asked
Number of Late IEPS
Number of ISDs
1 4
2 - 3 4
> 4 5
Range of Days Beyond Third Birthday
Number of Late IEPs
Number and Percent of Late IEPs
1-10 days 21 29.2%
11-50 days 21 29.2%
51-100 days 11 15.3%
>100 days 19 26.4%

APR – Part B Michigan
Part B State Annual Performance Report for FFY 2012 (2012-2013) Indicator 12 Page 139 (OMB NO: 1820-0624 / Expiration Date: 7/31/2015)
Timelines Activities Status
transition questions.
IMPROVE SYSTEMS ADMINISTRATION AND MONITORING
2011-2013 3. Target local educational agencies determined to be out of compliance for TA and take appropriate corrective action.
Personnel from the OSE/PR/Monitoring and Technical Assistance Team (OSE/PR/MTAT), the CIMS Team, and OGS/ECE&FS provided targeted training and TA on transition noncompliance for both Part C and Part B LEA staff members. Part C, Early On staff were included in the professional development trainings where late notification from Part C to Part B was deemed a primary reason for noncompliance. On-site TA assistance provided to LEA staff members incorporated review of their transition policies and procedures and recommendations for changes to current practices. Student level record reviews to verify correction of noncompliance were conducted. Districts receiving findings of noncompliance for Part C to Part B transition were required to complete a CAP. Districts needed to perform a root cause analysis to determine the reason for noncompliance. Completed CAPs were verified by ISD monitors through data samples. Districts were required to correct noncompliance as soon as possible, but in no case later than one year including verification. Districts completed their CAPs by verifying Indicator 12 data through a data sample and the CAPs were verified by the OSE.

APR – Part B Michigan
Part B State Annual Performance Report for FFY 2012 (2012-2013) Indicator 12 Page 140 (OMB NO: 1820-0624 / Expiration Date: 7/31/2015)
Timely Correction of FFY 2011 Findings of Noncompliance (corrected within one year from identification of the noncompliance): 1. Number of findings of noncompliance the state made during FFY 2011
(the period from July 1, 2011 through June 30, 2012) 28
2. Number of FFY 2011 findings the state verified as timely corrected (corrected within one year from the date of notification to the local education agency (LEA) of the finding)
28
3. Number of FFY 2011 findings not verified as corrected within one year [(1) minus (2)] 0
FFY 2011 Findings of Noncompliance Not Timely Corrected (corrected more than one year from identification of the noncompliance and/or Not Corrected): 4. Number of FFY 2011 findings not timely corrected (same as the number
from (3) above) 0
5. Number of FFY 2011 findings the state has verified as corrected beyond the one-year timeline (“subsequent correction”) 0
6. Number of FFY 2011 findings not verified as corrected [(4) minus (5)] 0 Revisions, with Justification, to Proposed Targets / Improvement Activities / Timelines / Resources for FFY 2012
Timelines New and Revised Activities Justification
PROVIDE TRAINING/PROFESSIONAL DEVELOPMENT 2012-2014 Revision of Activity #1: Provide targeted
TA to ISDs and LEAs pertaining to 1) transition timeline guidance and documentation, and 2) assisting in the identification of potentially eligible children to ensure the timelines for Part C, Transition Conference, and Part B, IEP by age three, are met.
Improvement activity clarification was needed to develop improvement activities that were specific to the indicator, measured student outcomes, and could be achieved in the short term.
Resources: The OSE/PR/MTAT, the CIMS Team and the OGS/ECE&FS.
2012-2014 Revision of Activity #2: Provide professional development on transition timeline guidelines and procedures in various formats including: conference presentations, online training, and webinars.
Improvement activity clarification was needed to develop improvement activities that were specific to the indicator, measured student outcomes, and could be achieved in the short term.
Resources: The OGS/ECE&FS and TA Grantee, Clinton County Regional Educational Service Agency (CCRESA).

APR – Part B Michigan
Part B State Annual Performance Report for FFY 2012 (2012-2013) Indicator 12 Page 141 (OMB NO: 1820-0624 / Expiration Date: 7/31/2015)
Timelines New and Revised Activities Justification
IMPROVE DATA COLLECTION 2013-2014 New Activity: Develop and implement
data quality checks within the MSDS. Based on results of the data verification for Indicator 12, there is a need to address data collection and reporting. Data quality checks will prompt districts to review their data for accuracy.
Resources: The OSE/PR/MTAT, the CIMS Team, the OGS/ECE&FS, and the Center for Educational Performance and Information (CEPI).
Michigan Part B FFY 2011 State Performance Plan (SPP)/APR Response Table from the Office of Special Education Programs (OSEP)
Indicator Status OSEP Analysis and
Next Steps Michigan Response
FFY 2010 Data
FFY 2011 Data
FFY 2011 Target
Correction of Findings of Noncompliance Identified in FFY 2010
98.6% 99.4% 100% The State The State reported that 37 of 38 findings of noncompliance identified in FFY 2010 were corrected in a timely manner and that the remaining finding was subsequently corrected by October 10, 2012.
Because the State reported less than 100% compliance for FFY 2011, the State must report on the status of correction of noncompliance identified in FFY 2011 for this indicator. When reporting on the correction of noncompliance, the State must report, in its FFY 2012 APR, that it has verified that each LEA with noncompliance identified in FFY 2011 for this indicator: (1) is correctly implementing the specific regulatory requirements (i.e., achieved 100% compliance) based on a review of updated data such as data subsequently collected through on-site monitoring or a State data system; and (2) has corrected each individual case of noncompliance, unless the child is no
For the sixteen districts not in compliance with the early childhood transition requirements in 34 CFR §300.124(b) that the state identified in FFY 2011 as a result of the review, conducted a review and analysis of local reports and data, developed a CAP based on a root cause analysis and submitted progress reports. The CAPs were closed and verified by the state. Each LEA with noncompliance identified by the

APR – Part B Michigan
Part B State Annual Performance Report for FFY 2012 (2012-2013) Indicator 12 Page 142 (OMB NO: 1820-0624 / Expiration Date: 7/31/2015)
Indicator Status OSEP Analysis and
Next Steps Michigan Response
longer within the jurisdiction of the LEA, consistent with OSEP Memo 09-02. In the FFY 2012 APR, the State must describe the specific actions that were taken to verify the correction.
state was correctly implementing the specific regulatory requirements (i.e., achieved 100 percent compliance) based on a review of updated data subsequently collected through on-site monitoring and/or entered into the state data system.


APR – Part B Michigan
Part B State Annual Performance Report for FFY 2012 (2012-2013) Indicator 13 Page 144 (OMB NO: 1820-0624 / Expiration Date: 7/31/2015)
Part B State Annual Performance Report (APR) for FFY 2012 (2012-2013) Overview of Indicator 13 (Secondary Transition) Report Development:
1. See General Overview pages 6-12. 2. Michigan requires each district serving students age 16 and above to participate
annually in the statewide secondary transition student record checklist. 3. In FFY 2012, both the list of students in the sample and the data entry process
continued to be integrated into the Continuous Improvement Monitoring System (CIMS) Workbook. Through this process, data-entry accuracy has improved.
4. Findings of noncompliance were reported, and corrective action plans (CAPs) were submitted and monitored through the CIMS Workbook. For additional information pertaining to timely correction of noncompliance please refer to Appendix C.
Monitoring Priority: General Supervision / Secondary Transition
(Compliance Indicator)
Indicator 13: Percent of youth with an individualized education program (IEP) aged 16 and above with an IEP that includes appropriate measurable postsecondary goals that are annually updated and based upon an age appropriate transition assessment, transition services, including courses of study, that will reasonably enable the student to meet those postsecondary goals, and annual IEP goals related to the student’s transition services needs. There also must be evidence that the student was invited to the IEP Team meeting where transition services are to be discussed and evidence that, if appropriate, a representative of any participating agency was invited to the IEP Team meeting with the prior consent of the parent or student who has reached the age of majority. (20 U.S.C. 1416(a)(3)(B))
Measurement: Percent = [(# of youth with an IEP aged 16 and above with an IEP that includes appropriate measurable postsecondary goals that are annually updated and based upon an age appropriate transition assessment, transition services, including courses of study, that will reasonably enable the student to meet those postsecondary goals, and annual IEP goals related to the student’s transition services needs. There also must be evidence that the student was invited to the IEP Team meeting where transition services are to be discussed and evidence that, if appropriate, a representative of any participating agency was invited to the IEP Team meeting with the prior consent of the parent or student who has reached the age of majority) divided by the (# of youth with an IEP age 16 and above)] times 100.

APR – Part B Michigan
Part B State Annual Performance Report for FFY 2012 (2012-2013) Indicator 13 Page 145 (OMB NO: 1820-0624 / Expiration Date: 7/31/2015)
Measurable and Rigorous Targets
FFY Baseline Target Actual
2009 74.3% 100% 74.3%
2010 100% 99.2%
2011 100% 98.6%
2012 100% 98.0%* Percent = [(# of youth with an IEP aged 16 and above with an IEP that includes appropriate measurable postsecondary goals that are annually updated and based upon an age appropriate transition assessment, transition services, including courses of study, that will reasonably enable the student to meet those postsecondary goals, and annual IEP goals related to the student’s transition services needs. There also must be evidence that the student was invited to the IEP Team meeting where transition services are to be discussed and evidence that, if appropriate, a representative of any participating agency was invited to the IEP Team meeting with the prior consent of the parent or student who has reached the age of majority) divided by the (# of youth with an IEP age 16 and above)] times 100.
*[9,649 ÷ 9,849] X 100 Source: CIMS, Secondary Transition Checklist Explanation of Progress or Slippage that occurred for FFY 2012: Michigan did not meet its FFY 2012 target of 100 percent for Indicator 13. The compliance rate declined by 0.6 percent. The Indicator 13 protocol allows students to be removed from the sample if the student has moved from the school district, has dropped out-of-school, graduated, or exited special education. Beginning in FFY 2011, the protocols changed due to a reduced data collection period of two months. Graduating students could no longer be removed from the Indicator 13 sample unless they graduated prior to April 15. This change in protocol contributed to the increase in the number of IEPs reviewed for Indicator 13 to 86 percent in both FFY 2011 and FFY 2012 (up from 80 percent in FFY 2010 and 74 percent in FFY 2009). At the same time, 8 percent of the IEPs removed from the sample were for graduating students in FFY 2012 (down from 38 percent in FFY 2010 and down from 60 percent FFY 2009). Finally, while reviewing more graduating students’ IEPs most likely contributed to the 0.6 percent decline in Indicator 13 compliance in both FFY 2011 and FFY 2012, these results are statistically equivalent. Taking into account the margin for error of 0.9 percent at a 95 percent confidence level, both the data for FFY 2011 and FFY 2012, and the overall decline from FFY 2010 to FFY 2012 are within the margin of error for the statewide sample.

APR – Part B Michigan
Part B State Annual Performance Report for FFY 2012 (2012-2013) Indicator 13 Page 146 (OMB NO: 1820-0624 / Expiration Date: 7/31/2015)
Discussion of FFY 2012 Data: Representativeness of sample Using the Office of Special Education Programs (OSEP) approved sampling frame, a sample of 9,849 students with an IEP was obtained from among the population of 38,466 eligible students. This sample was checked for representativeness (age, race/ethnicity, gender and disability) against the population of eligible students from the fall 2012 Special Education Child Count. A proportions test was used to determine if the sample varied significantly from the population of eligible students on age, race/ethnicity and disability. This test was conducted at the state level and for Michigan’s only district with more than 50,000 enrolled students. There was a significant difference in Michigan’s largest school district between the population of eligible students and the final Indicator 13 sample for one racial/ethnic group (Black). Weighted data (100 percent compliance) and unweighted data (100 percent compliance) did not vary significantly. As displayed in Table 1, there were significant differences between the population of eligible students and the final Indicator 13 sample for certain ages, racial/ethnic groups and disabilities at the state level. Table 1:
Comparison of Population and Sample (state level)
Special Education
Child Count Population
Special Education
Child Count Percent
Sample Population
Sample Percent
Age Age 16* 14,391 37.4% 3,892 39.5% Age 17* 13,071 34.0% 3,445 35.0% Age 18 6,309 16.4% 1,635 16.6% Age 19* 2,229 5.8% 433 4.4% Age 20* 1,378 3.6% 254 2.6% Age 21* 1,088 2.8% 190 1.9% Gender Female 13,507 35.1% 3,484 35.4% Male 24,959 64.9% 6,365 64.6% Race/Ethnicity American Indian or Alaska Native* 405 1.1% 143 1.5%
Asian 345 0.9% 79 0.8% African American/Black* 8,553 22.2% 1,538 15.6%
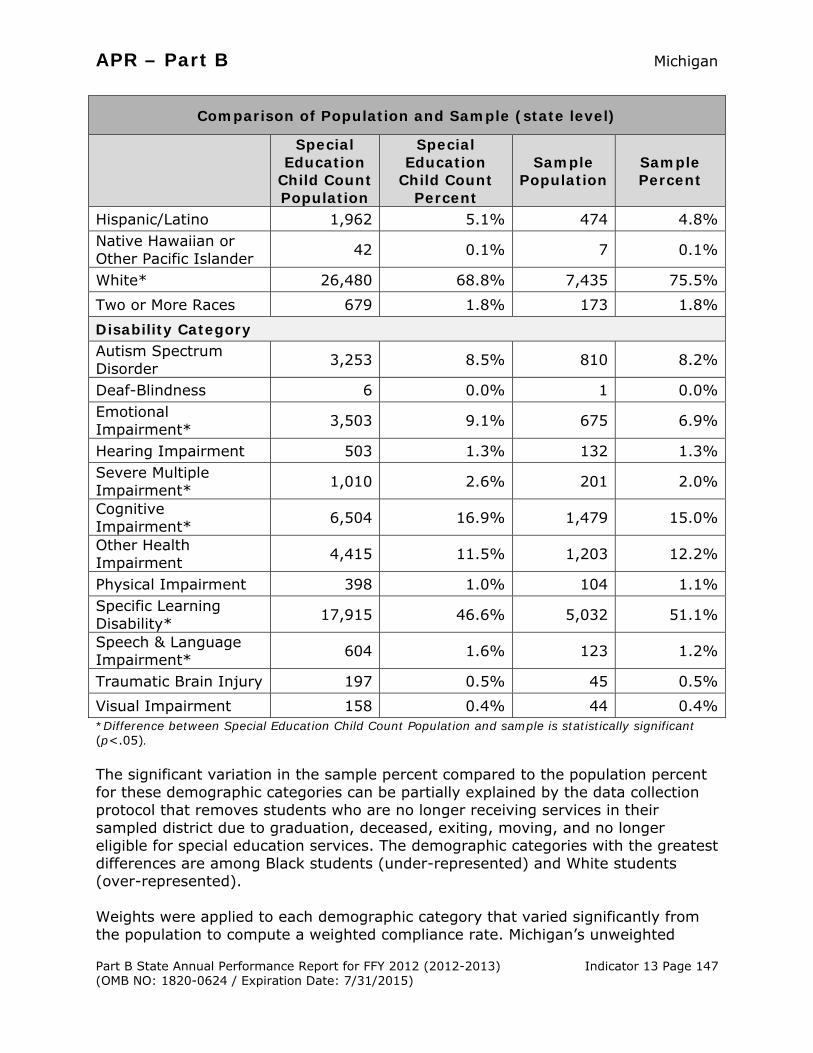
APR – Part B Michigan
Part B State Annual Performance Report for FFY 2012 (2012-2013) Indicator 13 Page 147 (OMB NO: 1820-0624 / Expiration Date: 7/31/2015)
Comparison of Population and Sample (state level)
Special Education
Child Count Population
Special Education
Child Count Percent
Sample Population
Sample Percent
Hispanic/Latino 1,962 5.1% 474 4.8% Native Hawaiian or Other Pacific Islander 42 0.1% 7 0.1%
White* 26,480 68.8% 7,435 75.5% Two or More Races 679 1.8% 173 1.8% Disability Category Autism Spectrum Disorder 3,253 8.5% 810 8.2%
Deaf-Blindness 6 0.0% 1 0.0% Emotional Impairment* 3,503 9.1% 675 6.9%
Hearing Impairment 503 1.3% 132 1.3% Severe Multiple Impairment* 1,010 2.6% 201 2.0%
Cognitive Impairment* 6,504 16.9% 1,479 15.0%
Other Health Impairment 4,415 11.5% 1,203 12.2%
Physical Impairment 398 1.0% 104 1.1% Specific Learning Disability* 17,915 46.6% 5,032 51.1%
Speech & Language Impairment* 604 1.6% 123 1.2%
Traumatic Brain Injury 197 0.5% 45 0.5% Visual Impairment 158 0.4% 44 0.4% *Difference between Special Education Child Count Population and sample is statistically significant (p<.05). The significant variation in the sample percent compared to the population percent for these demographic categories can be partially explained by the data collection protocol that removes students who are no longer receiving services in their sampled district due to graduation, deceased, exiting, moving, and no longer eligible for special education services. The demographic categories with the greatest differences are among Black students (under-represented) and White students (over-represented). Weights were applied to each demographic category that varied significantly from the population to compute a weighted compliance rate. Michigan’s unweighted

APR – Part B Michigan
Part B State Annual Performance Report for FFY 2012 (2012-2013) Indicator 13 Page 148 (OMB NO: 1820-0624 / Expiration Date: 7/31/2015)
baseline FFY 2012 Indicator 13 compliance rate of 98.0 percent was then compared to weighted results for each of the demographic categories (age, race/ethnicity and disability). Weighted results were not significantly different than unweighted results, therefore unweighted results are reported.
FFY 2011 Indicator 13 Weighted and Unweighted Compliance Rates (state level)
N # Compliant Records
Compliance Rate
Age (Weighted) 9,869 9,661 97.9% Race/Ethnicity (Weighted) 9,807 9,597 97.9% Disability (Weighted) 9,902 9,696 97.9%
[(# Compliant Records ÷ N) X 100 = Compliance Rate] UNWEIGHTED DATA 9,849 9,649 98.0%
Discussion of Improvement Activities Completed:
Timelines Activities Status
PROVIDE TECHNICAL ASSISTANCE
2011-2013 1. Use graduation, dropout, secondary transition and postsecondary outcomes data to develop and implement technical assistance (TA) and personnel development for district staff to enhance transition IEP compliance and quality.
The Michigan Transition Outcomes Project (MI-TOP) is a collaborative leadership group that guides the improvement of transition compliance and practices throughout Michigan. MI-TOP is operating the fourth year of a consistent marketing/communication demand-based strategy that centers on a set of transition-focused contextual questions. These questions were used to focus four strategies on improving student success while in school and post-school.
1. MI-TOP conducted four additional Intermediate School District (ISD) focus groups to discover practices and challenges related to graduation, dropout, transition and youth. With assistance from National Secondary Transition Technical Assistance Center (NSTTAC), this data has begun to guide future transition activities throughout the state.
2. A set of Transition “Fast Facts” data reports that contained both educational data, including student outcomes, and county economic information were updated for each region in the state. “Fast Facts” data reports informed transition coordinators and administration about

APR – Part B Michigan
Part B State Annual Performance Report for FFY 2012 (2012-2013) Indicator 13 Page 149 (OMB NO: 1820-0624 / Expiration Date: 7/31/2015)
Timelines Activities Status local data that will assist in building capacity to
support transition-aged students. Additional employment and educational data was added in 2012.
3. Schools received data for Michigan Rehabilitation Services (MRS) interagency cash transfer agreements along with current case loads.
4. MI-TOP collaborated to update the interagency agreement with MRS and the Michigan Department of Education (MDE) and continues to align Individuals with Disabilities Education Act and vocational rehabilitation language at the local practice level. MI-TOP convened planned Transition Advisory Committee meetings that included partner grant initiatives (Reaching and Teaching Struggling Learners; Statewide Autism Resources and Training Project; and the Michigan Alliance for Families), Medicaid, Independent Living Councils, parents and other statewide organizations to guide improvement activities. Both of these activities strengthened positive outcomes for student transition and associated postsecondary outcomes. 5. MI-TOP provided PD and TA leadership training in transition service provision and documentation. The targeted audience was the 56 ISD transition coordinators. This included resource sharing and local collaborative agreements to increase services to students.
2011-2013 2. Provide sustained building level personnel development using available district/building level data to enhance transition IEP compliance and quality.
With assistance from NSTTAC, MI-TOP led four ISD focus groups to assess need for continued transition TA and PD. Based on these and other data, building level personnel development was provided statewide. Training methods included online webinars focusing on compliant transition elements in the IEP; updated online support/training materials within CIMS and online through the Michigan Virtual University/LearnPort; three statewide workshops for school teams focusing on employment outcomes; partnering with MRS and community agencies to provide transition-focused training

APR – Part B Michigan
Part B State Annual Performance Report for FFY 2012 (2012-2013) Indicator 13 Page 150 (OMB NO: 1820-0624 / Expiration Date: 7/31/2015)
Timelines Activities Status for both constituent groups.
2011-2013 3. Provide policy and data guidance to support a long-term, outcomes-based approach to student-centered planning.
MI-TOP partnership with Michigan Association of Administrators of Special Education (MAASE)52 resulted in five bi-monthly transition community-of-practice meetings. The Office of Special Education (OSE) and MI-TOP staff provided Indicator 13 and Indicator 14 training and special education transition policy training at the MAASE training workshops. MI-TOP also established an updated interagency agreement between MRS and the MDE to align IDEA and verification review efforts. This updated agreement has provided consistent guidance at the local level.
Timely Correction of FFY 2011 Findings of Noncompliance (corrected within one year from identification of the noncompliance): 1. Number of findings of noncompliance the state made during
FFY 2011 (the period from July 1, 2011 through June 30, 2012) 32
2. Number of FFY 2011 findings the state verified as timely corrected (corrected within one year from the date of notification to the local educational entity (LEA) of the finding)
32
3. Number of FFY 2011 findings not verified as corrected within one year [(1) minus (2) above] 0
FFY 2011 Findings of Noncompliance Not Timely Corrected (corrected more than one year from identification of the noncompliance and/or Not Corrected): 4. Number of FFY 2011 findings not timely corrected (same as the
number from (3) above) 0
5. Number of FFY 2011 findings the state has verified as corrected beyond the one-year timeline (“subsequent correction”) 0
6. Number of FFY 2011 findings not verified as corrected [(4) minus (5) above] 0
52 Michigan’s state affiliate of the National Council of Administrators of Special Education and the Council for Exceptional Children

APR – Part B Michigan
Part B State Annual Performance Report for FFY 2012 (2012-2013) Indicator 13 Page 151 (OMB NO: 1820-0624 / Expiration Date: 7/31/2015)
Correction of FFY 2010 Findings of Noncompliance (See Indicator 15)
Finding Indicator District Identifier
Nature of Noncompliance
Program-Specific Follow-Up Activities Related To The
Uncorrected Noncompliance 14 13 10 Secondary
Transition checklist was noncompliant.
Finding Issued: December 15, 2010 as a result of an OSE data review. Summary of Activities: The OSE required a CAP based on a root cause analysis and submission of progress reports. The data necessary for correction of this noncompliance, although discussed in community-of-practice webinars and conference calls, continued to be noncompliant. Increased state supervision was implemented and the state and ISD monitors provided additional TA. At the time of the FFY 2011 APR submission, the district had not yet corrected their finding of noncompliance. The OSE increased supervision and TA to the district. The district conducted transition training for their staff and continued to work closely with the MRS in the transition of secondary students. Additional data were submitted by the district and were verified by the OSE as compliant. Status: Verified as corrected by the ISD monitor and closed by the OSE on May 6, 2013.

APR – Part B Michigan
Part B State Annual Performance Report for FFY 2012 (2012-2013) Indicator 13 Page 152 (OMB NO: 1820-0624 / Expiration Date: 7/31/2015)
Revisions, with Justification, to Proposed Targets / Improvement Activities / Timelines / Resources for FFY 2011
Timelines Activities Justification
PROVIDE TECHNICAL ASSISTANCE 2011-2014 Revision of Activity #2: Provide professional
development to ISD transition coordinators to enhance transition IEP compliance and quality.
The emphasis for professional development for this indicator has changed from the building-level to the ISD level.
Michigan Part B FFY 2011 State Performance Plan (SPP)/APR Response Table from OSEP
Indicator Status OSEP Analysis and Next Steps
Michigan Response
FFY 2010 Data
FFY 2011 Data
FFY 2011 Target
Correction of Findings of Noncompliance Identified in FFY 2010
99.2% 98.6% 100% The State reported that 34 of 37 findings of noncompliance identified in FFY 2010 were corrected in a timely manner and that the three remaining findings were subsequently corrected by May 6, 2013.
Because the State reported less than 100% compliance for FFY 2011, the State must report on the status of correction of noncompliance identified in FFY 2011 for this indicator. When reporting on the correction of noncompliance, the State must report, in its FFY 2012 APR, that it has verified that each LEA with noncompliance identified in FFY 2011 for this indicator: (1) is correctly implementing the specific regulatory requirements (i.e., achieved 100% compliance) based on a review of updated data such as data subsequently collected through on-site monitoring or a State
Thirty-two districts identified with noncompliance in FFY 2011 have corrected findings of noncompliance within one year of notification. The OSE verified that these 32 districts with noncompliance: (1) had corrected each individual case of noncompliance, unless the child was no longer within the jurisdiction of the district, consistent with OSEP Memo 09-02, dated October 17, 2008; and

APR – Part B Michigan
Part B State Annual Performance Report for FFY 2012 (2012-2013) Indicator 13 Page 153 (OMB NO: 1820-0624 / Expiration Date: 7/31/2015)
Indicator Status OSEP Analysis and Next Steps
Michigan Response
data system; and (2) has corrected each individual case of noncompliance, unless the child is no longer within the jurisdiction of the LEA, consistent with OSEP Memo 09-02. In the FFY 2012 APR, the State must describe the specific actions that were taken to verify the correction.
(2) is correctly implementing the specific regulatory requirements (i.e., achieved 100 percent compliance) based on a review of updated data subsequently collected through on-site monitoring and/or entered into the state data system.

APR – Part B Michigan
Part B State Annual Performance Report for FFY 2012 (2012-2013) Indicator 14 Page 154 (OMB NO: 1820-0624 / Expiration Date: 7/31/2015)
Part B State Annual Performance Report (APR) for FFY 2012 (2012-2013)
Overview of Indicator 14 (Postsecondary Outcomes) Report Development: 1. See General Overview pages 6-12. 2. The State Performance Plan (SPP) targets for Indicator 14 were developed in 2009
with input from state and local educational agencies, the state Special Education Advisory Committee53, the Michigan Rehabilitation Services (MRS), and related Mandated Activities Projects54 (MAPs).
3. Findings of noncompliance were reported, and corrective action plans (CAPs) were submitted and monitored through the Continuous Improvement and Monitoring System (CIMS) Workbook. For additional information pertaining to timely correction of noncompliance please refer to Appendix C.
Monitoring Priority: Effective General Supervision/Postsecondary Outcomes
(Results Indicator) Indicator 14: Percent of youth who are no longer in secondary school, had individualized education programs (IEPs) in effect at the time they left school, and were:
A. Enrolled in higher education within one year of leaving high school. B. Enrolled in higher education or competitively employed within one year of
leaving high school. C. Enrolled in higher education or in some other postsecondary education or
training program; or competitively employed or in some other employment within one year of leaving high school. (20 U.S.C. 1416(a)(3)(B)).
Measurement A. Percent enrolled in higher education = [(# of youth who are no longer in
secondary school, had IEPs in effect at the time they left school and were enrolled in higher education within one year of leaving high school) divided by the (# of respondent youth who are no longer in secondary school and had IEPs in effect at the time they left school)] times 100.
B. Percent enrolled in higher education or competitively employed = [(# of youth who are no longer in secondary school, had IEPs in effect at the time they left school and were enrolled in higher education or competitively employed within one year of leaving high school) divided by the (# of respondent youth who are no longer in secondary school and had IEPs in effect at the time they left school)] times 100.
C. Percent enrolled in higher education, or in some other postsecondary education or training program; or competitively employed or in some other employment within one year of leaving high school = [(# of youth who are no longer in secondary school, had IEPs in effect at the time they left school and were enrolled in higher education, or in some other postsecondary education or training program; or competitively employed or in some other employment.) divided by the (# of respondent youth who are no longer in secondary school and had IEPs in effect at the time they left school)] times 100.
53 Michigan’s IDEA mandated special education State Advisory Panel 54 Michigan’s state improvement and compliance initiatives, funded with Individuals with Disabilities Education Act administrative set-aside funds.

APR – Part B Michigan
Part B State Annual Performance Report for FFY 2012 (2012-2013) Indicator 14 Page 155 (OMB NO: 1820-0624 / Expiration Date: 7/31/2015)
Measurable and Rigorous Targets A. Percent enrolled in higher education
FFY Baseline Target Actual
2009 32.6% 32.6%
2010 >34.3% 31.7%
2011 >34.3% 33.3%
2012 >34.3% 38.3%*
Percent enrolled in higher education (340) = [(# of youth who are no longer in secondary school, had IEPs in effect at the time they left school and were enrolled in higher education within one year of leaving high school) divided by the (# of respondent youth who are no longer in secondary school and had IEPs in effect at the time they left school)] times 100.
*[305 ÷ 797] X 100 Source: National Post-School Outcomes Center Survey
Measurable and Rigorous Targets B. Percent enrolled in higher education or competitively employed
FFY Baseline Target Actual
2009 55.5% 55.5%
2010 >58.4% 53.0%
2011 >58.4% 61.0%
2012 >58.4% 62.2%*
Percent enrolled in higher education (340) or competitively employed (283) = [(# of youth who are no longer in secondary school, had IEPs in effect at the time they left school and were enrolled in higher education or competitively employed within one year of leaving high school) divided by the (# of respondent youth who are no longer in secondary school and had IEPs in effect at the time they left school)] times 100.
*[(305 + 191) ÷ 797] X 100 Source: National Post-School Outcomes Center Survey

APR – Part B Michigan
Part B State Annual Performance Report for FFY 2012 (2012-2013) Indicator 14 Page 156 (OMB NO: 1820-0624 / Expiration Date: 7/31/2015)
Measurable and Rigorous Targets C. Percent enrolled in higher education, or in some other postsecondary
education or training program; or competitively employed or in some other employment
FFY Baseline Target Actual
2009 68.0% 68.0%
2010 >71.4% 67.1%
2011 >71.4% 72.2%
2012 >71.4% 73.5%*
Percent enrolled in higher education (340), or in some other postsecondary education or training program (68); or competitively employed (283) or in some other employment (46) = [(# of youth who are no longer in secondary school, had IEPs in effect at the time they left school and were enrolled in higher education, or in some other postsecondary education or training program; or competitively employed or in some other employment within one year of leaving high school) divided by the (# of respondent youth who are no longer in secondary school and had IEPs in effect at the time they left school)] times 100.
*[(305 + 51 + 191 + 39) ÷ 797] X 100 Source: National Post-School Outcomes Center Survey Explanation of Progress or Slippage that occurred for FFY 2012: Michigan met its FFY 2012 targets for Indicator 14 for all three measurement categories. Several factors contributed to Michigan’s performance on Indicator 14: Michigan has experienced high unemployment rates in the past several years
but has recently seen marked improvement in the economy resulting in increased employment.
Michigan Transition Outcomes Project (MI-TOP) improvement efforts emphasized employment for students with an IEP; the alignment of MI-TOP efforts around Indicators 1 (Graduation), 2 (Dropout), 8 (Facilitated Parent Involvement), 13 (Secondary Transition) and 14 (Postsecondary Outcomes); and collaborative efforts with the MRS and other agencies all focused on student outcomes.
Improvement in outcome category C may be due to increased employment opportunities and supports, and changes in admission policies for non-diploma students.
Discussion of FFY 2012 Data: Displayed in Table 1 are the number of respondents within the four outcome categories for FFY 2011 and FFY 2012. There were increases in the percent of former students who were enrolled in higher education and in some other employment. There was a decrease in the percent of former students that were competitively employed or in some type of education or training program.

APR – Part B Michigan
Part B State Annual Performance Report for FFY 2012 (2012-2013) Indicator 14 Page 157 (OMB NO: 1820-0624 / Expiration Date: 7/31/2015)
Table 1: Number of Respondents by Data Outcome Category
FFY 2011 FFY 2012
Outcome Category Number Percent Number Percent
1 Enrolled in higher education within one year of leaving high school 340 33.3% 305 38.3%
2 Competitively employed within one year of leaving high school 283 27.7% 191 24.0%
3 Enrolled in some other postsecondary education or training program within one year of leaving high school
68 6.7% 51 6.4%
4 In some other employment within one year of leaving high school 46 4.5% 39 4.9%
Categories 1 through 4 - TOTAL 737 586
Leavers not captured by categories 1 through 4
284 211
TOTAL 1,021 797 Source: Modified National Post-School Outcomes Center Survey
Creation of Weights Based on Sample and Population Distribution: The National Post-School Outcomes Center’s Postsecondary Outcomes Survey (See Appendix E) was used to collect information from former students who had exited school (graduated, dropped out or received a certificate of completion) in the previous academic year. Using the Office of Special Education Programs (OSEP) approved sampling plan, a total of 4,318 surveys were mailed to Cohort 3: 609 surveys were undeliverable and 797 responses were received (21.5 percent response rate). A proportions test was used to identify representativeness of the respondent group, compared to the cohort population, on race/ethnicity, exit status and disability. Weights were calculated by dividing the proportion of each of the subgroups in the Indicator 14 population by the corresponding proportion in the sample. For example, in the Indicator 14 population the proportion of former students identified as White was .625. In the survey sample, the proportion of White former students was .676. Dividing .625 by .676 yields 0.925. Therefore, the weight assigned to White former students was 0.925. The proportion of African American/Black former students in the population was .310 but in the survey sample it was .275, making the weight 1.272. This computation was repeated for the remaining racial and ethnic groups as well as for exit status and disability.

APR – Part B Michigan
Part B State Annual Performance Report for FFY 2012 (2012-2013) Indicator 14 Page 158 (OMB NO: 1820-0624 / Expiration Date: 7/31/2015)
Presented in Table 2 are the results of the analyses, indicating that White former students were overrepresented in the respondent group, and African American/Black and Hispanic/Latino students were underrepresented. In terms of exit status, former students who graduated from high school with a diploma were overrepresented in the respondent group, while those former students who dropped out of high school were underrepresented. Former students with autism spectrum disorder were overrepresented while former students with emotional impairment and specific learning disability were underrepresented. Table 2:
Comparison of Cohort Population and Respondent Group
Demographic Characteristics Cohort Population Respondent Group Number Percent Number Percent
Race/Ethnicity
White * 2,699 62.5% 539 67.6%
African-American/Black* 1,339 31.0% 219 27.5%
Hispanic/Latino* 127 2.9% 13 1.6%
Asian 32 0.7% 10 1.3%
American Indian or Alaska Native 45 1.0% 7 0.9%
Native Hawaiian or Other Pacific-Islander 2 0.0% 0 0.0%
Two or More Races 74 1.7% 9 1.1%
Exit status
Dropped out* 588 13.6% 57 7.2%
Graduated* 3,413 79.0% 678 85.1%
Received certificate 317 7.3% 62 7.8%
Disability category
Autism Spectrum Disorder* 192 4.4% 60 7.5%
Cognitive Impairment 444 10.3% 88 11.0%
Emotional Impairment* 397 9.2% 56 7.0%
Hearing Impairment 84 1.9% 15 1.9%
Other Health Impairment 474 11.0% 100 12.5%
Physical Impairment 44 1.0% 12 1.5%
Severe Multiple Impairment 9 0.2% 1 0.1%
Specific Learning Disability* 2,533 58.7% 436 54.7%
Speech & Language Impairment 91 2.1% 16 2.0%

APR – Part B Michigan
Part B State Annual Performance Report for FFY 2012 (2012-2013) Indicator 14 Page 159 (OMB NO: 1820-0624 / Expiration Date: 7/31/2015)
Comparison of Cohort Population and Respondent Group
Demographic Characteristics Cohort Population Respondent Group Number Percent Number Percent
Traumatic Brain Injury 27 0.6% 6 0.8%
Visual Impairment 23 0.5% 7 0.9% Source: Modified National Post-School Outcomes Center Survey *Difference between cohort population and respondent group is statistically significant (p<.05).
The original results and weighted results are presented in Table 3 below. Differences between the respondent group and weighted respondent group for the race/ethnicity, exit status, and disability categories were found not to be statistically significant. This suggests that even though the respondent group is not representative in terms of students’ race/ethnicity, exit status, and disability, the results are not affected in a statistically significant manner. Therefore, the state is reporting unweighted exit status data for FFY 2012. Table 3:
Indicator 14 Results Before and After Weighting
Measurement Category
Unweighted Weighted by ethnicity
Weighted by exit status
Weighted by disability
n % n % n % n %
(N=797) (N=796) (N=795) (N=797)
A 305 38.3 296 37.1 291 36.6 301 37.8 B 496 62.2 488 61.4 482 60.6 495 62.1 C 586 73.5 579 72.7 571 71.8 584 73.3
Discussion of Improvement Activities Completed:
Timelines Activities Status
PROVIDE TECHNICAL ASSISTANCE
2011-2013
1. Use graduation, dropout, secondary transition and postsecondary outcomes data to develop and implement technical assistance and personnel development to increase graduation
Reference Improvement Activity details below.

APR – Part B Michigan
Part B State Annual Performance Report for FFY 2012 (2012-2013) Indicator 14 Page 160 (OMB NO: 1820-0624 / Expiration Date: 7/31/2015)
Timelines Activities Status
rates and decrease dropout rates.
Improvement Activity #1 Details: The MI-TOP is a collaborative leadership group that guides the improvement of transition compliance and practice throughout Michigan. MI-TOP is operating the fourth year of a consistent marketing/communication demand-based strategy that centers on a set of transition-focused contextual questions. These questions were used to focus four strategies on improving student success while in school and post-school. 1. MI-TOP conducted four additional Intermediate School District (ISD) focus groups to discover practices and challenges related to graduation, dropout, transition and youth. With assistance from the National Secondary Transition Technical Assistance Center (NSTTAC), this data has begun to guide future transition activities throughout the state. 2. A set of Transition “Fast Facts” data reports that contain both educational data, including student outcomes, and county economic information were updated for each region in the state. “Fast Facts” data reports informed transition coordinators and administrators about local data that will assist in building capacity to support transition-aged students. Additional employment and educational data were added in 2012. 3. MI-TOP collaborated to update the interagency agreement with the MRS and the Michigan Department of Education (MDE) and continued to align the Individuals with Disabilities Education Act and vocational rehabilitation language at the local practice level Planned and convened Transition Advisory committee meetings that included partner grant initiatives (Reaching and Teaching Struggling Learners, Statewide Autism Resources and Training Project, Alliance for Families), Medicaid, Independent Living Councils, parents and other statewide organizations to guide improvement activities. Both of these activities strengthened positive outcomes for student transition and associated postsecondary outcomes. 4. MI-TOP provided professional development and TA leadership training in transition service provision and documentation. This included resource sharing and local collaborative agreements to increase services to youth. 2011-2013
2. Provide sustained building level personnel development using available district/building level data to increase graduation rates and decrease dropout rates.
With assistance from NSTTAC, MI-TOP led four ISD focus groups to assess need for continued transition TA and professional development. Based on these and other data, building level personnel development was provided statewide. Training methods included online webinars focusing on compliant transition elements in the IEP; updated online support/training materials within CIMS and online Michigan Virtual University/LearnPort; three statewide workshops

APR – Part B Michigan
Part B State Annual Performance Report for FFY 2012 (2012-2013) Indicator 14 Page 161 (OMB NO: 1820-0624 / Expiration Date: 7/31/2015)
Timelines Activities Status
for school teams focusing on employment outcomes; partnering with the MRS and community agencies to provide transition-focused training for both constituent groups.
2011-2013 3. Provide policy and data guidance to support a long-term, outcomes-based approach to student-centered planning.
MI-TOP partnership with Michigan Association of Administrators of Special Education (MAASE)55 resulted in five bi-monthly transition community-of-practice meetings. The Office of Special Education (OSE) and the MI-TOP staff provided Indicator 13 and Indicator 14 training, and policy training at the MAASE training workshops. MI-TOP also established an updated interagency agreement between the MRS and the MDE to align IDEA and verification review efforts. This updated agreement has provided consistent guidance at the local level.
Revisions, with Justification, to Proposed Targets / Improvement Activities / Timelines / Resources for FFY 2012
Timelines Activities Resources
PROVIDE TECHNICAL ASSISTANCE 2011-2013 Deletion of Activity #1: Use graduation,
dropout, secondary transition and postsecondary outcomes data to develop and implement technical assistance and personnel development to increase graduation rates and decrease dropout rates.
Activity has been completed.
2011-2013 Deletion of Activity #2: Provide sustained building level personnel development using available district/building level data to increase graduation rates and decrease dropout rates.
Activity has been completed.
2013-2014 New Activity: Review existing data collection methodologies and explore alternate strategies to increase survey response rates.
The Transitions Mandated Activity Project and the OSE has prioritized the need to increase the response rate for the postsecondary survey.
Resources: Transition Coordination Grant, Michigan Transition Outcomes Project (MI-TOP) Core Team, Public Sector Consultants
55 Michigan’s state affiliate of the National Council of Administrators of Special Education and the Council for Exceptional Children.
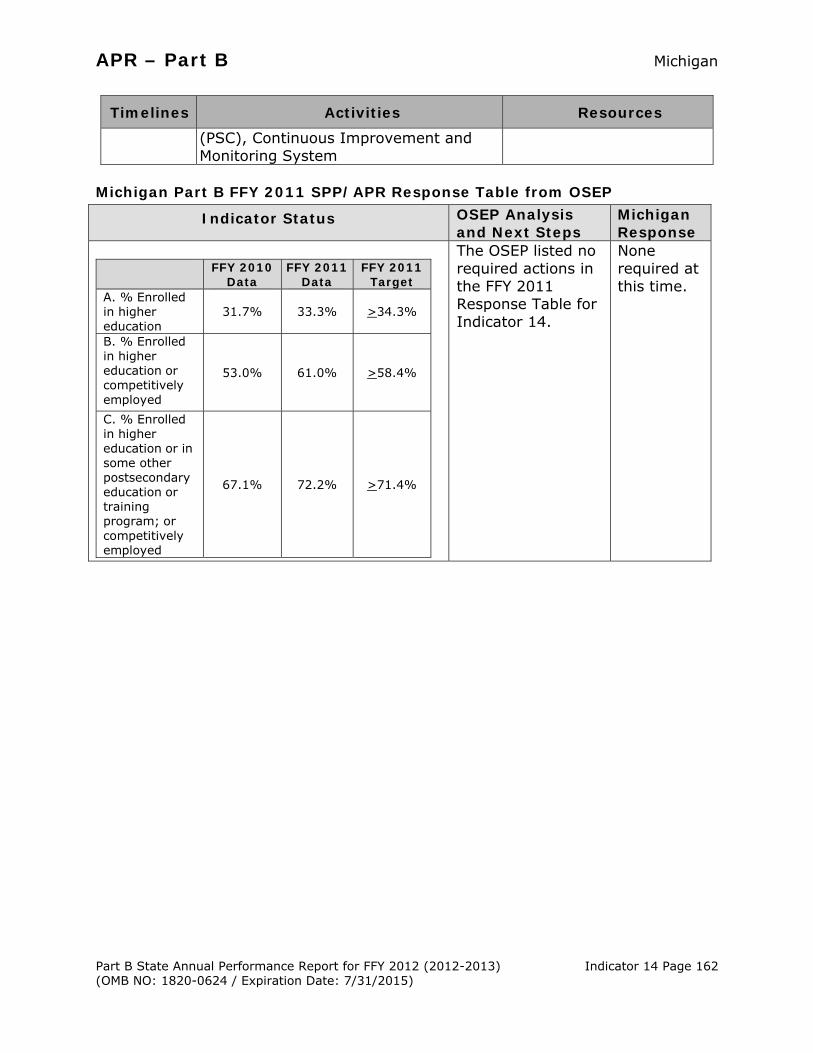
APR – Part B Michigan
Part B State Annual Performance Report for FFY 2012 (2012-2013) Indicator 14 Page 162 (OMB NO: 1820-0624 / Expiration Date: 7/31/2015)
Timelines Activities Resources
(PSC), Continuous Improvement and Monitoring System
Michigan Part B FFY 2011 SPP/APR Response Table from OSEP
Indicator Status OSEP Analysis and Next Steps
Michigan Response
FFY 2010
Data FFY 2011
Data FFY 2011
Target A. % Enrolled in higher education
31.7% 33.3% >34.3%
B. % Enrolled in higher education or competitively employed
53.0% 61.0% >58.4%
C. % Enrolled in higher education or in some other postsecondary education or training program; or competitively employed
67.1% 72.2% >71.4%
The OSEP listed no required actions in the FFY 2011 Response Table for Indicator 14.
None required at this time.


APR – Part B Michigan
Part B State Annual Performance Report for FFY 2012 (2012-2013) Indicator 15 Page 164 (OMB NO: 1820-0624 / Expiration Date: 7/31/2015)
Part B State Annual Performance Report (APR) for FFY 2012 (2012-2013)
Overview of Indicator 15 (Compliance Findings) Report Development: 1. See General Overview pages 6-12. 2. The Office of Special Education Programs (OSEP) notified Michigan in July of 2013
that it met the requirements of Part B of the IDEA. The Technical Assistance (TA) Sources and Michigan Actions sections that were submitted in the FFY 2011 are not included the FFY 2012 APR.
3. For this indicator, the Office of Special Education (OSE) reviewed all findings of noncompliance issued during FFY 2011 through the Michigan’s monitoring, state complaint, and due process hearing systems.
Monitoring Priority: General Supervision/Compliance Findings
(Compliance Indicator)
Indicator 15: General supervision system (including monitoring, complaints, hearings, etc.) identifies and corrects noncompliance as soon as possible but in no case later than one year from identification. (20 U.S.C. 1416 (a)(3)(B))
Measurement:
Percent of noncompliance corrected within one year of identification:
a. # of findings of noncompliance b. # of corrections completed as soon as possible but in no case later than one
year from identification.
Percent = [(b) divided by (a)] times 100.
States are required to use the “Indicator 15 Worksheet” to report data for this indicator.

APR – Part B Michigan
Part B State Annual Performance Report for FFY 2012 (2012-2013) Indicator 15 Page 165 (OMB NO: 1820-0624 / Expiration Date: 7/31/2015)
Measurable and Rigorous Targets
FFY Baseline Target Actual
2004 100%
2005 100% 100%
2006 100% 90.2%
2007 100% 94.8%
2008 100% 98.8%
2009 100% 93.0%
2010 100% 88.0%
2011 100% 96.6%
2012 100% 97.2%* Percent = [(# of corrections completed as soon as possible but in no case later than one year from identification) divided by (# of findings of noncompliance)] times 100.
*[379 ÷ 390] X 100
Source: Michigan Hearings Database, Michigan Due Process Database, Continuous Improvement and Monitoring System (CIMS), and required data from other State Performance Plan (SPP) indicators as referenced in the Indicator B-15 Worksheet
Explanation of Progress or Slippage that occurred for FFY 2012: Michigan did not meet its FFY 2012 target of 100 percent for Indicator 15. Michigan’s timely correction of noncompliance increased from 96.6 percent to 97.2 percent. Michigan continues to improve its system to require correction of noncompliance as soon as possible, but in no case later than one year, including verification. Training and technical assistance for the locals included periodically updating the Continuous Improvement and Monitoring System (CIMS), face-to-face regional and statewide meetings, web based trainings, conference calls, electronic messaging and regional technical assistance providers.

APR – Part B Michigan
Part B State Annual Performance Report for FFY 2012 (2012-2013) Indicator 15 Page 166 (OMB NO: 1820-0624 / Expiration Date: 7/31/2015)
INDICATOR B-15 WORKSHEET
Indicator/Indicator Clusters
General Supervision
System Components
# of LEAs Issued Findings
in FFY 2011 (7/1/11 to 6/30/12)
(a) # of Findings of
noncompliance identified in
FFY 2011 (7/1/11 to 6/30/12)
(b) # of Findings of
noncompliance from (a) for
which correction was verified no later than one
year from identification
1. Percent of youth with an individualized education program (IEP) graduating from high school with a regular diploma. 2. Percent of youth with an IEP dropping out of high school. 14. Percent of youth who had IEPs, are no longer in secondary school and who have been competitively employed, enrolled in some type of postsecondary school, or both, within one year of leaving high school.
Monitoring Activities: Self-Assessment/ Local APR, Data Review, Desk Audit, On-Site Visits, or other
0 0 0
Dispute Resolution: Complaints, Hearings
0 0 0
3. Participation and performance of children with disabilities on statewide assessments. 7. Percent of preschool children with an IEP who demonstrated improved outcomes.
Monitoring Activities: Self-Assessment/ Local APR, Data Review, Desk Audit, On-Site Visits, or other
11 11 10
Dispute Resolution: Complaints, Hearings 0 0 0
4A. Percent of districts identified as having a significant discrepancy in the rates of suspensions and expulsions of children with disabilities for greater than 10 days in a school year 4B. Percent of districts
Monitoring Activities: Self-Assessment/ Local APR, Data Review, Desk Audit, On-Site Visits, or other
10 11 10
Dispute Resolution: Complaints, Hearings 0 0 0

APR – Part B Michigan
Part B State Annual Performance Report for FFY 2012 (2012-2013) Indicator 15 Page 167 (OMB NO: 1820-0624 / Expiration Date: 7/31/2015)
Indicator/Indicator Clusters
General Supervision
System Components
# of LEAs Issued Findings
in FFY 2011 (7/1/11 to 6/30/12)
(a) # of Findings of
noncompliance identified in
FFY 2011 (7/1/11 to 6/30/12)
(b) # of Findings of
noncompliance from (a) for
which correction was verified no later than one
year from identification
that have: (a) a significant discrepancy, by race or ethnicity, in the rate of suspensions and expulsions of greater than 10 days in a school year for children with IEPs; and (b) policies, procedures or practices that contribute to the significant discrepancy and do not comply with requirements relating to the development and implementation of IEPs, the use of positive behavioral interventions and supports, and procedural safeguards. 5. Percent of children with an IEP aged 6 through 21 – educational placements. 6. Percent of preschool children aged 3 through 5 – early childhood placement.
Monitoring Activities: Self-Assessment/ Local APR, Data Review, Desk Audit, On-Site Visits, or other
10 10 10
Dispute Resolution: Complaints, Hearings
3 3 3
8. Percent of parents with a child receiving special education services who report that schools facilitated parent involvement as a means of improving services and results for children with disabilities.
Monitoring Activities: Self-Assessment/ Local APR, Data Review, Desk Audit, On-Site Visits, or other
1 1 1
Dispute Resolution: Complaints, Hearings
0 0 0
9. Percent of districts with disproportionate representation of racial and ethnic groups in
Monitoring Activities: Self-Assessment/ Local APR, Data Review,
8 12 12

APR – Part B Michigan
Part B State Annual Performance Report for FFY 2012 (2012-2013) Indicator 15 Page 168 (OMB NO: 1820-0624 / Expiration Date: 7/31/2015)
Indicator/Indicator Clusters
General Supervision
System Components
# of LEAs Issued Findings
in FFY 2011 (7/1/11 to 6/30/12)
(a) # of Findings of
noncompliance identified in
FFY 2011 (7/1/11 to 6/30/12)
(b) # of Findings of
noncompliance from (a) for
which correction was verified no later than one
year from identification
special education that is the result of inappropriate identification. 10. Percent of districts with disproportionate representation of racial and ethnic groups in specific disability categories that is the result of inappropriate identification.
Desk Audit, On-Site Visits, or other Dispute Resolution: Complaints, Hearings
0 0 0
11. Percent of children who were evaluated within 60 days of receiving parental consent for initial evaluation or, if the state establishes a timeframe within which the evaluation must be conducted, within that timeframe.
Monitoring Activities: Self-Assessment/ Local APR, Data Review, Desk Audit, On-Site Visits, or other
59 59 58
Dispute Resolution: Complaints, Hearings 21 41 35
12. Percent of children referred by Part C prior to age 3, who are found eligible for Part B, and who have an IEP developed and implemented by their third birthdays.
Monitoring Activities: Self-Assessment/ Local APR, Data Review, Desk Audit, On-Site Visits, or other
28 28 28
Dispute Resolution: Complaints, Hearings
0 0 0
13. Percent of youth aged 16 and above with an IEP that includes coordinated, measurable, annual IEP goals and transition services that will reasonably enable student to meet the post-secondary goals.
Monitoring Activities: Self-Assessment/ Local APR, Data Review, Desk Audit, On-Site Visits, or other
32 32 32
Dispute Resolution: Complaints, Hearings
2 2 2
Other areas of noncompliance: Evaluation Process
Monitoring Activities: Self-Assessment/ Local APR, Data Review,
0 0 0

APR – Part B Michigan
Part B State Annual Performance Report for FFY 2012 (2012-2013) Indicator 15 Page 169 (OMB NO: 1820-0624 / Expiration Date: 7/31/2015)
Indicator/Indicator Clusters
General Supervision
System Components
# of LEAs Issued Findings
in FFY 2011 (7/1/11 to 6/30/12)
(a) # of Findings of
noncompliance identified in
FFY 2011 (7/1/11 to 6/30/12)
(b) # of Findings of
noncompliance from (a) for
which correction was verified no later than one
year from identification
Desk Audit, On-Site Visits, or other Dispute Resolution: Complaints, Hearings
7 10 10
Other areas of noncompliance: Independent Educational Evaluation
Monitoring Activities: Self-Assessment/ Local APR, Data Review, Desk Audit, On-Site Visits, or other
0 0 0
Dispute Resolution: Complaints, Hearings
4 4 4
Other areas of noncompliance: IEP Development
Monitoring Activities: Self-Assessment/ Local APR, Data Review, Desk Audit, On-Site Visits, or other
0 0 0
Dispute Resolution: Complaints, Hearings
25 42 40
Other areas of noncompliance: IEP Implementation
Monitoring Activities: Self-Assessment/ Local APR, Data Review, Desk Audit, On-Site Visits, or other
0 0 0
Dispute Resolution: Complaints, Hearings
32 81 81
Other areas of noncompliance: Notice Requirements
Monitoring Activities: Self-Assessment/ Local APR, Data Review, Desk Audit, On-Site Visits, or other
0 0 0
Dispute Resolution: Complaints, Hearings
10 16 16
Other areas of noncompliance: Confidentiality of Information
Monitoring Activities: Self-Assessment/ Local APR, Data Review,
0 0 0

APR – Part B Michigan
Part B State Annual Performance Report for FFY 2012 (2012-2013) Indicator 15 Page 170 (OMB NO: 1820-0624 / Expiration Date: 7/31/2015)
Indicator/Indicator Clusters
General Supervision
System Components
# of LEAs Issued Findings
in FFY 2011 (7/1/11 to 6/30/12)
(a) # of Findings of
noncompliance identified in
FFY 2011 (7/1/11 to 6/30/12)
(b) # of Findings of
noncompliance from (a) for
which correction was verified no later than one
year from identification
Desk Audit, On-Site Visits, or other
Dispute Resolution: Complaints, Hearings
7 8 8
Other areas of noncompliance: Discipline
Monitoring Activities: Self-Assessment/ Local APR, Data Review, Desk Audit, On-Site Visits, or other
0 0 0
Dispute Resolution: Complaints, Hearings
11 19 19
Sum the numbers down Column a and Column b 390 379
Percent of noncompliance corrected within one year of identification =
(column (b) sum divided by column (a) sum) times 100.
(b) / (a) X 100 = 97.2%
Source: Michigan Hearings Database, Michigan State Complaint Database, monitoring data from the CIMS and required data from other SPP indicators as referenced in the Indicator B-15 Worksheet. Discussion of Improvement Activities Completed:
Timelines Activities Status
IMPROVE SYSTEMS ADMINISTRATION AND MONITORING
2011-2013 1. Analyze the factors affecting the lack of correction of noncompliance within one year and identify effective strategies, incentives and enforcement activities.
TA, forms and guidance were reviewed and revised, based on RAP team discussions facilitated by the TA provider, to assist districts in developing corrective action plans (CAPs) that were targeted and strategic in nature.
2011-2013 2. Enhance the electronic function of the CIMS that includes focused monitoring activities, TA activities
Michigan has expanded its application of the TA Notes tool in the CIMS Workbook to track correction of noncompliance. The state has implemented a broader monitoring strategy across the state, using CIMS for an

APR – Part B Michigan
Part B State Annual Performance Report for FFY 2012 (2012-2013) Indicator 15 Page 171 (OMB NO: 1820-0624 / Expiration Date: 7/31/2015)
Timelines Activities Status
and the tracking of noncompliance.
electronic record of associated focused monitoring activities, TA and the tracking of noncompliance.
Correction of FFY 2011 Noncompliance: Of the 390 findings issued during FFY 2011, 379 were corrected within one year. The FFY 2011 Correction of Noncompliance table below provides the current status for each of the 11 findings that the state verified as corrected beyond the one year timeline. There were no findings that remain uncorrected. Verification of correction occurs within one year of notification of the noncompliance and includes the two prongs as required by the OSEP. For Prong 1 (the district has corrected each individual case of noncompliance), verification activities included a review of new data by the OSE. For Prong 2 (the district is correctly implementing the specific regulatory requirements), verification activities included:
1. Review of updated policies, procedures and practices. 2. A review of evidence that professional development (PD) or TA was provided. 3. Interviews with district staff and other stakeholders. 4. Review of additional data or student records.
Timely Correction of FFY 2011 Findings of Noncompliance (corrected within one year from identification of the noncompliance): 1. Number of findings of noncompliance the state made during
FFY 2011 (the period from July 1, 2011, through June 30, 2012) 390
2. Number of FFY 2011 findings the state verified as timely corrected (corrected within one year from the date of notification to the local educational agency (LEA) of the finding)
379
3. Number of FFY 2011 findings not verified as corrected within one year [(1) minus (2)] 11
FFY 2011 Findings of Noncompliance Not Timely Corrected (corrected more than one year from identification of the noncompliance and/or Not Corrected): 4. Number of FFY 2011 findings not timely corrected (same as the
number from (3) above) 11
5. Number of FFY 2011 findings the state has verified as corrected beyond the one-year timeline (“subsequent correction”) 11
6. Number of FFY 2011 findings not verified as corrected [(4) minus (5)] 0

APR – Part B Michigan
Part B State Annual Performance Report for FFY 2012 (2012-2013) Indicator 15 Page 172 (OMB NO: 1820-0624 / Expiration Date: 7/31/2015)
FFY 2011 Correction of Noncompliance
Finding Indicator District Identifier
Nature of Noncompliance
Program-Specific Follow-Up Activities Related To
The Uncorrected Noncompliance
1 3 340 District did not provide the assessment accommodations as specified on IEPs or district did not administer the assessment as specified on IEPs.
Finding Issued: April 15, 2012, as a result of a focused monitoring activity (an OSE student record review). Summary of Activities: The OSE required a CAP based on a root cause analysis and submission of a progress report. As part of the correction of noncompliance activities the local provided specific training regarding identifying appropriate testing and testing accommodations along with writing IEPs appropriately for all special education personnel including building administrators. Additionally, a procedure for bimonthly reviews was established. Status: Verified as corrected and closed by the OSE on January 3, 2014
2 4A/4B 772 The district’s practices related to the suspension and expulsion of students with an IEP were not compliant with the Individuals with Disabilities Education Act regulations.
Finding Issued: April 15, 2012 as a result of a focused monitoring activity. Summary of Activities: The district revised the discipline manual and the forms to document compliance with the discipline process for students with an IEP. PD was provided to all administrators and special education staff. During the file review of students that had been suspended beyond 10 school
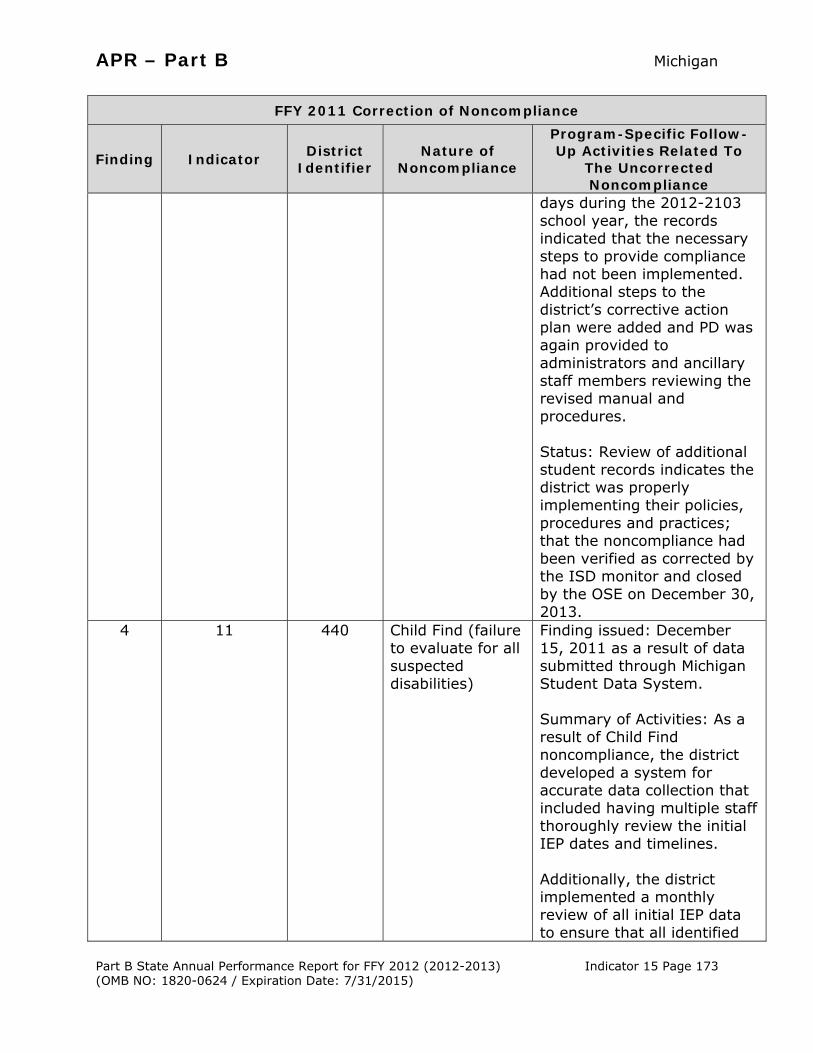
APR – Part B Michigan
Part B State Annual Performance Report for FFY 2012 (2012-2013) Indicator 15 Page 173 (OMB NO: 1820-0624 / Expiration Date: 7/31/2015)
FFY 2011 Correction of Noncompliance
Finding Indicator District Identifier
Nature of Noncompliance
Program-Specific Follow-Up Activities Related To
The Uncorrected Noncompliance
days during the 2012-2103 school year, the records indicated that the necessary steps to provide compliance had not been implemented. Additional steps to the district’s corrective action plan were added and PD was again provided to administrators and ancillary staff members reviewing the revised manual and procedures. Status: Review of additional student records indicates the district was properly implementing their policies, procedures and practices; that the noncompliance had been verified as corrected by the ISD monitor and closed by the OSE on December 30, 2013.
4 11 440 Child Find (failure to evaluate for all suspected disabilities)
Finding issued: December 15, 2011 as a result of data submitted through Michigan Student Data System. Summary of Activities: As a result of Child Find noncompliance, the district developed a system for accurate data collection that included having multiple staff thoroughly review the initial IEP dates and timelines. Additionally, the district implemented a monthly review of all initial IEP data to ensure that all identified

APR – Part B Michigan
Part B State Annual Performance Report for FFY 2012 (2012-2013) Indicator 15 Page 174 (OMB NO: 1820-0624 / Expiration Date: 7/31/2015)
FFY 2011 Correction of Noncompliance
Finding Indicator District Identifier
Nature of Noncompliance
Program-Specific Follow-Up Activities Related To
The Uncorrected Noncompliance
evaluations noted on the Review of Existing Evaluation Data (REED) document were conducted accordingly. The district provided Professional Development (PD) on three separate occasions for all administrators and staff. Procedure forms were developed that included an IEP checklist and a formal referral process. Additional one-on-one PD was provided regarding MSDS data to the secretary who is responsible for the inputting of data. Status: The finding was verified and closed by the OSE on September 18, 2013.
5, 6, 7, 8, 9
11 606
Failure to complete initial evaluation and convene IEP within timeline
Summary of Activities: Systemic complaint, involving many students and district wide policies and procedures. Extensive compensatory services ordered; took just over one year to provide services. District submitted Proof
of compliance on July 5, 2013 and OSE closed case.
237 Failure to evaluate for all suspected
Summary of Activities: Parent submitted subsequent due process complaints and

APR – Part B Michigan
Part B State Annual Performance Report for FFY 2012 (2012-2013) Indicator 15 Page 175 (OMB NO: 1820-0624 / Expiration Date: 7/31/2015)
FFY 2011 Correction of Noncompliance
Finding Indicator District Identifier
Nature of Noncompliance
Program-Specific Follow-Up Activities Related To
The Uncorrected Noncompliance
disabilities and inappropriate evaluation methods
state complaints relative to a previous complaint. Corrective Actions and compensatory services for all complaints were combined. Extensive compensatory services ordered; it took over one year to provide services. District submitted Proof
of Compliance on June 13, 2013 and OSE closed case.
10, 11
Other: IEP Development
606
Failure to complete initial evaluation and convene IEP within timeline
Summary of Activities: Systemic complaint, involving many students and district wide policies and procedures. Extensive compensatory services ordered; took just over one year to provide services. District submitted Proof
of compliance on July 5, 2013 and OSE closed case.
237 Failure to evaluate for all suspected disabilities and inappropriate evaluation methods
Summary of Activities: Parent submitted subsequent due process complaints and state complaints relative to a previous complaint. Corrective Actions and compensatory services for all complaints were combined. Extensive compensatory services ordered; it took over one year to provide services. District submitted Proof
of Compliance on June 13, 2013 and OSE

APR – Part B Michigan
Part B State Annual Performance Report for FFY 2012 (2012-2013) Indicator 15 Page 176 (OMB NO: 1820-0624 / Expiration Date: 7/31/2015)
FFY 2011 Correction of Noncompliance
Finding Indicator District Identifier
Nature of Noncompliance
Program-Specific Follow-Up Activities Related To
The Uncorrected Noncompliance
closed case.
Finding Indicator District Identifier
Nature of Noncompliance
Program-Specific Follow-Up Activities Related To The
Uncorrected Noncompliance 85 Other: FAPE52 49
Programs and services outlined in the IEP did not constitute Free Appropriate Public Education (FAPE).
Order of correction issued: February 2, 2009, following the adjudication of a due process hearing. The Administrative Law Judges (ALJ) decision was appealed to the federal district court. The student’s placement is on stay-put and the order cannot be implemented until the court renders its decision. The student was in private placement and did not return to the district until the beginning of the 2011-2012 school year. The federal district court rendered a decision that was partially appealed to the Sixth Circuit Court of Appeals. When the student returned to the district a new IEP was developed, and implemented. It incorporated many of the provisions in the ALJ order. The Sixth Circuit Court judge issued a decision in June 2012 upholding the ALJ decision. The district remains in noncompliance for not yet providing all of the 768 hours of compensatory services. The district began providing compensatory services during FFY 2011.

APR – Part B Michigan
Part B State Annual Performance Report for FFY 2012 (2012-2013) Indicator 15 Page 177 (OMB NO: 1820-0624 / Expiration Date: 7/31/2015)
FFY 2011 Correction of Noncompliance
Finding Indicator District Identifier
Nature of Noncompliance
Program-Specific Follow-Up Activities Related To
The Uncorrected Noncompliance
In FFY 2012 the district continued to provide compensatory services after school during the school year and additional hours in the summer.
Revisions, with Justification, to Proposed Targets / Improvement Activities / Timelines / Resources for FFY 2012 None required at this time. Michigan Part B FFY 2011 SPP/APR Response Table from OSEP
Indicator Status OSEP Analysis and
Next Steps
The State was identified as being in need of assistance for two consecutive years based on the State’s FFY 2009 and FFY 2010 APRs, was advised of available technical assistance, and was required to report, with the FFY 2011 APR, on: (1) the technical assistance sources from which the State received assistance; and (2) the actions the State took as a result of that technical assistance. The State reported on the technical assistance sources from which the State received assistance for this indicator and reported on the actions the State took as a result of that technical assistance.
FFY 2010 Data
FFY 2011 Data
FFY 2011
Target
Correction of Findings of Noncompliance Identified
In FFY 2010 88% 96.6% 100% The State reported that 484
of 501 findings of noncompliance identified in FFY 2010 were corrected in a timely manner and that the 17 remaining findings were subsequently corrected by May 14, 2013.
When reporting in the FFY 2012 APR on the correction of findings of noncompliance, the State must report that it verified that each LEA with findings of noncompliance identified in FFY 2011: (1) is correctly implementing the specific regulatory requirements (i.e., achieved 100% compliance) based on a review of updated data such as data subsequently collected through on-site monitoring or a State data system; and (2) has corrected each individual case of noncompliance, unless the child is no longer within the jurisdiction of the LEA, consistent with OSEP Memo 09-02. In the FFY 2012 APR, the State must describe the specific actions that were taken to verify the correction. In addition, in reporting on Indicator 15 in the FFY 2012 APR, the State must use and

APR – Part B Michigan
Part B State Annual Performance Report for FFY 2012 (2012-2013) Indicator 15 Page 178 (OMB NO: 1820-0624 / Expiration Date: 7/31/2015)
Indicator Status OSEP Analysis and
Next Steps submit the Indicator 15 Worksheet. In responding to Indicators 4B, 9, 10, 11, 12, and 13 in the FFY 2012 APR, the State must report on correction of the noncompliance described in this table under those indicators.
Michigan Response: Michigan provided increased TA and supervision to the districts that had uncorrected noncompliance beyond one year. The OSE has verified that each LEA with findings of noncompliance identified in FFY 2011: (1) is correctly implementing the specific regulatory requirements (i.e., achieved 100% compliance) based on a review of updated data such as data subsequently collected through on-site monitoring or the State data system; and (2) has corrected each individual case of noncompliance, unless the child is no longer within the jurisdiction of the LEA, consistent with OSEP Memo 09-02. All eleven findings from FFY 2011 have been verified and closed by the OSE. Additional details are available in the respective indicator section.


APR – Part B Michigan
Part B State Annual Performance Report for FFY 2012 (2012-2013) Indicator 18 Page 180 (OMB NO: 1820-0624 / Expiration Date: 7/31/2015)
Part B State Annual Performance Report (APR) for FFY 2012 (2012-2013)
Overview of Indicator 18 (Resolution Session Agreements) Report Development: 1. See General Overview pages 6-12. 2. During FFY 2012, 58 percent of the due process complaints completed by
June 30, 2013 were resolved through mediation or other informal resolution processes.
3. During FFY 2012, timely district reporting of resolution session data increased by more than 19 percent. The Office of Special Education (OSE) attributes this increase to reporting procedures that were implemented at the end of FFY 2011.
4. The data reported in Indicator 18 for FFY 2012 contains information that was not available at the time the Part B 618 data was submitted.
Monitoring Priority: Effective General Supervision/Resolution Session Agreements (Results Indicator)
Indicator 18: Percent of hearing requests that went to resolution sessions that were resolved through resolution session settlement agreements. (20 U.S.C. 1416(a)(3(B))
Measurement: Percent = (3.1(a) divided by 3.1) times 100.
Measurable and Rigorous Targets
FFY Baseline Target Actual
2005 36.4%
2006 >36.0% 45.3%
2007 >37.0% 64.3%
2008 >38.0% 46.6%
2009 >40.0% 46.3%
2010 >42.0% 64.7%
2011 >42.0% 60.3%
2012 >42.0% 54.0%* Percent = (3.1(a) divided by 3.1) times 100.56
*(27 ÷ 50) X 100 Source: Michigan Hearings Database
56 See the Analysis of Hearing Request Data for FFY 2010 – FFY 2011 table on the next page.

APR – Part B Michigan
Part B State Annual Performance Report for FFY 2012 (2012-2013) Indicator 18 Page 181 (OMB NO: 1820-0624 / Expiration Date: 7/31/2015)
Explanation of Progress or Slippage that occurred for FFY 2012: Michigan met its FFY 2012 target of 42 percent for Indicator 18. During FFY 2012, 50 resolution sessions were conducted, of which 27 (54 percent) resulted in resolution session settlement agreements. Eighty-six due process complaints were filed in FFY 2012. Thirty-four complaints did not require a resolution session because:
The parties waived the resolution session. The parties attempted to resolve the complaint through mediation. The district was the complainant. The complaint was withdrawn by the complainant. The complaint was dismissed by the administrative law judge before the
resolution period elapsed.
The percentage of resolution sessions conducted and settlement agreements reached declined from FFY 2011. However, the percentage of due process complaints that went to mediation or were resolved by other informal methods and withdrawn increased. The percentage of due process complaints that were resolved without a hearing was consistent with prior years.
Analysis of Hearing Request Data for FFY 2012
FFY 2011 FFY 2012
(3) Total Hearing requests57 77 86 (3.1) Resolution sessions (Percent of total hearing requests)
58 (75.3%)
50 (58.1%)
(a) Number of resolution session settlement agreements
(Percent of resolution sessions)
35 (60.3%)
27 (54.0%)
Source: Michigan Hearings Database Discussion of Improvement Activities Completed
Timelines Activities Status
PROVIDE TRAINING/PROFESSIONAL DEVELOPMENT
2011-2013 1. Provide ongoing training of all stakeholders regarding new rules and procedures relative to the single-tier complaint system.
Technical assistance regarding resolution sessions was developed and disseminated. Parents and districts were provided additional information and reminders of resolution session requirements through the special education information telephone line, information packets and
57 Parents now file a “due process complaint” per Individuals with Disabilities Education Act language, which is synonymous with Hearing Requests as referenced in this indicator.

APR – Part B Michigan
Part B State Annual Performance Report for FFY 2012 (2012-2013) Indicator 18 Page 182 (OMB NO: 1820-0624 / Expiration Date: 7/31/2015)
Timelines Activities Status
presentations.
IMPROVE DATA COLLECTION 2011-2013 2. Develop and implement a
database to integrate information across due process, monitoring, mediation and state complaint data sets.
The new database system was completed. The test model and training were conducted in February through June, 2013. The new database system was fully implemented as of July 1, 2013.
IMPROVE SYSTEMS ADMINISTRATION AND MONITORING 2011-2013 3. Review biannually and
change, as needed, due process complaint rules and procedures.
Guidance documents and informational materials regarding resolution sessions were developed and publically disseminated during FFY 2012. In addition, resolution session requirements and reporting requirements are in the process of being added to the Michigan Administrative Rules for Special Education.
Revisions, with Justification, to Proposed Targets / Improvement Activities / Timelines / Resources for FFY 2012
Timelines New and Revised Activities Justification
PROVIDE TRAINING/PROFESSIONAL DEVELOPMENT
2011-2014 Revision of Activity #1: Provide ongoing training of all stakeholders regarding new rules and procedures relative to resolution session requirements.
The Improvement Activity was changed to be more specific to resolution session agreements.
2011-2013 Deletion of Activity #2: Develop and implement a database to integrate information across due process, monitoring, mediation and state complaint data sets.
Database development and implementation was completed.

APR – Part B Michigan
Part B State Annual Performance Report for FFY 2012 (2012-2013) Indicator 18 Page 183 (OMB NO: 1820-0624 / Expiration Date: 7/31/2015)
Michigan Part B FFY 2011 State Performance Plan (SPP)/APR Response Table from the Office of Special Education Programs (OSEP)
Indicator Status OSEP Analysis and Next Steps
Michigan Response
FFY 2010 Data
FFY 2011 Data
FFY 2011 Target
64.7% 60.3% >42.0%
The OSEP listed no required actions in the FFY 2011 Response Table for Indicator 18.
None required at this time.

APR – Part B Michigan
Part B State Annual Performance Report for FFY 2012 (2012-2013) Indicator 19 Page 184 (OMB NO: 1820-0624 / Expiration Date: 7/31/2015)
Part B State Annual Performance Report (APR) for FFY 2012 (2012-2013)
Overview of Indicator 19 (Mediation Agreements) Report Development: 1. See General Overview pages 6-12. 2. During FFY 2012 the Office of Special Education (OSE), the Michigan Special
Education Mediation Program (MSEMP) and the Special Education Advisory Committee analyzed multiple years of mediation data along with target values reported by other states and decided to change the Michigan target from a single value of 80 percent to a range of 75-85 percent.
3. The improvement activities continue to focus on increasing the use of mediation throughout the state in order to help parents and educators resolve conflicts relative to special education programs/services collaboratively.
Monitoring Priority: Effective General Supervision / Mediation Agreements
(Results Indicator)
Indicator 19: Percent of mediations held that resulted in mediation agreements. (20 U.S.C. 1416(a)(3)(B))
Measurement: Percent = [(2.1(a)(i) + 2.1(b)(i)) divided by 2.1] times 100.
Measurable and Rigorous Targets
FFY Baseline Target Actual
2004 72.7%
2005 >74.0% 87.7%
2006 >75.0% 80.4%
2007 >76.0% 80.4%
2008 >77.0% 78.8%
2009 >78.5% 84.5%
2010 >80.0% 77.4%
2011 >80.0% 79.0%
2012 >80.0% 78.0%*
Percent = [(2.1(a)(i) + 2.1(b)(i)) divided by 2.1] times 100.
*[(8 + 56) ÷ 82] X 100 Source: Michigan Mediation Database

APR – Part B Michigan
Part B State Annual Performance Report for FFY 2012 (2012-2013) Indicator 19 Page 185 (OMB NO: 1820-0624 / Expiration Date: 7/31/2015)
Explanation of Progress or Slippage that occurred for FFY 2012: Michigan did not meet its FFY 2012 target of 80 percent for Indicator 19. The percent agreement rate reported slipped one percentage point below the FFY 2011 agreement rate. The agreement rate fell below the target rate in the final month of the year. During the final two months of the year, 18 cases were mediated, all by experienced mediators; 10 reached agreement. All parents and school personnel who completed a post-mediation evaluation in the cases that did not reach agreement indicated they were satisfied with the mediation process and would use it again. The OSE and its mediation program are planning improvements to mediator training to specifically focus on pre-mediation strategies for encouraging agreement, how to break an impasse and understanding common issues in special education mediation. Mediation requests for FFY 2012 totaled 151. The number of mediations conducted was 82 and referenced in Table 1. Sixty-four cases reached agreement. In order to provide a continuum of alternative dispute resolution services in FFY 2012, Michigan facilitated 97 individualized education program (IEP) team meetings and two due process resolution sessions. Table 1: Analysis of Mediation Data for FFY 2011 – FFY 2012 FFY 2011 FFY 2012
(2.1) Mediations held 100 82 (a)(i) Mediations agreements related to due process complaints that resulted in complete agreement (Percent of mediations held)
10
(10.0%)
8
(9.8%)
(b)(i) Mediations agreements not related to due process complaints that resulted in complete agreement (Percent of mediations held)
69
(69.0%)
56
(68.3%)
(2.1)(a)(i) + (2.1)(b)(i) (Percent of mediations held)
79 (79.0%)
64 (78.0%)
Source: Michigan Mediation Database Discussion of Improvement Activities Completed:
Timelines Activities Status
PROGRAM DEVELOPMENT
2011-2013 1. Improve mediator trainings to emphasize strategies and techniques for reaching agreements.
In FFY 2012, the MSEMP mediator training included staff from the OSE and the Michigan Alliance for Families who discussed the intersection between mediation and complaints and increased understanding of the IEP process. In FFY 2013, a focus group with mediators will be conducted to identify barriers to agreement and the training

APR – Part B Michigan
Part B State Annual Performance Report for FFY 2012 (2012-2013) Indicator 19 Page 186 (OMB NO: 1820-0624 / Expiration Date: 7/31/2015)
Timelines Activities Status
needed to address them. Training will also include analysis of common issues in dispute, development of pre-mediation strategies for reaching agreement, and skills in breaking an impasse.
2011-2013 2. Research and introduce strategies and collaborative problem-solving techniques for use in mediation.
In FFY 2012, the OSE and MSEMP reviewed pertinent literature and plans to include identified strategies for improved communication in future mediation sessions.
CLARIFY/EXAMINE/DEVELOP POLICIES AND PROCEDURES
2011-2013 3. Review biannually and change, as needed, dispute resolution rules and procedures.
During FFY 2012, the OSE further updated the state complaint procedures to incorporate more emphasis on problem solving including the use of mediation.
Revisions, with Justification, to Proposed Targets / Improvement Activities / Timelines / Resources for FFY 2012
Timelines New and Revised Activities Justification
PROVIDE TECHNICAL ASSISTANCE 2013-2014 New Activity:
Provide materials to potential participants (e.g., MSEMP and Dispute Resolution Centers’ website) to increase skill development and retention regarding the mediation and IEP facilitation processes utilizing multiple formats, e.g. webinars, short videos, print materials and new research on collaborative communication and dispute resolution. An evaluation plan will be developed and implemented to determine the impact of these additional learning supports.
The OSE plans to focus on pre-mediation strategies for encouraging agreement by providing mediation information to potential participants.
Resources: Office of Special Education (OSE) Program Accountability (PA) Unit, Michigan Alliance for Families, Consortium for Appropriate Dispute Resolution in Special Education (CADRE)

APR – Part B Michigan
Part B State Annual Performance Report for FFY 2012 (2012-2013) Indicator 19 Page 187 (OMB NO: 1820-0624 / Expiration Date: 7/31/2015)
Timelines New and Revised Activities Justification
Program Development
2011-2014 Revision of Activity #1: Increase the mediation agreement rate by reconfiguring training based on the redesign of the training curriculum that uses the following steps: Analyze issue trends in disputes Determine what parts of
IDEA/MARSE are necessary to trainees
Conduct focus groups with mediators to identify mediation challenges, obstacles to agreement and techniques for overcoming both
Survey best training practices in Michigan and from other states
Compile and analyze internal and external evaluation data and trends.
Michigan has not met its target in the last several years and plans to increase the mediation agreement rate by redesigning the training curriculum using the results of the analyses, Focus Groups, and surveys.
Michigan Part B FFY 2011 State Performance Plan (SPP)/APR Response Table from the Office of Special Education Programs (OSEP)
Indicator Status OSEP Analysis and Next Steps
Michigan Response
FFY 2010
Data FFY 2011
Data FFY 2011
Target
77.4% 79.0% > 80.0%
The OSEP listed no required actions in the FFY 2011 Response Table for Indicator 19.
None required at this time.

APR – Part B Updated 4-23-14 Michigan
Part B State Annual Performance Report for FFY 2012 (2012-2013) Indicator 20 Page 188 (OMB NO: 1820-0624 / Expiration Date: 7/31/2015)
Part B State Annual Performance Report (APR) for FFY 2012 (2012-2013) Overview of Indicator 20 (Timely and Accurate Data) Report Development:
1. See General Overview pages 6-12. 2. The Office of Special Education (OSE) Performance Reporting Unit, grantees
from Wayne State University (WSU) and Public Sector Consultants (PSC), and the Interagency Information Systems (IIS) staff reviewed data in the FFY 2011 APR, Section 618 data, and EDFacts data to measure the extent to which all reported data were complete and passed edit checks.
3. The OSE, WSU and PSC provided explanations of year-to-year changes requested by the Data Accountability Center on behalf of the Office of Special Education Programs (OSEP).
4. To meet reporting requirements, the OSE representatives participated in technical assistance (TA) calls and meetings conducted by the OSEP, the North Central Regional Resource Center, and the Council of Chief State School Officers/Education Information Management Advisory Consortium.
5. Findings of noncompliance were reported and corrective action plans (CAPs) were submitted and monitored through the Continuous Improvement and Monitoring System (CIMS) Workbook. For additional information pertaining to timely correction of noncompliance please refer to Appendix C.
Monitoring Priority: General Supervision/Timely and Accurate Data
(Compliance Indicator)
Indicator 20: State reported data (Section 618 and State Performance Plan (SPP) and APR) are timely and accurate. (20 U.S.C. 1416(a)(3)(B))
Measurement:
State reported data, including 618 data, SPP, and APR, are:
a. Submitted on or before due dates (first Wednesday in February for child count, including race and ethnicity and educational environments; first Wednesday in November for exiting, discipline, personnel and dispute resolution; December 15 for assessment; May 1 for Maintenance of Effort & Coordinated Early Intervening Services; and February 1 for Annual Performance Reports).
b. Accurate, including covering the correct year and following the correct measurement.

APR – Part B Updated 4-23-14 Michigan
Part B State Annual Performance Report for FFY 2012 (2012-2013) Indicator 20 Page 189 (OMB NO: 1820-0624 / Expiration Date: 7/31/2015)
Measurable and Rigorous Targets
100 percent of state reported data (618 Tables and SPP and APR) are timely and accurate.
FFY Baseline Target Actual
2005 (2005-2006) 90.0%
2006 (2006-2007) through
2008 (2008-2009) 100% 100%
2009 (2009-2010) 100% 92.86%
2010 (2010-2011) 100% 100%
2011 (2011-2012) 100% 98.72%*
2012 (2012-2013) 100% 95.55% Source: Michigan Due Process Database, Michigan Hearings Database, Michigan Mediation Database, Single Record Student Database, Michigan Student Data System (MSDS), Registry of Educational Personnel, Michigan Educational Assessment System, the OSE Financial Databases. *Per OSEP’s FFY 2011 Part B SPP/APR Response Table
Explanation of Progress or Slippage that occurred in FFY 2012: Michigan did not meet its FFY 2011 target of 100 percent for Indicator 20 for timely and accurate data. Per the OSEP’s 618 Data - Indicator 20 rubric, Michigan did not have complete data for Table 2 - Personnel and Table 4 - Exiting. Data Michigan continued to employ data verification protocols for Indicators 4A (Suspension/Expulsion), 4B (Suspension/Expulsion by Race/Ethnicity) and 11 (Child Find) within the Michigan Student Data System (MSDS). Districts that reported discipline or initial individualized education program (IEP) data for less than 1 percent or greater than 25 percent of their total number of students with an IEP were asked to verify their data and make corrections prior to certification. For other indicators, data verification was completed by the OSE staff, grantees and other state offices. Data anomalies were further investigated and resolved. The Data Advisory Committee (DAC) is comprised of district and state agency personnel who have knowledge and experience in performing and improving data collections, verifications and reporting. The committee provides a forum for the OSE to gain input from district personnel on data initiatives. This collaboration continues to improve data accuracy and completeness. This group meets quarterly, at a minimum, each year.

APR – Part B Updated 4-23-14 Michigan
Part B State Annual Performance Report for FFY 2012 (2012-2013) Indicator 20 Page 190 (OMB NO: 1820-0624 / Expiration Date: 7/31/2015)
The DAC continued to advise the OSE regarding strategic special education:
a. Data collection—Optimize the ease, accuracy and timeliness of data collected from districts and state agencies, and reduce data burden on all parties.
b. Data verification—Confirm that data collected from districts and state agencies reflect actual practice/performance and, as needed, amend data and adjust protocols to avoid continuing error patterns.
c. Data reporting—Complete the required United States Department of Education reporting, as well as district-level determinations and public reports, in a timely/accurate manner following established protocols.
d. Data analysis and use—Enhance the capacity for the use of data by educators to inform decisions about services for students with an IEP that lead to positive outcomes.
e. Data TA—Provide key resources in multiple formats to a broad range of stakeholders to help them meet their data-related obligations and understand/use effectively the data they receive from the state.

APR – Part B Updated 4-23-14 Michigan
Part B State Annual Performance Report for FFY 2012 (2012-2013) Indicator 20 Page 191 (OMB NO: 1820-0624 / Expiration Date: 7/31/2015)
Actual FFY 2012 Data:
Part B Indicator 20 Data Rubric Part B Indicator 20 - SPP/APR Data
APR Indicator
Valid and reliable
Correct calculation
Total
1 1 1 2 1 1
3A 1 1 2 3B 1 1 2 3C 1 1 2 4A 1 1 2 4B 1 1 2 5 1 1 2 6 1 1 2 7 1 1 2 8 1 1 2 9 1 1 2
10 1 1 2 11 1 1 2 12 1 1 2 13 1 1 2 14 1 1 2 15 1 1 2 18 1 1 2 19 1 1 2
Subtotal 38 APR Score Calculation
Timely Submission Points - If the FFY 2012 APR was submitted on-time, place the number 5 in the cell on the right.
5
Grand Total – (Sum of the subtotal and Timely Submission Points) = 43.00

APR – Part B Updated 4-23-14 Michigan
Part B State Annual Performance Report for FFY 2012 (2012-2013) Indicator 20 Page 192 (OMB NO: 1820-0624 / Expiration Date: 7/31/2015)
Part B Indicator 20 - 618 Data Table Timely Complet
e Data Passed
Edit Check Responded
to Date Note Requests
Total
Table 1 – Child Count Due Date: 2/6/13 1 1 1 N/A 3
Table 2 – Personnel Due Date: 11/6/13 1 0 1
N/A 2
Table 3 – Ed. Environments Due Date: 2/6/13
1 1 1 1 4
Table 4 – Exiting Due Date: 11/6/13 1 0 1
N/A 2
Table 5 – Discipline Due Date: 11/6/13 1 1 1
N/A 3
Table 6 – State Assessment Due Date: 12/19/13
1 NA
NA
N/A
1
Table 7 – Dispute Resolution Due Date: 11/6/13
1 1 1 N/A 3
Table 8 0 MOE/CEIS Due Date: 5/1/13 1 1 N/A N/A 2
Subtotal 20 618 Score Calculation Grand Total
(Subtotal X 1.8695)= 37.39
Indicator #20 Calculation A. APR Grand Total 43.00 B. 618 Grand Total 37.39 C. APR Grand Total (A) + 618 Grand Total (B) = 80.39
Total N/A in APR Total N/A in 618
0 1.8695
Base 84.13 D. Subtotal (C divided by Base*) = 0.956 E. Indicator Score (Subtotal D x 100) = 95.55
* Note any cell marked as N/A will decrease the denominator by 1 for APR and 1.8695 for 618

APR – Part B Updated 4-23-14 Michigan
Part B State Annual Performance Report for FFY 2012 (2012-2013) Indicator 20 Page 193 (OMB NO: 1820-0624 / Expiration Date: 7/31/2015)
Discussion of Improvement Activities Completed:
Timelines Activities Status
IMPROVE SYSTEMS ADMINISTRATION AND MONITORING
2011-2013
1. Follow and enforce submission deadlines.
The OSE enforced reporting deadlines through district determinations and by informing all districts in memoranda and at conferences/organization meetings that districts not meeting reporting deadlines would be subject to sanctions.
2011-2013
2. Continue to distribute widely, teach about and use the MI School Data portal and District Data Portraits to help districts understand/ improve their data.
In FFY 2011, the Data Portraits that provide district level performance on the indicators continued to be: Used by districts to assess and improve
data quality. Used by state and intermediate school
district monitors as a data source for focused monitoring activities.
Used by the CIMS local review and analysis process teams for developing improvement activities.
In FFY 2012, the Michigan Compliance and Information System (MI-CIS), which produced the Data Portraits, was decommissioned. Beginning October 1, 2012, districts accessed local reports using the MSDS and the MI School Data portal at www.mischooldata.org.
CLARIFY/EXAMINE/DEVELOP POLICIES AND PROCEDURES 2011-2013
3. Implement internal processes and revise business rules to ensure timely and accurate data reporting.
To ensure timely reporting of all Section 618 data, SPP and APR data, the OSE reviewed and, when necessary, updated business rules and procedures. The business rules specify data collection timelines, aggregation and analysis procedures, who will perform the analyses and when the data reports will be completed.
PROVIDE TECHNICAL ASSISTANCE 2011-2013 4. Continue
providing TA to districts’ data personnel to improve accuracy and timeliness of reporting.
MDE staff performed quality checks of submitted data to identify common data reporting errors, and then provided TA to target common data reporting errors and provided guidance on how to correctly report problematic data elements.

APR – Part B Updated 4-23-14 Michigan
Part B State Annual Performance Report for FFY 2012 (2012-2013) Indicator 20 Page 194 (OMB NO: 1820-0624 / Expiration Date: 7/31/2015)
Revisions, with Justification, to Proposed Targets / Improvement Activities / Timelines / Resources for FFY 2012 None required at this time. Michigan Part B FFY 2011 SPP/APR Response Table from OSEP
Indicator Status OSEP Analysis and Next Steps
Michigan Response
The State’s FFY 2011 data for this indicator are 100%. However, OSEP recalculated the data for this indicator to be 98.72%.
FFY 2010 Data
FFY 2011 Data
FFY 2011 Target
100% 95.65% 100%
The OSEP listed no required actions in the FFY 2011 Response Table for Indicator 20.
Michigan changed the FFY 2011 Actual performance value to reflect OSEP’s recalculation.


APR – Part B Updated 4-23-14 Michigan
Part B State Annual Performance Report for FFY 2012 (2012-2013) Acronyms Page 196 (OMB NO: 1820-0624 / Expiration Date: 7/31/2015)
Acronyms Used in the APR
AA-MAS Alternate Assessments based on Modified Achievement Standards AIR American Institute for Research ALJ Administrative Law Judge APR Annual Performance Report ARR Alternate Risk Ratio ASD Autism Spectrum Disorders AMO Annual Measurable Objectives AYP Adequate Yearly Progress BAA Bureau of Assessment and Accountability BOQ Benchmarks of Quality CADRE Consortium for Appropriate Dispute Resolution in Special Education CAP Corrective Action Plan CCRESA Clinton County Regional Education Service Area CEN Center for Educational Networking CEPI Center for Educational Performance and Information CIMS Continuous Improvement and Monitoring System CSPR Consolidated State Performance Report DAC Data Accountability Center DIBELS Dynamic Indicators of Basic Early Literacy Skills ECE&FS Early Childhood Education & Family Services ECO Early Childhood Outcomes ECSE Early Childhood Special Education EAA Education Achievement Authority EIMAC Education Information Management Advisory Consortium ELPA English Language Proficiency Assessment ESA Educational Service Agencies ESEA Elementary and Secondary Education Act FAPE Free Appropriate Public Education FFY Federal Fiscal Year GSRP Great Start Readiness Program IDEA Individuals with Disabilities Education Act IEP Individualized Education Program IES Institute for Education Sciences IIS Interagency Information Systems ISD Intermediate School District LEA Local Educational Agency LICC Local Interagency Coordinating Councils LRE Least Restrictive Environment MAASE Michigan Association of Administrators of Special Education MAF Michigan Alliance for Families MAR Monitoring Activities Report MARSE Michigan Administrative Rules for Special Education MAP Mandated Activities Project MDE Michigan Department of Education MDE-LIO Michigan Department of Education, Low Incidence Outreach MEAP Michigan Educational Assessment Program

APR – Part B Updated 4-23-14 Michigan
Part B State Annual Performance Report for FFY 2012 (2012-2013) Acronyms Page 197 (OMB NO: 1820-0624 / Expiration Date: 7/31/2015)
MI2 Michigan's Integrated Mathematics Initiative MiBLSi Michigan’s Integrated Behavior and Learning Support Initiative MICC Michigan Interagency Coordinating Council MI-CIS Michigan Compliance Information System MI-TOP Michigan Transition Outcomes Project MITS Michigan's Integrated Technology Supports MMC Michigan Merit Curriculum MME Michigan Merit Examination MRS Michigan Rehabilitation Services MSDS Michigan Student Data System MSEMP Michigan Special Education Mediation Program MTAT Monitoring and Technical Assistance Team MTSS Multi-tiered System of Support NASDSE National Association of State Directors of Special Education NCRRC North Central Regional Resource Center NCSEAM National Center for Special Education Accountability Monitoring NDPC-SD National Dropout Prevention Center for Students with Disabilities NECTAC National Early Childhood Technical Assistance Center NICHCY National Dissemination Center for Children with Disabilities NPSO National Post-School Outcomes Center NSTTAC National Secondary Transition Technical Assistance Center ODR Office Discipline Referrals OGS Office of Great Start OSE Office of Special Education OSEP Office of Special Education Programs PA Program Accountability PACs Parent Advisory Committees PD Professional Development Part B Part B of IDEA Part C Part C of IDEA PBIS Positive Behavioral Interventions and Supports PR Performance Reporting PSA Public School Academy (aka Charter School) PSC Public Sector Consultants PTI Parent Training and Information Center RAP Review and Analysis Process REED Review of Existing Evaluation Data RR Risk Ratio RTSL Reaching and Teaching Struggling Learners SEAC Special Education Advisory Committee, Part B State Advisory Panel SPP State Performance Plan SRSD Single Record Student Database START Statewide Autism Resources and Training TA Technical Assistance USED United States Department of Education WRR Weighted Risk Ratio WSU Wayne State University

APR – Part B Michigan
Part B State Annual Performance Report for FFY 2012 (2012-2013) Appendix A Page 198 (OMB NO: 1820-0624 / Expiration Date: 7/31/2015)
FFY 2012 Annual Performance Report
Appendix A:
Students with an Individualized Education Program
Fall 2012 Special Education Child Count
Ages Birth to 26

APR – Part B Michigan
Part B State Annual Performance Report for FFY 2012 (2012-2013) Appendix A Page 199 (OMB NO: 1820-0624 / Expiration Date: 7/31/2015)
Number of Michigan Students with an IEP Primary Disability Categories
Birth to Age 26 (2012-2013 School Year)
Michigan Disability Categories Number Percent
Autism Spectrum Disorder 16,729 7.9 Cognitive Impairment 20,751 9.8
Deaf-Blindness 21 <0.1 Early Childhood Developmental Delay 7,077 3.3
Emotional Impairment 12,579 6.0 Hearing Impairment 2,898 1.4
Other Health Impairment 22,130 10.5 Physical Impairment 2,475 1.2
Severe Multiple Impairment 3,912 1.9 Specific Learning Disability 68,642 32.5
Speech & Language Impairment 52,766 25.0 Traumatic Brain Injury 583 0.3
Visual Impairment 820 0.4 Total 211,383 100.0

APR – Part B Michigan
Part B State Annual Performance Report for FFY 2012 (2012-2013) Appendix A Page 200 (OMB NO: 1820-0624 / Expiration Date: 7/31/2015)
Number of Michigan Students with an IEP Race/Ethnicity by Gender
Birth to Age 26 (2012-2013 School Year)
Race/Ethnicity Female Male Total American Indian or Alaska Native 740 1,345 2,085
Asian 945 1,840 2,785 African American/Black 14,471 28,951 43,422
Native Hawaiian or Other Pacific Islander 70 111 181 White 48,509 95,740 144,249
Hispanic/Latino 4,685 8,693 13,378 Two or More Races 1,852 3431 5,283
Total 71,272 140,111 211,383
Number of Michigan Students with an IEP Age Group by Gender
Birth to Age 26 (2012-2013 School Year)
Age Group Female Male Total Birth-2 1,576 2,938 4,514
3-5 6,404 14,427 20,831 6-21 61,918 120,677 182,595 22-26 1,374 2,069 3,443 Total 71,272 140,111 211,383

APR – Part B Michigan
Part B State Annual Performance Report for FFY 2012 (2012-2013) Appendix A Page 201 (OMB NO: 1820-0624 / Expiration Date: 7/31/2015)
Number of Michigan Students with an IEP Primary Disability by Age Group
Birth to Age 26 (2012-2013 School Year)
Michigan Disability Categories Age Group
Total Birth-2 3-5 6-21 22-26
Autism Spectrum Disorder 55 1,307 14,756 611 16,729 Cognitive Impairment 10 386 18,446 1,909 20,751
Deaf-Blindness 1 2 14 4 21 Early Childhood Developmental Delay 1,525 3,867 1,685 0 7,077
Emotional Impairment 0 34 12,493 52 12,579 Hearing Impairment 137 309 2,436 16 2,898
Other Health Impairment 832 862 20,343 93 22,130 Physical Impairment 235 358 1,815 67 2,475
Severe Multiple Impairment 102 438 2,776 596 3,912 Specific Learning Disability 0 35 68,546 61 68,642
Speech & Language Impairment 1,562 13,122 38,078 4 52,766 Traumatic Brain Injury 11 19 526 27 583
Visual Impairment 44 92 681 3 820 Total 4,514 20,831 182,595 3,443 211,383

APR – Part B Michigan
Part B State Annual Performance Report for FFY 2012 (2012-2013) Appendix A Page 202 (OMB NO: 1820-0624 / Expiration Date: 7/31/2015)
Number of Michigan Students with an IEP Grade/Setting
Birth to Age 26 (2012-2013 School Year)
Grade/Setting Number Percent Kindergarten 11,274 5.3
First Grade 12,056 5.7
Second Grade 12,947 6.1
Third Grade 14,556 6.9
Fourth Grade 15,303 7.2
Fifth Grade 15,667 7.4
Sixth Grade 15,818 7.5
Seventh Grade 15,646 7.4
Eighth Grade 15,357 7.3
Ninth Grade 16,285 7.7
Tenth Grade 15,845 7.5
Eleventh Grade 13,572 6.4
Twelfth Grade 13,730 6.5
Secondary Transition 6,681 3.2
Adult Education 11 <0.1
Early Childhood 16,635 7.9
Total 211,383 100


APR – Part B Michigan
Part B State Annual Performance Report for FFY 2012 (2012-2013) Appendix B Page 204 (OMB NO: 1820-0624 / Expiration Date: 7/31/2015)
FFY 2012 Annual Performance Report
Appendix B:
Michigan’s Mandated Activities Projects

APR – Part B Michigan
Part B State Annual Performance Report for FFY 2012 (2012-2013) Appendix B Page 205 (OMB NO: 1820-0624 / Expiration Date: 7/31/2015)
Center for Educational Networking
The Center for Educational Networking (CEN) supports the statewide communication efforts of the Office of Special Education (OSE). CEN has emerged as the communications support system for the other Mandated Activities Projects (MAPs), allowing them to concentrate on the work of serving special education and diverse learners in Michigan. The CEN provides:
Communications strategy, support, and facilitation. Development of products such as FOCUS on Results, an electronic
newsletter that highlights the work of the MAPs. Coordination of document design, writing, editing, and dissemination of print
and digital products and services for the OSE and the MAPs as they communicate to the field, school districts, administrators, special education professionals, and parents.
Creation and maintenance of websites for several of the MAPs. Design, implementation, and management of the social networking strategy
for the OSE and the MAPs. Managing the OSE/MAPs events, including conference coordination.
For more information about the Center for Educational Networking, go to http://www.cenmi.org.
The Michigan Transition Outcomes Project
The Michigan Transition Outcomes Project (MI-TOP) facilitates the development of effective systems that support students to achieve positive postsecondary outcomes. These systems contain measurable student-focused planning, student development activities, and continuous family and community involvement. The project supports the implementation of effective transition practices to ensure all students are prepared for postsecondary education, employment, and independent living.
For more information about the Michigan Transition Outcomes Project, go to http://mi-top.cenmi.org.

APR – Part B Michigan
Part B State Annual Performance Report for FFY 2012 (2012-2013) Appendix B Page 206 (OMB NO: 1820-0624 / Expiration Date: 7/31/2015)
Continuous Improvement and Monitoring System
The Continuous Improvement and Monitoring System (CIMS) was designed to help intermediate and local districts analyze and interpret data to track monitoring activities in a single location. The CIMS promotes positive learning outcomes for diverse learners and ensures compliance with the Individuals with Disabilities Education Act (IDEA) and the Michigan Administrative Rules for Special Education. The CIMS reflects the priorities of the IDEA and the State Performance Plan and is aligned with the School Improvement Framework. The Office of Special Education, along with intermediate and local school districts, use the CIMS reports to:
Analyze overall performance around Individualized Education Programs (IEPs).
Analyze compliance. Review high rates of suspensions and expulsions and overall graduation rates
among students with an IEP. Improve district-level educational services and performance of students with
an IEP.
For more information about the Continuous Improvement and Monitoring System, go to http://cims.cenmi.org. Michigan Special Education Mediation Program
The Michigan Special Education Mediation Program (MSEMP) provides services through the Community Dispute Resolution Program, a network of 18 conflict resolution centers across the state. MSEMP provides mediation, facilitation, and training services for working through disputes between school districts and parents or guardians of children with special needs, so that children with disabilities promptly receive the services they need to develop and succeed in school. The mediation process is intended to resolve disputes by sharing ideas on what the student needs, versus placing blame. The process helps participants find solutions for the good of the student in a non-legal way, thereby avoiding a lengthy and expensive court process. The use of mediation is voluntary and has to be agreed to by both the parent and the school district. Parents initiate nearly 60 percent of all MSEMP mediations. MSEMP is administered by Dispute Resolution Education Resources, Inc., a Lansing-based nonprofit organization.
For more information about the Michigan Special Education Program, go to http://msemp.cenmi.org/.

APR – Part B Michigan
Part B State Annual Performance Report for FFY 2012 (2012-2013) Appendix B Page 207 (OMB NO: 1820-0624 / Expiration Date: 7/31/2015)
Michigan’s Integrated Behavior and Learning Support Initiative
Michigan’s Integrated Behavior and Learning Support Initiative (MiBLSi) is designed to support school districts (intermediate and local districts) in developing local implementation capacity of an integrated reading and behavior multi-tiered system of supports. Through this work, students become better readers with the social skills necessary to succeed. Schools that have been using the MiBLSi process are finding that reading scores increase as disruptive behaviors decrease in part because educators have more time to address instructional needs. MiBLSi also helps schools use student data to intervene early with students who are struggling in reading and/or with behavior issues. Schools are supported through training and ongoing coaching. MiBLSi is in the process of creating a sustainable and scalable statewide program.
For more information about Michigan’s Integrated Behavior and Learning Support Initiative, go to http://miblsi.cenmi.org/.
Michigan’s Integrated Technology Supports
Michigan’s Integrated Technology Supports provides information services, support materials, and technical assistance to local and intermediate school districts in Michigan to increase their capacity to address the needs of students with an IEP for assistive technology. MITS provides information about state-of-the-art technology, daily living devices, equipment, and the identification of assistive technology solutions for children with disabilities. The MITS staff research resources and provides current information on products, services, and service providers in the field of assistive technology. MITS also maintains a collection of catalogs, reprints, and publications that aid assistive technology personnel in the schools. In addition, MITS provides in-services, workshops, seminars, and training opportunities for education professionals and others. MITS also maintains a software and equipment lending library available to Michigan's K-12 Public Schools for short-term use.
For more information about Michigan’s Integrated Technology Supports, go to http://mits.cenmi.org/.

APR – Part B Michigan
Part B State Annual Performance Report for FFY 2012 (2012-2013) Appendix B Page 208 (OMB NO: 1820-0624 / Expiration Date: 7/31/2015)
Michigan’s Integrated Mathematics Initiative
Michigan’s Integrated Mathematics Initiative (Mi)2 helps school districts and educators create and sustain a collaborative system of support and professional development in mathematics education. Project goals include:
Converge and blend existing initiatives to promote a cohesive system of all mathematics resources.
Create a network of facilitators and practitioners statewide who have the skills and resources to enhance math learning for all students.
Research and promote factors that improve student outcomes for ALL students in mathematics
Scale selected research-based math professional learning courses across the state, addressing multiple grade bands.
(Mi)2 offers facilitator institutes for selected professional learning courses, provides technical assistance to school and district math programs, and coordinates resources among organizations and individuals. (Mi)2 publishes a monthly newsletter and (Mi)2 staff are available to work directly with schools and individuals to locate and utilize key resources for effective mathematics instruction.
For more information about the Michigan’s Integrated Mathematics Initiative, go to http://mi2teams.cenmi.org/. Michigan Alliance for Families
The Michigan Alliance for Families provides information, support, and education to parents whose children receive special education supports, from birth to age 26. The Michigan Alliance for Families also helps parents to become more active in their children’s school as a way of improving services and results for children and young adults with special education needs. The Michigan Alliance for Families helps parents understand the rights of their children and to effectively communicate and advocate for their children’s needs. The Michigan Alliance for Families offers training to parents around the state on topics such as Content of the IEP, and Communication and Advocacy. The Michigan Alliance for Families mentors emerging parent leaders involved with Local Interagency Coordinating Councils (LICCs), Parent Advisory Committees (PACs), the Special Education Advisory Committee (SEAC), the Michigan Interagency Coordinating Council (MICC), and other groups. In addition to the work they do with and on behalf of children and families, the Michigan Alliance for Families supports the other Mandated Activities Projects to facilitate their work with families.
For more information about the Michigan Alliance for Families, go to http://www.michiganallianceforfamilies.org/.

APR – Part B Michigan
Part B State Annual Performance Report for FFY 2012 (2012-2013) Appendix B Page 209 (OMB NO: 1820-0624 / Expiration Date: 7/31/2015)
Reaching and Teaching Struggling Learners The Reaching and Teaching Struggling Learners (RTSL) initiative supports schools in their efforts to improve student results through secondary redesign and dropout prevention. Each participating school has a team consisting of principals, parents, counselors, general educators, special educators, and school improvement leaders who work with struggling learners who may be at risk for academic failure and disengagement. The teams build data fluency to identify areas of need, select evidence-based interventions and then work to stabilize the multi-tiered system of support they create. While RTSL is designed to reduce the risk of dropout among students during middle and high school, the teams also are working to support post-secondary success. RTSL has found that earning trust between students, staff and families, and building leadership increases the likelihood of student achievement and resilience.
For more information about the Reaching and Teaching Struggling Learners initiative, go to http://rtsl.cenmi.org.
Statewide Autism Resources and Training (START) The Statewide Autism Resources and Training Project (START) was funded by the Michigan Department of Education, Office of Special Education starting in 2001 to develop a training and resource model for educators serving students with Autism Spectrum Disorders (ASD) that increases local capacity, promotes collaboration across the state, and creates a comprehensive model for serving students with ASD. In the START Project, a statewide collaborative system is emphasized that includes all intermediate school districts in Michigan. Over time, the focus of the START Project has become systems-level change initiated and implemented by school staff and administrators willing to commit to using evidence-based practices in the areas of educational programming, professional development, parent-professional collaboration, and cross district/county collaboration. For more information about the START Project, go to www.gvsu.edu/autismcenter .

APR – Part B Michigan
Part B State Annual Performance Report for FFY 2012 (2012-2013) Appendix C Page 210 (OMB NO: 1820-0624 / Expiration Date: 7/31/2015)
FFY 2012 Annual Performance Report
Appendix C:
Overview of the
Continuous Improvement and
Monitoring System as
Developed and Implemented in Michigan

APR – Part B Michigan
Part B State Annual Performance Report for FFY 2012 (2012-2013) Appendix C Page 211 (OMB NO: 1820-0624 / Expiration Date: 7/31/2015)
Continuous Improvement and Monitoring System Overview
The Continuous Improvement and Monitoring System (CIMS) is the monitoring system used by the Michigan Department of Education, Office of Special Education (OSE) and the Office of Great Start, Early Childhood Education & Family Services. The state uses this system to ensure compliance with the Individuals with Disabilities Education Act (IDEA) and the Michigan Administrative Rules for Special Education and promote positive student outcomes. The CIMS was designed to help the state and its locals58 analyze and interpret data as well as record all monitoring activities in a single location. The CIMS reflects the priorities of the IDEA and the State Performance Plan (SPP), and aligns with the Michigan School Improvement Framework. In assessing the performance of its locals, the OSE monitors data collected through: Focused monitoring activities (on-site, state-verified desk audit or state-verified
self-review) Data reviews Other activities
Michigan evaluates the performance of each local, relative to the SPP indicator targets. If areas of noncompliance with the IDEA or state rules are identified, the state issues a finding of noncompliance to the local. A finding is a dated, written notification that includes both the citation of the statute, rule or regulation, and a description of the data supporting the state’s conclusion that there is noncompliance with that statute or regulation. All identified noncompliance must be corrected as soon as possible, but in no case later than one year, including verification. If the local did not reach a target on a results indicator, they would be required to develop an improvement plan. During Federal Fiscal Year (FFY) 2012, the electronic CIMS Workbooks were launched on August 15, 2012, December 15, 2012 and April 15, 2013. Elements of the CIMS Process The CIMS process and tools include the following: Electronic Workbooks Electronic workbooks help locals organize information and activities related to the monitoring process. Each local is issued a CIMS Workbook three times a year. Each workbook contains a series of reports—some for informational purposes and some that require action on the part of the local. Reports Containing Local Data Reports and other tools in the electronic workbook are designed to assist locals with their continuous improvement process. The CIMS Workbook guides users by providing a list of tasks that must be completed depending on the local’s 58 A comprehensive term used in the CIMS to describe local educational agencies, public school academies (charter schools), service areas (intermediate school districts) and state agencies. It means the same as “districts”.

APR – Part B Michigan
Part B State Annual Performance Report for FFY 2012 (2012-2013) Appendix C Page 212 (OMB NO: 1820-0624 / Expiration Date: 7/31/2015)
performance on SPP indicators and other state priorities. The CIMS Workbook provides the necessary reports, forms and resources to successfully complete reports and activities, and helps locals organize, implement and track their status. The CIMS Workbook contains the following reports:
A Local Strand Report – divides the SPP indicators into compliance and results indicators and provides an annual measure of a local’s performance relative to each of the SPP indicator targets.
A Determinations Report – provides an annual rating of a local’s performance in meeting the requirements of the IDEA.
A Monitoring Activities Report (MAR) – gives information on the OSE monitoring activities that affect the local, including notification of upcoming on-site reviews, state-verified desk audits or state-verified self-reviews. Each workbook provides the locals with information regarding their performance on other issues identified by the OSE monitoring activities. A MAR may require action. The local reviews the report each monitoring cycle and makes sure required actions are performed and completed by the due date. For example, if the local does not meet the state graduation target, the local must identify the root cause of the underperformance, share this hypothesis with the school improvement team and submit a response through the CIMS Workbook to the OSE for consideration by the specified date.
A Special Education Focused Monitoring Report – provides a written notification issued to a local by the OSE citing any areas of noncompliance found during any monitoring activity including focused monitoring or data reviews.
Review and Analysis Process (RAP) Teams Each local must form a RAP team to review and analyze CIMS reports. Each team provides oversight, guidance and structure in the corrective action or improvement planning process. The RAP team is responsible for: (1) reviewing and analyzing local reports and data, and (2) completing the assigned tasks. The work is organized into three categories: compliance and correction, results and improvement, and student and child data. Compliance and Correction If a local is issued a Report of Findings, it must address the noncompliance by: (1) identifying the root cause(s) of the areas of noncompliance and developing and submitting a corrective action plan (CAP), (2) implementing the CAP and (3) completing the verification of correction process. The electronic workbook contains probe questions and CAP forms to guide this process. The OSE requires that research-based practices are used and a list of scientifically-based guidance resources is posted to the CIMS website at http://cims.cenmi.org/. The OSE reviews and approves all submitted CAPs following a standard protocol. If necessary, the district is required to clarify or modify the CAP prior to the OSE approval. Assigned technical assistance (TA) providers assist with the CAP process for all focused monitoring findings. RAP teams track the implementation and effectiveness of correction and improvement activities through the workbook and internal processes. Progress

APR – Part B Michigan
Part B State Annual Performance Report for FFY 2012 (2012-2013) Appendix C Page 213 (OMB NO: 1820-0624 / Expiration Date: 7/31/2015)
reports are submitted to the OSE per an established schedule (see chart below). Once all activities are completed, the local requests closure of the CAP.
Corrective Action Plan Dates
Workbook Starts CAP Due Progress Report Closeout
April 15 June 1 October 1 December 1
August 15 October 1 February 15 April 1
December 15 February 1 June 1 September 15
There are two prongs of verification of correction used by the OSE: Prong 1 – The local has corrected each individual case of noncompliance. Prong 2 – The local is correctly implementing the specific regulatory
requirements (i.e., achieved 100 percent compliance) based on the state’s review of new data per established indicator timeframes.
Verification activities may include:
A review of updated policies, procedures or practices. A review of the results of student record reviews to ensure student level
correction. Evidence that training or TA was obtained. A review of new data submitted through the state data systems.
Based on this review, the OSE establishes that the identified noncompliance has been corrected and the local is correctly implementing the specific statutory or regulatory requirement(s). Once evidence of correction is verified, the OSE notifies the local, closes the CAP and issues a closeout report. If correction of noncompliance is not completed before the CIMS Workbook due date, the OSE mandates TA, training or other enforcement action to promptly bring the local into compliance. A finding remains active until correction is verified by the OSE. Results and Improvement Each April, locals are issued a Strand Report that compares the local’s performance on SPP indicators to state targets. The August CIMS Workbook contains a data snapshot or a shorter version of the Strand Report. Locals that fail to meet state targets for results indicators are issued results transmittals. The results transmittals require locals to review their district data, respond to probe questions, and create improvement activities to address performance on the indicator. Regional monitors from the intermediate school district (ISDs) are available to support this activity which is intended to be aligned with and incorporated into school and district improvement activities. If issued a Results Transmittal in any of the Workbooks, the local then convenes a RAP team and conducts the activities described above.

APR – Part B Michigan
Part B State Annual Performance Report for FFY 2012 (2012-2013) Appendix C Page 214 (OMB NO: 1820-0624 / Expiration Date: 7/31/2015)
Student and Child Data In addition to addressing SPP indicators, locals may be asked to verify data. Specific directions on how to complete student data activities are provided to locals through the CIMS Workbook, community-of-practice webinars and guidance documents available on the CIMS website. A Systemic Approach Leads to Improvement The CIMS provides locals the tools to see the same data and information the state sees when making monitoring decisions. In addition to helping the state and locals keep track of the tasks and activities required by the IDEA, the CIMS helps locals put special education monitoring into context, defines a predictable schedule of events and establishes a system of improvement. Information is stored in a single electronic location; this includes CAP progress reports, student level data and evidence of correction on findings of noncompliance. Locals are provided processes and tools via the CIMS website to guide the improvement and correction activities within a prescribed calendar which will lead to compliance and improved outcomes for students with an individualized education program.


APR – Part B Michigan
Part B State Annual Performance Report for FFY 2012 (2012-2013) Appendix D Page 216 (OMB NO: 1820-0624 / Expiration Date: 7/31/2015)
FFY 2012 Annual Performance Report
Appendix D:
Business Rules for Calculation of Local Education Agency Disproportionate Representation in Special Education and
Related Services for All Disabilities and for Specific Categories of Disabilities by Race/Ethnicity

APR – Part B Michigan
Part B State Annual Performance Report for FFY 2012 (2012-2013) Appendix D Page 217 (OMB NO: 1820-0624 / Expiration Date: 7/31/2015)
Office of Special Education Michigan Department of Education (MDE)
Procedures for Calculation of LEA Disproportionate Representation by Race/Ethnicity in Special Education
(All Disabilities and for Specific Categories of Disabilities)
November 2012 Revision
1. Disproportionate representation calculations use data from the fall 2011 and fall 2012 Michigan Student Data System (MSDS)59 general collections including the Special Education Count files. Only students with an Individualized Education Program (IEP), ages 6 through 21, per the Individuals with Disabilities Education Act (IDEA) Part B definition, are counted.60 (The residency codes of students are drawn from the data in MSDS and the disability category is based on the information in the MSDS special education child count.) Resident district data refers to the students that live within a district’s boundaries with the following exceptions: students attending public school academies, schools of choice, non-public schools, registered home-schools and entities serving adjudicated students are only reflected in their operating district.
2. Calculations are performed for all districts with 30 or more students with an
IEP. 3. Calculations are performed for each of the following racial/ethnic subgroups
(American Indian, Asian, Black, Hispanic, Native Hawaiian or Other Pacific Islander, White, or Two or More Races) within a district if the total enrollment in the operating district (including special education) for all other racial/ethnic subgroups (total enrollment comparison group) is more than 100.
4. Calculations are performed for each racial/ethnic subgroup with 10 or more
students in a given disability category (autism spectrum disorder, cognitive impairment, emotional impairment, other health impairment, specific learning disability and speech and language impairment).
5. A Weighted Risk Ratio (WRR) is used to determine disproportionate
representation for a particular racial/ethnic subgroup when the district’s student population is similar to the state racial/ethnic distribution and there are at least 10 students in the given disability category in all other racial/ethnic subgroups (disability comparison group).
● For Indicator 9, the comparison group is all students with an IEP of any
other racial/ethnic subgroup. ● For Indicator 10, the comparison group is all students in the specific
disability category among the other racial/ethnic subgroups.
59 MSDS is the statewide data system for all schools/students. 60 Students who have been placed in facilities for adjudicated youth (as indicated by the student residency code in
MSDS) are excluded. Also excluded are students enrolled in the Operating District Number 84020.
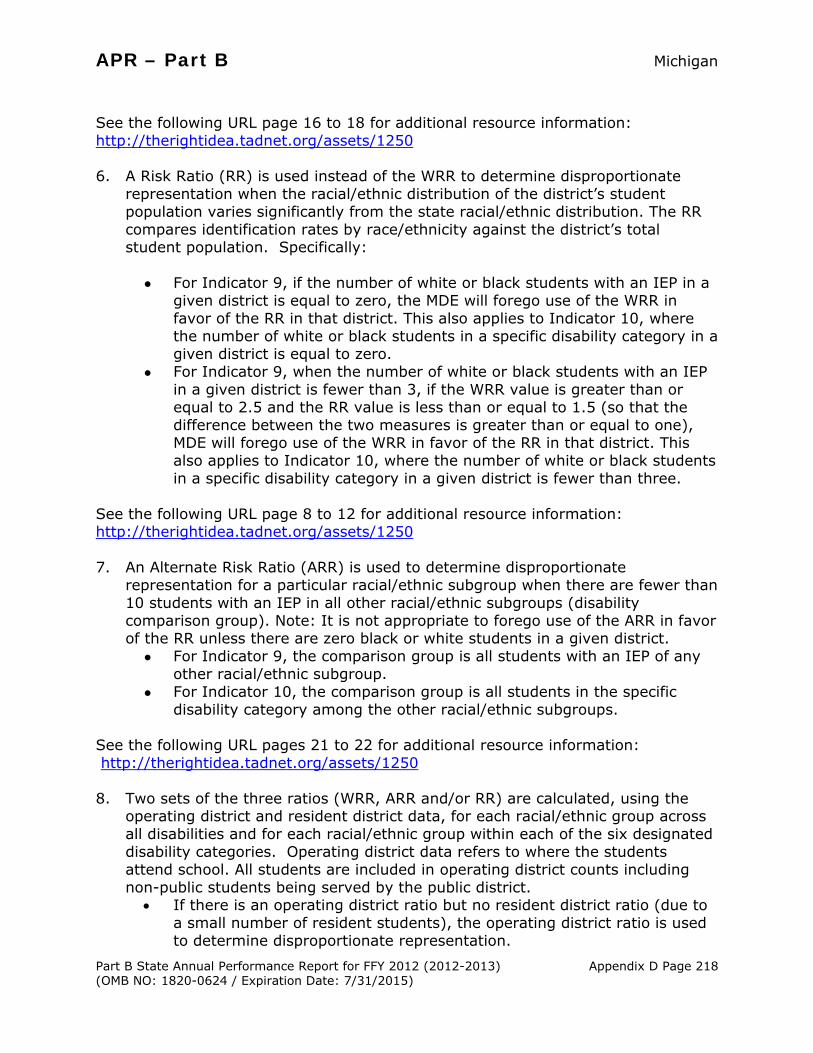
APR – Part B Michigan
Part B State Annual Performance Report for FFY 2012 (2012-2013) Appendix D Page 218 (OMB NO: 1820-0624 / Expiration Date: 7/31/2015)
See the following URL page 16 to 18 for additional resource information: http://therightidea.tadnet.org/assets/1250 6. A Risk Ratio (RR) is used instead of the WRR to determine disproportionate
representation when the racial/ethnic distribution of the district’s student population varies significantly from the state racial/ethnic distribution. The RR compares identification rates by race/ethnicity against the district’s total student population. Specifically:
● For Indicator 9, if the number of white or black students with an IEP in a
given district is equal to zero, the MDE will forego use of the WRR in favor of the RR in that district. This also applies to Indicator 10, where the number of white or black students in a specific disability category in a given district is equal to zero.
● For Indicator 9, when the number of white or black students with an IEP in a given district is fewer than 3, if the WRR value is greater than or equal to 2.5 and the RR value is less than or equal to 1.5 (so that the difference between the two measures is greater than or equal to one), MDE will forego use of the WRR in favor of the RR in that district. This also applies to Indicator 10, where the number of white or black students in a specific disability category in a given district is fewer than three.
See the following URL page 8 to 12 for additional resource information: http://therightidea.tadnet.org/assets/1250 7. An Alternate Risk Ratio (ARR) is used to determine disproportionate
representation for a particular racial/ethnic subgroup when there are fewer than 10 students with an IEP in all other racial/ethnic subgroups (disability comparison group). Note: It is not appropriate to forego use of the ARR in favor of the RR unless there are zero black or white students in a given district. ● For Indicator 9, the comparison group is all students with an IEP of any
other racial/ethnic subgroup. ● For Indicator 10, the comparison group is all students in the specific
disability category among the other racial/ethnic subgroups. See the following URL pages 21 to 22 for additional resource information: http://therightidea.tadnet.org/assets/1250 8. Two sets of the three ratios (WRR, ARR and/or RR) are calculated, using the
operating district and resident district data, for each racial/ethnic group across all disabilities and for each racial/ethnic group within each of the six designated disability categories. Operating district data refers to where the students attend school. All students are included in operating district counts including non-public students being served by the public district.
If there is an operating district ratio but no resident district ratio (due to a small number of resident students), the operating district ratio is used to determine disproportionate representation.

APR – Part B Michigan
Part B State Annual Performance Report for FFY 2012 (2012-2013) Appendix D Page 219 (OMB NO: 1820-0624 / Expiration Date: 7/31/2015)
If there is no operating district ratio, but there is a resident district ratio, the operating district is not considered for disproportionate representation.
Public School Academies (PSAs) have only one set of ratios as they are only operating districts.
Students participating in intermediate school district center programs are reflected in resident district counts.
9. The lower of the district’s selected operating district ratio or resident district
ratio is used to determine disproportionate representation. Districts are considered to have disproportionate representation when the appropriate ratio (WRR, ARR or RR) is greater than 2.5 for two consecutive years for any racial/ethnic group across all disabilities or for any racial/ethnic group within a single disability category.
10. Districts identified as having disproportionate representation per the above
business rules will have an opportunity to verify their data. Upon completion of the verification process, the results will be reviewed in conjunction with data from multiple sources to determine appropriate focused monitoring activities.

APR – Part B Michigan
Part B State Annual Performance Report for FFY 2012 (2012-2013) Appendix D Page 220 (OMB NO: 1820-0624 / Expiration Date: 7/31/2015)
Resident District Definition for Analyzing Disproportionate Representation Data
The purpose of the revised resident district definition is to include only those students that districts have an opportunity to influence/educate. The “resident” definition excludes students enrolled in schools of choice, non-public, registered home-schools and entities serving adjudicated students. Resident district is calculated in the following way. 1. Begin with the Michigan Student Data System (MSDS) Fall Collection resident
count. 2. Subtract students with the following Student Residency codes:
i. Schools of Choice (Codes 02 and 03) ii. Non-Public School (Codes 04 and 08) iii. Registered Home-Schools (Codes 07 and 15) iv. Juvenile Detention (Codes 09 and 12) v. New Public School Academies (PSAs) (Code 10)
3. Filter out all PSAs as identified by the Educational Entity Master:
https://cepi.state.mi.us/EEM/EntitySearchQuick.aspx 4. The MSDS resident student count WILL include the following Student Residency
codes:
Non-K-12 students (Code 01) No Cooperative Agreement, no release, not exempted (Code 05) All other non-resident students (Code 06)—(Please note: Operating
districts do the MSDS submission—hence these are non-residents of the OPERATING district.) This will include those students who are residents but through an IEP have been placed in another district.
School for the Deaf (Code 11) assigned to the students’ resident ISDs. Students with an IEP who are served by a Department of Community Health facility (Code 13)
All other resident students (Code 14). The same parameters set for determining resident district count for the special
education population are applied to the general education population for comparison.
The calculation for operating districts includes:
PSA, Schools of Choice students, non-public school and registered home-school students who receive special education ancillary services.


APR – Part B Michigan
Part B State Annual Performance Report for FFY 2012 (2012-2013) Appendix E Page 222 (OMB NO: 1820-0624 / Expiration Date: 7/31/2015)
FFY 2012 Annual Performance Report
Appendix E:
Postsecondary Outcomes Survey

Pos 1.
2.
3.
Em
APR –
Part B Sta(OMB NO
stseconda
At any timschool, haattended atraining, o (Please F
Did you cterm?
(Please F
Describe tjob traininattended.
(Please Fthat apply)
mployment
– Part B
ate Annual Pe: 1820-0624
You can u
ary School
me since leaave you evany school,r education
FILL IN ON
omplete an
FILL IN ON
the kind ofng program
FILL IN ALL)
t Section
erformance R / Expiration
se a pen or
l Section
aving high ver , job n program
NE circle)
n entire
NE circle)
f school or m you
L circles
Postsec
Report for FFY Date: 7/31/2
pencil.
?
�
� Y
�
� Y
� (
� SpE
� Vd
� Cd
� Cdegre
� O
� priso� O
____
condary
Y 2012 (20122015)
No (Go
Yes (Go
No
Yes
High schoo(Adult BasiShort-termprogram (JEmploymenVocational degree proCommunitydegree College or ee
On a missi
Enrolled inon Other (plea
_________
y Outcom
2-2013)
o to quest
o to quest
ol completiic Educatio
m educationJob Corps, nt Program Technical
ogram y or Techn
University
on, in the
studies w
ase specify
_________
mes Sur
App
tion 4)
tion 2)
on documeon, GED) n or emplo Michigan W
m, etc.) School – le
ical Colleg
to earn a
Peace Corp
hile incarce
y):
______
rvey
Mich
pendix E Pag
ent or certi
yment traiWorks, Sum
ess than 2-
e to obtain
4 or more
ps, VISTA,
erated in ja
higan
e 223
ificate
ning mmer
-year
n a 2 year
year
etc.
ail or

APR – Part B Michigan
Part B State Annual Performance Report for FFY 2012 (2012-2013) Appendix E Page 224 (OMB NO: 1820-0624 / Expiration Date: 7/31/2015)
4. At any time since leaving high
school, have you ever worked?
(Please FILL IN ONE circle)
� No (Go to question 9)
� Yes (Go to question 5)
5. Since leaving high school, have
you worked at any time for a total of 3 months (about 90 days)?
(Please FILL IN ONE circle)
� No
� Yes
6. Think about your most recent job. Did you work on average 20 or more hours per week (or about half time of a 40-hour week)?
(Please FILL IN ONE circle)
� No
� Yes
7. Again, thinking about your
most recent job, were you paid at least minimum wage ($7.40 an hour if you are age 18 or older; $7.25 an hour if you are age 17 or younger; or $2.65 an hour if you worked in a job where you earned regular tips such as waitstaff in a restaurant)?
(Please FILL IN ONE circle)
� No
� Yes

APR – Part B Michigan
Part B State Annual Performance Report for FFY 2012 (2012-2013) Appendix E Page 225 (OMB NO: 1820-0624 / Expiration Date: 7/31/2015)
8. Where was your most recent job?
(Please FILL IN ONE circle)
� In a company, business, or service with people with and without disabilities
� In the military
� In supported employment (paid work with services and wage support to the employer) ����
� Self-employed
� In your family’s business (e.g., farm, store, fishing, ranching, catering)
� In sheltered employment (where most workers have disabilities)
� Employed while in jail or prison
� Other (please specify): _________________________
9. What is your relationship to the
former student in question? (Please FILL IN ONE circle)
� I am the former student
� I am a parent, guardian, or caregiver of the former student
� Other (please specify):
_________________________ Thank you for taking the time to complete this questionnaire.
Please return it to us in the self-addressed envelope or to:
Dr. Lyke Thompson, Post-School Survey Wayne State University/Center for Urban Studies
5700 Cass Avenue, 2207 A/AB Detroit MI 48202