
Michelle Dalrymple & Grant Ritchie Cashmere High School.
50
JUNIOR STATISTICS Michelle Dalrymple & Grant Ritchie Cashmere High School
Transcript of Michelle Dalrymple & Grant Ritchie Cashmere High School.
JUNIOR STATISTICS
Michelle Dalrymple & Grant RitchieCashmere High School
2
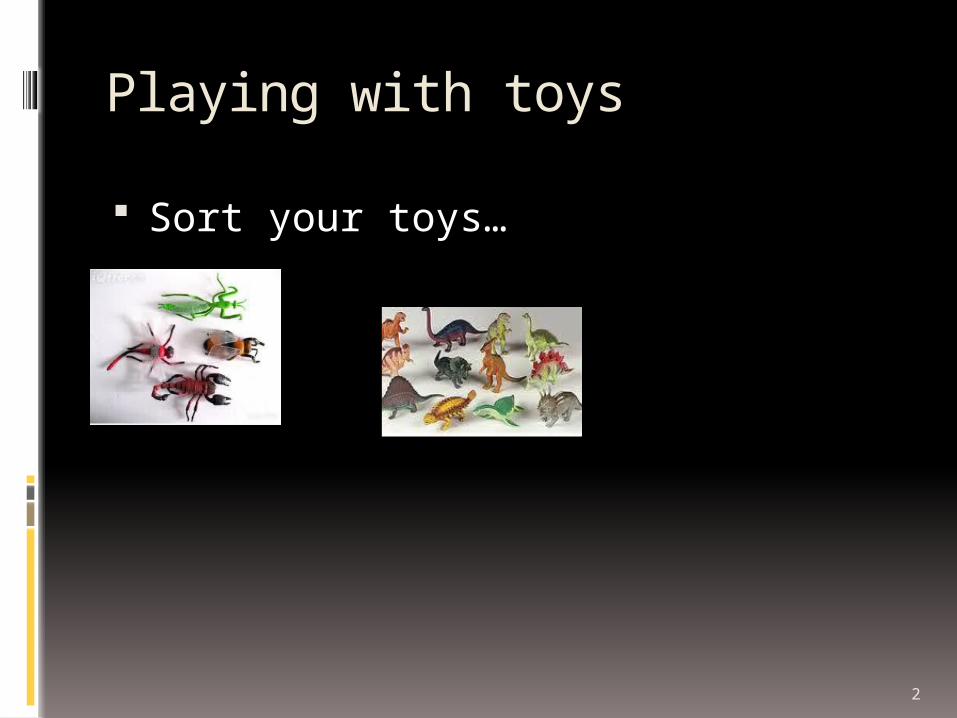
Playing with toys
Sort your toys…
3
Introduction
Us, and our background Junior Statistics focus Plan
We’ll speak for 1 hour-ish Share where we’re all at after that
4
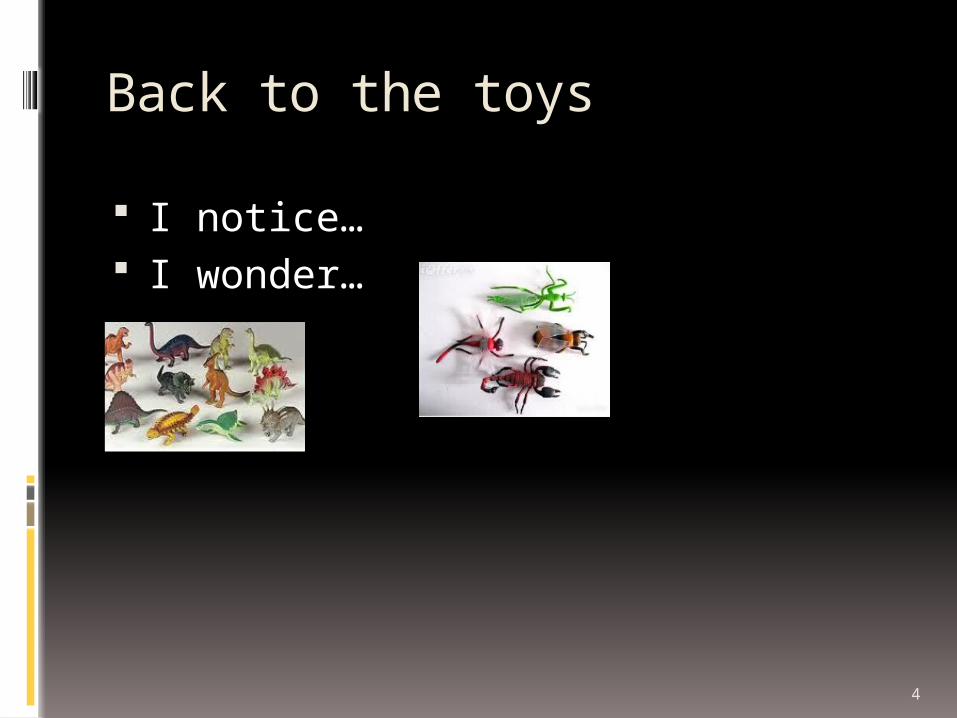
Back to the toys
I notice… I wonder…
5
Curriculum levels
Information has been collated from: Curriculum AOs Second tier information: student
exemplars http://nzmaths.co.nz/nzc-and-standards
Key ideas http://
www.nzmaths.co.nz/key-mathematical-ideas?parent_node
6
CHS Emphasis
Year 9 Year 10
Playing with data Introducing PPDAC Asking good questions
Single distributions
Dot plots Shape
Box plots Summary stats
(centre, spread) Making the call
7
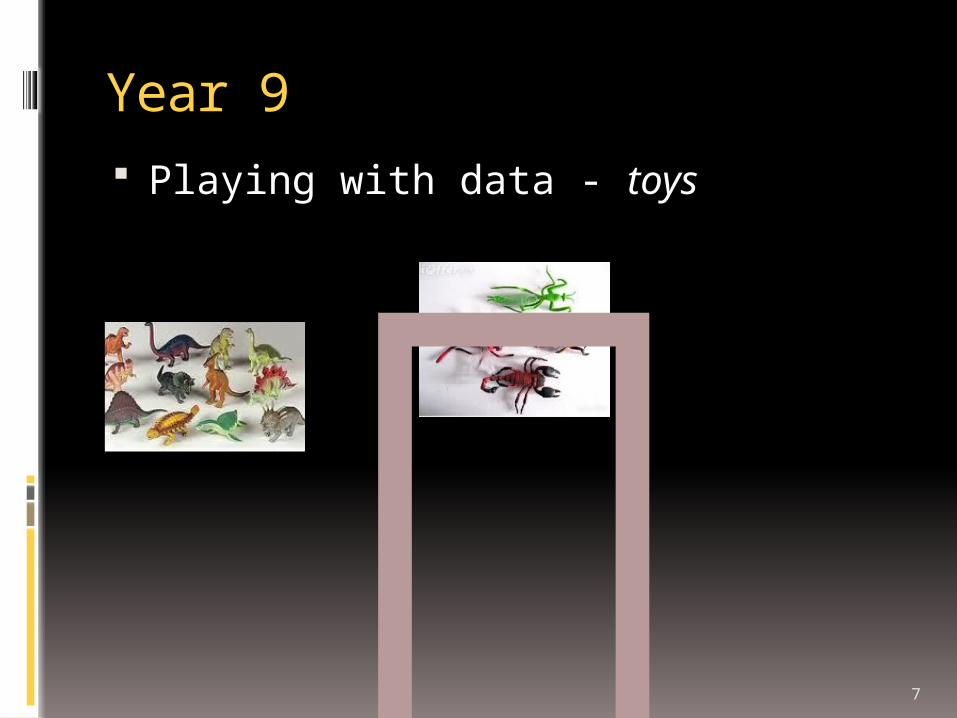
Year 9 Playing with data - toys
8
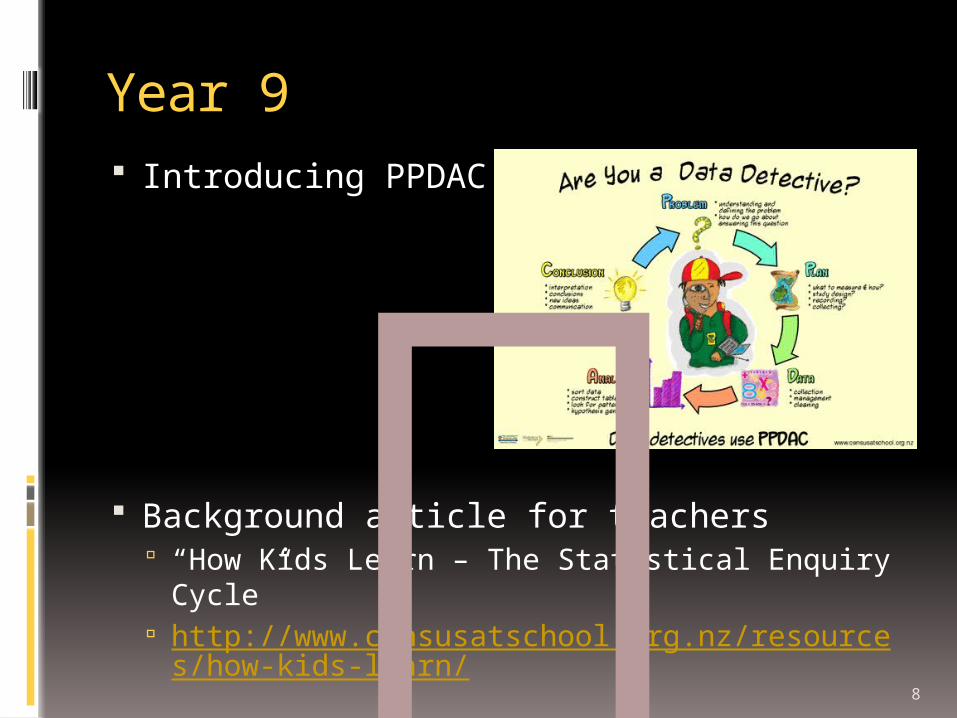
Year 9 Introducing PPDAC
Background article for teachers “How Kids Learn – The Statistical Enquiry
Cycle” http://www.censusatschool.org.nz/resources/h
ow-kids-learn/
9
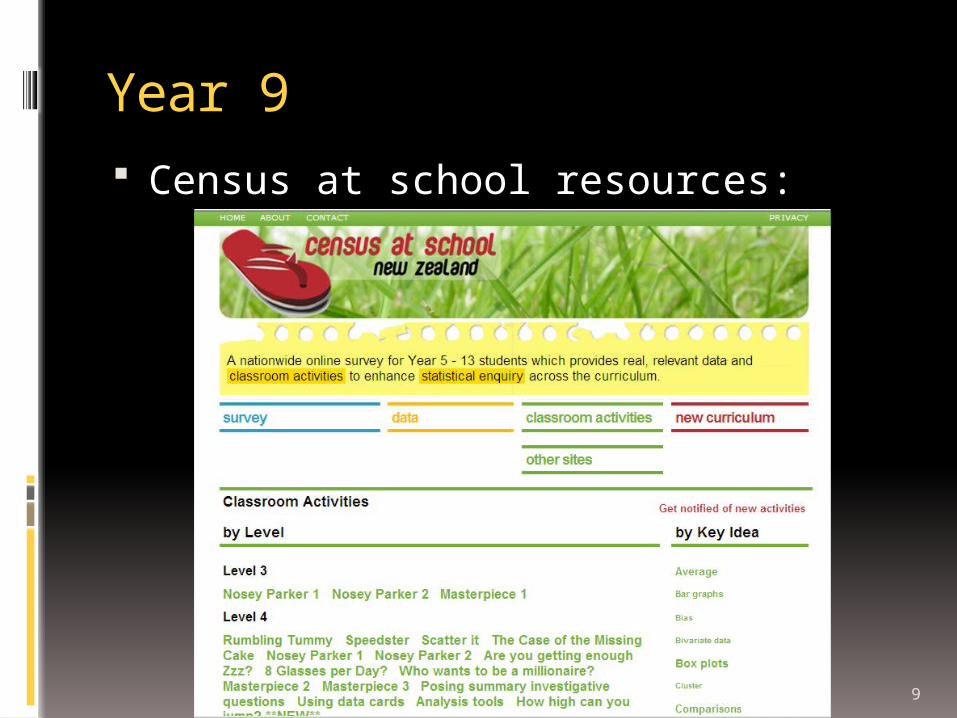
Year 9 Census at school resources:
14
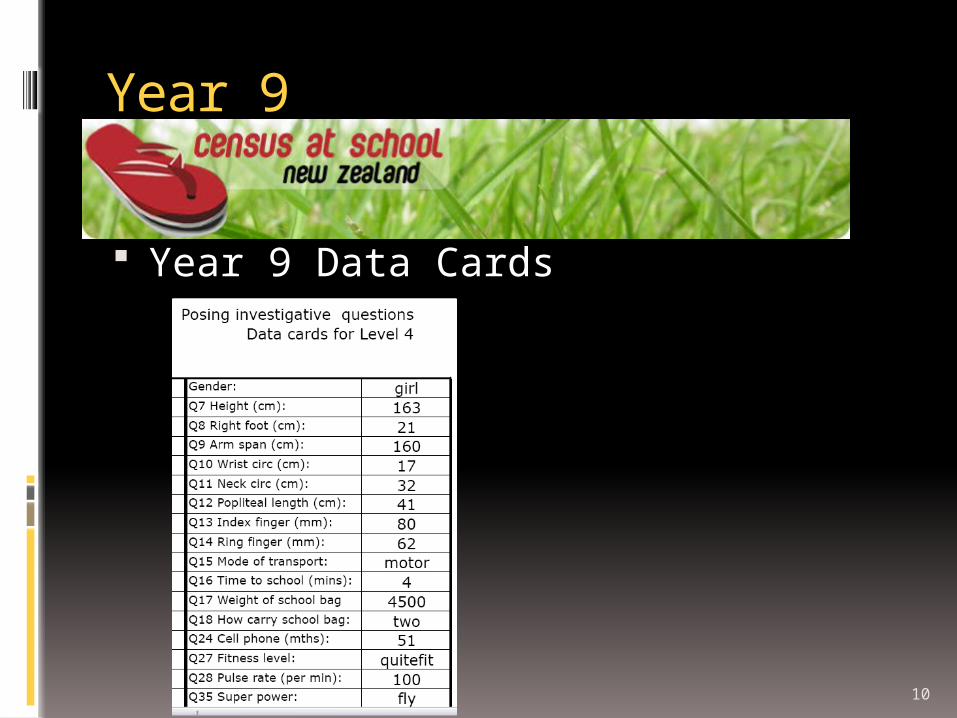
Year 9 data cards
Summary question: I wonder what are typical heights for the
year 9 students in this group?
15
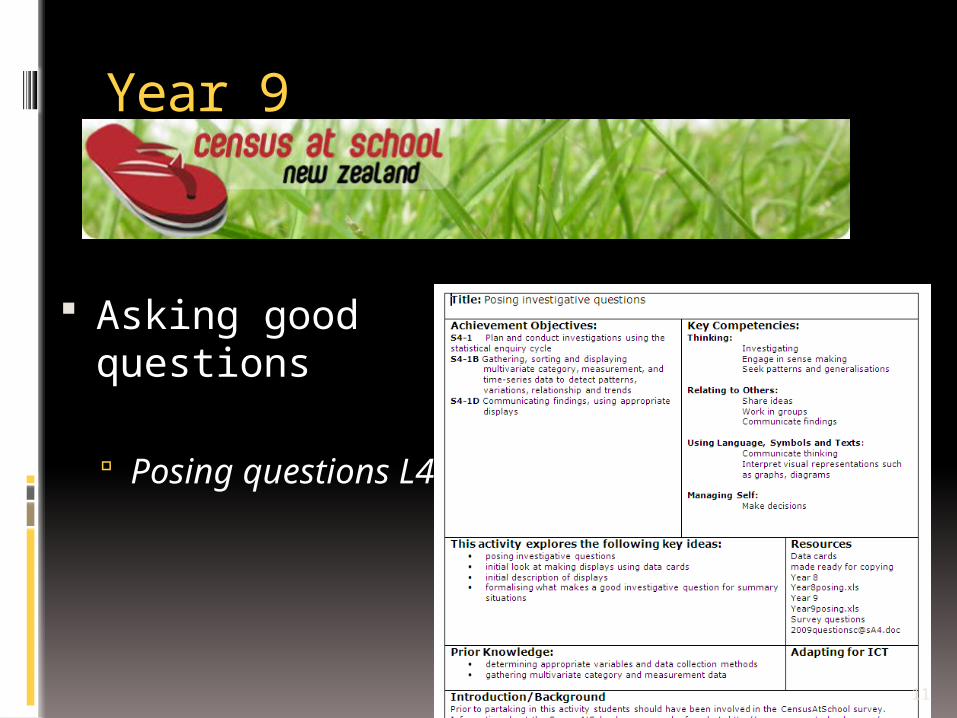
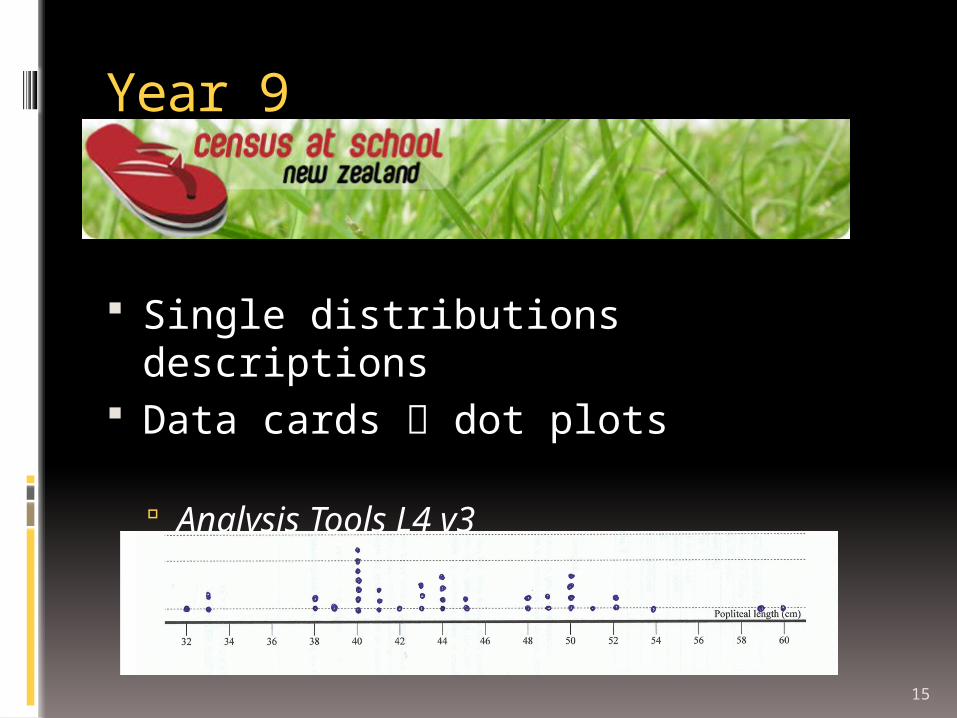
Year 9
Single distributions descriptions Data cards dot plots
Analysis Tools L4 v3
16
Year 9
Dot plots Shape
SHAPE ACTIVITIES sheet
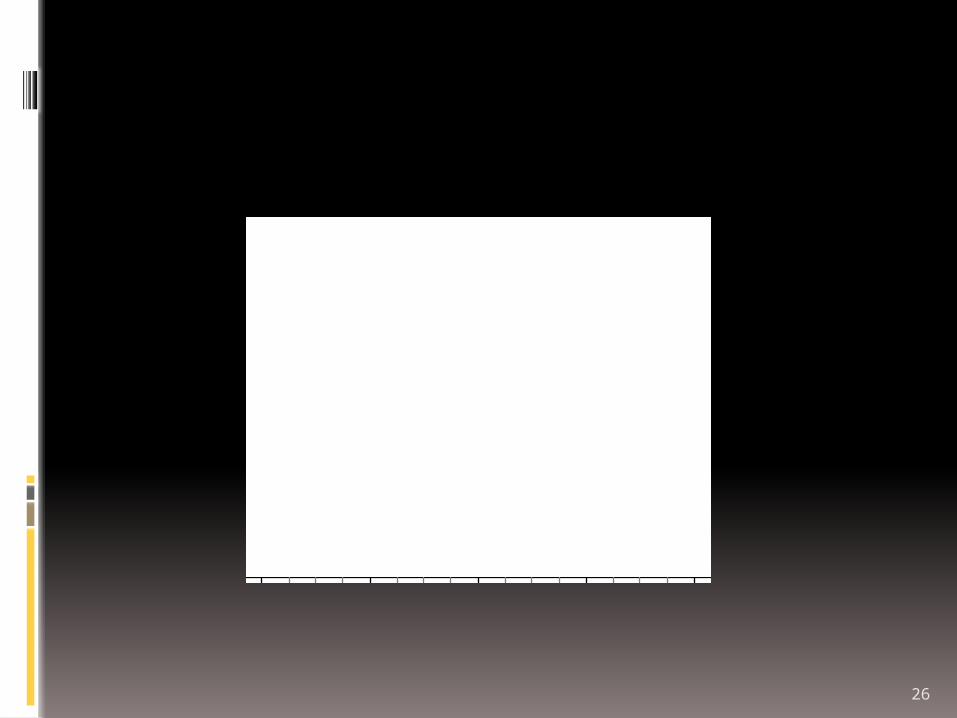
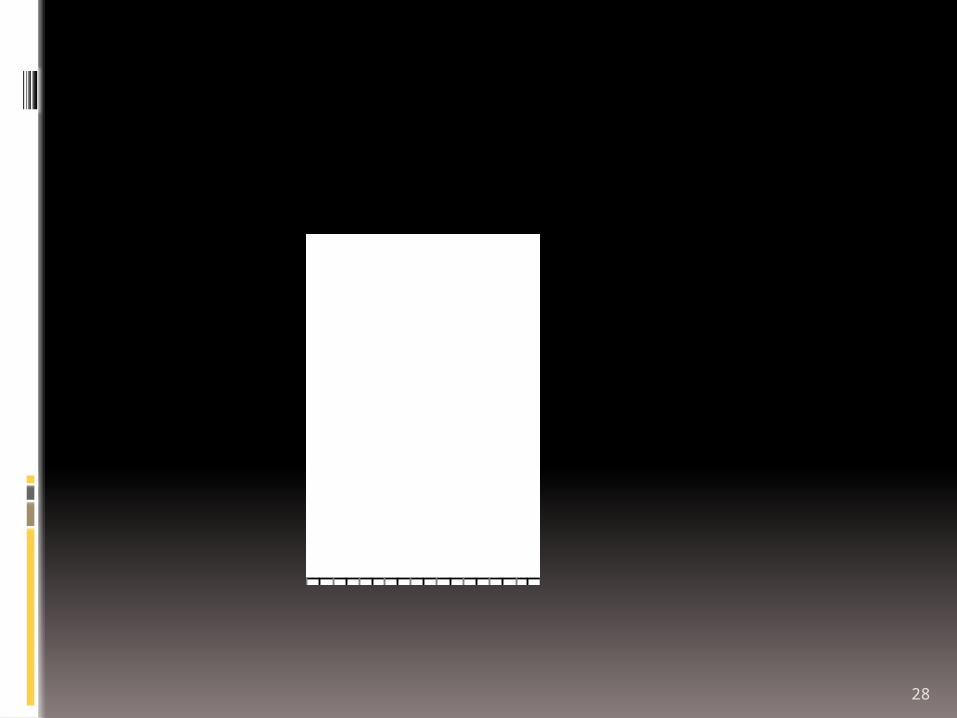
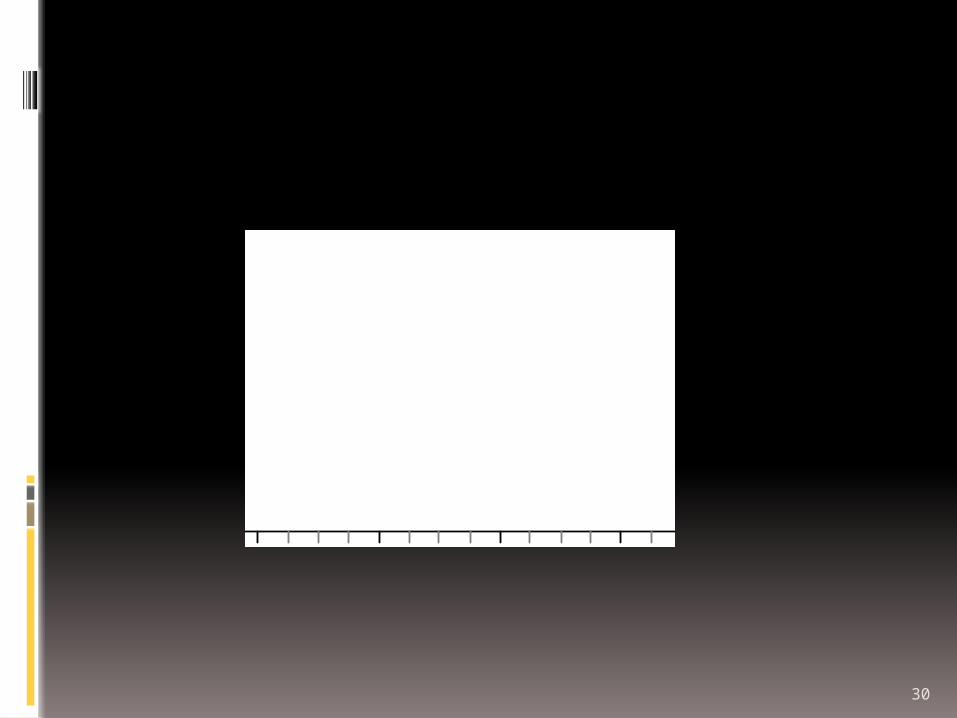
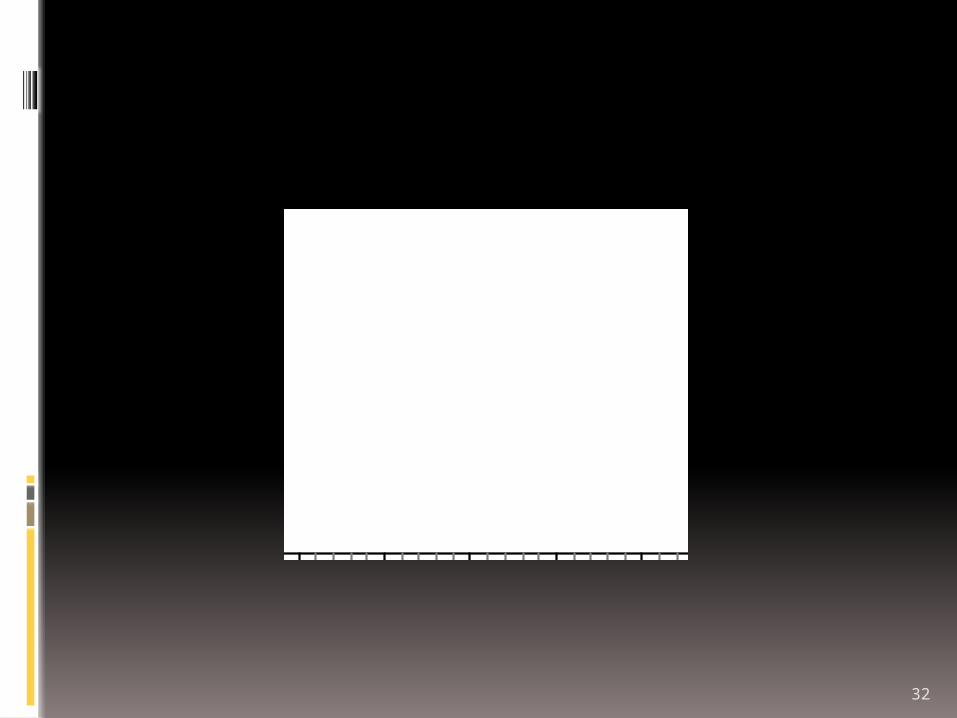
SKETCHING SHAPES
Quickly sketch the general shape of the distribution

18
0 20 40 60 80 100 120 140

19
20
0 2 4 6 8 10 12 14

21
22
0.5 1.0 1.5 2.0 2.5 3.0 3.5

23
24
1.5 2.0 2.5 3.0 3.5 4.0 4.5

25
26
0 20 40 60 80 100

27
28
16 20 24 28 32

29
30
0 200 400 600 800

31
32
0 100000 200000

33
34
0 20 40 60 80

35
36
Reflection: Seeing shape
What did you look for when catching a glimpse of the plot?
Are your plots similar to your neighbours?
37
Describing shape
Choose one plot and with your neighbour discuss how your Year 9 students would describe the shape What sort of language would they use?
38
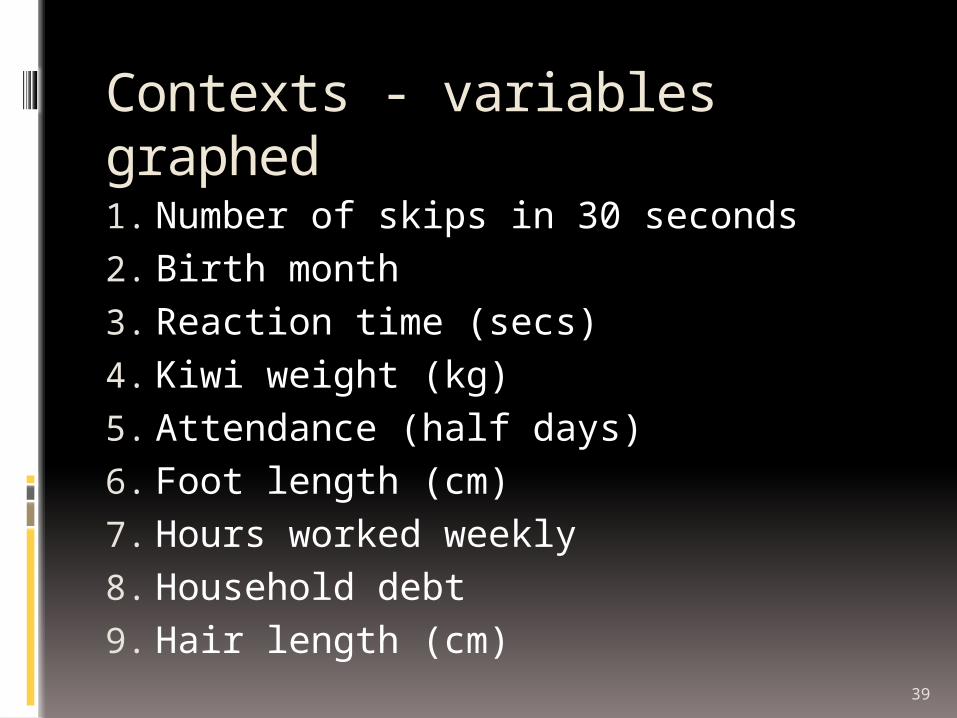
Connecting shape and context
In pairs, match each context with its graph
39
Contexts - variables graphed1. Number of skips in 30 seconds2. Birth month3. Reaction time (secs)4. Kiwi weight (kg)5. Attendance (half days)6. Foot length (cm)7. Hours worked weekly8. Household debt 9. Hair length (cm)
40
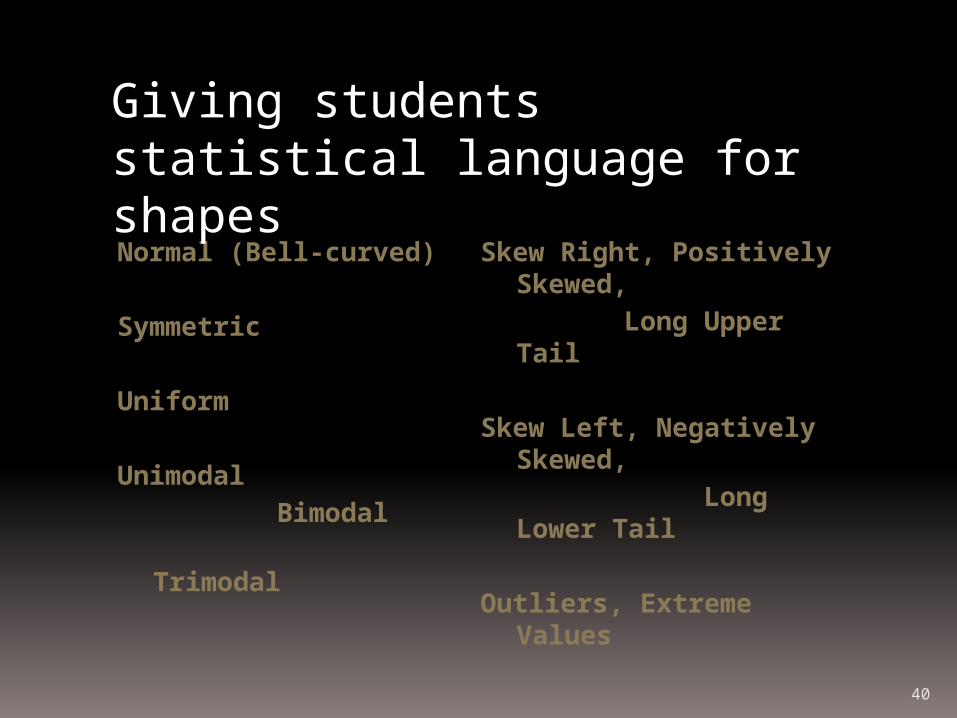
Normal (Bell-curved)
Symmetric
Uniform
Unimodal
Bimodal
Trimodal
Skew Right, Positively Skewed,
Long Upper Tail
Skew Left, Negatively Skewed,
Long Lower Tail
Outliers, Extreme Values
Giving students statistical language for shapes
41
Engaging with shape
One of the keys for unlocking the story behind the data
Develops the skill of what to look at and what to look for Using their imagination, they start to notice
what is interesting, unusual or unexpected.
What are the data trying to tell us?
42
Shape resources…
http://www.censusatschool.org.nz/engaging-with-shape-3/

43
CHS Emphasis
Year 9 Year 10
Playing with data Introducing PPDAC Asking good questions
Single distributions
Dot plots Shape
Box plots Summary stats
(centre, spread) Making the call
44
Year 10 http://
www.censusatschool.org.nz/2009/teachers-day/
A complete set of Year 10 lesson plans available that develop students informal inferential reasoning
45
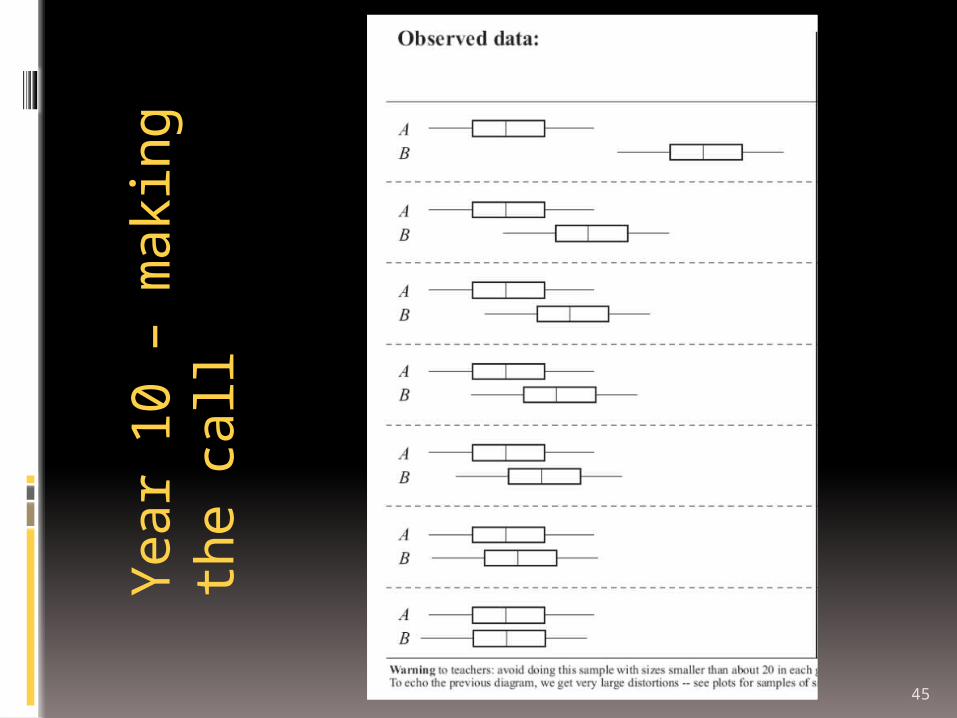
Teacher resource
Year 10 – making
the call

46
Pip Arnold Session
Thursday 7th July1.30 – 5.00pm
Watch plenary video before the day, found here: http://www.censusatschool.org.nz/2010/vide
os/teachers-day.mov
Will cover Making the call @ Year 10 Making the call @ Year 11 (91035)
47
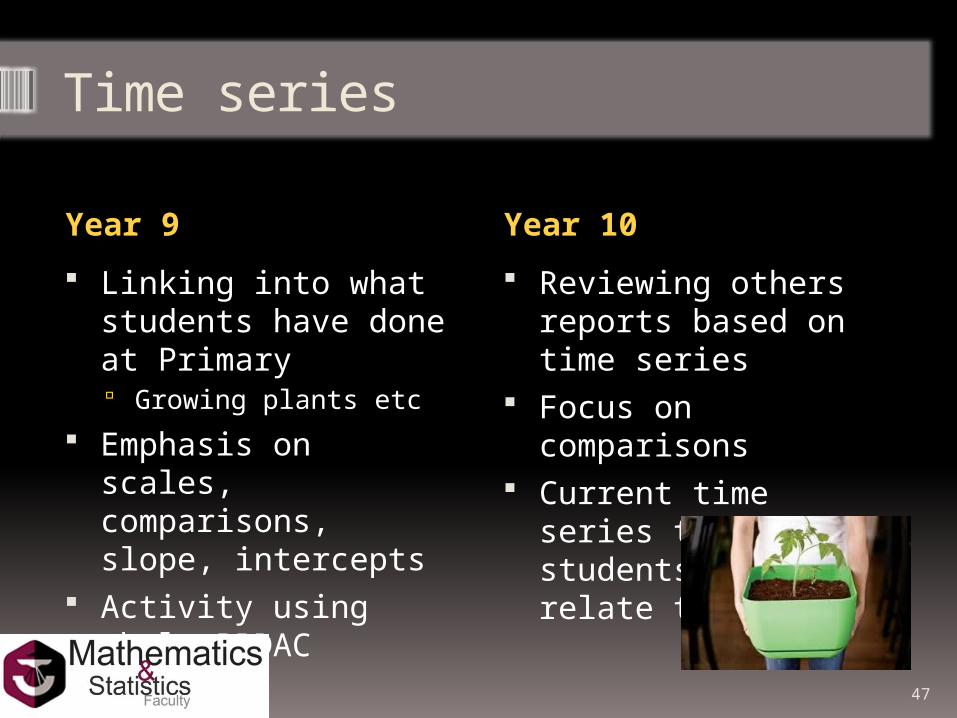
Time series
Year 9 Year 10
Linking into what students have done at Primary Growing plants etc
Emphasis on scales, comparisons, slope, intercepts
Activity using whole PPDAC
Reviewing others reports based on time series
Focus on comparisons Current time series
that students can relate to
48
Bivariate data
Year 9 Year 10
Relationships fall naturally out of playing with data cards
C@S tasks including Scatterit The case of the missing
cake Are you a Masterpiece
Good opportunity to review Year 9 work and complete full PPDAC cycle
Leads into 91036 Bivariate data
49
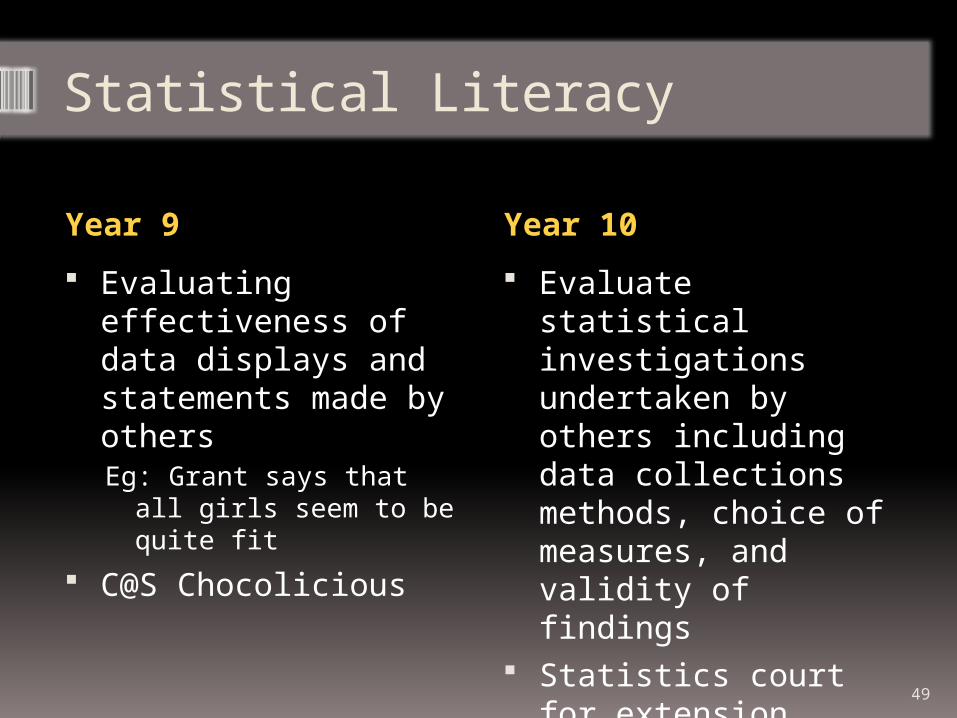
Statistical Literacy
Year 9 Year 10
Evaluating effectiveness of data displays and statements made by othersEg: Grant says that all
girls seem to be quite fit
C@S Chocolicious
Evaluate statistical investigations undertaken by others including data collections methods, choice of measures, and validity of findings
Statistics court for extension students

50
Second tier information:
http://nzmaths.co.nz/nzc-and-standards
Links with useful information…
Key mathematical (and statistical) ideas:
http://www.nzmaths.co.nz/key-mathematical-ideas?parent_node
Census at School
http://www.censusatschool.org.nz/
For the slides please email: