
MICA: MicroRNA Integration for Active Module Discoverybmi.osu.edu/hpc/software/mica/report.pdf ·...
13
MICA: MicroRNA Integration for Active Module Discovery Ayat Hatem The Biomed. Informatics Dept. The Elec. & Comp. Eng. Dept. [email protected] Kamer Kaya The Biomed. Informatics Dept. [email protected] Jeffrey Parvin The Biomed. Informatics Dept. [email protected] Kun Huang The Biomed. Informatics Dept. [email protected] Ümit V. Çatalyürek The Biomed. Informatics Dept. The Elec. & Comp. Eng. Dept. [email protected] ABSTRACT Disease-specific module discovery is an important problem to understand the disease behavior. A successful method to address this problem is the integration of gene expression data with the protein-protein interaction (PPI) network. Many tools have been developed to efficiently perform this integration. However, these tools focus only on the genes existing in the PPI network; totally neglecting other genes that we do not yet have information regarding their inter- action. In addition, they only make use of the gene expres- sion data which does not give the true picture about the ac- tual protein expression levels. In fact, the cell uses different mechanisms, such as microRNAs, to post-transcriptionally regulate the proteins without affecting the corresponding genes expressions. The unprecedented amount of publicly available disease-related data encourages the development of new methodologies for a further understanding the dis- ease behavior. In this work, we propose a novel workflow Mica, which, to the best of our knowledge, is the first study integrat- ing miRNA, mRNA, and PPI network information to suc- cessfully return disease-specific gene modules. The novelty of the workflow lies in many directions, including the ad- justment of mRNA expression with microRNA to better highlight indirect dependencies between the different genes. We applied Mica on microRNA-Seq and mRNA-Seq data sets of 699 invasive ductal carcinoma samples and 150 in- vasive lobular carcinoma samples from the Cancer Genome Atlas Project (TCGA). The returned Mica gene modules unravel new and interesting dependencies between the dif- ferent genes and miRNAs. 1. INTRODUCTION n complex diseases, genes do not act in isolation, rather, they interact together in pathways and modules to perform the designated function [11]. In addition, their interaction patterns are changed based on the type of the cell and the condition [8]. A well-structured characterization and anal- ysis of such modules have always been intriguing for the researchers, especially for extremely heterogeneous diseases. Cancer is such a disease: the derivative tissue differs for many cancer types. Besides, each cancer type can have many subtypes. Identifying a biologically correct and valid mod- ule is important for each cancer type and subtype since the treatment options and their success rates can significantly differ [2]. One way to find such modules is to look for clusters of genes with certain properties, e.g., dense cluster, in different biological networks, such as the PPI network or the gene co- expression network. A more efficient method is the integra- tion of different biological data to better highlight these gene modules [40]. Following this idea, various techniques that integrate gene-expression values or p-values with biological networks to extract such gene modules have been proposed, e.g., [29, 16, 53]. Such extracted modules are called active modules since the gene expression data, which is dynami- cally changing, is integrated with the PPI network, which is static. Hence, the word active comes from the notion that these modules are active in certain cells or conditions. Fol- lowing this track, many other tools have been developed to better make use of the network structure and other types of data as well, such as genotypic data. An excellent review and categorization of these tools was recently provided [40]. Although the gene expression signature-based tools and algorithms have proven to be flexible in practice, they do not provide a be-all and end-all solution for the active mod- ules discovery problem. Today, we have various data types that can be used to increase the accuracy, but many of the existing tools and workflows do not exploit such heterogene- ity. Besides, these tools are usually restricted to the pro- teins/genes in the networks they use and ignore the other genes in the gene expression data that we do not yet have any information regarding their interaction patterns. MicroRNAs (miRNAs) are small non-coding RNAs that are used by the cell to post-transcriptionally regulate gene expression levels [18]. miRNAs inhibit protein synthesis by either stopping the protein translation or by performing mRNA degradation. miRNAs constitute an important inhi- bition technique that has been shown to be very important in different diseases, specifically, in cancer progression [30]. For instance, miRNAs were found to be differentially expressed in breast cancer in addition to successfully classifying estro- gen and progesterone receptors, and HER2/neu status [4]. Hence, using miRNAs for the active module discovery is a promising technique to increase the accuracy and success rate of the cancer treatments. Most of the works that integrate miRNA and mRNA data assumes that the miRNA effect on the mRNA is distinguish- able from the gene expression levels [26, 58]. However, the protein expression level can be significantly affected by the miRNA without having any apparent effect on the gene ex-
Transcript of MICA: MicroRNA Integration for Active Module Discoverybmi.osu.edu/hpc/software/mica/report.pdf ·...

MICA: MicroRNA Integration for Active Module Discovery
Ayat HatemThe Biomed. Informatics Dept.The Elec. & Comp. Eng. Dept.
Kamer KayaThe Biomed. Informatics Dept.
Jeffrey ParvinThe Biomed. Informatics [email protected]
Kun HuangThe Biomed. Informatics [email protected]
Ümit V. ÇatalyürekThe Biomed. Informatics Dept.The Elec. & Comp. Eng. Dept.
ABSTRACTDisease-specific module discovery is an important problemto understand the disease behavior. A successful method toaddress this problem is the integration of gene expressiondata with the protein-protein interaction (PPI) network.Many tools have been developed to efficiently perform thisintegration. However, these tools focus only on the genesexisting in the PPI network; totally neglecting other genesthat we do not yet have information regarding their inter-action. In addition, they only make use of the gene expres-sion data which does not give the true picture about the ac-tual protein expression levels. In fact, the cell uses differentmechanisms, such as microRNAs, to post-transcriptionallyregulate the proteins without affecting the correspondinggenes expressions. The unprecedented amount of publiclyavailable disease-related data encourages the developmentof new methodologies for a further understanding the dis-ease behavior.
In this work, we propose a novel workflow Mica, which,to the best of our knowledge, is the first study integrat-ing miRNA, mRNA, and PPI network information to suc-cessfully return disease-specific gene modules. The noveltyof the workflow lies in many directions, including the ad-justment of mRNA expression with microRNA to betterhighlight indirect dependencies between the different genes.We applied Mica on microRNA-Seq and mRNA-Seq datasets of 699 invasive ductal carcinoma samples and 150 in-vasive lobular carcinoma samples from the Cancer GenomeAtlas Project (TCGA). The returned Mica gene modulesunravel new and interesting dependencies between the dif-ferent genes and miRNAs.
1. INTRODUCTIONn complex diseases, genes do not act in isolation, rather,
they interact together in pathways and modules to performthe designated function [11]. In addition, their interactionpatterns are changed based on the type of the cell and thecondition [8]. A well-structured characterization and anal-ysis of such modules have always been intriguing for theresearchers, especially for extremely heterogeneous diseases.Cancer is such a disease: the derivative tissue differs formany cancer types. Besides, each cancer type can have manysubtypes. Identifying a biologically correct and valid mod-ule is important for each cancer type and subtype since thetreatment options and their success rates can significantly
differ [2].One way to find such modules is to look for clusters of
genes with certain properties, e.g., dense cluster, in differentbiological networks, such as the PPI network or the gene co-expression network. A more efficient method is the integra-tion of different biological data to better highlight these genemodules [40]. Following this idea, various techniques thatintegrate gene-expression values or p-values with biologicalnetworks to extract such gene modules have been proposed,e.g., [29, 16, 53]. Such extracted modules are called activemodules since the gene expression data, which is dynami-cally changing, is integrated with the PPI network, which isstatic. Hence, the word active comes from the notion thatthese modules are active in certain cells or conditions. Fol-lowing this track, many other tools have been developed tobetter make use of the network structure and other types ofdata as well, such as genotypic data. An excellent reviewand categorization of these tools was recently provided [40].
Although the gene expression signature-based tools andalgorithms have proven to be flexible in practice, they donot provide a be-all and end-all solution for the active mod-ules discovery problem. Today, we have various data typesthat can be used to increase the accuracy, but many of theexisting tools and workflows do not exploit such heterogene-ity. Besides, these tools are usually restricted to the pro-teins/genes in the networks they use and ignore the othergenes in the gene expression data that we do not yet haveany information regarding their interaction patterns.
MicroRNAs (miRNAs) are small non-coding RNAs thatare used by the cell to post-transcriptionally regulate geneexpression levels [18]. miRNAs inhibit protein synthesisby either stopping the protein translation or by performingmRNA degradation. miRNAs constitute an important inhi-bition technique that has been shown to be very important indifferent diseases, specifically, in cancer progression [30]. Forinstance, miRNAs were found to be differentially expressedin breast cancer in addition to successfully classifying estro-gen and progesterone receptors, and HER2/neu status [4].Hence, using miRNAs for the active module discovery is apromising technique to increase the accuracy and successrate of the cancer treatments.
Most of the works that integrate miRNA and mRNA dataassumes that the miRNA effect on the mRNA is distinguish-able from the gene expression levels [26, 58]. However, theprotein expression level can be significantly affected by themiRNA without having any apparent effect on the gene ex-

pression level [1]. [13] suggested another method to inte-grate miRNA and mRNA by integrating the PPI networkand miRNA-target gene network into one heterogeneous net-work. They focused on prioritizing the genes using the sug-gested network. Indeed, such integration would work aroundthe miRNA-mRNA integration problem. However, by fo-cusing only in prioritizing genes through the PPI network,they cannot detect connected modules of genes with indirectdependencies, e.g., through other genes not in the PPI net-work or through other genes with no change in expressionat mRNA level.
Even though the techniques using gene expression levelsprovide valuable information, they cannot show the wholepicture. Here, we try to exploit another miRNA and mRNAinteraction pattern, which is the inhibition of protein trans-lation rather than mRNA degradation. We believe that ifthe gene expression levels are adjusted based on the expres-sion levels of the corresponding miRNAs, novel and inter-esting gene-gene dependencies can be unraveled.
In this work, we propose a workflow Mica which employsheterogeneous data sources and adopts independent com-ponent analysis [28] to extract active modules. To unravelnew types of gene-gene dependencies, we provide a noveldata integration technique that adjusts the expression levelof the genes based on the expression level of the correspond-ing miRNA. These dependencies are then mapped back tothe PPI network to extract the connected modules. Com-pared to existing active module discovery tools, Mica is lessdependent on the given biological network it uses hence doesnot need to ignore the information for the entities which arenot in the network.
There are three types of interactions between a group ofmiRNAs and a target gene; synergetic, complementary, andadditive. A synergetic effect implies that all the miRNAs af-fecting the gene must be expressed together in order to havemRNA degradation or protein inhibition [9]. Rather, miR-NAs can act complementary by requiring only one out of themiRNA set to be expressed [9]. In an additive interaction,each miRNA alone has an effect while the overall effect isincreased if multiple miRNAs are expressed [51]. Here, wewill focus on the complementary and the additive effects.
The rest of the paper is organized as follows: In Section 2,we provide a background on the techniques we used in thiswork. Our methods and experimental results are presentedin Section 3 and Section 4, respectively. Section 5 concludesthe paper.
2. BACKGROUNDIndependent Component Analysis (ICA) is a famous tech-
nique used to solve the Blind Source Separation problem.Given an input with multiple, linearly mixed sources, it triesto distinguish the sources by minimizing the statistical de-pendencies between them [28]. In the context of gene expres-sion, ICA decomposes an input expression into its possibleexpression modes [38]. For an n ×m input gene expressionmatrix X, where rows correspond to genes and columns cor-respond to samples, ICA decomposes X into:
XT = A× S (1)
such that S is a `× n matrix for ` ≤ m. The rows of S are(statistically) as independent as possible and correspond tothe independent components. The columns of S correspondto the genes and the entry Scg shows the contribution of a
Connected Module Extraction
Integration
CasesControls
gene 1gene 2gene 3 gene 4gene 5
.
.
.gene n
Gene Expression Profiles
CasesControls
miRNA 1miRNA 2miRNA 3 miRNA 4
.
.
.miRNA m
microRNA Expression Profiles
gene 1gene 2gene 3 gene 4gene 5
.
.
.gene n
Adjusted Gene Expressions
miRNA r: z r,s > tmiRNA r': z r',s > t
.
.
.miRNA r'': z r'',s > t
PPI Network
ICA
Output of ICA
module 1 module 2
module 3
Figure 1: Mica: The workflow starts with integratingmiRNA and mRNA data by adjusting the mRNA data usingthe miRNA data. Then, ICA is applied on the resulting newgene-expression matrix. Finally, for each independent com-ponent obtained by ICA, the largest connected module fromthe PPI network is extracted using the significant genes inthe component.
gene g to the component c. A is an m × ` matrix whereits rows correspond to samples. The entry Asc shows thecontribution of each component c for a sample s. Many ap-proximation algorithms have been proposed to find A andS in an efficient way, e.g., fastICA [27], JADE [6], and Info-
Max [3]. fastICA tries to identify non-Guassian componentsunder the assumption that Gaussian components representthe noise. This algorithm can stuck in a local minima, hencemultiple iterations, thus multiple estimates can be neces-sary [21, 10].
ICA has been used extensively to cluster different genestogether or for sample classification [38, 33, 19, 49, 45, 17,44, 54]. All of these studies have shown the efficiency of ICAin producing biologically relevant results.
3. METHODSMica consists of three main parts as shown in Figure 1:
3.1 Data integrationThe miRNA and gene expression data are usually inte-
grated by using correlation-based methods with the assump-tion that the effect of miRNA on mRNA should be apparenton the gene expression level. Rather than the suppressionof the gene expression, one can also exploit another typeof miRNA effect on mRNA; the inhibition of the proteintranslation. Traditional approaches cannot exploit such aneffect since it will not be apparent on the gene expressionlevel. Our novel integration step is based on this fact. Weuse miRNA expression level to adjust the expression levelof the genes. Therefore, if a gene is affected by an miRNAat the inhibition level, the proposed integration makes theeffect visible on the expression level. For each sample s, wefirst calculate the ratio:
βg,s =|
P{r: r affects g} Z
−r,s |P
{r: r affects g} Z+r,s
(2)

where Z+r,s (Z−r,s) is the positive (negative) z-score of miRNA
r in sample s that is experimentally verified to affect geneg. The z-score is calculated by
Zr,s =xr,s − µr
σr(3)
where xr,s is the expression level of miRNA r in sample s,and µr and σr are the mean and standard deviation of r’sexpression level across all the control samples. The z-score isdivided into positive and negative groups since each groupdifferently affect gene g. In general, when a miRNA r isdown-regulated, i.e., -ve z-score, then the expression of gwill increase. On the other hand, when r is up-regulated,i.e., +ve z-score, then the expression of g will decrease. Ac-cordingly, the final gene expression is calculated as follows:
e′g,s = βg,s × eg,s (4)
where eg,s and e′g,s are the original and adjusted expressionlevels of gene g.
For data integration, (4) is applied to each gene-samplepair. Only the absolute significant z-scores, i.e., the onesgreater than a threshold tR, are taken into account. Toavoid noise, only the miRNAs with an absolute z-score atleast tR in more than 10% of the samples are kept. Addi-tionally, βg,s must be > tR or < 1
tRin order to modify eg,s.
Such a constraint is meant to make sure that either the up-regulated group of miRNAs or the down-regulated group ofmiRNAs has a larger effect on g.
As mentioned previously, a group of miRNAs can affectthe same gene in a synergetic, complementary, or additiveway. Our integration equation (4) is additive and partiallycomplementary, i.e., the gene expression level will be af-fected more if several miRNAs affect it on a sample (addi-tive). When only a single miRNA is active in the sample, itwill still affect the expression level (complementary). At theend, our goal is to better highlight the dependency betweendifferent genes rather than finding exact protein expressionvalues; there are many unknown factors affecting the actualprotein expression.
3.2 ICA on gene expression valuesAfter the data integration step, the adjusted gene expres-
sion values are then fed to the ICA for which the R versionof the fastICA algorithm is used [27]. To avoid local min-imas and unreliable independent component estimates, wefollow the method in [10]: we run fastICA κ times and ob-tain different independent component estimates at each run.Then, the Pearson correlation coefficients between the com-ponents from different estimates are computed to distinguishthe most similar ones. We constructed a k-partite similaritygraph G = (V,E) where V = V1 ∪ · · · ∪ Vκ are the set of allcomponents returned by ICA and Vi is the set of componentsobtained in the ith run. The edge set E contains an edge(c, c′) if the Pearson correlation coefficient between c and c′
is at least 0.9 and they are not obtained in the same run, i.e.,c ∈ Vi, c′ ∈ Vj , i 6= j. To obtain the final component set, wepartition G to its maximally connected subgraphs. Then foreach connected subgraph C of G with at least κ vertices, weconstruct a final representative component by computing theaverage of the |C| rows corresponding to the vertices in C.
An important parameter of ICA is the number of compo-nents ` to be generated; when ` is large ICA will probablyreturn subcomponent-type structures which are not very in-
teresting [37]. A naıve method is setting ` = m, the numberof samples, which is not useful in our case since we have hun-dreds of them. We follow another approach [44] based onan earlier method proposed by [23]. We first apply SingularValue Decomposition (SVD) to the actual gene expressionmatrix to reduce the dimensionality. We do the same fora randomly permuted version of the same matrix. The ac-tual variance obtained from each SVD component is used todraw a curve of the information gain. A similar curve is alsogenerated for the randomly permuted case. The optimalnumber of components would be the point of intersection ofthese two curves, i.e., when the information obtained fromthe random components is higher than the information ob-tained from the actual components.
The matrices S and A generated by ICA can be usedto determine which genes are significant in each componentand which components are significant in each sample, re-spectively. There are different options to pick the significantcomponents, e.g., [46, 10, 45]. Here, we used a variant ofthe correlation method suggest by [45]. Basically, instead ofcalculating the correlation between the component weightacross the samples and the type (control/case) of the sam-ples, the Wilcoxon signed-rank test is used to calculate ap-value for each component based on its weight distribu-tion over the controls and cases. The Bonferroni correctionmethod is then used to correct the p-value. We further com-pute µ and σ for each component by using its weights inthe control samples. We then compute the z-score for eachcomponent-case sample pair. Hence, a component is signif-icant for a case, if the corresponding z-score is at least athreshold tC .
To determine the set of genes related to a component, weuse the z-score threshold based method [46, 49] which wasshown to be effective to return the most important genes foreach component. We calculated the z-score of each gene in acomponent by using its weight, µ, and σ that are computedby using all the gene weights inside this component. Thenfor each component, the genes with a z-score at least tG isconsidered to be a member of the component.
3.3 Connected module extractionThe connected PPI modules are extracted by mapping the
set of member genes in each component to the PPI networkand extracting the largest connected module. If there is noconnected module or if the largest one is not large enough thethreshold tG used to pick the member genes for each compo-nent is relaxed to allow more connectivity. However, as theresults will show, each component yield a large connectedmodule in PPI. In addition, recent studies also showed thatthe components generated by ICA (or similar techniques)are either highly enriched in the PPI network [58] or highlyenriched with signaling pathways [49].
Each component we found after the second step is ex-pected to generate a connected modules. It is crucial todefine a scoring function to determine which module is themost important one, i.e., containing important member genes.Although a large module is preferable, we do not want themodules to be too large. Therefore, after determining themember genes in each component c, the following scoringfunction is used:
scr(c) =
Pg∈c Zcgp|c|
(5)

where |c| is the number of member genes in c. We usedp|c|
instead of |c| since we want to give a higher score to largermodules. A gene g will have a high Zcg value if it is signifi-cant for c. Therefore, if a connected module contains manyimportant genes the module is considered to be important.
4. RESULTSWe implemented our proposed workflow Mica in R and
used the available implementation of the fastICA algorithm.To demonstrate the effectiveness of the proposed workflow,that is, the added benefits of early integration of microRNAdatasets, we compared the modules obtained by our work-flow Mica against the ones obtained using ICA and DE-
GAS [53], using the original gene expression values. DEGAS isa set-cover based algorithm known for its efficiency in de-tecting dysregulated pathways. It tries to detect a modulewith at least k differentially expressed (DE) genes shared be-tween most of the samples. We tuned the DEGAS parametersto detect the best module according to a measure providedby the tool based on how far the size of the module is froma randomly generated subnetwork of k genes. We set themaximum number of modules for DEGAS to 5. Still, it re-turned a single module in the experiments. In the rest ofthe text, DEGAS output modules are referred to as degas,ICA modules as ica, and Mica modules as mica.
We carried out the experiments on two datasets for twobreast-cancer subtypes: invasive lobular carcinoma (ILC)and Invasive ductal carcinoma (IDC) datasets . Both datasetsare from TCGA (https://tcga-data.nci.nih.gov/tcga/) andthey both contain RNA-Seq and miRNA-Seq data. Highthroughput sequencing data was used in our experimentssince it can provide a complete image about all the miRNAsand mRNAs in the cell without requiring any a-priori in-formation. The main aim of using two different subtypes ofthe same disease is to understand how different techniquesare able to detect modules specific to each subtype.
The ILC dataset has 106 control samples and 153 casesamples. All of the 259 samples have gene expression in-formation. Out of the 153 cases, only 150 contain miRNAsexpression data as well. Therefore, only the 150 cases areused in our experiments. The IDC dataset shares the 106control samples with the ILC. It also has 714 case sampleswith gene expression information, however, only 699 casesamples, which also have miRNA expression information,are used in our experiments.
The PPI network used for the module extraction was ob-tained from the BioGRID (http://thebiogrid.org ) database(rel. 3.2.104). It contains 139, 539 interactions between18, 170 proteins. The experimentally validated miRNA-targetinteractions used in data integration are obtained from miR-TarBase (rel. 4.5) [25].
The number of runs κ for ICA is set to 100 while tR thresh-old is set to 4 and tC and tG are set to 2. We set the thresholdhigh since we only want to keep the values that would havea potential of being important.
The qualities of the output modules are verified using dif-ferent methods, including, pathway enrichment analysis, GOenrichment analysis, disease ontology (DO) enrichment anal-ysis, and finally using the evidence in the literature on theimportance of the modules/genes. Enrichment analysis isperformed using ReactomePA [56], FunDo [41], and cluster-Profiler [57].
Table 1: Size of the modules obtained using Mica and ICA.# is the component number, S is the number of samples acomponent covers, |c| is the size of the component, |c|ppi isthe number of genes that are both in the component and thePPI network, N and E are the number of nodes and edges,respectively, for the largest connected module in the PPI,and scr(c) is the score of the largest connected module.
(a) ICA
# S |c| |c|ppi N E scr(c)1 55 754 657 221 348 39.432 18 34 31 2 1 3.353 54 279 267 103 143 25.334 28 703 641 274 510 50.705 4 542 448 116 141 28.806 7 349 320 116 337 26.687 2 204 176 30 29 12.81
(b) Mica
# S |c| |c|ppi N E scr(c)1 103 501 475 164 272 55.632 49 284 242 21 21 12.713 67 1007 879 339 585 49.514 30 455 446 283 506 52.415 68 931 876 541 1535 66.916 9 889 752 253 354 46.047 3 790 738 410 1297 51.04
4.1 Results on ILC dataThe Mica modules are meaningfully different from ICA
modules. Table 1 shows the number of samples they cover,the size of each component, the number of member genesin the PPI network, the size of the largest connected mod-ule, and the score. In general, for each of ICA and Micacomponents, there is a large connected module in the PPInetwork. Interestingly, Mica modules have higher scoresthan ICA modules in addition to being more common acrossthe samples.
We also use DEGAS on the ILC dataset for comparison pur-poses. The degas module consists of 347 genes with 730 in-teractions between them and the number of DE genes in thismodule is 200. The quality, i.e., the module size p-value, is0.19 which can be considered large. We tried different op-tions for DEGAS to get a better module, however, this is thebest module we obtained.
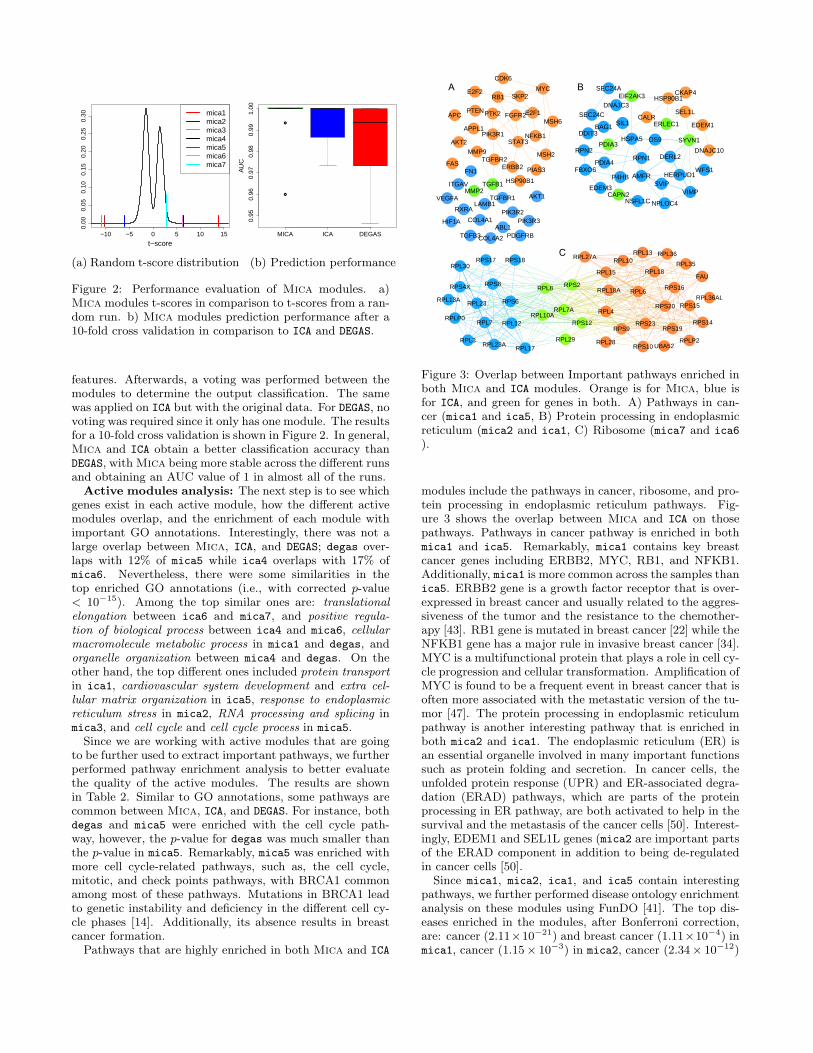
Statistical analysis of the obtained components:An important step is to first ensure that the obtained Micacomponents, hence the active modules, cannot be obtainedfrom a random matrix. Therefore, we set our null hypoth-esis to be that the t-score calculated for each componentfrom its weight across the case and control samples in the Amatrix can be obtained if we have a random input matrix.Accordingly, we generated 1000 random matrix by randomlypermuting the modified gene expression values for each geneacross the case and control samples. Afterwards, we appliedMica on the random matrices and calculated the t-score forthe randomly generated components. For each 1000 run, weonly kept the max/min t-score value. Finally, using the t-scores from the random runs, we generated the distributionfor the random t-scores and compared our actual t-scoresagainst. The random t-score distribution and the compo-nents t-score values are shown in Figure 2. Clearly, thecomponents cannot randomly gain such a high t-score (i.e.,p-value = 0). Therefore, the null hypothesis is rejected.
Classification using modified and original gene ex-pression: It is important to ensure that the modified geneexpression data better differentiate between case and controlsamples. To this end, a comparison between the predicationaccuracy using Mica modules on the modified gene expres-sion data and ICA and DEGAS modules on the original datawas carried out. Basically, for Mica modules, a SupportVector Machine (SVM) was trained on each module sep-arately, with the genes in each module used as the input
−10 −5 0 5 10 15
0.00
0.05
0.10
0.15
0.20
0.25
0.30
t−score
mica1mica2mica3mica4mica5mica6mica7
(a) Random t-score distribution
●
●
MICA ICA DEGAS
0.95
0.96
0.97
0.98
0.99
1.00
AU
C
(b) Prediction performance
Figure 2: Performance evaluation of Mica modules. a)Mica modules t-scores in comparison to t-scores from a ran-dom run. b) Mica modules prediction performance after a10-fold cross validation in comparison to ICA and DEGAS.
features. Afterwards, a voting was performed between themodules to determine the output classification. The samewas applied on ICA but with the original data. For DEGAS, novoting was required since it only has one module. The resultsfor a 10-fold cross validation is shown in Figure 2. In general,Mica and ICA obtain a better classification accuracy thanDEGAS, with Mica being more stable across the different runsand obtaining an AUC value of 1 in almost all of the runs.
Active modules analysis: The next step is to see whichgenes exist in each active module, how the different activemodules overlap, and the enrichment of each module withimportant GO annotations. Interestingly, there was not alarge overlap between Mica, ICA, and DEGAS; degas over-laps with 12% of mica5 while ica4 overlaps with 17% ofmica6. Nevertheless, there were some similarities in thetop enriched GO annotations (i.e., with corrected p-value< 10−15). Among the top similar ones are: translationalelongation between ica6 and mica7, and positive regula-tion of biological process between ica4 and mica6, cellularmacromolecule metabolic process in mica1 and degas, andorganelle organization between mica4 and degas. On theother hand, the top different ones included protein transportin ica1, cardiovascular system development and extra cel-lular matrix organization in ica5, response to endoplasmicreticulum stress in mica2, RNA processing and splicing inmica3, and cell cycle and cell cycle process in mica5.
Since we are working with active modules that are goingto be further used to extract important pathways, we furtherperformed pathway enrichment analysis to better evaluatethe quality of the active modules. The results are shownin Table 2. Similar to GO annotations, some pathways arecommon between Mica, ICA, and DEGAS. For instance, bothdegas and mica5 were enriched with the cell cycle path-way, however, the p-value for degas was much smaller thanthe p-value in mica5. Remarkably, mica5 was enriched withmore cell cycle-related pathways, such as, the cell cycle,mitotic, and check points pathways, with BRCA1 commonamong most of these pathways. Mutations in BRCA1 leadto genetic instability and deficiency in the different cell cy-cle phases [14]. Additionally, its absence results in breastcancer formation.
Pathways that are highly enriched in both Mica and ICA
53/��$
53/��$
53/�
53/�
53/�$
53/�
53/��
53/��53/��$
53/��
53/��
53/3�
536�536�;
536�
536�
536��
536�� 536��
53/��
53/��
)$8
53/��
53/�
53/�
53/��53/��
53/�� 53/��
53/��$
53/��$
53/��
53/��$/
53/3�
536�
536��
536��
536��
536��
536��
536��
536��
8%$��
B
'',7�%$*�
&.$3�6(&��$
6(&��&6,/�
'1$-&��
('(0�
+(538'�
3',$�+63$�
'1$-&�(,)�$.� +63��%�
&$/5
26�
(5/(&�
:)6�
6<91�
6(/�/
('(0�
)%;2�3�+%
69,3$0)5
531�531�
13/2&�16)/�&&$31�
3',$�'(5/�
9,03$.7�
+,)�$
3'*)5%
5;5$
7*)%�
9(*)$
3,.�5�
$3&
)$6
003�
+63��%�
&2/�$�
&2/�$�
)1�
,7*$9
37(137.�
$.7�
$33/�
(�)�5%�
003�
)*)5�
6.3�
7*)%5�
7*)%5�/$0%�
7*)%�
3,$6�
67$7�
(�)�
1).%�
(5%%�
3,.�5�
06+�
06+�
&'.�
0<&
$%/�
3,.�5�
A
C
B
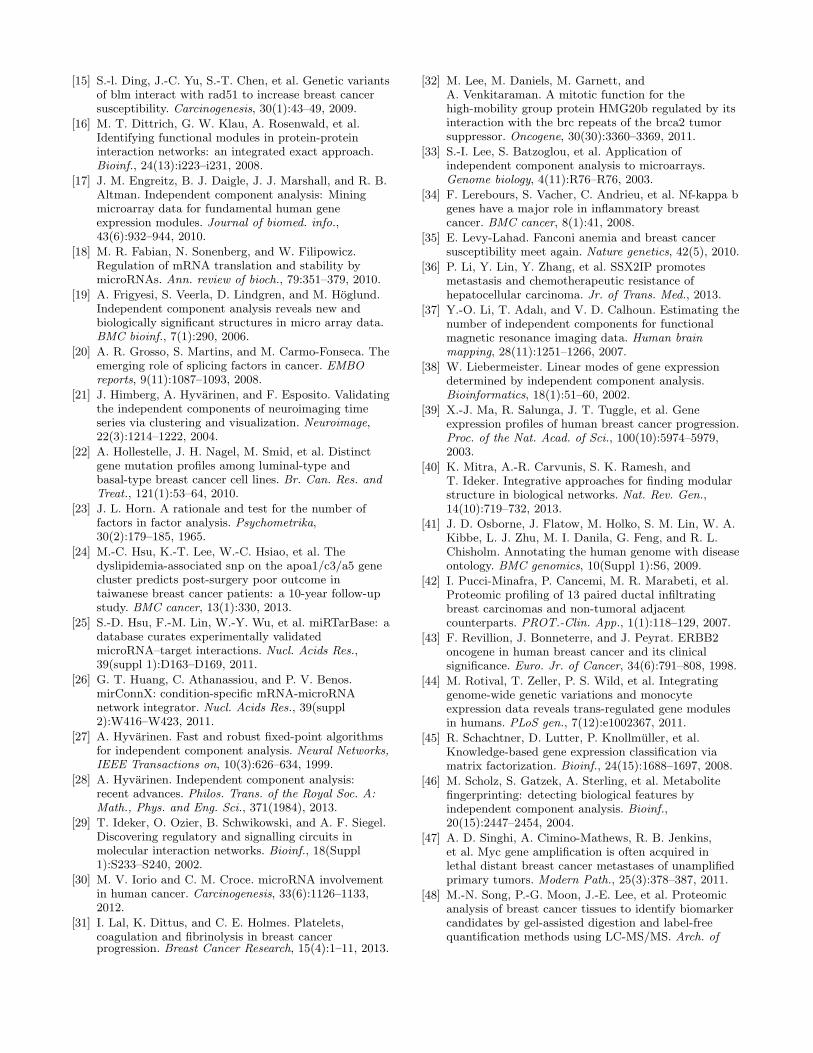
Figure 3: Overlap between Important pathways enriched inboth Mica and ICA modules. Orange is for Mica, blue isfor ICA, and green for genes in both. A) Pathways in can-cer (mica1 and ica5, B) Protein processing in endoplasmicreticulum (mica2 and ica1, C) Ribosome (mica7 and ica6
).
modules include the pathways in cancer, ribosome, and pro-tein processing in endoplasmic reticulum pathways. Fig-ure 3 shows the overlap between Mica and ICA on thosepathways. Pathways in cancer pathway is enriched in bothmica1 and ica5. Remarkably, mica1 contains key breastcancer genes including ERBB2, MYC, RB1, and NFKB1.Additionally, mica1 is more common across the samples thanica5. ERBB2 gene is a growth factor receptor that is over-expressed in breast cancer and usually related to the aggres-siveness of the tumor and the resistance to the chemother-apy [43]. RB1 gene is mutated in breast cancer [22] while theNFKB1 gene has a major rule in invasive breast cancer [34].MYC is a multifunctional protein that plays a role in cell cy-cle progression and cellular transformation. Amplification ofMYC is found to be a frequent event in breast cancer that isoften more associated with the metastatic version of the tu-mor [47]. The protein processing in endoplasmic reticulumpathway is another interesting pathway that is enriched inboth mica2 and ica1. The endoplasmic reticulum (ER) isan essential organelle involved in many important functionssuch as protein folding and secretion. In cancer cells, theunfolded protein response (UPR) and ER-associated degra-dation (ERAD) pathways, which are parts of the proteinprocessing in ER pathway, are both activated to help in thesurvival and the metastasis of the cancer cells [50]. Interest-ingly, EDEM1 and SEL1L genes (mica2 are important partsof the ERAD component in addition to being de-regulatedin cancer cells [50].
Since mica1, mica2, ica1, and ica5 contain interestingpathways, we further performed disease ontology enrichmentanalysis on these modules using FunDO [41]. The top dis-eases enriched in the modules, after Bonferroni correction,are: cancer (2.11×10⁻²¹) and breast cancer (1.11×10⁻⁴) inmica1, cancer (1.15× 10⁻³) in mica2, cancer (2.34× 10⁻¹²)

Table 2: Pathway enrichment analysis for Mica, ICA, and DEGAS modules on the ILC dataset.
Database Pathway MICA ICA DEGAS% pval Net % pval Net % pval
Reactome Unfolded Protein Response 23.81 6.78× 10−05 mica2 3.64 8.20× 10−03 ica4
Processing of Capped Intron-Containing Pre-mRNA 5.60 4.21× 10−03 mica1
mRNA Splicing 5.30 4.21× 10−03 mica3
Cell Cycle, Mitotic 18.48 1.19× 10⁻²¹ mica5 11.53 7.79× 10⁻³
Cell Cycle 19.96 7.30× 10⁻¹⁹ mica5 14.12 7.32× 10⁻³
Mitotic M-M/G1 phases 13.31 3.75× 10⁻¹⁸ mica5
Elastic fibre formation 4.74 4.05× 10−05 mica6 11.21 7.30× 10⁻¹¹ ica5
Molecules associated with elastic fibres 3.95 2.81× 10−04 mica6
3’ -UTR-mediated translational regulation 8.29 3.77× 10−05 mica7 22.41 8.20× 10⁻¹⁴ ica6
L13a-mediated translational silencing of Ceruloplasmin ex-pression
8.29 3.77× 10−05 mica7 22.41 8.20× 10⁻¹⁴ ica6
Formation of a pool of free 40S subunits 7.80 3.98× 10−05 mica7 19.83 5.30× 10⁻¹² ica6
Eukaryotic Translation Initiation 8.29 3.98× 10−05 mica7 18.97 3.03× 10⁻¹¹ ica6
Antigen Presentation: Folding, assembly and peptide loadingof class I MHC
4.52 1.62× 10−06 ica1
Interferon alpha/beta signaling 5.88 7.99× 10−05 ica1
Golgi Cisternae Pericentriolar Stack Reorganization 2.71 5.10× 10−04 ica1
ER-Phagosome pathway 4.98 6.98× 10−04 ica1
PERK regulated gene expression 2.19 3.49× 10−03 ica4
Toll Like Receptor 4 (TLR4) Cascade 5.47 4.25× 10−03 ica4
Cytokine Signaling in Immune system 10.21 4.25× 10−03 ica4
Antigen Presentation: Folding, assembly and peptide loadingof class I MHC
2.55 6.00× 10−03 ica4
Extracellular matrix organization 21.55 5.25× 10⁻¹⁵ ica5
Molecules associated with elastic fibres 9.48 3.27× 10−09 ica5
Integrin cell surface interactions 11.21 2.02× 10−07 ica5
Degradation of collagen 8.62 5.17× 10−06 ica5
Translation 24.13 8.66× 10⁻¹⁴ ica5
Cap-dependent Translation Initiation 22.41 8.66× 10⁻¹⁴ ica6
Eukaryotic Translation Initiation 22.41 8.66× 10⁻¹⁴ ica6
GTP hydrolysis and joining of the 60S ribosomal subunit 21.55 2.74× 10⁻¹³ ica6
GTP hydrolysis and joining of the 60S ribosomal subunit 21.55 2.74× 10⁻¹³ ica6
Peptide chain elongation 18.10 9.89× 10⁻¹¹ ica6
Nonsense Mediated Decay Independent of the Exon JunctionComplex
18.10 1.71× 10⁻¹⁰ ica6
Repair synthesis for gap-filling by DNA polymerase in TC-NER
1.73 7.32× 10⁻³
Removal of the Flap Intermediate from the C-strand 1.72 7.32× 10⁻³
Telomere Maintenance 3.75 7.32× 10⁻³
KEGG Pancreatic cancer 6.70 1.05× 10−04 mica1 6.03 4.15× 10−03 ica5
Pathways in cancer 15.24 1.05× 10−04 mica1 14.66 2.59× 10−03 ica5
Small cell lung cancer 7.31 1.05× 10−04 mica1 7.75 7.07× 10−04 ica5
Chronic myeloid leukemia 6.09 7.01× 10−04 mica1 6.89 1.26× 10−03 ica5
Colorectal cancer 5.49 8.10× 10−04 mica1 5.17 9.87× 10−03 ica5
Bladder cancer 4.27 2.18× 10−03 mica1
Prostate cancer 6.09 2.24× 10−03 mica1
Non-small cell lung cancer 74.27 8.10× 10−03 mica1
Protein processing in endoplasmic reticulum 52.38 4.65× 10⁻¹¹ mica2 12.22 1.10× 10−08 ica1
Spliceosome 6.19 1.24× 10−03 mica3
Osteoclast differentiation 8.70 1.85× 10−06 mica6
Complement and coagulation cascades 4.74 1.62× 10−03 mica6
Ribosome 7.07 1.76× 10⁻¹⁰ mica7 17.24 3.34× 10⁻¹⁴ ica6
ECM-receptor interaction 11.21 3.83× 10−07 ica6
Focal adhesion 16.28 3.83× 10−07 ica6
TGF-beta signaling pathway 7.76 7.07× 10−04 ica6
Renal cell carcinoma 6.03 4.15× 10−03 ica6
in ica5, and cancer (6.2×10⁻⁵) and Melanoma (1.1×10⁻⁴)in ica1. Clearly, mica1 is the most enriched and relatedmodule to cancer in general and breast cancer, in specific.
4.2 Results on IDC dataInvasive Ductal Carcinoma is another famous breast can-
cer subtype. Previous works showed that IDC and ILC actdifferently and have different sets of DE genes [59, 55]. Nev-ertheless, we expect to find some common pathways betweenthem, even though each pathway might include different setsof genes [52].
Similar to ILC, we first used the dataset with ICA and
Mica to see how different the output is when the miRNAdata is added. As shown in Table 1, there is a significantdifference between ICA and Mica modules. The Mica pro-duced more highly scoring modules than ICA. In addition,Mica produced 66 modules while ICA produced 35 mod-ules. We further analyzed the highest scoring modules fromthe two methods, namely, ica18, ica21, and ica30 from ICA
and mica7, mica15, mica33, mica42, and mica63 from Mica.Those modules are the highest scoring modules with a score> 60. By comparing between the modules from ICA andMica, we found that the most similar ones are mica42 andica30; with 266 genes exist in both. The remaining Mica

Table 3: The components obtained by ICA and Mica. #is the component number, S is the number of samples acomponent covers, |c| is the size of the component, |c|ppi isthe number of genes that are both in the component and thePPI network, N and E are the number of nodes and edges,respectively, for the largest connected module in the PPI,and scr(c) is the score of the largest connected module.
(a) ICA
# S |c| |c|ppi N E scr(c)1 418 533 477 114 140 42.292 130 643 556 95 105 24.53 201 507 441 130 182 45.784 199 660 488 72 92 22.365 15 638 542 102 124 30.086 278 385 333 69 122 20.867 28 388 341 118 179 52.088 11 53 49 4 3 4.319 0 45 37 2 1 3.1410 400 370 311 50 53 17.7211 88 187 169 7 6 6.1812 130 129 109 4 3 4.3713 184 492 419 55 69 33.414 693 812 659 185 248 40.8215 64 752 622 117 131 34.516 200 119 107 4 3 4.9117 246 500 450 97 108 41.9818 87 897 849 391 775 61.9519 145 263 231 25 25 11.1520 316 171 158 33 71 14.1921 123 744 669 303 522 61.4322 164 315 266 9 8 7.4923 136 386 343 77 109 46.1224 201 503 447 112 137 26.4725 253 423 376 110 153 49.6226 173 690 601 197 316 44.5327 29 3 2 2 0 3.428 216 145 122 5 4 5.129 6 708 612 186 234 34.5530 513 675 649 454 1851 83.6331 42 540 457 171 252 33.8332 38 603 502 111 140 27.5933 5 228 201 7 6 6.6534 16 749 588 176 220 45.6335 554 501 457 84 95 45.25
(b) Mica
# S |c| |c|ppi N E scr(c)1 324 595 538 154 182 45.822 76 571 526 212 329 37.713 523 535 473 68 78 35.54 308 289 245 22 23 11.285 319 679 604 169 249 37.616 134 412 376 52 57 18.077 296 400 374 147 234 61.788 174 655 592 188 266 36.249 296 380 329 50 57 19.5510 294 483 413 99 137 25.9711 414 661 583 136 176 34.8912 254 83 68 5 5 4.8513 516 323 279 34 35 14.6714 284 55 48 2 1 3.2715 336 317 267 42 47 59.7616 255 733 670 299 458 47.1917 216 542 425 67 86 36.6118 260 335 296 55 70 19.5919 319 159 145 58 98 18.620 325 623 510 62 66 25.4921 436 272 258 101 208 58.7922 20 565 473 54 58 28.3323 208 543 473 91 113 33.6324 262 570 512 167 275 34.725 309 532 483 184 244 57.4226 328 403 377 152 243 54.8627 278 455 389 80 88 31.3928 262 655 579 162 214 36.9929 237 341 303 13 13 9.1830 196 420 369 122 148 28.4231 257 682 602 202 726 50.7632 3 212 173 11 10 9.8333 245 289 280 138 297 79.6934 362 174 153 6 5 635 380 495 433 106 135 31.8136 160 768 662 286 909 54.7237 169 534 471 135 199 30.9838 166 700 619 178 218 36.739 132 665 607 197 298 36.4140 466 378 332 69 78 21.6141 246 156 153 8 8 6.8342 544 682 633 348 1063 66.9743 51 473 397 19 35 12.8144 209 8 7 7 0 5.8445 185 634 565 156 202 32.846 32 379 317 39 43 15.5247 214 444 379 53 66 29.848 450 248 217 18 17 9.949 278 290 247 38 42 15.1450 170 110 96 6 5 5.7851 300 4 4 4 0 4.2252 363 2 2 2 0 3.3853 179 5 5 5 0 5.0554 314 581 453 12 14 23.7455 0 731 618 161 192 48.3456 361 110 92 4 3 5.2657 374 289 255 17 20 11.9158 29 764 594 67 85 28.4859 496 1 1 1 0 2.4660 432 1 0 0 0 NA61 99 535 433 78 104 40.3762 306 457 425 60 68 20.3663 242 243 230 101 188 66.4364 186 565 506 163 222 49.8365 1 494 444 159 246 58.05
and ICA modules did not have any significant overlap.By further examining the genes in mica42 and ica30, we
found that both contain BRCA1, BRCA2, BRIP1, BLM,RAD51, UBE2C, and CKS2. BLM and RAD51 have a tu-morigenic significance [15], UBE2C and CKS2 are amongthe genes that are DE in IDC [39], and BRCA1, BRIP1, andBRCA2 are known breast cancer mutated 1. On the otherhand mica42 only contains TOP3A, HMG20B, RAD51C,CDC6, and U2AF1 genes. HMG20B gene interacts directlywith BRCA2. The inhibition, of the interaction betweenHMG20B and BRCA2 lead to progression of tumor [32].TOP3A and BLM genes interact with RMI1 gene forming acomplex that is very important in genome stability [7]. Themutations in this complex increase the risk of breast can-cer in addition to other types of cancer [5]. RAD51C genewas also found to be mutated in breast cancer [35]. The de-regulation of CDC6 poses a serious risk of carcinogenesis [36]while U2AF1 is a splicing factor protein that is mutated incancer in general [20].
The degas module on IDC data contains 386 genes with1, 056 interactions and 190 DE genes. Based on the qual-ity measure, the module has a p-value of 0, i.e., it cannotbe randomly obtained. There are 105 genes exist in de-
gas, ica30, and mica42 including BRIP1, RAD51, BLM,UBE2C, and CKS2. However, degas did not contain othercancer related genes including BRCA1, BRCA2, XRCC1,XRCC2, and RRM2. Additionally, none of the genes exclu-sively exist in mica42 exist in degas.
In addition to examining the different obtained modules,we performed classification analysis using the different mod-ules and datasets to ensure that the adjusted gene expressiondata better correlate with the disease behavior. Similar tothe ILC dataset, a SVM was trained on the active mod-ules obtained from each tool separately. Then, a 10-foldcross validation was performed using the original data forICA and DEGAS and modified gene expression data for Mica.The three tools almost performed the same with Mica hav-ing the least error of 0.0013. The error for ICA and DEGAS
was 0.0038 and 0.0063, respectively.To better evaluate ICA, DEGAS, and Mica modules, we
further performed pathway enrichment analysis, as shownin Table 5. There are a lot of pathways common betweenmica42, mica30, and degas such as Cell cycle, Tolemeremaintenance, and DNA strand elongation. However, mica42alone was enriched with the p53 signaling pathway. Inter-estingly, there are many important pathways enriched inmica15 which were not enriched in any other tools, includ-ing the complement and coagulation cascades, platelet de-granulation, and Hemostasis pathways. All of these path-ways are part of the hemostatic system of the cell. Hemo-static elements are considered important in facilitating themetastatic potential of breast cancer [31]. Additionally, Aproteomic based study has shown the complement and co-agulation pathway to be DE in IDC( [48] . Figure 4 showsthe genes in mica15 module. Among the nodes in this net-work and also in the Hemostasis pathway is the APOA1gene. APOA1 gene was found DE in IDC samples vs controlsamples in a proteomic study [42]. In addition, mutationsin this gene lead to poor outcome for post-surgery breastcancer patients [24]. Other interesting genes in mica15 areGADD45A, GADD45B, and GADD45G genes. GADD45genes are stress sensor genes that are activated in respondto cell stress and DNA damage. GADD45 genes were found
1http://cancer.sanger.ac.uk/cancergenome/projects/census/

$32%
$32$�
35.$%�
*$''��**$''��$
*$''��%6(53,1*�
)� )��
0$)*775
&�
.1*�
&3%�
$3&6$32)
&)+&53
7*0�
3/*
971
$32$�&�%3$
)*%
)**
)*$
/%3
6(53,1(�0$63�
+3
6(53,1)�
0$63�
&�
3/,1�$32&�&<3�(�
$32&�
250�
/$0&�&�%
6$$�=1)���
Figure 4: mica15 module. The red nodes are for the nodesin the Hemostasis pathway.
Table 4: DO enrichment analysis for ICA, DEGAS, and Mica.
name DO Corrected p-valuemica7 cancer 5.38× 10⁻⁷
mica15 liver cancer, systematic infection,metastatic to brain
4.67×10⁻⁹, 1.16×10−8,6.66× 10−8
mica33 cancer 5.2× 10⁻⁵
mica42 cancer, breast cancer 6.21×10⁻³⁵, 5.72×10⁻⁷
mica63 cancer 2.30× 10⁻⁴
ica18 breast cancer, cancer 4.59×10⁻⁶, 6.21×10⁻³⁵
ica21 cancer 1.36× 10⁻⁵
ica30 cancer, breast cancer 2.78×10−33,1.96×10−6
degas cancer, breast cancer 1.78×10⁻¹⁴, 3.14×10⁻⁴
down-regulated in cancer. Additionally, they are consideredas potential therapeutic targets in cancer [12].
The DO enrichment analysis using FunDO is showed inTable 4. In general, Mica and MICA modules are significantlyenriched with cancer and breast cancer genes than DEGAS,with Mica better enriched with breast cancer and cancerthan ICA. Additionally, mica15 is enriched with metastaticto brain disease genes with APOA1 among those genes.
5. CONCLUSIONSThe unprecedented amount of publicly available disease-
related data encourages the development of new methodolo-gies and algorithms for a better analysis and further under-standing the disease behavior. In this work, we proposeda new workflow, Mica, that successfully integrates miRNAdata, mRNA data, and PPI network in a novel way to obtainactive modules which can serve as powerful biomarkers.
The experimental results show that the modules found byMica are more disease-related while unraveling new depen-dencies between the genes which were hidden via previoustechniques. Albeit the simplicity of the proposed workflow,Mica successfully includes many novel ideas, including howwe adjust the gene expression levels with the miRNA ex-pression to mimic the protein expression level and how wework on the genes first to get the related ones and mapthem to the PPI network rather than working only on thegenes existing in the PPI. To the best of our knowledge, thisis the first study that integrates miRNA, mRNA, and PPInetwork information for active module extraction. Further-more, Mica provides information regarding which modulesare active in which set of samples, hence, making it easierto understand the disease behavior for different patients.
The results obtained from IDC and ILC datasets show theability of Mica to generate disease specific modules. Still,there are some pathways common between IDC and ILC,such as the cell cycle pathway with BRCA1 and BRCA2retrieved with Mica in both datasets.
Further improvements for Mica would add more value andmore understanding for the results. For instance, it wouldbe more beneficial to extract a smaller module of 10 or 20
genes from each module that can be further used as a mod-ule biomarker. Additionally, each module can be broken intosmaller ones and each can be considered as a possible path-way. Hence, we can further understand how the differentpathways interact together. Pathways extraction can alsobenefit from adding directionality information to the PPInetwork. We are planning to tackle all such improvementsin our future work.6. ACKNOWLEDGMENTS
Funding: This work was partially supported by the NHI/NCIgrant R01CA141090.
7. REFERENCES[1] D. Baek, J. Villen, C. Shin, et al. The impact of
micrornas on protein output. Nature, 455(7209):64–71,2008.
[2] A.-L. Barabasi, N. Gulbahce, and J. Loscalzo. Networkmedicine: a network-based approach to humandisease. Nature Reviews Genetics, 12(1):56–68, 2011.
[3] A. J. Bell and T. J. Sejnowski. Aninformation-maximization approach to blindseparation and blind deconvolution. Neuralcomputation, 7(6):1129–1159, 1995.
[4] C. Blenkiron, L. D. Goldstein, N. P. Thorne, et al.Microrna expression profiling of human breast canceridentifies new markers of tumor subtype. GenomeBiol, 8(10):R214, 2007.
[5] K. Broberg, E. Huynh, K. S. Engstrom, et al.Association between polymorphisms in rmi1, top3a,and blm and risk of cancer, a case-control study. BMCcancer, 9(1):140, 2009.
[6] J.-F. Cardoso and A. Souloumiac. Blind beamformingfor non-gaussian signals. In IEE Proceedings F (Radarand Signal Processing), volume 140, pages 362–370.IET, 1993.
[7] K.-L. Chan, P. S. North, and I. D. Hickson. Blm isrequired for faithful chromosome segregation and itslocalization defines a class of ultrafine anaphasebridges. The EMBO journal, 26(14):3397–3409, 2007.
[8] X. Chang, T. Xu, Y. Li, and K. Wang. Dynamicmodular architecture of protein-protein interactionnetworks beyond the dichotomy of date and partyhubs. Scientific reports, 3, 2013.
[9] S. Chavali, S. Bruhn, K. Tiemann, et al. MicroRNAsact complementarily to regulate disease-relatedmRNA modules in human diseases. RNA,19(11):1552–1562, 2013.
[10] P. Chiappetta, M.-C. Roubaud, and B. Torresani.Blind source separation and the analysis of microarraydata. Journal of Comp Biol, 11(6):1090–1109, 2004.
[11] D.-Y. Cho, Y.-A. Kim, and T. M. Przytycka. Networkbiology approach to complex diseases. PLoS comp biol,8(12):e1002820, 2012.
[12] A. Cretu, X. Sha, J. Tront, et al. Stress sensor gadd45genes as therapeutic targets in cancer. Cancer therapy,7(A):268, 2009.
[13] Y. Cun and H. Frohlich. Network and data integrationfor biomarker signature discovery via networksmoothed t-statistics. PloS one, 8(9):e73074, 2013.
[14] C.-X. Deng. Brca1: cell cycle checkpoint, geneticinstability, dna damage response and cancer evolution.Nucleic acids research, 34(5):1416–1426, 2006.
[15] S.-l. Ding, J.-C. Yu, S.-T. Chen, et al. Genetic variantsof blm interact with rad51 to increase breast cancersusceptibility. Carcinogenesis, 30(1):43–49, 2009.
[16] M. T. Dittrich, G. W. Klau, A. Rosenwald, et al.Identifying functional modules in protein-proteininteraction networks: an integrated exact approach.Bioinf., 24(13):i223–i231, 2008.
[17] J. M. Engreitz, B. J. Daigle, J. J. Marshall, and R. B.Altman. Independent component analysis: Miningmicroarray data for fundamental human geneexpression modules. Journal of biomed. info.,43(6):932–944, 2010.
[18] M. R. Fabian, N. Sonenberg, and W. Filipowicz.Regulation of mRNA translation and stability bymicroRNAs. Ann. review of bioch., 79:351–379, 2010.
[19] A. Frigyesi, S. Veerla, D. Lindgren, and M. Hoglund.Independent component analysis reveals new andbiologically significant structures in micro array data.BMC bioinf., 7(1):290, 2006.
[20] A. R. Grosso, S. Martins, and M. Carmo-Fonseca. Theemerging role of splicing factors in cancer. EMBOreports, 9(11):1087–1093, 2008.
[21] J. Himberg, A. Hyvarinen, and F. Esposito. Validatingthe independent components of neuroimaging timeseries via clustering and visualization. Neuroimage,22(3):1214–1222, 2004.
[22] A. Hollestelle, J. H. Nagel, M. Smid, et al. Distinctgene mutation profiles among luminal-type andbasal-type breast cancer cell lines. Br. Can. Res. andTreat., 121(1):53–64, 2010.
[23] J. L. Horn. A rationale and test for the number offactors in factor analysis. Psychometrika,30(2):179–185, 1965.
[24] M.-C. Hsu, K.-T. Lee, W.-C. Hsiao, et al. Thedyslipidemia-associated snp on the apoa1/c3/a5 genecluster predicts post-surgery poor outcome intaiwanese breast cancer patients: a 10-year follow-upstudy. BMC cancer, 13(1):330, 2013.
[25] S.-D. Hsu, F.-M. Lin, W.-Y. Wu, et al. miRTarBase: adatabase curates experimentally validatedmicroRNA–target interactions. Nucl. Acids Res.,39(suppl 1):D163–D169, 2011.
[26] G. T. Huang, C. Athanassiou, and P. V. Benos.mirConnX: condition-specific mRNA-microRNAnetwork integrator. Nucl. Acids Res., 39(suppl2):W416–W423, 2011.
[27] A. Hyvarinen. Fast and robust fixed-point algorithmsfor independent component analysis. Neural Networks,IEEE Transactions on, 10(3):626–634, 1999.
[28] A. Hyvarinen. Independent component analysis:recent advances. Philos. Trans. of the Royal Soc. A:Math., Phys. and Eng. Sci., 371(1984), 2013.
[29] T. Ideker, O. Ozier, B. Schwikowski, and A. F. Siegel.Discovering regulatory and signalling circuits inmolecular interaction networks. Bioinf., 18(Suppl1):S233–S240, 2002.
[30] M. V. Iorio and C. M. Croce. microRNA involvementin human cancer. Carcinogenesis, 33(6):1126–1133,2012.
[31] I. Lal, K. Dittus, and C. E. Holmes. Platelets,coagulation and fibrinolysis in breast cancerprogression. Breast Cancer Research, 15(4):1–11, 2013.
[32] M. Lee, M. Daniels, M. Garnett, andA. Venkitaraman. A mitotic function for thehigh-mobility group protein HMG20b regulated by itsinteraction with the brc repeats of the brca2 tumorsuppressor. Oncogene, 30(30):3360–3369, 2011.
[33] S.-I. Lee, S. Batzoglou, et al. Application ofindependent component analysis to microarrays.Genome biology, 4(11):R76–R76, 2003.
[34] F. Lerebours, S. Vacher, C. Andrieu, et al. Nf-kappa bgenes have a major role in inflammatory breastcancer. BMC cancer, 8(1):41, 2008.
[35] E. Levy-Lahad. Fanconi anemia and breast cancersusceptibility meet again. Nature genetics, 42(5), 2010.
[36] P. Li, Y. Lin, Y. Zhang, et al. SSX2IP promotesmetastasis and chemotherapeutic resistance ofhepatocellular carcinoma. Jr. of Trans. Med., 2013.
[37] Y.-O. Li, T. Adalı, and V. D. Calhoun. Estimating thenumber of independent components for functionalmagnetic resonance imaging data. Human brainmapping, 28(11):1251–1266, 2007.
[38] W. Liebermeister. Linear modes of gene expressiondetermined by independent component analysis.Bioinformatics, 18(1):51–60, 2002.
[39] X.-J. Ma, R. Salunga, J. T. Tuggle, et al. Geneexpression profiles of human breast cancer progression.Proc. of the Nat. Acad. of Sci., 100(10):5974–5979,2003.
[40] K. Mitra, A.-R. Carvunis, S. K. Ramesh, andT. Ideker. Integrative approaches for finding modularstructure in biological networks. Nat. Rev. Gen.,14(10):719–732, 2013.
[41] J. D. Osborne, J. Flatow, M. Holko, S. M. Lin, W. A.Kibbe, L. J. Zhu, M. I. Danila, G. Feng, and R. L.Chisholm. Annotating the human genome with diseaseontology. BMC genomics, 10(Suppl 1):S6, 2009.
[42] I. Pucci-Minafra, P. Cancemi, M. R. Marabeti, et al.Proteomic profiling of 13 paired ductal infiltratingbreast carcinomas and non-tumoral adjacentcounterparts. PROT.-Clin. App., 1(1):118–129, 2007.
[43] F. Revillion, J. Bonneterre, and J. Peyrat. ERBB2oncogene in human breast cancer and its clinicalsignificance. Euro. Jr. of Cancer, 34(6):791–808, 1998.
[44] M. Rotival, T. Zeller, P. S. Wild, et al. Integratinggenome-wide genetic variations and monocyteexpression data reveals trans-regulated gene modulesin humans. PLoS gen., 7(12):e1002367, 2011.
[45] R. Schachtner, D. Lutter, P. Knollmuller, et al.Knowledge-based gene expression classification viamatrix factorization. Bioinf., 24(15):1688–1697, 2008.
[46] M. Scholz, S. Gatzek, A. Sterling, et al. Metabolitefingerprinting: detecting biological features byindependent component analysis. Bioinf.,20(15):2447–2454, 2004.
[47] A. D. Singhi, A. Cimino-Mathews, R. B. Jenkins,et al. Myc gene amplification is often acquired inlethal distant breast cancer metastases of unamplifiedprimary tumors. Modern Path., 25(3):378–387, 2011.
[48] M.-N. Song, P.-G. Moon, J.-E. Lee, et al. Proteomicanalysis of breast cancer tissues to identify biomarkercandidates by gel-assisted digestion and label-freequantification methods using LC-MS/MS. Arch. of

Pharm. Res., 35(10):1839–1847, 2012.
[49] A. E. Teschendorff, M. Journee, P. A. Absil, et al.Elucidating the altered transcriptional programs inbreast cancer using independent component analysis.PLoS Comp. Biol., 3(8):e161, 2007.
[50] Y. C. Tsai and A. M. Weissman. The unfolded proteinresponse, degradation from the endoplasmic reticulum,and cancer. Genes & cancer, 1(7):764–778, 2010.
[51] J. S. Tsang, M. S. Ebert, and A. van Oudenaarden.Genome-wide dissection of microrna functions andcotargeting networks using gene set signatures.Molecular cell, 38(1):140–153, 2010.
[52] G. Turashvili, J. Bouchal, K. Baumforth, et al. Novelmarkers for differentiation of lobular and ductalinvasive breast carcinomas by laser microdissectionand microarray analysis. BMC Cancer, 7(1):55, 2007.
[53] I. Ulitsky, A. Krishnamurthy, R. M. Karp, andR. Shamir. DEGAS: de novo discovery of dysregulatedpathways in human diseases. PLoS One, 5(10):e13367,2010.
[54] R. A. Verdugo, T. Zeller, M. Rotival, et al. Graphicalmodeling of gene expression in monocytes suggests
molecular mechanisms explaining increasedatherosclerosis in smokers. PloS one, 8(1):e50888,2013.
[55] N. Wasif, M. A. Maggard, C. Y. Ko, et al. Invasivelobular vs. ductal breast cancer: a stage-matchedcomparison of outcomes. Ann. of Surg. Oncol.,17(7):1862–1869, 2010.
[56] G. Yu. ReactomePA: Reactome Pathway Analysis,2014. R package version 1.4.0.
[57] G. Yu, L. Wang, Y. Han, and Q. He. clusterprofiler:an r package for comparing biological themes amonggene clusters. OMICS: A Jr. of Int. Biol.,16(5):284–287, 2012.
[58] S. Zhang, C.-C. Liu, W. Li, et al. Discovery ofmulti-dimensional modules by integrative analysis ofcancer genomic data. Nucl. Acids Res.,40(19):9379–9391, 2012.
[59] H. Zhao, A. Langerød, Y. Ji, et al. Different geneexpression patterns in invasive lobular and ductalcarcinomas of the breast. Mol. Biol. of the Cell,15(6):2523–2536, 2004.

Database Pathway MICA ICA DEGAS% pval Name % pval Name % pval
KEGG Complement and coagulation cascades 42.86 1.17× 10⁻²³ mica15
Staphylococcus aureus infection 14.29 2.97× 10⁻⁵ mica15
DNA replication 6.32 6.68× 10⁻¹⁷ mica42 5.51 1.13× 10⁻¹⁸ ica30
Cell cycle 11.21 6.68× 10⁻¹⁷ mica42 10.13 1.13× 10⁻¹⁸ mica30 6.22 3.04× 10⁻⁴
Mismatch repair 3.16 5.53× 10−07 mica42 3.30 1.11× 10⁻¹⁰ ica30
Nucleotide excision repair 3.45 1.62× 10⁻⁴ mica42 3.3 9.57× 10⁻⁶ mica30
Homologous recombination 2.59 3.57× 10−04 mica42 2.64 6.97× 10−06 ica30
Base excision repair 2.59 1.65× 10−03 mica42 2.64 5.46× 10−05 ica30
p53 signaling pathway 3.45 7.86× 10−03 mica42
Spliceosome 6.60 8.20× 10−04 ica21
Oocyte meiosis 4.63 1.43× 10−03 ica30
Reactome Formation of Fibrin Clot (Clotting Cascade) 16.67 2.68× 10⁻⁸ mica15
Complement cascade 16.67 3.60× 10⁻⁸ mica15
Platelet degranulation 21.43 6.66× 10−08 mica15
Common Pathway 11.90 6.66× 10−08 mica15
Response to elevated platelet cytosolic Ca2+ 21.43 7.88× 10⁻⁸ mica15
Chylomicron-mediated lipid transport 9.52 7.98× 10−06 mica15
Platelet activation, signaling and aggregation 23.81 9.16× 10−06 mica15
Intrinsic Pathway 9.52 2.81× 10−05 mica15
Retinoid metabolism and transport 11.90 4.16× 10−05 mica15
Terminal pathway of complement 7.14 5.70× 10⁻⁵ mica15
Lipoprotein metabolism 9.52 6.14× 10⁻⁵ mica15
Hemostasis 30.95 6.80× 10−05 mica15
Visual phototransduction 11.9 1.29× 10⁻⁴ mica15
Dissolution of Fibrin Clot 7.14 1.29× 10⁻⁴ mica15
Diseases associated with visual transduction 11.90 1.29× 10−04 mica15
Platelet Aggregation (Plug Formation) 9.52 3.18× 10−04 mica15
p130Cas linkage to MAPK signaling for integrins 7.14 3.97× 10−04 mica15
GRB2:SOS provides linkage to MAPK signaling for Intergrins 7.14 3.97× 10−04 mica15
Lectin pathway of complement activation 4.76 4.20× 10⁻⁴ mica15
Lipid digestion, mobilization, and transport 9.52 4.27× 10⁻⁴ mica15
Integrin alphaIIb beta3 signaling 7.14 2.07× 10⁻³ mica15
Transport of gamma-carboxylated protein precursors from theendoplasmic reticulum to the Golgi apparatus
4.76 4.06× 10⁻³ mica15
Creation of C4 and C2 activators 4.76 4.06× 10⁻³ mica15
Removal of aminoterminal propeptides from gamma-carboxylated proteins
4.76 4.65× 10⁻³ mica15
Gamma-carboxylation of protein precursors 4.76 4.65× 10⁻³ mica15
Amyloids 9.52 5.11× 10⁻³ mica15
Integrin cell surface interactions 9.52 5.14× 10⁻³ mica15
Gamma-carboxylation, transport, and amino-terminal cleav-age of proteins
4.76 6.03× 10⁻³ mica15
HDL-mediated lipid transport 4.76 6.86× 10⁻³ mica15
Binding and Uptake of Ligands by Scavenger Receptors 4.76 8.30× 10⁻³ mica15
Scavenging of Heme from Plasma 4.76 8.30× 10⁻³ mica15
Regulation of Complement cascade 4.76 8.30× 10⁻³ mica15
mRNA Splicing 9.42 1.52× 10−04 mica33 6.60 7.65× 10−05 ica21
mRNA Splicing - Major Pathway 9.42 1.52× 10⁻⁴ mica33 6.6 7.65× 10⁻⁵ mica21
Processing of Capped Intron-Containing Pre-mRNA 9.42 1.52× 10⁻⁴ mica33 6.6 9.06× 10⁻⁵ mica21
mRNA Processing 10.14 1.52× 10−04 mica33 6.93 2.45× 10−04 ica21
Cell Cycle, Mitotic 32.76 3.86× 10−52 mica42 31.28 4.26× 10−64 ica30 17.62 4.74× 10⁻¹³
Cell Cycle 35.06 4.67× 10−49 mica42 33.26 7.77× 10−59 mica30 21.76 3.46× 10⁻¹⁶
Mitotic M-M/G1 phases 23.28 3.79× 10−39 mica42 20.48 9.30× 10−41 mica30 13.73 4.74× 10⁻¹³
Mitotic Prometaphase 13.79 3.81× 10⁻²⁷ mica42 12.56 5.37× 10⁻³¹ mica30 7.51 1.88× 10⁻⁸
DNA strand elongation 7.18 3.92× 10⁻²⁵ mica42 5.95 6.16× 10⁻²⁶ ica30 2.59 1.45× 10−04
Resolution of Sister Chromatid Cohesion 12.07 1.57× 10⁻²² mica42 11.45 9.46× 10⁻²⁸ ica30 6.74 2.29× 10−07
M Phase 16.67 1.69× 10⁻²² mica42 15.2 7.73× 10⁻²⁵ mica30 11.4 5.22× 10⁻¹⁰
DNA Replication 10.92 3.10× 10⁻²¹ mica42 8.59 2.57× 10⁻¹⁸ mica30 5.7 3.70× 10⁻⁶
Activation of the pre-replicative complex 6.32 1.20× 10⁻¹⁹ mica42 5.07 9.03× 10⁻¹⁹ mica30 2.33 1.01× 10⁻³
G2/M Checkpoints 7.47 1.66× 10⁻¹⁹ mica42 6.39 2.02× 10⁻²⁰ mica30 4.4 7.13× 10⁻⁸
S Phase 11.21 3.69× 10⁻¹⁹ mica42 10.57 4.78× 10⁻²³ mica30 6.74 4.03× 10⁻⁷
Mitotic G1-G1/S phases 11.78 1.30× 10⁻¹⁸ mica42 10.13 1.68× 10⁻¹⁸ mica30 6.74 4.94× 10⁻⁶
Synthesis of DNA 9.77 1.80× 10⁻¹⁸ mica42 7.71 7.13× 10⁻¹⁶ mica30 5.44 4.36× 10⁻⁶
Mitotic Metaphase and Anaphase 13.51 2.96× 10⁻¹⁷ mica42 13 3.69× 10⁻²¹ mica30 9.33 8.39× 10⁻⁸
Mitotic Anaphase 13.22 1.35× 10⁻¹⁶ mica42 12.78 1.56× 10⁻²⁰ mica30 9.33 8.17× 10⁻⁸
Activation of ATR in response to replication stress 6.32 1.64× 10⁻¹⁶ mica42 5.29 1.56× 10⁻¹⁶ mica30 3.63 1.94× 10⁻⁶
G1/S Transition 9.77 6.96× 10⁻¹⁶ mica42 8.37 9.68× 10⁻¹⁶ mica30 6.48 3.82× 10⁻⁷
Separation of Sister Chromatids 12.36 1.84× 10⁻¹⁵ mica42 12.11 1.03× 10⁻¹⁹ mica30 8.55 4.86× 10⁻⁷
Telomere C-strand (Lagging Strand) Synthesis 4.6 4.39× 10⁻¹⁵ mica42 3.96 1.78× 10⁻¹⁶ mica30
Chromosome Maintenance 9.77 1.40× 10⁻¹⁴ mica42 8.81 7.82× 10⁻¹⁶ mica30 5.96 2.29× 10⁻⁵
Extension of Telomeres 4.6 3.55× 10⁻¹⁴ mica42 3.96 2.32× 10⁻¹⁵ mica30
Unwinding of DNA 3.16 1.78× 10⁻¹³ mica42 2.42 3.05× 10⁻¹² mica30 1.55 2.68× 10⁻⁴
E2F mediated regulation of DNA replication 5.17 3.40× 10⁻¹³ mica42 3.96 2.55× 10⁻¹¹ mica30 2.07 8.80× 10⁻³

Cell Cycle Checkpoints 9.48 4.77× 10⁻¹³ mica42 8.15 1.15× 10⁻¹² mica30 8.03 1.94× 10⁻⁹
Lagging Strand Synthesis 4.02 6.05× 10⁻¹³ mica42 3.52 1.96× 10⁻¹⁴ mica30
Leading Strand Synthesis 3.45 6.05× 10⁻¹³ mica42 2.64 1.40× 10⁻¹¹ ica30
Polymerase switching 3.45 6.05× 10⁻¹³ mica42 2.64 1.40× 10⁻¹¹ ica30
Polymerase switching on the C-strand of the telomere 3.45 6.05× 10⁻¹³ mica42 2.64 1.40× 10⁻¹¹ mica30
DNA Repair 8.62 3.75× 10⁻¹² mica42 8.15 2.16× 10⁻¹⁴ ica30
DNA Replication Pre-Initiation 6.90 2.29× 10⁻¹¹ mica42 5.51 8.67× 10⁻¹⁰ ica30 4.4 7.74× 10−05
M/G1 Transition 6.90 2.29× 10⁻¹¹ mica42 5.51 8.67× 10⁻¹⁰ ica30 4.40 7.74× 10−05
Gap-filling DNA repair synthesis and ligation in TC-NER 3.16 4.05× 10⁻¹⁰ mica42 2.86 6.15× 10⁻¹² mica30
Gap-filling DNA repair synthesis and ligation in GG-NER 3.16 4.05× 10⁻¹⁰ mica42 2.86 6.15× 10⁻¹² mica30
G0 and Early G1 3.74 3.16× 10⁻⁹ mica42 3.08 5.41× 10⁻⁹ mica30
Repair synthesis for gap-filling by DNA polymerase in TC-NER
2.87 4.86× 10⁻⁹ mica42 2.64 5.77× 10⁻¹¹ mica30
Repair synthesis of patch 27-30 bases long by DNA poly-merase
2.87 4.86× 10⁻⁹ mica42 2.64 5.77× 10⁻¹¹ mica30
Condensation of Prometaphase Chromosomes 2.59 7.26× 10⁻⁹ mica42 1.76 1.63× 10⁻⁶ mica30 1.55 4.81× 10⁻⁴
G1/S-Specific Transcription 2.87 1.17× 10⁻⁸ mica42 2.2 1.36× 10⁻⁷ mica30 1.55 2.64× 10⁻³
Processive synthesis on the lagging strand 2.59 1.35× 10⁻⁷ mica42 2.42 2.11× 10⁻⁹ mica30
DNA replication initiation 1.72 2.31× 10⁻⁷ mica42 1.32 9.12× 10⁻⁷ mica30
Telomere C-strand synthesis initiation 1.72 2.31× 10−07 mica42 1.32 9.12× 10−07 ica30
Telomere Maintenance 5.17 2.68× 10−07 mica42 4.41 4.87× 10−07 ica30 3.63 1.01× 10−03
Fanconi Anemia pathway 3.16 8.48× 10−07 mica42 2.86 1.23× 10−07 ica30
Removal of the Flap Intermediate 2.30 1.37× 10−06 mica42 2.20 2.13× 10−08 ica30
Global Genomic NER (GG-NER) 3.45 1.75× 10−06 mica42 3.08 4.60× 10−07 ica30
Regulation of DNA replication 4.6 6.64× 10⁻⁶ mica42 3.3 4.84× 10⁻⁴ mica30 4.15 7.20× 10⁻⁵
Removal of licensing factors from origins 4.6 6.64× 10⁻⁶ mica42 3.3 4.84× 10⁻⁴ mica30 4.15 7.20× 10⁻⁵
Nucleosome assembly 4.31 1.03× 10⁻⁵ mica42 3.52 4.33× 10⁻⁵ mica30 4.4 4.74× 10⁻⁶
Deposition of New CENPA-containing Nucleosomes at theCentromere
4.31 1.03× 10⁻⁵ mica42 3.52 4.33× 10⁻⁵ mica30 4.4 4.74× 10⁻⁶
Phosphorylation of Emi1 1.44 2.04× 10−05 mica42 1.10 5.57× 10−05 ica30
Cyclin A/B1 associated events during G2/M transition 2.01 2.40× 10⁻⁵ mica42 1.98 4.72× 10⁻⁷ mica30 2.07 9.42× 10⁻⁶
Nucleotide Excision Repair 3.74 2.40× 10−05 mica42 3.30 1.33× 10−05 ica30
Transcription-coupled NER (TC-NER) 3.45 3.60× 10−05 mica42 3.08 1.46× 10−05 ica30
Orc1 removal from chromatin 4.02 1.03× 10⁻⁴ mica42 2.86 3.86× 10⁻³ mica30 3.89 1.82× 10⁻⁴
Switching of origins to a post-replicative state 4.02 1.03× 10⁻⁴ mica42 2.86 3.86× 10⁻³ mica30 3.89 1.82× 10⁻⁴
Nuclear Envelope Breakdown 2.01 1.09× 10⁻⁴ mica42 1.54 4.41× 10⁻⁴ mica30 1.55 3.78× 10⁻³
Assembly of the pre-replicative complex 3.74 1.66× 10⁻⁴ mica42 2.64 5.40× 10⁻³ mica30 3.63 2.66× 10⁻⁴
Inhibition of replication initiation of damaged DNA byRB1/E2F1
1.72 2.02× 10⁻⁴ mica42 1.32 6.39× 10⁻⁴ mica30
Cyclin B2 mediated events 1.15 2.65× 10⁻⁴ mica42 1.1 1.10× 10⁻⁵ mica30 1.3 2.00× 10⁻⁵
Chk1/Chk2(Cds1) mediated inactivation of Cyclin B:Cdk1complex
1.15 2.65× 10⁻⁴ mica42 1.1 1.10× 10⁻⁵ mica30 1.04 8.63× 10⁻⁴
APC/C-mediated degradation of cell cycle proteins 4.31 4.54× 10⁻⁴ mica42 3.74 6.24× 10⁻⁴ mica30 4.66 7.87× 10⁻⁵
Regulation of mitotic cell cycle 4.31 4.54× 10⁻⁴ mica42 3.74 6.24× 10⁻⁴ mica30 4.66 7.87× 10⁻⁵
E2F-enabled inhibition of pre-replication complex formation 1.44 5.67× 10⁻⁴ mica42 1.32 1.07× 10⁻⁴ mica30
Homologous Recombination Repair 1.72 7.34× 10⁻⁴ mica42 1.98 2.04× 10⁻⁶ mica30
Homologous recombination repair of replication-independentdouble-strand breaks
1.72 7.34× 10⁻⁴ mica42 1.98 2.04× 10⁻⁶ mica30
Processive synthesis on the C-strand of the telomere 1.44 9.48× 10⁻⁴ mica42 1.54 1.33× 10⁻⁵ mica30
Double-Strand Break Repair 2.01 1.17× 10⁻³ mica42 2.42 1.54× 10⁻⁶ mica30
Activation of NIMA Kinases NEK9, NEK6, NEK7 1.15 1.49× 10⁻³ mica42 0.88 3.18× 10⁻³ mica30
G2/M DNA damage checkpoint 1.44 1.49× 10⁻³ mica42 1.32 3.94× 10⁻⁴ mica30
Kinesins 2.59 1.51× 10⁻³ mica42 2.64 8.91× 10⁻⁵ mica30 2.59 1.48× 10⁻³
Base Excision Repair 1.72 1.95× 10⁻³ mica42 1.32 6.00× 10⁻³ mica30
Resolution of Abasic Sites (AP sites) 1.72 1.95× 10⁻³ mica42 1.32 6.00× 10⁻³ mica30
CDC6 association with the ORC:origin complex 1.15 2.68× 10⁻³ mica42
G2/M DNA replication checkpoint 0.86 3.22× 10⁻³ mica42 0.88 1.31× 10⁻⁴ mica30 0.78 8.80× 10⁻³
Removal of the Flap Intermediate from the C-strand 1.15 7.17× 10⁻³ mica42 1.32 1.07× 10⁻⁴ mica30
G2 Phase 0.86 7.52× 10⁻³ mica42
Removal of DNA patch containing abasic residue 1.44 8.20× 10⁻³ mica42
Resolution of AP sites via the multiple-nucleotide patch re-placement pathway
1.44 8.20× 10⁻³ mica42
Regulation of APC/C activators between G1/S and earlyanaphase
3.45 8.57× 10⁻³ mica42 4.15 4.81× 10⁻⁴
Post-transcriptional Silencing By Small RNAs 1.79 1.49× 10−06 ica18
Pre-NOTCH Transcription and Translation 2.05 1.77× 10−05 ica18
Cohesin Loading onto Chromatin 1.53 1.41× 10−03 ica18
Pre-NOTCH Expression and Processing 2.05 3.32× 10⁻³ ica18
Small Interfering RNA (siRNA) Biogenesis 1.28 8.16× 10−03 ica18
Mitotic Telophase/Cytokinesis 1.53 8.16× 10−03 ica18
RNA Polymerase II Transcription Termination 3.3 2.18× 10⁻³ mica21
Cleavage of Growing Transcript in the Termination Region 3.3 2.18× 10⁻³ mica21
Post-Elongation Processing of the Transcript 3.3 2.18× 10⁻³ mica21
RNA Polymerase II Transcription 5.28 2.18× 10⁻³ mica21
Mitotic G2-G2/M phases 6.83 2.74× 10⁻¹¹ mica30
G2/M Transition 6.39 3.70× 10⁻¹⁰ mica30

Centrosome maturation 5.07 1.26× 10⁻⁷ mica30
Recruitment of mitotic centrosome proteins and complexes 5.07 1.26× 10⁻⁷ mica30
Loss of Nlp from mitotic centrosomes 3.96 2.04× 10⁻⁶ mica30
Loss of proteins required for interphase microtubule organiza-
tionaEfrom the centrosome
3.96 2.04× 10⁻⁶ mica30
Establishment of Sister Chromatid Cohesion 1.54 1.33× 10⁻⁵ mica30
Interactions of Rev with host cellular proteins 2.42 9.41× 10⁻⁵ mica30
Recruitment of NuMA to mitotic centrosomes 1.98 2.24× 10⁻⁴ mica30
Rev-mediated nuclear export of HIV-1 RNA 2.2 2.26× 10⁻⁴ mica30
Homologous DNA pairing and strand exchange 0.88 1.51× 10⁻³ mica30
Presynaptic phase of homologous DNA pairing and strand ex-change
0.88 1.51× 10⁻³ mica30
Nuclear import of Rev protein 1.98 1.52× 10⁻³ mica30
mRNA 3’-end processing 1.98 3.01× 10⁻³ mica30
Post-Elongation Processing of Intron-Containing pre-mRNA 1.98 3.01× 10⁻³ mica30
Transport of Mature Transcript to Cytoplasm 1.76 3.68× 10⁻³ mica30
Polo-like kinase mediated events 0.66 5.53× 10⁻³ mica30
Transport of Mature mRNA derived from an Intron-Containing Transcript
1.54 6.81× 10⁻³ mica30
Recruitment of repair and signaling proteins to double-strandbreaks
0.88 9.29× 10⁻³ mica30
Interactions of Vpr with host cellular proteins 1.76 9.87× 10⁻³ mica30
APC/C:Cdc20 mediated degradation of mitotic proteins 3.89 5.18× 10⁻⁴
Cdc20:Phospho-APC/C mediated degradation of Cyclin A 3.89 5.18× 10⁻⁴
Activation of APC/C and APC/C:Cdc20 mediated degrada-tion of mitotic proteins
3.89 5.93× 10⁻⁴
Meiotic Recombination 3.89 1.48× 10⁻³
Cyclin A:Cdk2-associated events at S phase entry 3.37 1.48× 10⁻³
Cyclin E associated events during G1/S transition 3.11 4.76× 10⁻³
Packaging Of Telomere Ends 2.59 5.17× 10⁻³
APC/C:Cdh1 mediated degradation of Cdc20 and otherAPC/C:Cdh1 targeted proteins in late mitosis/early G1
3.37 5.75× 10⁻³
Meiosis 4.4 6.10× 10⁻³
p53-Independent G1/S DNA damage checkpoint 2.59 8.80× 10−03
p53-Independent DNA Damage Response 2.59 8.80× 10⁻³
Ubiquitin Mediated Degradation of Phosphorylated Cdc25A 2.59 8.80× 10⁻³
G1/S DNA Damage Checkpoints 2.85 9.81× 10⁻³
Table 5: Pathway enrichment analysis for ICA, DEGAS, and Mica.