MFS Investors Trust Seriesfile/AG0057.pdf · MFS® Investors Trust Series MFS®...
31
Annual Report December 31, 2019 MFS ® Investors Trust Series MFS ® Variable Insurance Trust Beginning on January 1, 2021, as permitted by regulations adopted by the U.S. Securities and Exchange Commission, the insurance company that offers your contract may determine that it will no longer send you paper copies of the fund’s annual and semiannual shareholder reports unless you specifically request paper copies from the insurance company or from your financial intermediary. Instead, the shareholder reports will be made available on a Web site (insurancefunds.mfs.com or other Web site of which you will be notified), and the insurance company will notify you by mail each time a report is posted and provide you with a Web site link to access the report. Instructions for requesting paper copies will be provided by your insurance company or financial intermediary. If you already elected to receive shareholder reports by email, you will not be affected by this change and you need not take any action. If your insurance company or financial intermediary offers electronic delivery, you may elect to receive shareholder reports and other communications from the insurance company or financial intermediary by email by following the instructions provided by the insurance company or financial intermediary. Beginning on January 1, 2019, you may elect to receive all future reports in paper free of charge from the insurance company or financial intermediary. You can inform the insurance company or financial intermediary that you wish to continue receiving paper copies of your shareholder reports by contacting your insurance company or financial intermediary. Your election to receive reports in paper will apply to all funds held in your account with your insurance company or financial intermediary. VGI-ANN
Transcript of MFS Investors Trust Seriesfile/AG0057.pdf · MFS® Investors Trust Series MFS®...

Annual ReportDecember 31, 2019
MFS® Investors Trust Series
MFS® Variable Insurance Trust
Beginning on January 1, 2021, as permitted by regulations adopted by the U.S. Securities and Exchange Commission, the insurance company thatoffers your contract may determine that it will no longer send you paper copies of the fund’s annual and semiannual shareholder reports unlessyou specifically request paper copies from the insurance company or from your financial intermediary. Instead, the shareholder reports will bemade available on a Web site (insurancefunds.mfs.com or other Web site of which you will be notified), and the insurance company will notify youby mail each time a report is posted and provide you with a Web site link to access the report. Instructions for requesting paper copies will beprovided by your insurance company or financial intermediary.
If you already elected to receive shareholder reports by email, you will not be affected by this change and you need not take any action. If yourinsurance company or financial intermediary offers electronic delivery, you may elect to receive shareholder reports and other communicationsfrom the insurance company or financial intermediary by email by following the instructions provided by the insurance company or financialintermediary.
Beginning on January 1, 2019, you may elect to receive all future reports in paper free of charge from the insurance company or financialintermediary. You can inform the insurance company or financial intermediary that you wish to continue receiving paper copies of yourshareholder reports by contacting your insurance company or financial intermediary. Your election to receive reports in paper will apply to allfunds held in your account with your insurance company or financial intermediary.
VGI-ANN
MFS® Investors Trust Series
CONTENTS
Letter from the Executive Chair . . . . . . . . . . . . . . . . . . . . . . . . . . . . . . . . . . . . . . . 1Portfolio composition . . . . . . . . . . . . . . . . . . . . . . . . . . . . . . . . . . . . . . . . . . . . . . 2Management review . . . . . . . . . . . . . . . . . . . . . . . . . . . . . . . . . . . . . . . . . . . . . . . 3Performance summary . . . . . . . . . . . . . . . . . . . . . . . . . . . . . . . . . . . . . . . . . . . . . 5Expense table . . . . . . . . . . . . . . . . . . . . . . . . . . . . . . . . . . . . . . . . . . . . . . . . . . . . . 7Portfolio of investments . . . . . . . . . . . . . . . . . . . . . . . . . . . . . . . . . . . . . . . . . . . . 8Statement of assets and liabilities . . . . . . . . . . . . . . . . . . . . . . . . . . . . . . . . . . . . . 10Statement of operations . . . . . . . . . . . . . . . . . . . . . . . . . . . . . . . . . . . . . . . . . . . . 11Statements of changes in net assets . . . . . . . . . . . . . . . . . . . . . . . . . . . . . . . . . . . 12Financial highlights . . . . . . . . . . . . . . . . . . . . . . . . . . . . . . . . . . . . . . . . . . . . . . . . 13Notes to financial statements . . . . . . . . . . . . . . . . . . . . . . . . . . . . . . . . . . . . . . . . 15Report of independent registered public accounting firm . . . . . . . . . . . . . . . . . . 20Trustees and officers . . . . . . . . . . . . . . . . . . . . . . . . . . . . . . . . . . . . . . . . . . . . . . . 21Board review of investment advisory agreement . . . . . . . . . . . . . . . . . . . . . . . . . 24Proxy voting policies and information . . . . . . . . . . . . . . . . . . . . . . . . . . . . . . . . . . 26Quarterly portfolio disclosure . . . . . . . . . . . . . . . . . . . . . . . . . . . . . . . . . . . . . . . . 26Further information . . . . . . . . . . . . . . . . . . . . . . . . . . . . . . . . . . . . . . . . . . . . . . . . 26Information about fund contracts and legal claims . . . . . . . . . . . . . . . . . . . . . . . 26Federal tax information . . . . . . . . . . . . . . . . . . . . . . . . . . . . . . . . . . . . . . . . . . . . . 26MFS® privacy notice . . . . . . . . . . . . . . . . . . . . . . . . . . . . . . . . . . . . . . . . . . . . . . . . 27
The report is prepared for the general information of contract owners. It isauthorized for distribution to prospective investors only when preceded oraccompanied by a current prospectus.
NOT FDIC INSURED ‰ MAY LOSE VALUE ‰ NO BANK OR CREDIT UNION GUARANTEE ‰
NOT A DEPOSIT ‰ NOT INSURED BY ANY FEDERAL GOVERNMENT AGENCY OR NCUA/NCUSIF

MFS Investors Trust Series
LETTER FROM THE EXECUTIVE CHAIR
Dear Contract Owners:
Slowing global growth, low inflation, and trade friction between the United States andChina have been hallmarks of the past 12 months. After experiencing an uptick inmarket volatility in late 2018, markets steadied for most of 2019, thanks in largemeasure to the adoption of a dovish policy stance on the part of global central banks,focused on supporting economic growth. Negotiations aimed at a “phase one” tradedeal between the U.S. and China bore fruit at the end of the period, boosting investorsentiment, while signs of stability emerging from the global manufacturing sector alsolifted spirits. Uncertainty over Brexit, along with the ripple effects from the tradeconflict, hampered business confidence and investment in the United Kingdom andEurope for much of the period, though investors expect greater clarity regarding Brexitas a result of December’s general election. The pro-Brexit Conservative Party won theelection by a comfortable margin and set the stage for the U.K.’s departure from the EUat the end of January.
Markets expect the longest economic expansion in U.S. history will continue, albeit at aslower pace, as trade tensions recede. In an effort to prolong the expansion, the U.S.Federal Reserve lowered interest rates three times between July and October and theEuropean Central Bank loosened policy in September. While the global monetary policybackdrop remains quite accommodative, signs of easing trade tensions and fadingglobal recession fears led to improved market sentiment in late 2019 as investors grewless risk averse. In early 2020, an outbreak of coronavirus emanating from Chinareintroduced global growth fears, causing an uptick in volatility.
Here at MFS®, we aim to help our clients navigate the growing complexity of themarkets and world economies. Our long-term investment philosophy and commitmentto the responsible allocation of capital allow us to tune out the noise and uncover whatwe believe are the best, most durable investment opportunities in the market. Throughour powerful global investment platform, we combine collective expertise, thoughtfulrisk management and long-term discipline to create sustainable value for investors.
Respectfully,
Robert J. ManningExecutive ChairMFS Investment Management
February 14, 2020
The opinions expressed in this letter are subject to change and may not be relied upon forinvestment advice. No forecasts can be guaranteed.
1
MFS Investors Trust Series
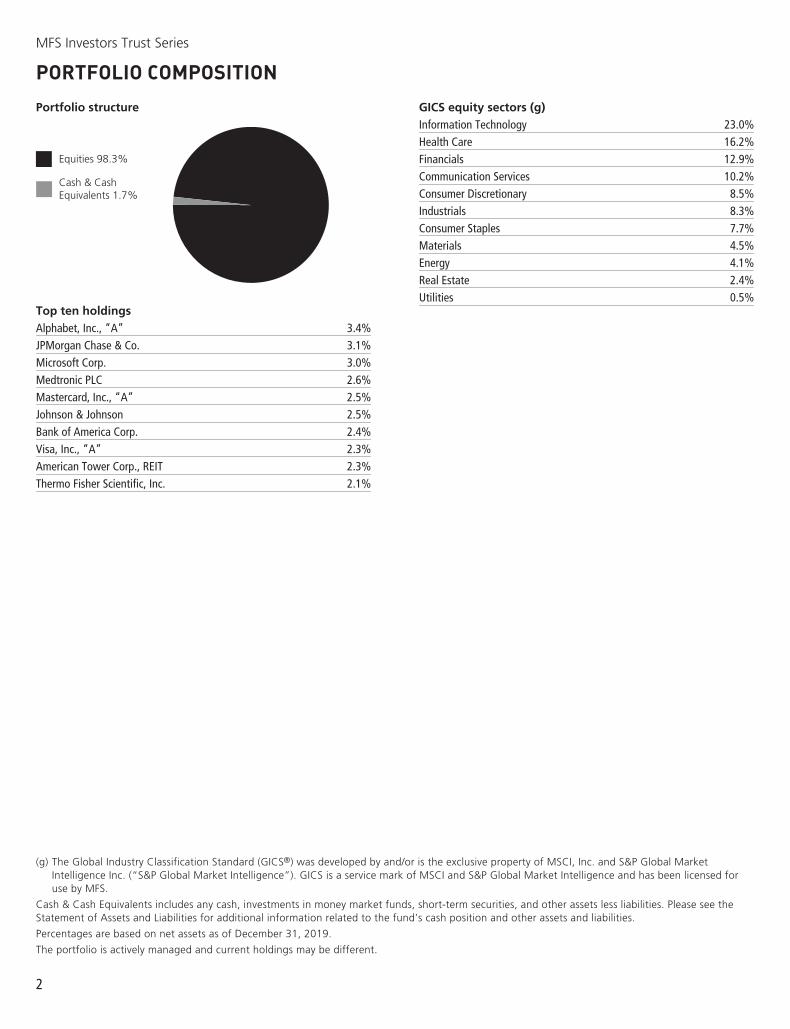
PORTFOLIO COMPOSITION
Portfolio structure
Equities 98.3%
Cash & CashEquivalents 1.7%
Top ten holdingsAlphabet, Inc., “A” 3.4%JPMorgan Chase & Co. 3.1%Microsoft Corp. 3.0%Medtronic PLC 2.6%Mastercard, Inc., “A” 2.5%Johnson & Johnson 2.5%Bank of America Corp. 2.4%Visa, Inc., “A” 2.3%American Tower Corp., REIT 2.3%Thermo Fisher Scientific, Inc. 2.1%
GICS equity sectors (g)Information Technology 23.0%Health Care 16.2%Financials 12.9%Communication Services 10.2%Consumer Discretionary 8.5%Industrials 8.3%Consumer Staples 7.7%Materials 4.5%Energy 4.1%Real Estate 2.4%Utilities 0.5%
(g) The Global Industry Classification Standard (GICS®) was developed by and/or is the exclusive property of MSCI, Inc. and S&P Global MarketIntelligence Inc. (“S&P Global Market Intelligence”). GICS is a service mark of MSCI and S&P Global Market Intelligence and has been licensed foruse by MFS.
Cash & Cash Equivalents includes any cash, investments in money market funds, short-term securities, and other assets less liabilities. Please see theStatement of Assets and Liabilities for additional information related to the fund’s cash position and other assets and liabilities.
Percentages are based on net assets as of December 31, 2019.
The portfolio is actively managed and current holdings may be different.
2

MFS Investors Trust Series
MANAGEMENT REVIEW
Summary of ResultsFor the twelve months ended December 31, 2019, Initial Class shares of the MFS Investors Trust Series (fund) provided a total returnof 31.58%, while Service Class shares of the fund provided a total return of 31.25%. These compare with a return of 31.49% overthe same period for the fund’s benchmark, the Standard & Poor’s 500 Stock Index (S&P 500 Index).
Market EnvironmentFading fears of a near-term global recession, the announcement of a partial trade deal between the United States and China and thedecline in uncertainty over Brexit helped bolster market sentiment late in the period. Changes in market sentiment, largely driven byuncertainty over the outcome of trade negotiations between the US and China, had contributed to periodic bouts of volatility duringthe reporting period. The global economy decelerated, led by weakness in China and Europe, although the pace of the slowdownmoderated late in the period amid nascent signs of stabilization in the manufacturing sector.
The deteriorating global growth backdrop, along with declining inflationary pressures, prompted the US Federal Reserve to adopt amore dovish posture beginning in early 2019, resulting in the first interest rate cut in over a decade at the end of July, followed byadditional cuts in September and October. The Fed’s actions led to a sharp decline in long-term interest rates during the period’ssecond half, causing the inversion of portions of the US Treasury yield curve for a time. Amid an improvement in risk sentiment inQ4 2019 and indications of a bottoming in growth and a potential upturn in activity, the Fed indicated in October that further ratecuts were unlikely unless the outlook for the economy materially worsened.
Globally, central banks have tilted more dovish as well, with the European Central Bank unveiling a package of easing measures,which included putting overnight rates deeper into negative territory, restarting its bond-buying program and lengthening the termof cheap loans to banks to three years from two. The central banks of India and Australia are among those that have cut ratesseveral times in recent months, although China has been more cautious in increasing liquidity as it keeps trying to deleverage itseconomy, cutting rates only marginally.
Emerging markets experienced considerable volatility through the end of 2018, as tighter global financial conditions exposedstructural weakness in some countries. Those conditions improved in 2019 as the Fed became more dovish. Notwithstanding theperiodic headwinds on market sentiment from significant trade friction between the US and China over much of the year, emergingmarket hard currency debt and local rates benefited from relatively cheap valuations at the beginning of the period and easier globalmonetary conditions. These factors, plus the fading of certain global risk factors mentioned above, hastened spread tightening in thelatter part of the period. At the same time, idiosyncratic risks spiked in some countries (e.g., Argentina and Lebanon), contributing toincreased dispersion in performance among sovereign assets.
Detractors from PerformanceSecurity selection in the information technology sector detracted from performance relative to the S&P 500 Index. Within this sector,the fund’s underweight positions in computer and personal electronics maker Apple and software giant Microsoft weakened relativereturns. The stock price of Apple advanced during the reporting period as the company’s revenues came in higher than consensusestimates, driven by stronger-than-expected demand in its wearable technology and services segments. Additionally, overweightpositions in information technology company DXC Technology (h) and custom IT consulting and technology services providerCognizant Technology Solutions held back relative returns.
Stock selection in the energy sector also weighed on relative performance. Within this sector, an overweight position in energyexploration and production company EOG Resources, and the fund’s holdings of core and fluid analysis provider in the petroleumindustry Core Laboratories (b) (Netherlands), hampered relative results. The share price of EOG Resources came under pressure aftermanagement cut its 2019 oil and gas production guidance figures to below market estimates.
Elsewhere, the timing of the fund’s ownership in shares of biotechnology company Biogen (h) hurt relative returns. Despite Biogen’sstock price recovery towards the end of the reporting period, early weakness caused by an announcement that the company woulddiscontinue the development of its Alzheimer’s treatment, after trial data indicated the drugs were unlikely to succeed, held back itsoverall stock price performance. The fund’s holdings of electronic brokerage firm TD Ameritrade Holding (b) and wine and alcoholicbeverage producer Pernod Ricard (b) (France) also weighed on relative returns.
The fund’s cash and/or cash equivalents position during the period detracted from relative performance. Under normal marketconditions, the fund strives to be fully invested and generally holds cash to buy new holdings and to provide liquidity. In a periodwhen equity markets rose, as measured by the fund’s benchmark, holding cash hurt performance versus the benchmark, which hasno cash position.
Contributors to PerformanceStock selection in the health care, financials and consumer discretionary sectors contributed to relative performance. Within thehealth care sector, not owning shares of pharmaceutical giant Pfizer, and an overweight position in health care tools company
3

MFS Investors Trust Series
Management Review – continued
Danaher, aided relative returns. The share price of Pfizer depreciated after the company recorded sales that were shy of marketexpectations, owing to weakness in its legacy product sales. Pfizer also cut its fiscal-year 2019 guidance to reflect the integration of ajoint venture with GlaxoSmithKline and the acquisition of Array BioPharma, which further pressured the stock. Within the financialssector, the fund’s position in global alternative asset manager Blackstone Group (b), and not owning shares of insurance andinvestment firm Berkshire Hathaway, supported relative performance. Despite a challenging environment, the share price ofBlackstone Group appreciated as the company delivered better-than-anticipated results, driven by strong growth in fee-relatedearnings. The firm also benefited from growth in assets under management, with solid performance across most of its asset groups.Additionally, Blackstone Group’s decision to convert from a limited partnership structure to a C corporation broadened the firm’spotential ownership pool and further supported its share price performance. Within the consumer discretionary sector, holdings ofluxury goods company LVMH Moet Hennessy Louis Vuitton (b) (France), and not owning shares of internet retailer Amazon.com, alsohelped relative returns.
Security selection in the materials sector further boosted relative results, led by the fund’s position in consumer goods packagingproducts manufacturer Crown Holdings (b). Shares of Crown Holdings advanced as the company reported strong cash flows andbetter-than-expected pricing impact from new contracts.
In other sectors, the fund’s overweight positions in broadcast and communication tower management firm American Tower anddebit and credit transaction processing company Mastercard bolstered relative results. Not owning shares of integrated oil and gascompany Exxon Mobil also helped relative performance.
Respectfully,
Portfolio Manager(s)Kevin Beatty, Alison O’Neill Mackey, and Ted Maloney
(b) Security is not a benchmark constituent.
(h) Security was not held in the portfolio at period end.
The views expressed in this report are those of the portfolio manager(s) only through the end of the period of the report as stated on the cover and donot necessarily reflect the views of MFS or any other person in the MFS organization. These views are subject to change at any time based on market orother conditions, and MFS disclaims any responsibility to update such views. These views may not be relied upon as investment advice or an indicationof trading intent on behalf of any MFS portfolio. References to specific securities are not recommendations of such securities, and may not berepresentative of any MFS portfolio’s current or future investments.
4

MFS Investors Trust Series
PERFORMANCE SUMMARY THROUGH 12/31/19
The following chart illustrates the historical performance of the fund in comparison to its benchmark(s). Benchmarks are unmanagedand may not be invested in directly. Benchmark returns do not reflect any fees or expenses. The performance of other share classeswill be greater than or less than that of the class depicted below. (See Notes to Performance Summary.)
Performance data shown represents past performance and is no guarantee of future results. Investment return andprincipal value fluctuate so your units, when sold, may be worth more or less than the original cost; currentperformance may be lower or higher than quoted. The performance shown does not reflect the deduction of taxes, ifany, that a contract holder would pay on fund distributions or the redemption of contract units. The returns for thefund shown also do not reflect the deduction of expenses associated with variable products, such as mortality andexpense risk charges, separate account charges, and sales charges imposed by the insurance company separateaccounts. Such expenses would reduce the overall returns shown.
Growth of a Hypothetical $10,000 Investment
$35,666
$31,692
12/1912/18
12/1712/16
12/1512/14
12/1312/12
12/1112/10
12/09
Standard & Poor’s 500 Stock IndexMFS Investors Trust Series – Initial Class
8,000
12,00014,000
10,000
16,00018,00020,00022,00024,00026,00028,00030,00032,00034,00036,000
Total Returns through 12/31/19
Average annual total returns
Share Class Class Inception Date 1-yr 5-yr 10-yr
Initial Class 10/09/95 31.58% 10.79% 12.23%
Service Class 5/01/00 31.25% 10.51% 11.95%
Comparative benchmark(s)
Standard & Poor’s 500 Stock Index (f) 31.49% 11.70% 13.56%
(f) Source: FactSet Research Systems Inc.
Benchmark Definition(s)Standard & Poor’s 500 Stock Index – a market capitalization-weighted index of 500 widely held equity securities, designed tomeasure broad U.S. equity performance. “Standard & Poor’s®” and “S&P®” are registered trademarks of Standard & Poor’s FinancialServices LLC (“S&P”) and Dow Jones is a registered trademark of Dow Jones Trademark Holdings LLC (“Dow Jones”) and have beenlicensed for use by S&P Dow Jones Indices LLC and sublicensed for certain purposes by Massachusetts Financial Services Company.The S&P 500® is a product of S&P Dow Jones Indices LLC, and has been licensed for use by Massachusetts Financial ServicesCompany. Massachusetts Financial Services Company’s product(s) is not sponsored, endorsed, sold, or promoted by S&P Dow JonesIndices LLC, Dow Jones, S&P, or their respective affiliates, and neither S&P Dow Jones Indices LLC, Dow Jones, S&P, nor theirrespective affiliates make any representation regarding the advisability of investing in such product(s).
It is not possible to invest directly in an index.
Notes to Performance SummaryAverage annual total return represents the average annual change in value for each share class for the periods presented.
Performance results reflect any applicable expense subsidies and waivers in effect during the periods shown. Without such subsidiesand waivers the fund’s performance results would be less favorable. Please see the prospectus and financial statements for completedetails. All results are historical and assume the reinvestment of any dividends and capital gains distributions.
5

MFS Investors Trust Series
Performance Summary – continued
Performance results do not include adjustments made for financial reporting purposes in accordance with U.S. generally acceptedaccounting principles and may differ from amounts reported in the financial highlights.
From time to time the fund may receive proceeds from litigation settlements, without which performance would be lower.
6

MFS Investors Trust Series
EXPENSE TABLE
Fund Expenses Borne by the Contract Holders during the Period,July 1, 2019 through December 31, 2019As a contract holder of the fund, you incur ongoing costs, including management fees; distribution and/or service (12b-1) fees; andother fund expenses. This example is intended to help you understand your ongoing costs (in dollars) of investing in the fund and tocompare these costs with the ongoing costs of investing in other mutual funds.
The example is based on an investment of $1,000 invested at the beginning of the period and held for the entire period July 1, 2019through December 31, 2019.
Actual ExpensesThe first line for each share class in the following table provides information about actual account values and actual expenses. Youmay use the information in this line, together with the amount you invested, to estimate the expenses that you paid over the period.Simply divide your account value by $1,000 (for example, an $8,600 account value divided by $1,000 = 8.6), then multiply the resultby the number in the first line under the heading entitled “Expenses Paid During Period” to estimate the expenses you paid on youraccount during this period.
Hypothetical Example for Comparison PurposesThe second line for each share class in the following table provides information about hypothetical account values and hypotheticalexpenses based on the fund’s actual expense ratio and an assumed rate of return of 5% per year before expenses, which is not thefund’s actual return. The hypothetical account values and expenses may not be used to estimate the actual ending account balanceor expenses you paid for the period. You may use this information to compare the ongoing costs of investing in the fund and otherfunds. To do so, compare this 5% hypothetical example with the 5% hypothetical examples that appear in the shareholder reportsof the other funds.
Please note that the expenses shown in the table are meant to highlight the fund’s ongoing costs only and do not take into accountthe fees and expenses imposed under the variable contracts through which your investment in the fund is made. Therefore, thesecond line for each share class in the table is useful in comparing ongoing costs associated with an investment in vehicles (such asthe fund) which fund benefits under variable annuity and variable life insurance contracts and to qualified pension and retirementplans only, and will not help you determine the relative total costs of investing in the fund through variable annuity and variable lifeinsurance contracts. If the fees and expenses imposed under the variable contracts were included, your costs would have beenhigher.
Share ClassAnnualized
Expense Ratio
BeginningAccount Value
7/01/19
EndingAccount Value
12/31/19
Expenses PaidDuring Period (p)7/01/19-12/31/19
Initial ClassActual 0.79% $1,000.00 $1,090.78 $4.16
Hypothetical (h) 0.79% $1,000.00 $1,021.22 $4.02
Service ClassActual 1.04% $1,000.00 $1,089.16 $5.48
Hypothetical (h) 1.04% $1,000.00 $1,019.96 $5.30
(h) 5% class return per year before expenses.
(p) “Expenses Paid During Period” are equal to each class’s annualized expense ratio, as shown above, multiplied by the average account value over theperiod, multiplied by 184/365 (to reflect the one-half year period).
7

MFS Investors Trust Series
PORTFOLIO OF INVESTMENTS – 12/31/19
The Portfolio of Investments is a complete list of all securities owned by your fund. It is categorized by broad-based asset classes.
Issuer Shares/Par Value ($)
COMMON STOCKS – 98.3%Aerospace – 3.2%Honeywell International, Inc. 76,209 $ 13,488,993United Technologies Corp. 65,101 9,749,526
$ 23,238,519
Alcoholic Beverages – 2.1%Diageo PLC 168,454 $ 7,141,408Pernod Ricard S.A. 43,578 7,791,702
$ 14,933,110
Apparel Manufacturers – 2.1%LVMH Moet Hennessy Louis Vuitton SE 18,963 $ 8,810,364NIKE, Inc., “B” 62,562 6,338,156
$ 15,148,520
Biotechnology – 0.4%Illumina, Inc. (a) 8,924 $ 2,960,448
Broadcasting – 0.6%Walt Disney Co. 31,855 $ 4,607,189
Brokerage & Asset Managers – 3.5%Blackstone Group, Inc. 168,212 $ 9,409,779NASDAQ, Inc. 104,090 11,148,039TD Ameritrade Holding Corp. 89,792 4,462,663
$ 25,020,481
Business Services – 6.5%Accenture PLC, “A” 69,494 $ 14,633,352Amdocs Ltd. 117,308 8,468,464Cognizant Technology Solutions Corp., “A” 140,983 8,743,766Fidelity National Information Services, Inc. 105,570 14,683,731
$ 46,529,313
Cable TV – 2.0%Comcast Corp., “A” 317,737 $ 14,288,633
Chemicals – 1.0%PPG Industries, Inc. 55,741 $ 7,440,866
Computer Software – 5.4%Adobe Systems, Inc. (a) 31,585 $ 10,417,049Microsoft Corp. 134,645 21,233,516Salesforce.com, Inc. (a) 45,237 7,357,346
$ 39,007,911
Computer Software – Systems – 1.5%Apple, Inc. 37,585 $ 11,036,835
Construction – 1.4%Sherwin-Williams Co. 17,559 $ 10,246,379
Consumer Products – 2.3%Colgate-Palmolive Co. 107,822 $ 7,422,466Estee Lauder Cos., Inc., “A” 17,022 3,515,724Kimberly-Clark Corp. 42,534 5,850,552
$ 16,788,742
Issuer Shares/Par Value ($)
COMMON STOCKS – continuedContainers – 1.1%Crown Holdings, Inc. (a) 110,025 $ 7,981,213
Electrical Equipment – 3.2%AMETEK, Inc. 78,727 $ 7,852,231Fortive Corp. 118,259 9,033,805TE Connectivity Ltd. 65,735 6,300,042
$ 23,186,078
Electronics – 2.5%Analog Devices, Inc. 57,236 $ 6,801,926Texas Instruments, Inc. 84,671 10,862,443
$ 17,664,369
Energy – Independent – 1.4%EOG Resources, Inc. 118,324 $ 9,910,818
Food & Beverages – 2.2%Danone S.A. 98,460 $ 8,161,707Mondelez International, Inc. 136,364 7,510,929
$ 15,672,636
Gaming & Lodging – 0.7%Marriott International, Inc., “A” 33,043 $ 5,003,701
General Merchandise – 1.7%Dollar General Corp. 46,288 $ 7,220,002Dollar Tree, Inc. (a) 56,101 5,276,299
$ 12,496,301
Insurance – 1.1%Chubb Ltd. 51,086 $ 7,952,047
Internet – 6.3%Alphabet, Inc., “A” (a) 18,100 $ 24,242,959Alphabet, Inc., “C” (a) 7,210 9,639,914Facebook, Inc., “A” (a) 56,749 11,647,732
$ 45,530,605
Leisure & Toys – 1.3%Electronic Arts, Inc. (a) 84,831 $ 9,120,181
Machinery & Tools – 0.8%Flowserve Corp. 107,994 $ 5,374,861
Major Banks – 7.0%Bank of America Corp. 489,398 $ 17,236,598Goldman Sachs Group, Inc. 47,250 10,864,192JPMorgan Chase & Co. 158,246 22,059,492
$ 50,160,282
Medical & Health Technology & Services – 0.8%PRA Health Sciences, Inc. 53,687 $ 5,967,310
Medical Equipment – 9.3%Abbott Laboratories 76,914 $ 6,680,750Becton, Dickinson and Co. 47,333 12,873,156Danaher Corp. 83,377 12,796,702Medtronic PLC 166,477 18,886,816
8

MFS Investors Trust Series
Portfolio of Investments – continued
Issuer Shares/Par Value ($)
COMMON STOCKS – continuedMedical Equipment – continuedThermo Fisher Scientific, Inc. 46,884 $ 15,231,205
$ 66,468,629
Natural Gas – Pipeline – 1.5%Enterprise Products Partners LP 369,861 $ 10,415,286
Network & Telecom – 1.4%Cisco Systems, Inc. 208,930 $ 10,020,283
Oil Services – 1.3%Core Laboratories N.V. (l) 56,740 $ 2,137,396Schlumberger Ltd. 170,676 6,861,175
$ 8,998,571
Other Banks & Diversified Financials – 6.2%Mastercard, Inc., “A” 60,611 $ 18,097,839Truist Financial Corp. 167,575 9,437,824Visa, Inc., “A” 89,657 16,846,550
$ 44,382,213
Pharmaceuticals – 5.7%Elanco Animal Health, Inc. (a) 193,866 $ 5,709,354Eli Lilly & Co. 75,776 9,959,240Johnson & Johnson 123,726 18,047,911Zoetis, Inc. 55,180 7,303,073
$ 41,019,578
Railroad & Shipping – 1.3%Canadian National Railway Co. 103,363 $ 9,349,183
Restaurants – 1.0%Starbucks Corp. 79,495 $ 6,989,200
Specialty Chemicals – 0.9%DuPont de Nemours, Inc. 102,578 $ 6,585,508
Specialty Stores – 4.1%Costco Wholesale Corp. 27,553 $ 8,098,378Ross Stores, Inc. 68,302 7,951,719Target Corp. 40,334 5,171,222Tractor Supply Co. 88,909 8,307,657
$ 29,528,976
Telecommunications – Wireless – 2.3%American Tower Corp., REIT 73,196 $ 16,821,905
Issuer Shares/Par Value ($)
COMMON STOCKS – continuedTrucking – 0.7%Old Dominion Freight Line, Inc. 26,022 $ 4,938,455
Utilities – Electric Power – 0.5%American Electric Power Co., Inc. 39,821 $ 3,763,483
Total Common Stocks(Identified Cost, $381,954,142) $706,548,618
INVESTMENT COMPANIES (h) – 1.6%Money Market Funds – 1.6%MFS Institutional Money Market Portfolio,1.7% (v) (Identified Cost, $11,859,675) 11,859,653 $ 11,859,653
COLLATERAL FOR SECURITIES LOANED – 0.1%State Street Navigator Securities LendingGovernment Money Market Portfolio,1.58% (j) (Identified Cost, $492,566) 492,566 $ 492,566
OTHER ASSETS, LESSLIABILITIES – (0.0)% (269,000)
NET ASSETS – 100.0% $718,631,837
(a) Non-income producing security.
(h) An affiliated issuer, which may be considered one in which thefund owns 5% or more of the outstanding voting securities, or acompany which is under common control. At period end, theaggregate values of the fund’s investments in affiliated issuers andin unaffiliated issuers were $11,859,653 and $707,041,184,respectively.
(j) The rate quoted is the annualized seven-day yield of the fund atperiod end.
(l) A portion of this security is on loan. See Note 2 for additionalinformation.
(v) Affiliated issuer that is available only to investment companiesmanaged by MFS. The rate quoted for the MFS InstitutionalMoney Market Portfolio is the annualized seven-day yield of thefund at period end.
The following abbreviations are used in this report and are defined:
REIT Real Estate Investment Trust
See Notes to Financial Statements
9

MFS Investors Trust Series
FINANCIAL STATEMENTS | STATEMENT OF ASSETS AND LIABILITIES
This statement represents your fund’s balance sheet, which details the assets and liabilities comprising the total value of the fund.
At 12/31/19
Assets
Investments in unaffiliated issuers, at value, including $382,577 of securities on loan (identified cost, $382,446,708) $707,041,184Investments in affiliated issuers, at value (identified cost, $11,859,675) 11,859,653Cash 36,135Receivables for
Fund shares sold 399,118Interest and dividends 490,698
Other assets 2,877
Total assets $719,829,665
Liabilities
Payables forFund shares reacquired $552,983
Collateral for securities loaned, at value 492,566Payable to affiliates
Investment adviser 29,152Administrative services fee 550Shareholder servicing costs 722Distribution and/or service fees 6,211
Payable for independent Trustees’ compensation 11Accrued expenses and other liabilities 115,633
Total liabilities $1,197,828
Net assets $718,631,837
Net assets consist of
Paid-in capital $367,751,573Total distributable earnings (loss) 350,880,264
Net assets $718,631,837
Shares of beneficial interest outstanding 21,808,150
Net assetsShares
outstandingNet asset value
per shareInitial Class $265,499,342 7,980,822 $33.27Service Class 453,132,495 13,827,328 32.77
See Notes to Financial Statements
10

MFS Investors Trust Series
FINANCIAL STATEMENTS | STATEMENT OF OPERATIONS
This statement describes how much your fund earned in investment income and accrued in expenses. It also describes any gains and/or lossesgenerated by fund operations.
Year ended 12/31/19
Net investment income (loss)
IncomeDividends $10,300,973Dividends from affiliated issuers 164,937Income on securities loaned 34,078Other 14,797Foreign taxes withheld (122,651)
Total investment income $10,392,134
ExpensesManagement fee $4,899,254Distribution and/or service fees 991,170Shareholder servicing costs 20,764Administrative services fee 98,263Independent Trustees’ compensation 17,500Custodian fee 35,160Shareholder communications 51,517Audit and tax fees 56,791Legal fees 6,160Miscellaneous 33,407
Total expenses $6,209,986
Reduction of expenses by investment adviser (63,727)
Net expenses $6,146,259
Net investment income (loss) $4,245,875
Realized and unrealized gain (loss)
Realized gain (loss) (identified cost basis)Unaffiliated issuers $21,650,761Affiliated issuers 380Foreign currency (1,055)
Net realized gain (loss) $21,650,086
Change in unrealized appreciation or depreciationUnaffiliated issuers $148,081,675Affiliated issuers (200)
Net unrealized gain (loss) $148,081,475
Net realized and unrealized gain (loss) $169,731,561
Change in net assets from operations $173,977,436
See Notes to Financial Statements
11

MFS Investors Trust Series
FINANCIAL STATEMENTS | STATEMENTS OF CHANGES IN NET ASSETS
These statements describe the increases and/or decreases in net assets resulting from operations, any distributions, and any shareholder transactions.
Year ended
12/31/19 12/31/18Change in net assets
From operations
Net investment income (loss) $4,245,875 $4,410,167Net realized gain (loss) 21,650,086 38,546,790Net unrealized gain (loss) 148,081,475 (75,138,678)
Change in net assets from operations $173,977,436 $(32,181,721)
Total distributions to shareholders $(42,277,259) $(30,377,311)
Change in net assets from fund share transactions $29,872,889 $17,770,363
Total change in net assets $161,573,066 $(44,788,669)
Net assets
At beginning of period 557,058,771 601,847,440At end of period $718,631,837 $557,058,771
See Notes to Financial Statements
12

MFS Investors Trust Series
FINANCIAL STATEMENTS | FINANCIAL HIGHLIGHTS
The financial highlights table is intended to help you understand the fund’s financial performance for the past 5 years. Certain information reflectsfinancial results for a single fund share. The total returns in the table represent the rate that an investor would have earned (or lost) on an investment inthe fund share class (assuming reinvestment of all distributions) held for the entire period.
Initial Class Year ended
12/31/19 12/31/18 12/31/17 12/31/16 12/31/15
Net asset value, beginning of period $27.05 $30.07 $25.57 $26.58 $30.41
Income (loss) from investment operations
Net investment income (loss) (d) $0.25 $0.26 $0.22 $0.23(c) $0.21Net realized and unrealized gain (loss) 8.08 (1.71) 5.62 2.01 (0.42)
Total from investment operations $8.33 $(1.45) $5.84 $2.24 $(0.21)
Less distributions declared to shareholders
From net investment income $(0.22) $(0.20) $(0.21) $(0.24) $(0.28)From net realized gain (1.89) (1.37) (1.13) (3.01) (3.34)
Total distributions declared to shareholders $(2.11) $(1.57) $(1.34) $(3.25) $(3.62)
Net asset value, end of period (x) $33.27 $27.05 $30.07 $25.57 $26.58
Total return (%) (k)(r)(s)(x) 31.58 (5.49) 23.35 8.59(c) 0.22
Ratios (%) (to average net assets)and Supplemental data:
Expenses before expense reductions (f) 0.80 0.80 0.82 0.80(c) 0.82Expenses after expense reductions (f) 0.79 0.79 0.79 0.79(c) 0.81Net investment income (loss) 0.80 0.86 0.79 0.89(c) 0.73Portfolio turnover 18 16 18 20 17Net assets at end of period (000 omitted) $265,499 $231,900 $283,237 $270,796 $293,203
Service Class Year ended
12/31/19 12/31/18 12/31/17 12/31/16 12/31/15
Net asset value, beginning of period $26.68 $29.69 $25.28 $26.30 $30.13
Income (loss) from investment operations
Net investment income (loss) (d) $0.17 $0.18 $0.15 $0.16(c) $0.14Net realized and unrealized gain (loss) 7.97 (1.68) 5.55 1.98 (0.42)
Total from investment operations $8.14 $(1.50) $5.70 $2.14 $(0.28)
Less distributions declared to shareholders
From net investment income $(0.16) $(0.14) $(0.16) $(0.15) $(0.21)From net realized gain (1.89) (1.37) (1.13) (3.01) (3.34)
Total distributions declared to shareholders $(2.05) $(1.51) $(1.29) $(3.16) $(3.55)
Net asset value, end of period (x) $32.77 $26.68 $29.69 $25.28 $26.30
Total return (%) (k)(r)(s)(x) 31.25 (5.71) 23.03 8.32(c) (0.05)
Ratios (%) (to average net assets)and Supplemental data:
Expenses before expense reductions (f) 1.05 1.05 1.07 1.04(c) 1.07Expenses after expense reductions (f) 1.04 1.04 1.04 1.04(c) 1.06Net investment income (loss) 0.55 0.62 0.55 0.64(c) 0.47Portfolio turnover 18 16 18 20 17Net assets at end of period (000 omitted) $453,132 $325,159 $318,611 $228,741 $193,116
See Notes to Financial Statements
13

MFS Investors Trust Series
Financial Highlights – continued
(c) Amount reflects a one-time reimbursement of expenses by the custodian (or former custodian) without which net investment income andperformance would be lower and expenses would be higher.
(d) Per share data is based on average shares outstanding.
(f) Ratios do not reflect reductions from fees paid indirectly, if applicable.
(k) The total return does not reflect expenses that apply to separate accounts. Inclusion of these charges would reduce the total return figures for allperiods shown.
(r) Certain expenses have been reduced without which performance would have been lower.
(s) From time to time the fund may receive proceeds from litigation settlements, without which performance would be lower.
(x) The net asset values and total returns have been calculated on net assets which include adjustments made in accordance with U.S. generallyaccepted accounting principles required at period end for financial reporting purposes.
See Notes to Financial Statements
14

MFS Investors Trust Series
NOTES TO FINANCIAL STATEMENTS
(1) Business and OrganizationMFS Investors Trust Series (the fund) is a diversified series of MFS Variable Insurance Trust (the trust). The trust is organized as aMassachusetts business trust and is registered under the Investment Company Act of 1940, as amended, as an open-endmanagement investment company. The shareholders of each series of the trust are separate accounts of insurance companies, whichoffer variable annuity and/or life insurance products, and qualified retirement and pension plans.
The fund is an investment company and accordingly follows the investment company accounting and reporting guidance of theFinancial Accounting Standards Board (FASB) Accounting Standards Codification Topic 946 Financial Services – InvestmentCompanies.
(2) Significant Accounting PoliciesGeneral – The preparation of financial statements in conformity with U.S. generally accepted accounting principles requiresmanagement to make estimates and assumptions that affect the reported amounts of assets and liabilities, and disclosure ofcontingent assets and liabilities at the date of the financial statements and the reported amounts of increases and decreases in netassets from operations during the reporting period. Actual results could differ from those estimates. In the preparation of thesefinancial statements, management has evaluated subsequent events occurring after the date of the fund’s Statement of Assets andLiabilities through the date that the financial statements were issued.
Balance Sheet Offsetting – The fund’s accounting policy with respect to balance sheet offsetting is that, absent an event of defaultby the counterparty or a termination of the agreement, the International Swaps and Derivatives Association (ISDA) MasterAgreement, or similar agreement, does not result in an offset of reported amounts of financial assets and financial liabilities in theStatement of Assets and Liabilities across transactions between the fund and the applicable counterparty. The fund’s right to setoffmay be restricted or prohibited by the bankruptcy or insolvency laws of the particular jurisdiction to which a specific master nettingagreement counterparty is subject. Balance sheet offsetting disclosures, to the extent applicable to the fund, have been included inthe fund’s Significant Accounting Policies note under the captions for each of the fund’s in-scope financial instruments andtransactions.
Investment Valuations – Equity securities, including restricted equity securities, are generally valued at the last sale or officialclosing price on their primary market or exchange as provided by a third-party pricing service. Equity securities, for which there wereno sales reported that day, are generally valued at the last quoted daily bid quotation on their primary market or exchange asprovided by a third-party pricing service. Short-term instruments with a maturity at issuance of 60 days or less may be valued atamortized cost, which approximates market value. Open-end investment companies are generally valued at net asset value per share.Securities and other assets generally valued on the basis of information from a third-party pricing service may also be valued at abroker/dealer bid quotation. In determining values, third-party pricing services can utilize both transaction data and marketinformation such as yield, quality, coupon rate, maturity, type of issue, trading characteristics, and other market data. The values offoreign securities and other assets and liabilities expressed in foreign currencies are converted to U.S. dollars using the mean of bidand asked prices for rates provided by a third-party pricing service.
The Board of Trustees has delegated primary responsibility for determining or causing to be determined the value of the fund’sinvestments (including any fair valuation) to the adviser pursuant to valuation policies and procedures approved by the Board. If theadviser determines that reliable market quotations are not readily available, investments are valued at fair value as determined ingood faith by the adviser in accordance with such procedures under the oversight of the Board of Trustees. Under the fund’svaluation policies and procedures, market quotations are not considered to be readily available for most types of debt instrumentsand floating rate loans and many types of derivatives. These investments are generally valued at fair value based on information fromthird-party pricing services. In addition, investments may be valued at fair value if the adviser determines that an investment’s valuehas been materially affected by events occurring after the close of the exchange or market on which the investment is principallytraded (such as foreign exchange or market) and prior to the determination of the fund’s net asset value, or after the halt of tradingof a specific security where trading does not resume prior to the close of the exchange or market on which the security is principallytraded. Events that occur after foreign markets close (such as developments in foreign markets and significant movements in the U.S.markets) and prior to the determination of the fund’s net asset value may be deemed to have a material effect on the value ofsecurities traded in foreign markets. Accordingly, the fund’s foreign equity securities may often be valued at fair value. The advisergenerally relies on third-party pricing services or other information (such as the correlation with price movements of similar securitiesin the same or other markets; the type, cost and investment characteristics of the security; the business and financial condition of theissuer; and trading and other market data) to assist in determining whether to fair value and at what value to fair value aninvestment. The value of an investment for purposes of calculating the fund’s net asset value can differ depending on the source andmethod used to determine value. When fair valuation is used, the value of an investment used to determine the fund’s net assetvalue may differ from quoted or published prices for the same investment. There can be no assurance that the fund could obtain thefair value assigned to an investment if it were to sell the investment at the same time at which the fund determines its net assetvalue per share.
15

MFS Investors Trust Series
Notes to Financial Statements – continued
Various inputs are used in determining the value of the fund’s assets or liabilities. These inputs are categorized into three broadlevels. In certain cases, the inputs used to measure fair value may fall into different levels of the fair value hierarchy. In such cases, aninvestment’s level within the fair value hierarchy is based on the lowest level of input that is significant to the fair valuemeasurement. The fund’s assessment of the significance of a particular input to the fair value measurement in its entirety requiresjudgment, and considers factors specific to the investment. Level 1 includes unadjusted quoted prices in active markets for identicalassets or liabilities. Level 2 includes other significant observable market-based inputs (including quoted prices for similar securities,interest rates, prepayment speed, and credit risk). Level 3 includes unobservable inputs, which may include the adviser’s ownassumptions in determining the fair value of investments. The following is a summary of the levels used as of December 31, 2019 invaluing the fund’s assets or liabilities:
Financial Instruments Level 1 Level 2 Level 3 TotalEquity Securities $706,548,618 $— $— $706,548,618Mutual Funds 12,352,219 — — 12,352,219
Total $718,900,837 $— $— $718,900,837
For further information regarding security characteristics, see the Portfolio of Investments.
Foreign Currency Translation – Purchases and sales of foreign investments, income, and expenses are converted into U.S. dollarsbased upon currency exchange rates prevailing on the respective dates of such transactions or on the reporting date for foreigndenominated receivables and payables. Gains and losses attributable to foreign currency exchange rates on sales of securities arerecorded for financial statement purposes as net realized gains and losses on investments. Gains and losses attributable to foreignexchange rate movements on receivables, payables, income and expenses are recorded for financial statement purposes as foreigncurrency transaction gains and losses. That portion of both realized and unrealized gains and losses on investments that results fromfluctuations in foreign currency exchange rates is not separately disclosed.
Security Loans – Under its Securities Lending Agency Agreement with the fund, State Street Bank and Trust Company, as lendingagent, loans the securities of the fund to certain qualified institutions (the “Borrowers”) approved by the fund. Security loans can beterminated at the discretion of either the lending agent or the fund and the related securities must be returned within the earlier ofthe standard trade settlement period for such securities or within three business days. The loans are collateralized by cash and/or U.S.Treasury and federal agency obligations in an amount typically at least equal to the market value of the securities loaned. On loanscollateralized by cash, the cash collateral is invested in a money market fund. The market value of the loaned securities is determinedat the close of business of the fund and any additional required collateral is delivered to the fund on the next business day. Thelending agent provides the fund with indemnification against Borrower default. In the event of Borrower default, the lending agentwill, for the benefit of the fund, either purchase securities identical to those loaned or, when such purchase is commerciallyimpracticable, pay the fund the market value of the loaned securities. In return, the lending agent assumes the fund’s rights to therelated collateral. If the collateral value is less than the cost to purchase identical securities, the lending agent is responsible for theshortfall, but only to the extent that such shortfall is not due to a decline in collateral value resulting from collateral reinvestment forwhich the fund bears the risk of loss. At period end, the fund had investment securities on loan, all of which were classified as equitysecurities in the fund’s Portfolio of Investments, with a fair value of $382,577. The fair value of the fund’s investment securities onloan and a related liability of $492,566 for cash collateral received on securities loaned are both presented gross in the Statement ofAssets and Liabilities. The collateral on securities loaned exceeded the value of securities on loan at period end. The liability for cashcollateral for securities loaned is carried at fair value, which is categorized as level 2 within the fair value hierarchy. A portion of theincome generated upon investment of the collateral is remitted to the Borrowers, and the remainder is allocated between the fundand the lending agent. On loans collateralized by U.S. Treasury and/or federal agency obligations, a fee is received from theBorrower, and is allocated between the fund and the lending agent. Income from securities lending is separately reported in theStatement of Operations. The dividend and interest income earned on the securities loaned is accounted for in the same manner asother dividend and interest income.
Indemnifications – Under the fund’s organizational documents, its officers and Trustees may be indemnified against certainliabilities and expenses arising out of the performance of their duties to the fund. Additionally, in the normal course of business, thefund enters into agreements with service providers that may contain indemnification clauses. The fund’s maximum exposure underthese agreements is unknown as this would involve future claims that may be made against the fund that have not yet occurred.
Investment Transactions and Income – Investment transactions are recorded on the trade date. Interest income is recorded on theaccrual basis. Dividends received in cash are recorded on the ex-dividend date. Certain dividends from foreign securities will berecorded when the fund is informed of the dividend if such information is obtained subsequent to the ex-dividend date. Dividendpayments received in additional securities are recorded on the ex-dividend date in an amount equal to the value of the security onsuch date.
16
MFS Investors Trust Series
Notes to Financial Statements – continued
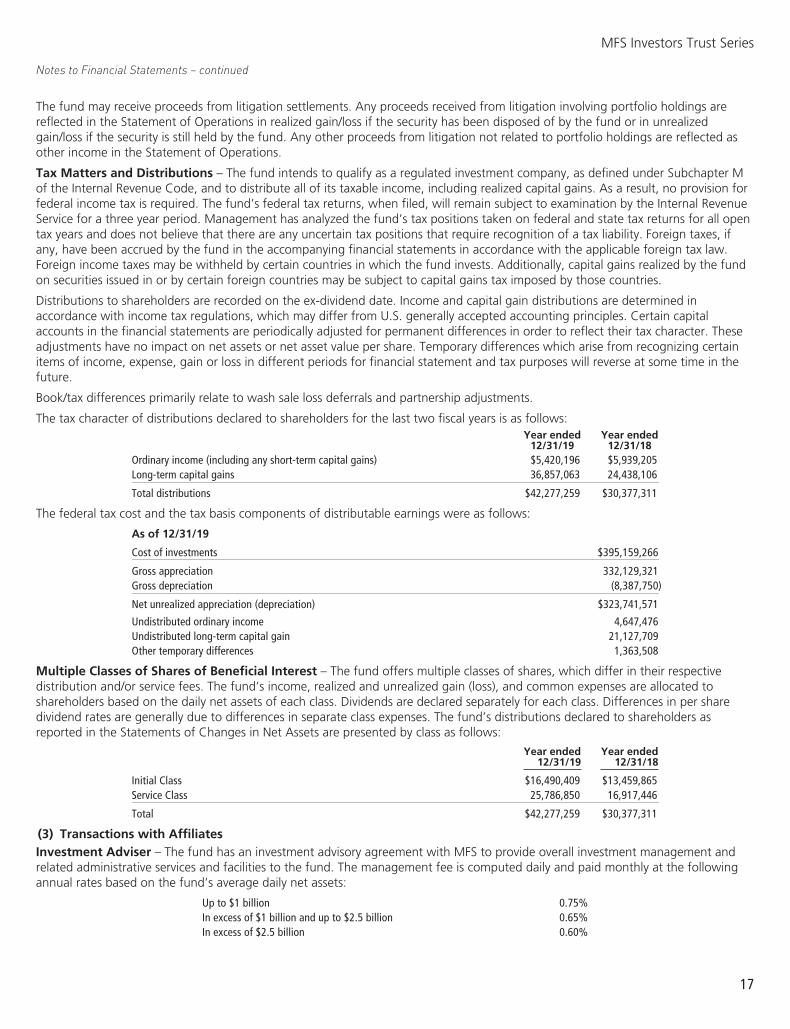
The fund may receive proceeds from litigation settlements. Any proceeds received from litigation involving portfolio holdings arereflected in the Statement of Operations in realized gain/loss if the security has been disposed of by the fund or in unrealizedgain/loss if the security is still held by the fund. Any other proceeds from litigation not related to portfolio holdings are reflected asother income in the Statement of Operations.
Tax Matters and Distributions – The fund intends to qualify as a regulated investment company, as defined under Subchapter Mof the Internal Revenue Code, and to distribute all of its taxable income, including realized capital gains. As a result, no provision forfederal income tax is required. The fund’s federal tax returns, when filed, will remain subject to examination by the Internal RevenueService for a three year period. Management has analyzed the fund’s tax positions taken on federal and state tax returns for all opentax years and does not believe that there are any uncertain tax positions that require recognition of a tax liability. Foreign taxes, ifany, have been accrued by the fund in the accompanying financial statements in accordance with the applicable foreign tax law.Foreign income taxes may be withheld by certain countries in which the fund invests. Additionally, capital gains realized by the fundon securities issued in or by certain foreign countries may be subject to capital gains tax imposed by those countries.
Distributions to shareholders are recorded on the ex-dividend date. Income and capital gain distributions are determined inaccordance with income tax regulations, which may differ from U.S. generally accepted accounting principles. Certain capitalaccounts in the financial statements are periodically adjusted for permanent differences in order to reflect their tax character. Theseadjustments have no impact on net assets or net asset value per share. Temporary differences which arise from recognizing certainitems of income, expense, gain or loss in different periods for financial statement and tax purposes will reverse at some time in thefuture.
Book/tax differences primarily relate to wash sale loss deferrals and partnership adjustments.
The tax character of distributions declared to shareholders for the last two fiscal years is as follows:Year ended
12/31/19Year ended
12/31/18Ordinary income (including any short-term capital gains) $5,420,196 $5,939,205Long-term capital gains 36,857,063 24,438,106
Total distributions $42,277,259 $30,377,311
The federal tax cost and the tax basis components of distributable earnings were as follows:
As of 12/31/19
Cost of investments $395,159,266
Gross appreciation 332,129,321Gross depreciation (8,387,750)
Net unrealized appreciation (depreciation) $323,741,571
Undistributed ordinary income 4,647,476Undistributed long-term capital gain 21,127,709Other temporary differences 1,363,508
Multiple Classes of Shares of Beneficial Interest – The fund offers multiple classes of shares, which differ in their respectivedistribution and/or service fees. The fund’s income, realized and unrealized gain (loss), and common expenses are allocated toshareholders based on the daily net assets of each class. Dividends are declared separately for each class. Differences in per sharedividend rates are generally due to differences in separate class expenses. The fund’s distributions declared to shareholders asreported in the Statements of Changes in Net Assets are presented by class as follows:
Year ended12/31/19
Year ended12/31/18
Initial Class $16,490,409 $13,459,865Service Class 25,786,850 16,917,446
Total $42,277,259 $30,377,311
(3) Transactions with AffiliatesInvestment Adviser – The fund has an investment advisory agreement with MFS to provide overall investment management andrelated administrative services and facilities to the fund. The management fee is computed daily and paid monthly at the followingannual rates based on the fund’s average daily net assets:
Up to $1 billion 0.75%In excess of $1 billion and up to $2.5 billion 0.65%In excess of $2.5 billion 0.60%
17
MFS Investors Trust Series
Notes to Financial Statements – continued
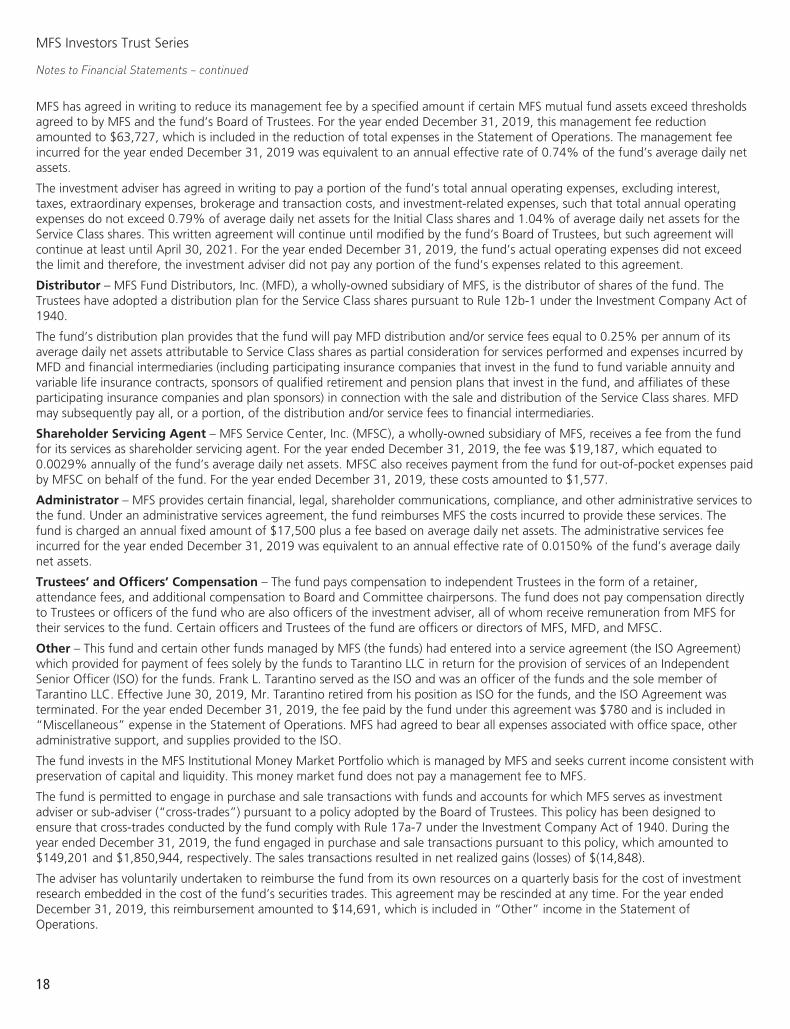
MFS has agreed in writing to reduce its management fee by a specified amount if certain MFS mutual fund assets exceed thresholdsagreed to by MFS and the fund’s Board of Trustees. For the year ended December 31, 2019, this management fee reductionamounted to $63,727, which is included in the reduction of total expenses in the Statement of Operations. The management feeincurred for the year ended December 31, 2019 was equivalent to an annual effective rate of 0.74% of the fund’s average daily netassets.
The investment adviser has agreed in writing to pay a portion of the fund’s total annual operating expenses, excluding interest,taxes, extraordinary expenses, brokerage and transaction costs, and investment-related expenses, such that total annual operatingexpenses do not exceed 0.79% of average daily net assets for the Initial Class shares and 1.04% of average daily net assets for theService Class shares. This written agreement will continue until modified by the fund’s Board of Trustees, but such agreement willcontinue at least until April 30, 2021. For the year ended December 31, 2019, the fund’s actual operating expenses did not exceedthe limit and therefore, the investment adviser did not pay any portion of the fund’s expenses related to this agreement.
Distributor – MFS Fund Distributors, Inc. (MFD), a wholly-owned subsidiary of MFS, is the distributor of shares of the fund. TheTrustees have adopted a distribution plan for the Service Class shares pursuant to Rule 12b-1 under the Investment Company Act of1940.
The fund’s distribution plan provides that the fund will pay MFD distribution and/or service fees equal to 0.25% per annum of itsaverage daily net assets attributable to Service Class shares as partial consideration for services performed and expenses incurred byMFD and financial intermediaries (including participating insurance companies that invest in the fund to fund variable annuity andvariable life insurance contracts, sponsors of qualified retirement and pension plans that invest in the fund, and affiliates of theseparticipating insurance companies and plan sponsors) in connection with the sale and distribution of the Service Class shares. MFDmay subsequently pay all, or a portion, of the distribution and/or service fees to financial intermediaries.
Shareholder Servicing Agent – MFS Service Center, Inc. (MFSC), a wholly-owned subsidiary of MFS, receives a fee from the fundfor its services as shareholder servicing agent. For the year ended December 31, 2019, the fee was $19,187, which equated to0.0029% annually of the fund’s average daily net assets. MFSC also receives payment from the fund for out-of-pocket expenses paidby MFSC on behalf of the fund. For the year ended December 31, 2019, these costs amounted to $1,577.
Administrator – MFS provides certain financial, legal, shareholder communications, compliance, and other administrative services tothe fund. Under an administrative services agreement, the fund reimburses MFS the costs incurred to provide these services. Thefund is charged an annual fixed amount of $17,500 plus a fee based on average daily net assets. The administrative services feeincurred for the year ended December 31, 2019 was equivalent to an annual effective rate of 0.0150% of the fund’s average dailynet assets.
Trustees’ and Officers’ Compensation – The fund pays compensation to independent Trustees in the form of a retainer,attendance fees, and additional compensation to Board and Committee chairpersons. The fund does not pay compensation directlyto Trustees or officers of the fund who are also officers of the investment adviser, all of whom receive remuneration from MFS fortheir services to the fund. Certain officers and Trustees of the fund are officers or directors of MFS, MFD, and MFSC.
Other – This fund and certain other funds managed by MFS (the funds) had entered into a service agreement (the ISO Agreement)which provided for payment of fees solely by the funds to Tarantino LLC in return for the provision of services of an IndependentSenior Officer (ISO) for the funds. Frank L. Tarantino served as the ISO and was an officer of the funds and the sole member ofTarantino LLC. Effective June 30, 2019, Mr. Tarantino retired from his position as ISO for the funds, and the ISO Agreement wasterminated. For the year ended December 31, 2019, the fee paid by the fund under this agreement was $780 and is included in“Miscellaneous” expense in the Statement of Operations. MFS had agreed to bear all expenses associated with office space, otheradministrative support, and supplies provided to the ISO.
The fund invests in the MFS Institutional Money Market Portfolio which is managed by MFS and seeks current income consistent withpreservation of capital and liquidity. This money market fund does not pay a management fee to MFS.
The fund is permitted to engage in purchase and sale transactions with funds and accounts for which MFS serves as investmentadviser or sub-adviser (“cross-trades”) pursuant to a policy adopted by the Board of Trustees. This policy has been designed toensure that cross-trades conducted by the fund comply with Rule 17a-7 under the Investment Company Act of 1940. During theyear ended December 31, 2019, the fund engaged in purchase and sale transactions pursuant to this policy, which amounted to$149,201 and $1,850,944, respectively. The sales transactions resulted in net realized gains (losses) of $(14,848).
The adviser has voluntarily undertaken to reimburse the fund from its own resources on a quarterly basis for the cost of investmentresearch embedded in the cost of the fund’s securities trades. This agreement may be rescinded at any time. For the year endedDecember 31, 2019, this reimbursement amounted to $14,691, which is included in “Other” income in the Statement ofOperations.
18

MFS Investors Trust Series
Notes to Financial Statements – continued
(4) Portfolio SecuritiesFor the year ended December 31, 2019, purchases and sales of investments, other than short-term obligations, aggregated$115,895,305 and $126,534,947, respectively.
(5) Shares of Beneficial InterestThe fund’s Declaration of Trust permits the Trustees to issue an unlimited number of full and fractional shares of beneficial interest.Transactions in fund shares were as follows:
Year ended 12/31/19 Year ended 12/31/18Shares Amount Shares Amount
Shares soldInitial Class 273,184 $8,234,981 460,046 $13,933,540Service Class 2,049,570 63,025,793 2,206,956 65,663,348
2,322,754 $71,260,774 2,667,002 $79,596,888
Shares issued to shareholders in reinvestment of distributionsInitial Class 543,879 $16,490,409 435,876 $13,459,865Service Class 862,725 25,786,850 555,034 16,917,446
1,406,604 $42,277,259 990,910 $30,377,311
Shares reacquiredInitial Class (1,410,131) $(44,272,121) (1,742,162) $(53,053,828)Service Class (1,272,751) (39,393,023) (1,303,877) (39,150,008)
(2,682,882) $(83,665,144) (3,046,039) $(92,203,836)
Net changeInitial Class (593,068) $(19,546,731) (846,240) $(25,660,423)Service Class 1,639,544 49,419,620 1,458,113 43,430,786
1,046,476 $29,872,889 611,873 $17,770,363
(6) Line of CreditThe fund and certain other funds managed by MFS participate in a $1.25 billion unsecured committed line of credit, subject to a$1 billion sublimit, provided by a syndicate of banks under a credit agreement. Borrowings may be made for temporary financingneeds. Interest is charged to each fund, based on its borrowings, generally at a rate equal to the highest of one month LIBOR, theFederal Funds Effective Rate and the Overnight Bank Funding Rate, plus an agreed upon spread. A commitment fee, based on theaverage daily, unused portion of the committed line of credit, is allocated among the participating funds. In addition, the fund andother funds managed by MFS have established unsecured uncommitted borrowing arrangements with certain banks for temporaryfinancing needs. Interest is charged to each fund, based on its borrowings, at rates equal to customary reference rates plus anagreed upon spread. For the year ended December 31, 2019, the fund’s commitment fee and interest expense were $3,801 and $0,respectively, and are included in “Miscellaneous” expense in the Statement of Operations.
(7) Investments in Affiliated IssuersAn affiliated issuer may be considered one in which the fund owns 5% or more of the outstanding voting securities, or a companywhich is under common control. For the purposes of this report, the following were affiliated issuers:
Affiliated IssuersBeginning
Value PurchasesSales
Proceeds
RealizedGain
(Loss)
Change inUnrealized
Appreciation orDepreciation
EndingValue
MFS Institutional Money Market Portfolio $8,297,586 $57,827,989 $54,266,102 $380 $(200) $11,859,653
Affiliated IssuersDividend
IncomeCapital Gain
Distributions
MFS Institutional Money Market Portfolio $164,937 $—
19

MFS Investors Trust Series
REPORT OF INDEPENDENT REGISTERED PUBLIC ACCOUNTING FIRM
To the Board of Trustees of MFS Variable Insurance Trust and the Shareholders ofMFS Investors Trust Series:
Opinion on the Financial Statements and Financial HighlightsWe have audited the accompanying statement of assets and liabilities of MFS Investors Trust Series (the “Fund”), including theportfolio of investments, as of December 31, 2019, the related statement of operations for the year then ended, the statements ofchanges in net assets for each of the two years in the period then ended, the financial highlights for each of the five years in theperiod then ended, and the related notes. In our opinion, the financial statements and financial highlights present fairly, in allmaterial respects, the financial position of the Fund as of December 31, 2019, and the results of its operations for the year thenended, the changes in its net assets for each of the two years in the period then ended, and the financial highlights for each of thefive years in the period then ended, in conformity with accounting principles generally accepted in the United States of America.
Basis for OpinionThese financial statements and financial highlights are the responsibility of the Fund’s management. Our responsibility is to expressan opinion on the Fund’s financial statements and financial highlights based on our audits. We are a public accounting firmregistered with the Public Company Accounting Oversight Board (United States) (PCAOB) and are required to be independent withrespect to the Fund in accordance with the U.S. federal securities laws and the applicable rules and regulations of the Securities andExchange Commission and the PCAOB.
We conducted our audits in accordance with the standards of the PCAOB. Those standards require that we plan and perform theaudit to obtain reasonable assurance about whether the financial statements and financial highlights are free of materialmisstatement, whether due to error or fraud. The Fund is not required to have, nor were we engaged to perform, an audit of itsinternal control over financial reporting. As part of our audits we are required to obtain an understanding of internal control overfinancial reporting but not for the purpose of expressing an opinion on the effectiveness of the Fund’s internal control over financialreporting. Accordingly, we express no such opinion.
Our audits included performing procedures to assess the risks of material misstatement of the financial statements and financialhighlights, whether due to error or fraud, and performing procedures that respond to those risks. Such procedures includedexamining, on a test basis, evidence regarding the amounts and disclosures in the financial statements and financial highlights. Ouraudits also included evaluating the accounting principles used and significant estimates made by management, as well as evaluatingthe overall presentation of the financial statements and financial highlights. Our procedures included confirmation of securitiesowned as of December 31, 2019, by correspondence with the custodian and brokers. We believe that our audits provide areasonable basis for our opinion.
DELOITTE & TOUCHE LLP
Boston, MassachusettsFebruary 14, 2020
We have served as the auditor of one or more of the MFS investment companies since 1924.
20

MFS Investors Trust Series
TRUSTEES AND OFFICERS – IDENTIFICATION AND BACKGROUND
The Trustees and Officers of the Trust, as of February 1, 2020, are listed below, together with their principal occupations during thepast five years. (Their titles may have varied during that period.) The address of each Trustee and Officer is 111 Huntington Avenue,Boston, Massachusetts 02199-7618.
Name, Age
Position(s)Held
with FundTrustee/Officer
Since (h)
Number ofMFS Funds
overseen by theTrustee
Principal OccupationsDuring the Past Five Years
Other DirectorshipsDuring the Past Five Years (j)
INTERESTED TRUSTEESRobert J. Manning (k)
(age 56)Trustee February 2004 133 Massachusetts Financial Services
Company, Executive Chairman(since January 2017); Director;Chairman of the Board; ChiefExecutive Officer (until 2015);Co-Chief Executive Officer(2015-2016)
N/A
Robin A. Stelmach (k)
(age 58)Trustee January 2014 133 Massachusetts Financial
Services Company, Vice Chair (sinceJanuary 2017); Chief OperatingOfficer and Executive Vice President(until January 2017)
N/A
INDEPENDENT TRUSTEESJohn P. Kavanaugh(age 65)
Trustee andChair ofTrustees
January 2009 133 Private investor N/A
Steven E. Buller(age 68)
Trustee February 2014 133 Financial Accounting StandardsAdvisory Council, Chairman(2014-2015); Public CompanyAccounting Oversight Board,Standing Advisory Group, Member(until 2014); BlackRock, Inc.(investment management),Managing Director (until 2014),BlackRock Finco UK (investmentmanagement), Director (until 2014)
N/A
John A. Caroselli(age 65)
Trustee March 2017 133 JC Global Advisors, LLC(management consulting), President(since 2015); First CapitalCorporation (commercial finance),Executive Vice President (until 2015)
N/A
Maureen R. Goldfarb(age 64)
Trustee January 2009 133 Private investor N/A
Peter D. Jones(age 64)
Trustee January 2019 133 Franklin Templeton Distributors, Inc.(investment management),President (until 2015); FranklinTempleton Institutional, LLC(investment management),Chairman (until 2015)
N/A
James W. Kilman, Jr.(age 58)
Trustee January 2019 133 Burford Capital Limited (finance andinvestment management), ChiefFinancial Officer (since 2019);KielStrand Capital LLC (familyoffice), Chief Executive Officer(since 2016); Morgan Stanley & Co.(financial services), Vice Chairmanof Investment Banking, Co-Head ofDiversified Financials Coverage –Financial Institutions InvestmentBanking Group (until 2016)
Alpha-En Corporation, Director(2016-2019)
21
MFS Investors Trust Series
Trustees and Officers – continued
Name, Age
Position(s)Held
with FundTrustee/Officer
Since (h)
Number ofMFS Funds
overseen by theTrustee
Principal OccupationsDuring the Past Five Years
Other DirectorshipsDuring the Past Five Years (j)
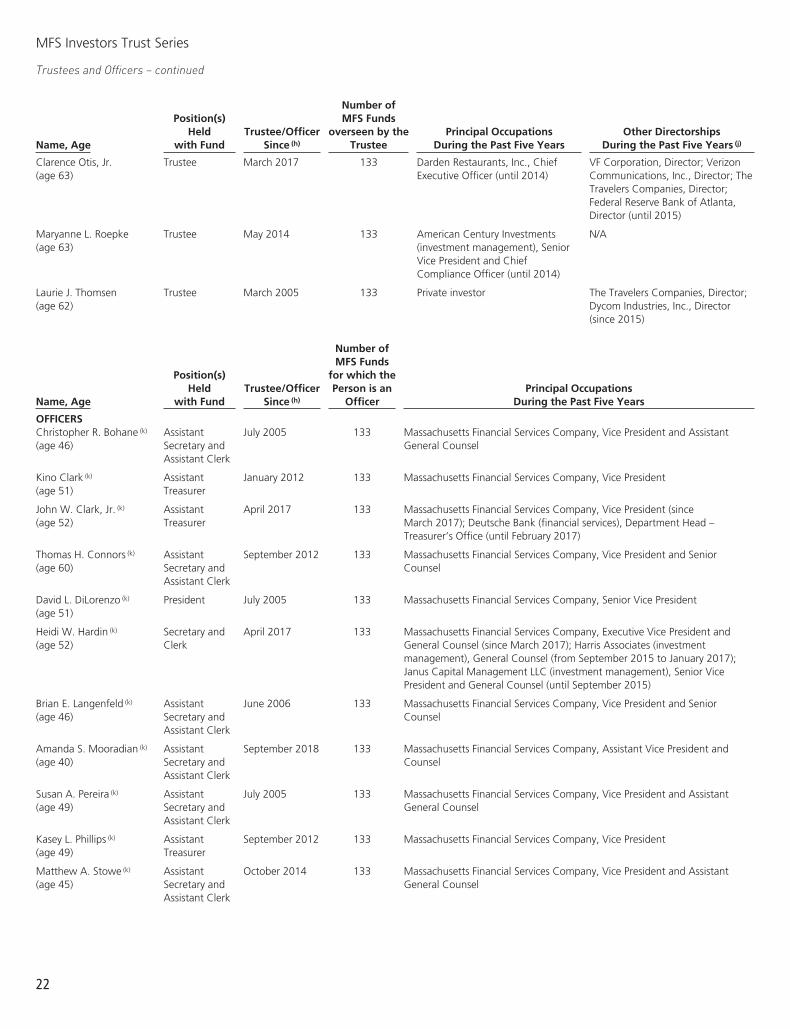
Clarence Otis, Jr.(age 63)
Trustee March 2017 133 Darden Restaurants, Inc., ChiefExecutive Officer (until 2014)
VF Corporation, Director; VerizonCommunications, Inc., Director; TheTravelers Companies, Director;Federal Reserve Bank of Atlanta,Director (until 2015)
Maryanne L. Roepke(age 63)
Trustee May 2014 133 American Century Investments(investment management), SeniorVice President and ChiefCompliance Officer (until 2014)
N/A
Laurie J. Thomsen(age 62)
Trustee March 2005 133 Private investor The Travelers Companies, Director;Dycom Industries, Inc., Director(since 2015)
Name, Age
Position(s)Held
with FundTrustee/Officer
Since (h)
Number ofMFS Funds
for which thePerson is an
OfficerPrincipal Occupations
During the Past Five Years
OFFICERSChristopher R. Bohane (k)
(age 46)AssistantSecretary andAssistant Clerk
July 2005 133 Massachusetts Financial Services Company, Vice President and AssistantGeneral Counsel
Kino Clark (k)
(age 51)AssistantTreasurer
January 2012 133 Massachusetts Financial Services Company, Vice President
John W. Clark, Jr. (k)
(age 52)AssistantTreasurer
April 2017 133 Massachusetts Financial Services Company, Vice President (sinceMarch 2017); Deutsche Bank (financial services), Department Head –Treasurer’s Office (until February 2017)
Thomas H. Connors (k)
(age 60)AssistantSecretary andAssistant Clerk
September 2012 133 Massachusetts Financial Services Company, Vice President and SeniorCounsel
David L. DiLorenzo (k)
(age 51)President July 2005 133 Massachusetts Financial Services Company, Senior Vice President
Heidi W. Hardin (k)
(age 52)Secretary andClerk
April 2017 133 Massachusetts Financial Services Company, Executive Vice President andGeneral Counsel (since March 2017); Harris Associates (investmentmanagement), General Counsel (from September 2015 to January 2017);Janus Capital Management LLC (investment management), Senior VicePresident and General Counsel (until September 2015)
Brian E. Langenfeld (k)
(age 46)AssistantSecretary andAssistant Clerk
June 2006 133 Massachusetts Financial Services Company, Vice President and SeniorCounsel
Amanda S. Mooradian (k)
(age 40)AssistantSecretary andAssistant Clerk
September 2018 133 Massachusetts Financial Services Company, Assistant Vice President andCounsel
Susan A. Pereira (k)
(age 49)AssistantSecretary andAssistant Clerk
July 2005 133 Massachusetts Financial Services Company, Vice President and AssistantGeneral Counsel
Kasey L. Phillips (k)
(age 49)AssistantTreasurer
September 2012 133 Massachusetts Financial Services Company, Vice President
Matthew A. Stowe (k)
(age 45)AssistantSecretary andAssistant Clerk
October 2014 133 Massachusetts Financial Services Company, Vice President and AssistantGeneral Counsel
22

MFS Investors Trust Series
Trustees and Officers – continued
Name, Age
Position(s)Held
with FundTrustee/Officer
Since (h)
Number ofMFS Funds
for which thePerson is an
OfficerPrincipal Occupations
During the Past Five Years
Martin J. Wolin (k)
(age 52)ChiefComplianceOfficer
July 2015 133 Massachusetts Financial Services Company, Senior Vice President and ChiefCompliance Officer (since July 2015); Mercer (financial service provider),Chief Risk and Compliance Officer, North America and Latin America (untilJune 2015)
James O. Yost (k)
(age 59)Treasurer September 1990 133 Massachusetts Financial Services Company, Senior Vice President
(h) Date first appointed to serve as Trustee/officer of an MFS Fund. Each Trustee has served continuously since appointment unless indicated otherwise.For the period from December 15, 2004 until February 22, 2005, Mr. Manning served as Advisory Trustee. From January 2012 throughDecember 2016, Messrs. DiLorenzo and Yost served as Treasurer and Deputy Treasurer of the Funds, respectively.
(j) Directorships or trusteeships of companies required to report to the Securities and Exchange Commission (i.e., “public companies”).
(k) “Interested person” of the Trust within the meaning of the Investment Company Act of 1940 (referred to as the 1940 Act), which is the principalfederal law governing investment companies like the fund, as a result of a position with MFS. The address of MFS is 111 Huntington Avenue,Boston, Massachusetts 02199-7618.
Each Trustee (other than Messrs. Jones and Kilman) has been elected by shareholders and each Trustee and Officer holds office untilhis or her successor is chosen and qualified or until his or her earlier death, resignation, retirement or removal. Messrs. Jones andKilman became Trustees of the Funds on January 1, 2019. The Trust does not hold annual meetings for the purpose of electingTrustees, and Trustees are not elected for fixed terms. Under the terms of the Board’s retirement policy, an Independent Trustee shallretire at the end of the calendar year in which he or she reaches the earlier of 75 years of age or 15 years of service on the Board (or,in the case of any Independent Trustee who joined the Board prior to 2015, 20 years of service on the Board).
Messrs. Buller, Kilman and Otis and Ms. Roepke are members of the Trust’s Audit Committee.
Each of the Interested Trustees and certain Officers hold comparable officer positions with certain affiliates of MFS.
The Statement of Additional Information for a Fund includes further information about the Trustees and is available without chargeupon request by calling 1-800-225-2606.
Investment AdviserMassachusetts Financial Services Company111 Huntington AvenueBoston, MA 02199-7618
CustodianState Street Bank and Trust Company1 Lincoln StreetBoston, MA 02111-2900
DistributorMFS Fund Distributors, Inc.111 Huntington AvenueBoston, MA 02199-7618
Independent Registered Public Accounting FirmDeloitte & Touche LLP200 Berkeley StreetBoston, MA 02116
Portfolio Manager(s)Kevin BeattyAlison O’Neill MackeyTed Maloney
23

MFS Investors Trust Series
BOARD REVIEW OF INVESTMENT ADVISORY AGREEMENT
MFS Investors Trust SeriesThe Investment Company Act of 1940 requires that both the full Board of Trustees and a majority of the non-interested(“independent”) Trustees, voting separately, annually approve the continuation of the Fund’s investment advisory agreement withMFS. The Trustees consider matters bearing on the Fund and its advisory arrangements at their meetings throughout the year,including a review of performance data at each regular meeting. In addition, the independent Trustees met several times over thecourse of three months beginning in May and ending in July, 2019 (“contract review meetings”) for the specific purpose ofconsidering whether to approve the continuation of the investment advisory agreement for the Fund and the other investmentcompanies that the Board oversees (the “MFS Funds”). The independent Trustees were assisted in their evaluation of the Fund’sinvestment advisory agreement by independent legal counsel, from whom they received separate legal advice and with whom theymet separately from MFS during various contract review meetings. The independent Trustees were also assisted in this process by theMFS Funds’ Independent Senior Officer, a senior officer appointed by and reporting to the independent Trustees.
In connection with their deliberations regarding the continuation of the investment advisory agreement, the Trustees, including theindependent Trustees, considered such information and factors as they believed, in light of the legal advice furnished to them andtheir own business judgment, to be relevant. The investment advisory agreement for the Fund was considered separately, althoughthe Trustees also took into account the common interests of all MFS Funds in their review. As described below, the Trusteesconsidered the nature, quality, and extent of the various investment advisory, administrative, and shareholder services performed byMFS under the existing investment advisory agreement and other arrangements with the Fund.
In connection with their contract review meetings, the Trustees received and relied upon materials that included, among other items:(i) information provided by Broadridge Financial Solutions, Inc. (“Broadridge”), an independent third party, on the investmentperformance of the Fund for various time periods ended December 31, 2018 and the investment performance of a group of fundswith substantially similar investment classifications/objectives (the “Broadridge performance universe”), (ii) information provided byBroadridge on the Fund’s advisory fees and other expenses and the advisory fees and other expenses of comparable funds identifiedby Broadridge as well as all other funds in the same investment classification/category (the “Broadridge expense group anduniverse”), (iii) information provided by MFS on the advisory fees of portfolios of other clients of MFS, including institutional separateaccounts and other clients, (iv) information as to whether and to what extent applicable expense waivers, reimbursements or fee“breakpoints” are observed for the Fund, (v) information regarding MFS’ financial results and financial condition, including MFS’ andcertain of its affiliates’ estimated profitability from services performed for the Fund and the MFS Funds as a whole, and compared toMFS’ institutional business, (vi) MFS’ views regarding the outlook for the mutual fund industry and the strategic business plans ofMFS, (vii) descriptions of various functions performed by MFS for the Funds, such as compliance monitoring and portfolio tradingpractices, and (viii) information regarding the overall organization of MFS, including information about MFS’ senior management andother personnel providing investment advisory, administrative and other services to the Fund and the other MFS Funds. Thecomparative performance, fee and expense information prepared and provided by Broadridge was not independently verified andthe independent Trustees did not independently verify any information provided to them by MFS.
The Trustees’ conclusion as to the continuation of the investment advisory agreement was based on a comprehensive considerationof all information provided to the Trustees and not the result of any single factor. Some of the factors that figured particularly in theTrustees’ deliberations are described below, although individual Trustees may have evaluated the information presented differentlyfrom one another, giving different weights to various factors. It is also important to recognize that the fee arrangements for theFund and other MFS Funds are the result of years of review and discussion between the independent Trustees and MFS, that certainaspects of such arrangements may receive greater scrutiny in some years than in others, and that the Trustees’ conclusions may bebased, in part, on their consideration of these same arrangements during the course of the year and in prior years.
Based on information provided by Broadridge and MFS, the Trustees reviewed the Fund’s total return investment performance aswell as the Broadridge performance universe over various time periods. The Trustees placed particular emphasis on the total returnperformance of the Fund’s Initial Class shares in comparison to the performance of funds in its Broadridge performance universe overthe five-year period ended December 31, 2018, which the Trustees believed was a long enough period to reflect differing marketconditions. The total return performance of the Fund’s Initial Class shares was in the 3rd quintile relative to the other funds in theuniverse for this five-year period (the 1st quintile being the best performers and the 5th quintile being the worst performers). Thetotal return performance of the Fund’s Initial Class shares was in the 3rd quintile for the each of the one- and three-year periodsended December 31, 2018 relative to the Broadridge performance universe. Because of the passage of time, these performanceresults may differ from the performance results for more recent periods, including those shown elsewhere in this report.
In the course of their deliberations, the Trustees took into account information provided by MFS in connection with the contractreview meetings, as well as during investment review meetings conducted with portfolio management personnel during the courseof the year regarding the Fund’s performance. After reviewing these and related factors, the Trustees concluded, within the contextof their overall conclusions regarding the investment advisory agreement, that they were satisfied with MFS’ responses and effortsrelating to investment performance.
24

MFS Investors Trust Series
Board Review of Investment Advisory Agreement – continued
In assessing the reasonableness of the Fund’s advisory fee, the Trustees considered, among other information, the Fund’s advisoryfee and the total expense ratio of the Fund’s Initial Class shares as a percentage of average daily net assets and the advisory fee andtotal expense ratios of the Broadridge expense group based on information provided by Broadridge. The Trustees considered thatMFS currently observes an expense limitation for the Fund, which may not be changed without the Trustees’ approval. The Trusteesalso considered that, according to the data provided by Broadridge (which takes into account any fee reductions or expenselimitations that were in effect during the Fund’s last fiscal year), the Fund’s effective advisory fee rate and total expense ratio wereeach higher than the Broadridge expense group median.
The Trustees also considered the advisory fees charged by MFS to any institutional separate accounts advised by MFS (“separateaccounts”) and unaffiliated investment companies for which MFS serves as subadviser (“subadvised funds”) that have comparableinvestment strategies to the Fund, if any. In comparing these fees, the Trustees considered information provided by MFS as to thegenerally broader scope of services provided by MFS to the Fund, as well as the more extensive regulatory burdens imposed on MFSin managing the Fund, in comparison to separate accounts and subadvised funds. The Trustees also considered the higher demandsplaced on MFS’ investment personnel and trading infrastructure as a result of the daily cash in-flows and out-flows of the Fund incomparison to separate accounts.
The Trustees also considered whether the Fund may benefit from any economies of scale in the management of the Fund in theevent of growth in assets of the Fund and/or growth in assets of the MFS Funds as a whole. They noted that the Fund’s advisory feerate schedule is subject to contractual breakpoints that reduce the Fund’s advisory fee rate on average daily net assets over $1 billionand $2.5 billion. The Trustees also noted that MFS has agreed in writing to waive a portion of the management fees of certain MFSFunds, including the Fund, if the total combined assets of certain funds within the MFS Funds’ complex increase above agreed uponthresholds (the “group fee waiver”), enabling the Fund’s shareholders to share in the benefits from any economies of scale at thecomplex level. The group fee waiver is reviewed and renewed annually between the Board and MFS. The Trustees concluded that thebreakpoints and the group fee waiver were sufficient to allow the Fund to benefit from economies of scale as its assets and overallcomplex assets grow.
The Trustees also considered information prepared by MFS relating to MFS’ costs and profits with respect to the Fund, the MFSFunds considered as a group, and other investment companies and accounts advised by MFS, as well as MFS’ methodologies used todetermine and allocate its costs to the MFS Funds, the Fund and other accounts and products for purposes of estimating profitability.
After reviewing these and other factors described herein, the Trustees concluded, within the context of their overall conclusionsregarding the investment advisory agreement, that the advisory fees charged to the Fund represent reasonable compensation in lightof the services being provided by MFS to the Fund.
In addition, the Trustees considered MFS’ resources and related efforts to continue to retain, attract and motivate capable personnelto serve the Fund. The Trustees also considered current and developing conditions in the financial services industry, including thepresence of large and well-capitalized companies which are spending, and appear to be prepared to continue to spend, substantialsums to engage personnel and to provide services to competing investment companies. In this regard, the Trustees also consideredthe financial resources of MFS and its ultimate parent, Sun Life Financial Inc. The Trustees also considered the advantages andpossible disadvantages to the Fund of having an adviser that also serves other investment companies as well as other accounts.
The Trustees also considered the nature, quality, cost, and extent of administrative, transfer agency, and distribution servicesprovided to the Fund by MFS and its affiliates under agreements and plans other than the investment advisory agreement, includingany 12b-1 fees the Fund pays to MFS Fund Distributors, Inc., an affiliate of MFS. The Trustees also considered the nature, extent andquality of certain other services MFS performs or arranges for on the Fund’s behalf, which may include securities lending programs,directed expense payment programs, class action recovery programs, and MFS’ interaction with third-party service providers,principally custodians and sub-custodians. The Trustees concluded that the various non-advisory services provided by MFS and itsaffiliates on behalf of the Fund were satisfactory.
The Trustees considered so-called “fall-out benefits” to MFS such as reputational value derived from serving as investment managerto the MFS Funds. The Trustees also considered that, effective January 3, 2018, MFS had discontinued its historic practice ofobtaining investment research from portfolio brokerage commissions paid by certain MFS Funds and would thereafter directly pay foror voluntarily reimburse a Fund, if applicable, for the costs of external research acquired through the use of the Fund’s portfoliobrokerage commissions.
Based on their evaluation of factors that they deemed to be material, including those factors described above, the Board of Trustees,including the independent Trustees, concluded that the Fund’s investment advisory agreement with MFS should be continued for anadditional one-year period, commencing August 1, 2019.
25

MFS Investors Trust Series
PROXY VOTING POLICIES AND INFORMATION
MFS votes proxies on behalf of the fund pursuant to proxy voting policies and procedures that are available without charge, uponrequest, by calling 1-800-225-2606, by visiting mfs.com/proxyvoting, or by visiting the SEC’s Web site at http://www.sec.gov.
Information regarding how the fund voted proxies relating to portfolio securities during the most recent twelve-month period endedJune 30 is available by August 31 of each year without charge by visiting mfs.com/proxyvoting, or by visiting the SEC’s Web site athttp://www.sec.gov.
QUARTERLY PORTFOLIO DISCLOSURE
The fund files a complete schedule of portfolio holdings with the SEC for the first and third quarters of each fiscal year as an exhibitto its reports on Form N-PORT. The fund’s Form N-PORT reports are available on the SEC’s website at http://www.sec.gov. Ashareholder can obtain the portfolio holdings report for the first and third quarters of the fund’s fiscal year at mfs.com/vit1 bychoosing the fund’s name and then selecting the “Resources” tab and clicking on “Prospectus and Reports”.
FURTHER INFORMATION
From time to time, MFS may post important information about the fund or the MFS funds on the MFS web site (mfs.com). Thisinformation is available at https://www.mfs.com/en-us/what-we-do/announcements.html or at mfs.com/vit1 by choosing the fund’sname.
INFORMATION ABOUT FUND CONTRACTS AND LEGAL CLAIMS
The fund has entered into contractual arrangements with an investment adviser, administrator, distributor, shareholder servicingagent, 529 program manager (if applicable), and custodian who each provide services to the fund. Unless expressly stated otherwise,shareholders are not parties to, or intended beneficiaries of these contractual arrangements, and these contractual arrangements arenot intended to create any shareholder right to enforce them against the service providers or to seek any remedy under them againstthe service providers, either directly or on behalf of the fund.
Under the Trust’s By-Laws and Declaration of Trust, any claims asserted against or on behalf of the MFS Funds, including claimsagainst Trustees and Officers, must be brought in state and federal courts located within the Commonwealth of Massachusetts.
FEDERAL TAX INFORMATION (unaudited)
The following information is provided pursuant to provisions of the Internal Revenue Code.
The fund designates $40,543,000 as capital gain dividends paid during the fiscal year.
For corporate shareholders, 100% of the ordinary income dividends paid during the fiscal year qualify for the corporate dividendsreceived deduction.
26
rev. 3/16
FACTSWHAT DOES MFS DO WITH YOURPERSONAL INFORMATION?
Why? Financial companies choose how they share your personal information. Federal lawgives consumers the right to limit some but not all sharing. Federal law also requires usto tell you how we collect, share, and protect your personal information. Please readthis notice carefully to understand what we do.
What? The types of personal information we collect and share depend on the product orservice you have with us. This information can include:
• Social Security number and account balances• Account transactions and transaction history• Checking account information and wire transfer instructions
When you are no longer our customer, we continue to share your information asdescribed in this notice.
How? All financial companies need to share customers’ personal information to run theireveryday business. In the section below, we list the reasons financial companies canshare their customers’ personal information; the reasons MFS chooses to share; andwhether you can limit this sharing.
Reasons we can share yourpersonal information
Does MFS share? Can you limit thissharing?
For our everyday business purposes –such as to process your transactions, maintain youraccount(s), respond to court orders and legalinvestigations, or report to credit bureaus
Yes No
For our marketing purposes –to offer our products and services to you
No We don’t share
For joint marketing with otherfinancial companies
No We don’t share
For our affiliates’ everyday business purposes –information about your transactions and experiences
No We don’t share
For our affiliates’ everyday business purposes –information about your creditworthiness
No We don’t share
For nonaffiliates to market to you No We don’t share
Questions? Call 800-225-2606 or go to mfs.com.
27

Page 2
Who we areWho is providing this notice? MFS Funds, MFS Investment Management, MFS Institutional Advisors,
Inc., and MFS Heritage Trust Company.
What we doHow does MFSprotect my personalinformation?
To protect your personal information from unauthorized access anduse, we use security measures that comply with federal law. Thesemeasures include procedural, electronic, and physical safeguards for theprotection of the personal information we collect about you.
How does MFScollect my personalinformation?
We collect your personal information, for example, when you
• open an account or provide account information• direct us to buy securities or direct us to sell your securities• make a wire transfer
We also collect your personal information from others, such as creditbureaus, affiliates, or other companies.
Why can’t I limit all sharing? Federal law gives you the right to limit only
• sharing for affiliates’ everyday business purposes – informationabout your creditworthiness
• affiliates from using your information to market to you• sharing for nonaffiliates to market to you
State laws and individual companies may give you additional rights tolimit sharing.
DefinitionsAffiliates Companies related by common ownership or control. They can be
financial and nonfinancial companies.
• MFS does not share personal information with affiliates, except for everyday businesspurposes as described on page one of this notice.
Nonaffiliates Companies not related by common ownership or control. They can befinancial and nonfinancial companies.
• MFS does not share with nonaffiliates so they can market to you.
Joint marketing A formal agreement between nonaffiliated financial companies thattogether market financial products or services to you.
• MFS doesn’t jointly market.
Other important informationIf you own an MFS product or receive an MFS service in the name of a third party such as a bank or broker-dealer, their privacy policy may apply to you instead of ours.
28