Metropolitan Washington Airports Authority Sustainability ...
124
APPENDIX A Metropolitan Washington Airports Authority Sustainability Reports A.1 | FINAL 2020 SUSTAINABILITY PLAN A.2 | 2020 CORPORATE SOCIAL RESPONSIBILITY REPORT
Transcript of Metropolitan Washington Airports Authority Sustainability ...
APPENDIX A
Metropolitan Washington Airports Authority Sustainability Reports
A.1 | FINAL 2020 SUSTAINABILITY PLAN
A.2 | 2020 CORPORATE SOCIAL RESPONSIBILITY REPORT

APPENDIX A.1
Final 2020 Sustainability Plan

METROPOLITAN
WASHINGTON AIRPORTS
AUTHORITY (MWAA)
September 25, 2020
FINAL 2020 SUSTAINABILITY PLAN
1
2
Contents
Sustainability Mission and Vision ................................................................................................................... 3
Overview ........................................................................................................................................................ 4
Roles and Responsibilities ............................................................................................................................. 4
Partners in Sustainability ............................................................................................................................... 4
Sustainability Plan Creation ........................................................................................................................... 6
Sustainability Plan Benefits ........................................................................................................................... 8
Reduce Fuel Use through Electrification of Transportation Systems ........................................................... 10
Increase Efficiency of Our Built Environment ............................................................................................... 24
Reduce Municipal Solid Waste .................................................................................................................... 32
Develop and Maintain a Culture of Sustainable Administration ................................................................... 39
Increase Water Use Efficiency ..................................................................................................................... 44
Encourage Efficient Use of Public Transportation........................................................................................ 48
Greenhouse Gas Emissions Inventory ........................................................................................................ 51
Resiliency .................................................................................................................................................... 57
Next Steps ................................................................................................................................................... 59
3
Sustainability Mission and Vision
Sustainability Mission
The Metropolitan Washington Airports Authority (the “Authority”), as the operator of the airports in the nation’s capital region and the Dulles Toll Road, is committed to managing its operations in a manner that balances environmental sustainability, operational resiliency, and fiscal responsibility. We strive to be a good neighbor to our surrounding communities, a responsible employer to our employees, a valued partner to our tenants and concessionaires, and a welcoming host to our airport customers.
Sustainability Vision
Sustainability has been defined as “meeting the needs of the present without compromising the ability of future generations to meet their own needs.”1 For the Authority, we intend to demonstrate our commitment to sustainability by focusing on the following six overarching goals:
Reduce fuel use through electrification of our transportation systems
Increase efficiency of our built environment
Increase water use efficiency
Reduce the amount of municipal solid waste we generate and send to landfills
Develop and maintain a culture of sustainable administration
Encourage efficient use of public transportation.
We believe that these goals will be easily understood by our customers and employees while also giving us flexibility both in terms of the individual actions we undertake to meet these goals and which ones we choose to focus on at different points in time. This flexibility is particularly important now given the recent and dramatic decline in airline traffic due to COVID-19 and the negative impacts on our financial position. As a result, in the near term, we will focus on continuing those activities that we are doing already such as glycol recovery and LED lighting retrofits, initiating new activities that have a relatively low cost of implementation such as additional education and training related to recycling, and leveraging outside funding for more capital-intensive investments such as the electrification of our passenger transfer vehicles (PTVs). Conversely, while increasing the use of public transit is an important goal for the Authority, the impact of COVID-19 on the region currently makes it a lower-priority focus area for us in the near term. Finally, as we pursue these six goals under the Sustainability Plan, we will reduce our impacts on the surrounding natural environment, improve local air quality, become more resilient, and reduce our emissions of global greenhouse gases. Many of these goals will be further supported in the updated Airports Authority Design Manual so that as we invest in new infrastructure across our facilities, we are designing and building with higher minimum sustainability standards, anticipating a more electrified future, and clearly communicating our priorities to our partners, contractors, and service providers.
1 United Nations World Commission on Environment and Development (Brundtland Commission). 1987. Our
common future. Oxford: Oxford University Press.
4
Overview As the operator of Ronald Reagan Washington National Airport (“Reagan National”) and Washington Dulles International Airport (“Dulles International”), we are responsible for construction, operations, protection, and maintenance of both airports. We are also responsible for the operation and maintenance of the Dulles Toll Road (DTR) and construction of the Silver Line extension of the Washington, D.C. Metrorail system. We are committed to further reducing our environmental impacts by accomplishing the sustainability goals we have set for ourselves and outlined herein, even though our performance currently meets all federal and state environmental compliance requirements.
Guiding Principles
In the administration of the Authority’s Sustainability Mission, we will be guided by the following sustainability principles:
Roles and Responsibilities The Authority’s Office of Engineering (OE) is the lead department within the organization for oversight of the development of the Sustainability Plan and the Design Manual. OE will also be responsible for the implementation and monitoring of the Plan and its impacts. Providing high level guidance is the Board of Director’s Sustainability Committee. As is referenced below, the Plan recommends the creation of a cross-functional sustainability committee comprised of relevant Authority functional experts as well as representatives from airlines, concessionaires and service providers. This committee is to be chaired by a representative of the OE and will periodically report on its progress to the Board of Director’s Sustainability Committee.
Partners in Sustainability While there is much we can accomplish on our own, such as installing efficient lighting throughout our airport terminals or providing free access to electric vehicle (EV) charging stations for our customers, we need the help of our partners to achieve our most ambitious goals. Therefore, we will propose the formation of a sustainability committee with representation and management advocacy from airlines, concessionaires, and service providers to establish common goals, realistic expectations, priorities, and implementation strategies. Furthermore, we will work collaboratively with our stakeholders, customers, and surrounding communities to offer opportunities and choices to all employees and visitors that, collectively, will significantly and measurably reduce our environmental footprint. As we enter this new chapter in our sustainability planning process, we recognize the important contributions that our many partners will make over the upcoming years in helping us meet our goals.
o The Authority meets or exceeds our goals through the administration of assets and operations we control and
inspire and influence behaviors and choices by other stakeholders at our facilities through strong leadership
and a commitment to partnership.
o Sustainability investment decisions will be made based on adherence to our mission, likelihood of goal
achievement, and an appropriate return on investment, ensuring balanced financial and environmental
responsibilities.
5
Operations
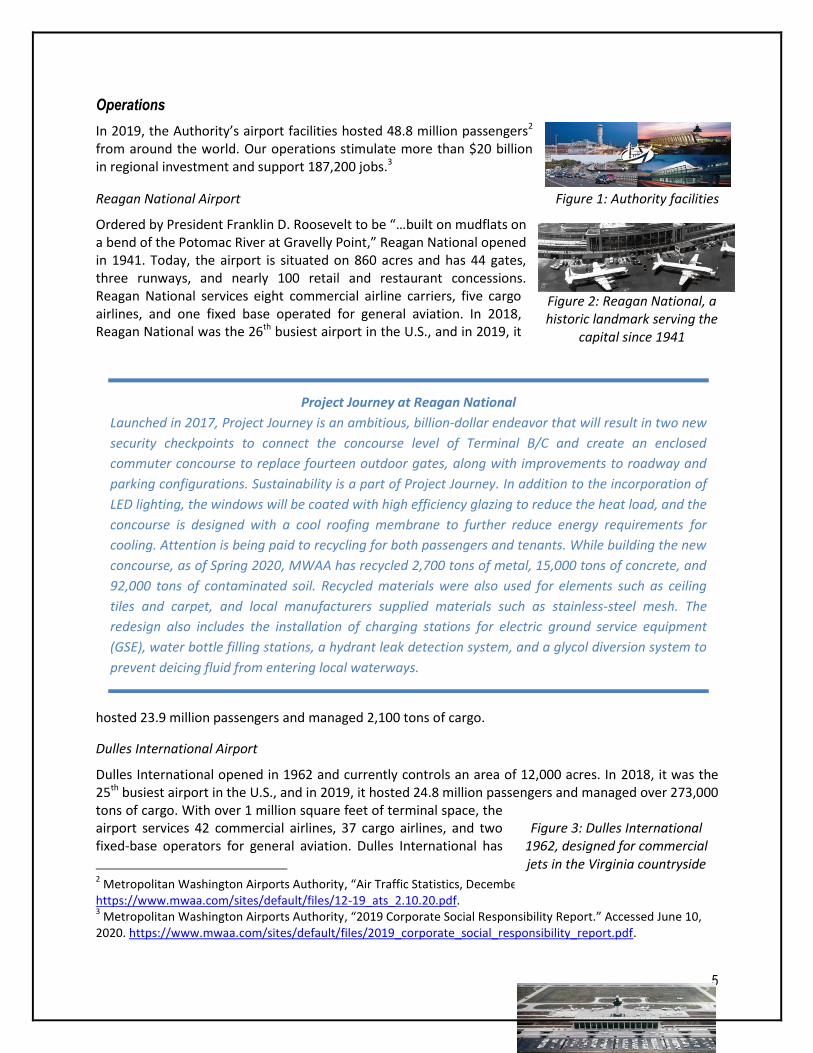
In 2019, the Authority’s airport facilities hosted 48.8 million passengers2 from around the world. Our operations stimulate more than $20 billion in regional investment and support 187,200 jobs.3
Reagan National Airport
Ordered by President Franklin D. Roosevelt to be “…built on mudflats on a bend of the Potomac River at Gravelly Point,” Reagan National opened in 1941. Today, the airport is situated on 860 acres and has 44 gates, three runways, and nearly 100 retail and restaurant concessions. Reagan National services eight commercial airline carriers, five cargo airlines, and one fixed base operated for general aviation. In 2018, Reagan National was the 26th busiest airport in the U.S., and in 2019, it
hosted 23.9 million passengers and managed 2,100 tons of cargo.
Dulles International Airport
Dulles International opened in 1962 and currently controls an area of 12,000 acres. In 2018, it was the 25th busiest airport in the U.S., and in 2019, it hosted 24.8 million passengers and managed over 273,000 tons of cargo. With over 1 million square feet of terminal space, the airport services 42 commercial airlines, 37 cargo airlines, and two fixed-base operators for general aviation. Dulles International has
2 Metropolitan Washington Airports Authority, “Air Traffic Statistics, December 2019.” Accessed June 10, 2020.
https://www.mwaa.com/sites/default/files/12-19_ats_2.10.20.pdf. 3 Metropolitan Washington Airports Authority, “2019 Corporate Social Responsibility Report.” Accessed June 10,
2020. https://www.mwaa.com/sites/default/files/2019_corporate_social_responsibility_report.pdf.
Figure 2: Reagan National, a historic landmark serving the
capital since 1941
Figure 3: Dulles International 1962, designed for commercial jets in the Virginia countryside
Figure 1: Authority facilities
Project Journey at Reagan National
Launched in 2017, Project Journey is an ambitious, billion-dollar endeavor that will result in two new
security checkpoints to connect the concourse level of Terminal B/C and create an enclosed
commuter concourse to replace fourteen outdoor gates, along with improvements to roadway and
parking configurations. Sustainability is a part of Project Journey. In addition to the incorporation of
LED lighting, the windows will be coated with high efficiency glazing to reduce the heat load, and the
concourse is designed with a cool roofing membrane to further reduce energy requirements for
cooling. Attention is being paid to recycling for both passengers and tenants. While building the new
concourse, as of Spring 2020, MWAA has recycled 2,700 tons of metal, 15,000 tons of concrete, and
92,000 tons of contaminated soil. Recycled materials were also used for elements such as ceiling
tiles and carpet, and local manufacturers supplied materials such as stainless-steel mesh. The
redesign also includes the installation of charging stations for electric ground service equipment
(GSE), water bottle filling stations, a hydrant leak detection system, and a glycol diversion system to
prevent deicing fluid from entering local waterways.
6
135 gates, 4 runways, and nearly 100 retail and restaurant concessions.
Dulles Toll Road
The DTR (Virginia Route 267) is 14 miles long with 4 lanes in each direction. It provides direct access to Dulles International. We have over 90 million revenue transactions each year. The Authority
assumed operating control of the DTR in 2009 and uses a portion of the toll revenue to support the Silver Line Project.
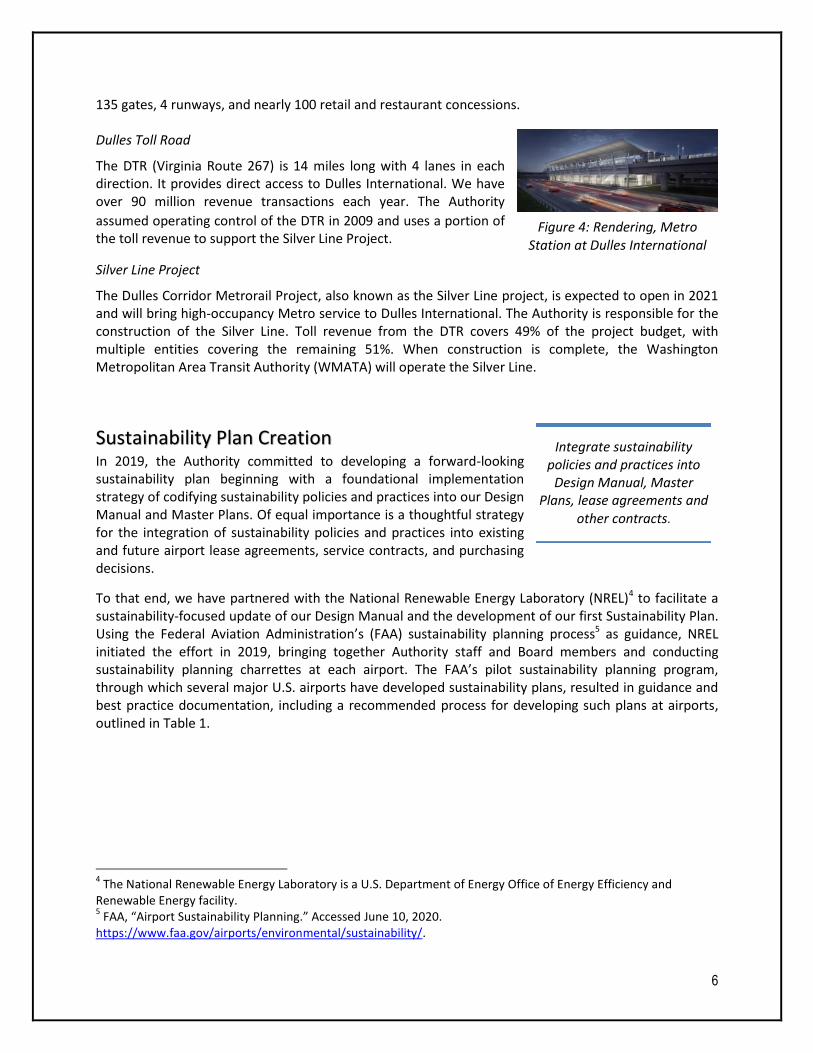
Silver Line Project
The Dulles Corridor Metrorail Project, also known as the Silver Line project, is expected to open in 2021 and will bring high-occupancy Metro service to Dulles International. The Authority is responsible for the construction of the Silver Line. Toll revenue from the DTR covers 49% of the project budget, with multiple entities covering the remaining 51%. When construction is complete, the Washington Metropolitan Area Transit Authority (WMATA) will operate the Silver Line.
Sustainability Plan Creation In 2019, the Authority committed to developing a forward-looking sustainability plan beginning with a foundational implementation strategy of codifying sustainability policies and practices into our Design Manual and Master Plans. Of equal importance is a thoughtful strategy for the integration of sustainability policies and practices into existing and future airport lease agreements, service contracts, and purchasing decisions.
To that end, we have partnered with the National Renewable Energy Laboratory (NREL)4 to facilitate a sustainability-focused update of our Design Manual and the development of our first Sustainability Plan. Using the Federal Aviation Administration’s (FAA) sustainability planning process5 as guidance, NREL initiated the effort in 2019, bringing together Authority staff and Board members and conducting sustainability planning charrettes at each airport. The FAA’s pilot sustainability planning program, through which several major U.S. airports have developed sustainability plans, resulted in guidance and best practice documentation, including a recommended process for developing such plans at airports, outlined in Table 1.
4 The National Renewable Energy Laboratory is a U.S. Department of Energy Office of Energy Efficiency and
Renewable Energy facility. 5 FAA, “Airport Sustainability Planning.” Accessed June 10, 2020.
https://www.faa.gov/airports/environmental/sustainability/.
Integrate sustainability policies and practices into
Design Manual, Master Plans, lease agreements and
other contracts.
Figure 4: Rendering, Metro Station at Dulles International

7
Table 1: FAA Planning Process (Modified by NREL)
Together, Authority employees and Board members developed a sustainability plan mission statement, identified current sustainability initiatives, and identified opportunities and limitations associated with potential future sustainability activities. This dialogue informed sustainability goals and activities included in this document. Furthermore, the charrettes included an overview of airport energy and water use, municipal solid waste (MSW) generation, and vehicle fleet composition data collected and analyzed by NREL in preparation for each event. This data was incorporated into baseline inventories for both airports by which future progress can be measured.
Successful implementation of our sustainability goals and initiatives will require committed, collaborative, and continuous effort from all our employees and stakeholders in what will be an iterative process, including:
Internal commitment and engagement including management support, a sustainability team, and adequate resources
Stakeholder engagement with our tenants, concessionaires, and other industry and community partners
Ongoing updates to the Sustainability Plan informed by new data and the results of additional technical and economic analyses
Periodic review and improvement examining quality, progress, and the development of new goals.
This process, combined with years of experience and knowledge in efficiently and effectively operating our facilities, has been used to formulate and prioritize the Authority’s sustainability goals, identify measures of success, and plan for future initiatives that will build on our sustainability accomplishments. While we are still formalizing our process, a noteworthy amount of investment and activity has been underway for many years. Recognizing and continuing the successful sustainable activities already being carried out by our staff is an important component of this Sustainability Plan.
8
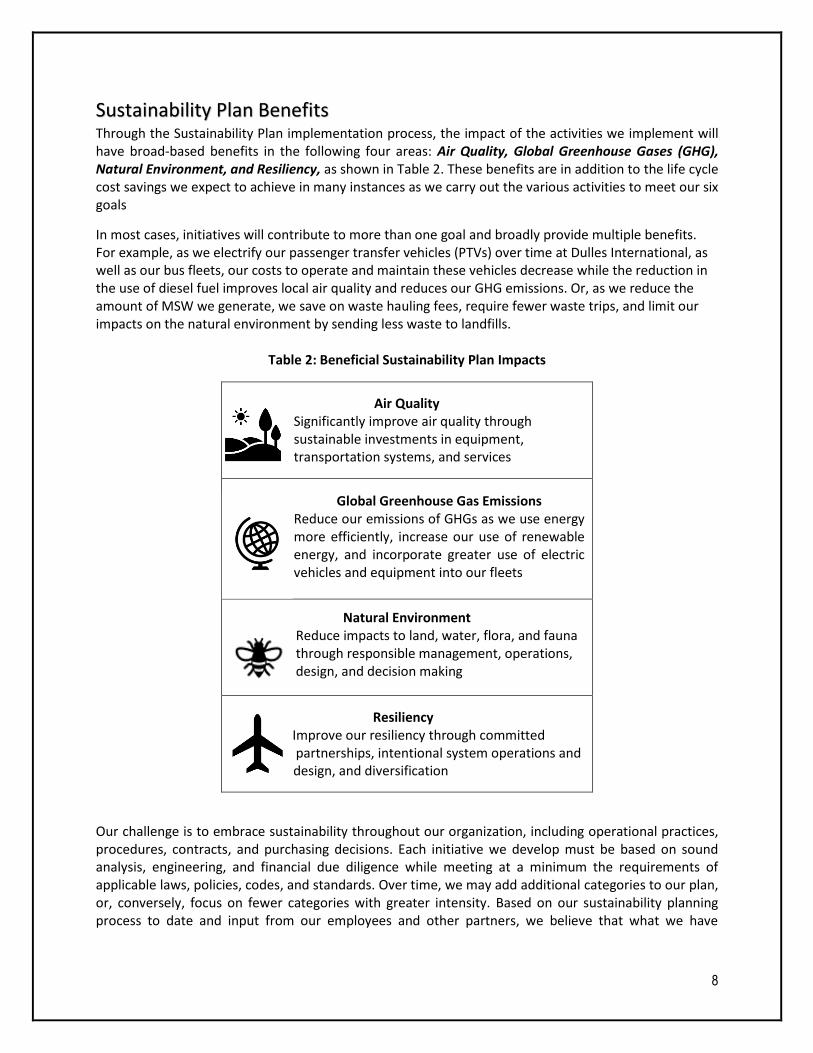
Sustainability Plan Benefits Through the Sustainability Plan implementation process, the impact of the activities we implement will have broad-based benefits in the following four areas: Air Quality, Global Greenhouse Gases (GHG), Natural Environment, and Resiliency, as shown in Table 2. These benefits are in addition to the life cycle cost savings we expect to achieve in many instances as we carry out the various activities to meet our six goals
In most cases, initiatives will contribute to more than one goal and broadly provide multiple benefits. For example, as we electrify our passenger transfer vehicles (PTVs) over time at Dulles International, as well as our bus fleets, our costs to operate and maintain these vehicles decrease while the reduction in the use of diesel fuel improves local air quality and reduces our GHG emissions. Or, as we reduce the amount of MSW we generate, we save on waste hauling fees, require fewer waste trips, and limit our impacts on the natural environment by sending less waste to landfills.
Table 2: Beneficial Sustainability Plan Impacts
Air Quality Significantly improve air quality through sustainable investments in equipment, transportation systems, and services
Global Greenhouse Gas Emissions Reduce our emissions of GHGs as we use energy more efficiently, increase our use of renewable energy, and incorporate greater use of electric vehicles and equipment into our fleets
Natural Environment Reduce impacts to land, water, flora, and fauna through responsible management, operations, design, and decision making
Resiliency Improve our resiliency through committed partnerships, intentional system operations and design, and diversification
Our challenge is to embrace sustainability throughout our organization, including operational practices, procedures, contracts, and purchasing decisions. Each initiative we develop must be based on sound analysis, engineering, and financial due diligence while meeting at a minimum the requirements of applicable laws, policies, codes, and standards. Over time, we may add additional categories to our plan, or, conversely, focus on fewer categories with greater intensity. Based on our sustainability planning process to date and input from our employees and other partners, we believe that what we have
9
identified in this initial Sustainability Plan provides the appropriate foundation and initial goals for success.
In the following sections of this report, we present our six goals and the activities we are taking, or plan to take, to meet these goals. For each goal, we have established a baseline from which to measure our success over time. We present our existing activities, those activities that we consider strategic and often unique to our airports, as well as opportunities that many of our peer airports are already implementing. Where data is available, we present a cost-benefit analysis and address other co-benefits from implementation. Following the presentation of the six goals are sections detailing the results of our initial GHG inventory and our new resiliency planning process. Following this first Sustainability Plan for the Authority, we intend to make public, annual updates to our plan and our progress in meeting the goals.
10
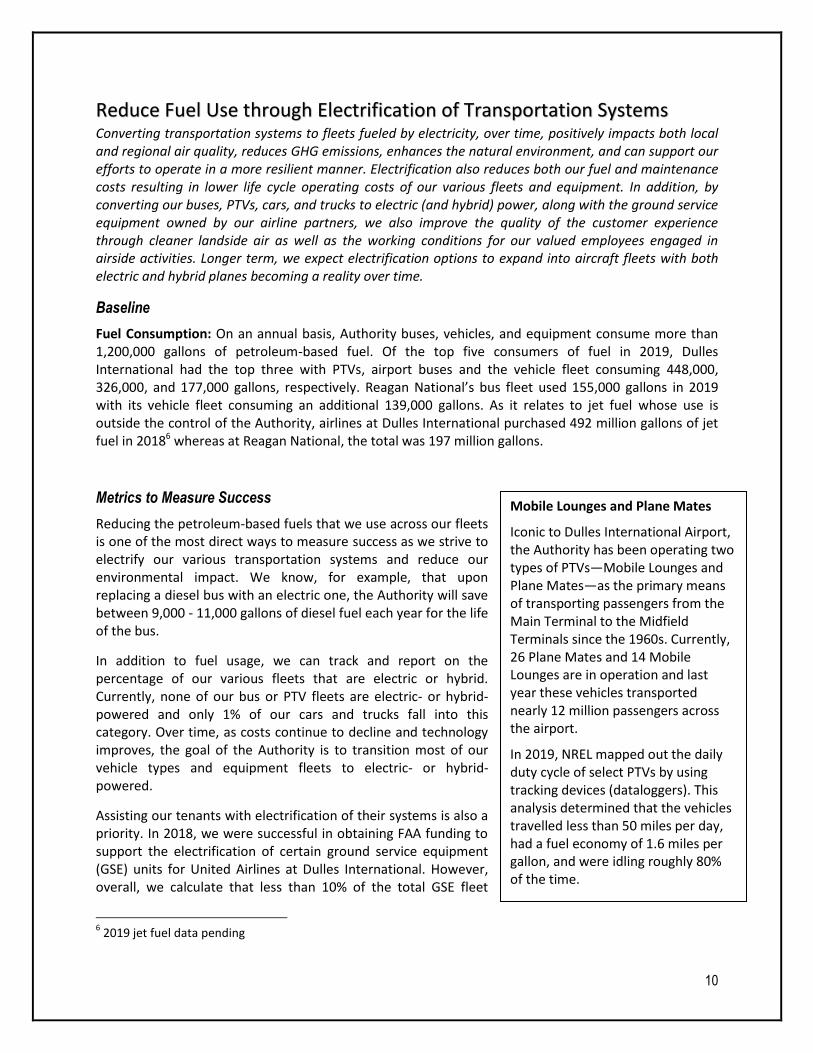
Reduce Fuel Use through Electrification of Transportation Systems Converting transportation systems to fleets fueled by electricity, over time, positively impacts both local and regional air quality, reduces GHG emissions, enhances the natural environment, and can support our efforts to operate in a more resilient manner. Electrification also reduces both our fuel and maintenance costs resulting in lower life cycle operating costs of our various fleets and equipment. In addition, by converting our buses, PTVs, cars, and trucks to electric (and hybrid) power, along with the ground service equipment owned by our airline partners, we also improve the quality of the customer experience through cleaner landside air as well as the working conditions for our valued employees engaged in airside activities. Longer term, we expect electrification options to expand into aircraft fleets with both electric and hybrid planes becoming a reality over time.
Baseline
Fuel Consumption: On an annual basis, Authority buses, vehicles, and equipment consume more than 1,200,000 gallons of petroleum-based fuel. Of the top five consumers of fuel in 2019, Dulles International had the top three with PTVs, airport buses and the vehicle fleet consuming 448,000, 326,000, and 177,000 gallons, respectively. Reagan National’s bus fleet used 155,000 gallons in 2019 with its vehicle fleet consuming an additional 139,000 gallons. As it relates to jet fuel whose use is outside the control of the Authority, airlines at Dulles International purchased 492 million gallons of jet fuel in 20186 whereas at Reagan National, the total was 197 million gallons.
Metrics to Measure Success
Reducing the petroleum-based fuels that we use across our fleets is one of the most direct ways to measure success as we strive to electrify our various transportation systems and reduce our environmental impact. We know, for example, that upon replacing a diesel bus with an electric one, the Authority will save between 9,000 - 11,000 gallons of diesel fuel each year for the life of the bus.
In addition to fuel usage, we can track and report on the percentage of our various fleets that are electric or hybrid. Currently, none of our bus or PTV fleets are electric- or hybrid-powered and only 1% of our cars and trucks fall into this category. Over time, as costs continue to decline and technology improves, the goal of the Authority is to transition most of our vehicle types and equipment fleets to electric- or hybrid-powered.
Assisting our tenants with electrification of their systems is also a priority. In 2018, we were successful in obtaining FAA funding to support the electrification of certain ground service equipment (GSE) units for United Airlines at Dulles International. However, overall, we calculate that less than 10% of the total GSE fleet
6 2019 jet fuel data pending
Mobile Lounges and Plane Mates
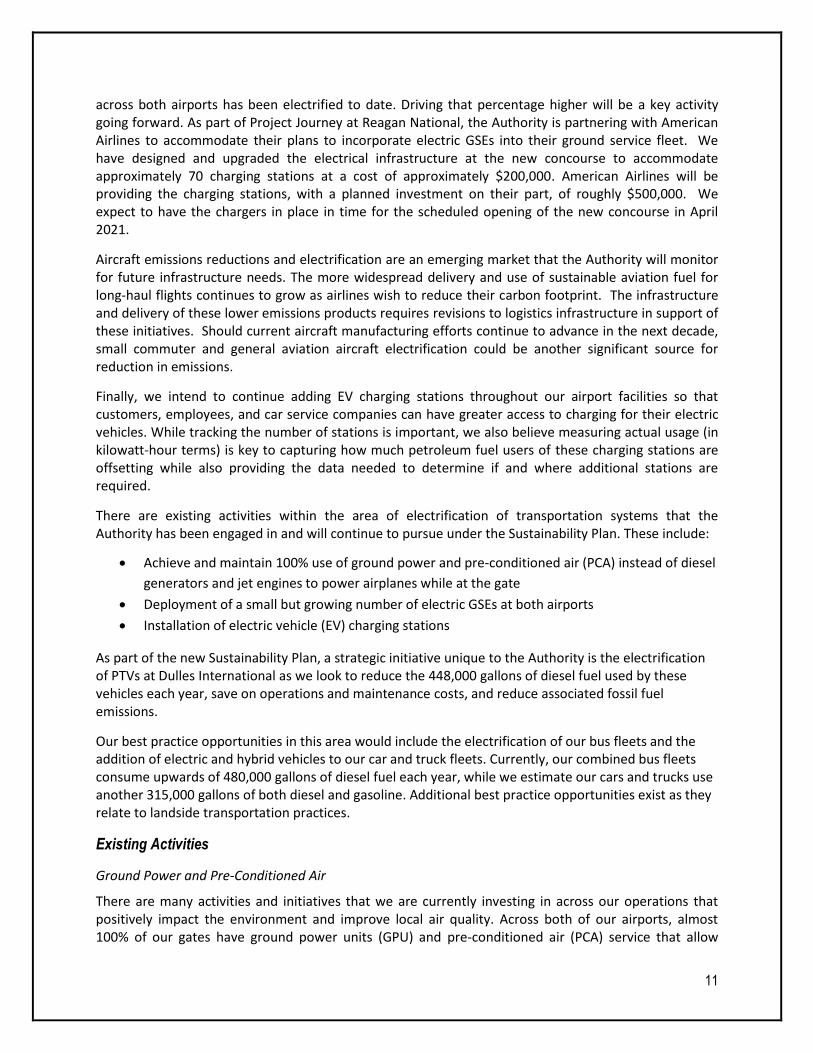
Iconic to Dulles International Airport, the Authority has been operating two types of PTVs—Mobile Lounges and Plane Mates—as the primary means of transporting passengers from the Main Terminal to the Midfield Terminals since the 1960s. Currently, 26 Plane Mates and 14 Mobile Lounges are in operation and last year these vehicles transported nearly 12 million passengers across the airport.
In 2019, NREL mapped out the daily duty cycle of select PTVs by using tracking devices (dataloggers). This analysis determined that the vehicles travelled less than 50 miles per day, had a fuel economy of 1.6 miles per gallon, and were idling roughly 80% of the time.
11
across both airports has been electrified to date. Driving that percentage higher will be a key activity going forward. As part of Project Journey at Reagan National, the Authority is partnering with American Airlines to accommodate their plans to incorporate electric GSEs into their ground service fleet. We have designed and upgraded the electrical infrastructure at the new concourse to accommodate approximately 70 charging stations at a cost of approximately $200,000. American Airlines will be providing the charging stations, with a planned investment on their part, of roughly $500,000. We expect to have the chargers in place in time for the scheduled opening of the new concourse in April 2021.
Aircraft emissions reductions and electrification are an emerging market that the Authority will monitor for future infrastructure needs. The more widespread delivery and use of sustainable aviation fuel for long-haul flights continues to grow as airlines wish to reduce their carbon footprint. The infrastructure and delivery of these lower emissions products requires revisions to logistics infrastructure in support of these initiatives. Should current aircraft manufacturing efforts continue to advance in the next decade, small commuter and general aviation aircraft electrification could be another significant source for reduction in emissions.
Finally, we intend to continue adding EV charging stations throughout our airport facilities so that customers, employees, and car service companies can have greater access to charging for their electric vehicles. While tracking the number of stations is important, we also believe measuring actual usage (in kilowatt-hour terms) is key to capturing how much petroleum fuel users of these charging stations are offsetting while also providing the data needed to determine if and where additional stations are required.
There are existing activities within the area of electrification of transportation systems that the Authority has been engaged in and will continue to pursue under the Sustainability Plan. These include:
Achieve and maintain 100% use of ground power and pre-conditioned air (PCA) instead of diesel
generators and jet engines to power airplanes while at the gate
Deployment of a small but growing number of electric GSEs at both airports
Installation of electric vehicle (EV) charging stations
As part of the new Sustainability Plan, a strategic initiative unique to the Authority is the electrification of PTVs at Dulles International as we look to reduce the 448,000 gallons of diesel fuel used by these vehicles each year, save on operations and maintenance costs, and reduce associated fossil fuel emissions.
Our best practice opportunities in this area would include the electrification of our bus fleets and the addition of electric and hybrid vehicles to our car and truck fleets. Currently, our combined bus fleets consume upwards of 480,000 gallons of diesel fuel each year, while we estimate our cars and trucks use another 315,000 gallons of both diesel and gasoline. Additional best practice opportunities exist as they relate to landside transportation practices.
Existing Activities
Ground Power and Pre-Conditioned Air
There are many activities and initiatives that we are currently investing in across our operations that positively impact the environment and improve local air quality. Across both of our airports, almost 100% of our gates have ground power units (GPU) and pre-conditioned air (PCA) service that allow

12
airplanes to turn off their engines and auxiliary power units while at the gate. This reduces emissions and saves fuel, creating a healthier airside environment for our employees and our customers. In 2019, Dulles International was awarded a Voluntary Airport Low Emissions (VALE) grant by the FAA for $850,000 for GPUs and PCA units along with electrical feeder infrastructure for us to deploy at our remote gates and move closer to our 100% goal. We will continue to pursue funding opportunities, such as VALE grants, to fund future sustainability efforts.
Electrification of Airside Equipment
As airport customers await their flights, it is hard not to notice the swarm of activity taking place out the window as incoming and outgoing planes are serviced by airline and other support staff. All the vehicles and equipment involved in this activity are collectively known as GSE. These include equipment such as plane pushbacks and tugs, belt and baggage loaders, container loaders, food and water trucks, as well as lavatory trucks. Most of this equipment is regulated under off-highway emissions rulings, which in many cases are less stringent than for on the road vehicles. The majority of GSE at today’s airports are petroleum powered but progress is being made to electrify this equipment. As with electric buses, there is an initial cost premium to buy electric GSEs (eGSEs) which, based on data from another large airport, is estimated to be in the 10–30% range, depending on the unit. In addition, airside charging infrastructure is required for the eGSE fleet. As with both buses and PTVs, electrifying GSEs will improve airside air quality and reduce both fuel and maintenance costs. With an NREL technical analysis pending, we intend to better understand both the costs and benefits as well as required site electrical upgrades of converting to eGSE, and with this information, formulate a long-term plan to proceed.
Electrification of GSE is an area of sustainability planning where partnerships are fundamental to our success. Airlines traditionally operate and maintain their own GSE fleets. The Authority leases the fueling infrastructure for the GSEs to the airlines who manage it themselves through an airline consortium. When it comes to eGSEs, airlines purchase the vehicles and we, as the airport administrator, invest in the necessary electrical charging infrastructure to power them. To assist with the capital investment, the FAA makes grants available through its VALE program on a competitive basis that can cover up to 75% of the cost of this electrical infrastructure upgrade. In 2018, we were successful in obtaining a $4 million grant from the FAA in partnership with United Airlines for 112 electric charging ports and related infrastructure at Dulles International. This investment will add to our small but growing fleet of eGSEs across both airports. In addition, as noted above, we are working with American Airlines at Reagan National airport to provide the necessary electrical infrastructure to accommodate their plans for electric GSE at the new concourse currently under construction.
Status of Adoption of Ground Service Equipment
The airlines at Reagan National have electrified approximately 19% of their GSE fleet (116 out of 614 units). At Dulles International, 5% of United Airline’s GSE fleet (30 out of 620 units) have been electrified as of early 2020, however additional charging ports may influence the speed of adoption in the coming years. We are still collecting information from other airlines regarding their GSE fleets at Dulles International; however, United is our largest airline at the airport—responsible for approximately 70% of passenger traffic. Based on United’s market share, it is safe to assume that less than 10% of the overall fleet at Dulles International is currently electric.
A key component to an electrification-of-GSE strategy is the current age of the existing GSE fleet. For example, one of our airline partners told us that their GSE fleet was on average 14–16 years old at Dulles International but only 5–6 years old at Reagan National. In the absence of significant grant funding, converting GSEs to electric would only make financial sense at the end of the useful life of a GSE, which
13
in the case of this airline was approximately 15 years. As a result, working with our airline partners at both airports to determine not only the current mix of GSE units by fuel source (e.g. diesel, gasoline, or electric), but also age, is important as we try to develop timelines for a reasonable conversion of GSEs to electric. Understanding this timeline is also an important element for planning at what rate do we need to adapt our airside electrical infrastructure to handle an increasing number of eGSEs.
We are engaging NREL in an analysis to better understand both the current fuel consumption of existing diesel and gasoline powered GSEs at the airport and the amount of electricity the various GSEs would need to perform their jobs if electrified. Further, we aim to understand which vehicles have compatible operation for electrification to help inform future decisions. We can then combine this data with the age of the existing GSE inventory at the airports to model a fleet conversion strategy and the required investments in electrical infrastructure over time.
As with our other planned investments in electrification of both air- and landside transportation systems, the Authority and the airlines depend on third-party funding to convert GSE (airlines) and add the appropriate infrastructure (Authority). Over time, as battery costs decline, this need for outside funding may decrease, but for the near term at least, we are reliant on this outside assistance. We have successfully demonstrated our ability to obtain FAA VALE grants for the infrastructure required to support airline owned GSE and we intend to continue to apply for grants from this source. In conversations with our partner airlines, we are aware of at least one which has been successful in receiving funding from Volkswagen settlement funds7 to pay for eGSEs in other parts of the country, although in the case of Virginia, we are not aware of any successful grant applications in this area to date.
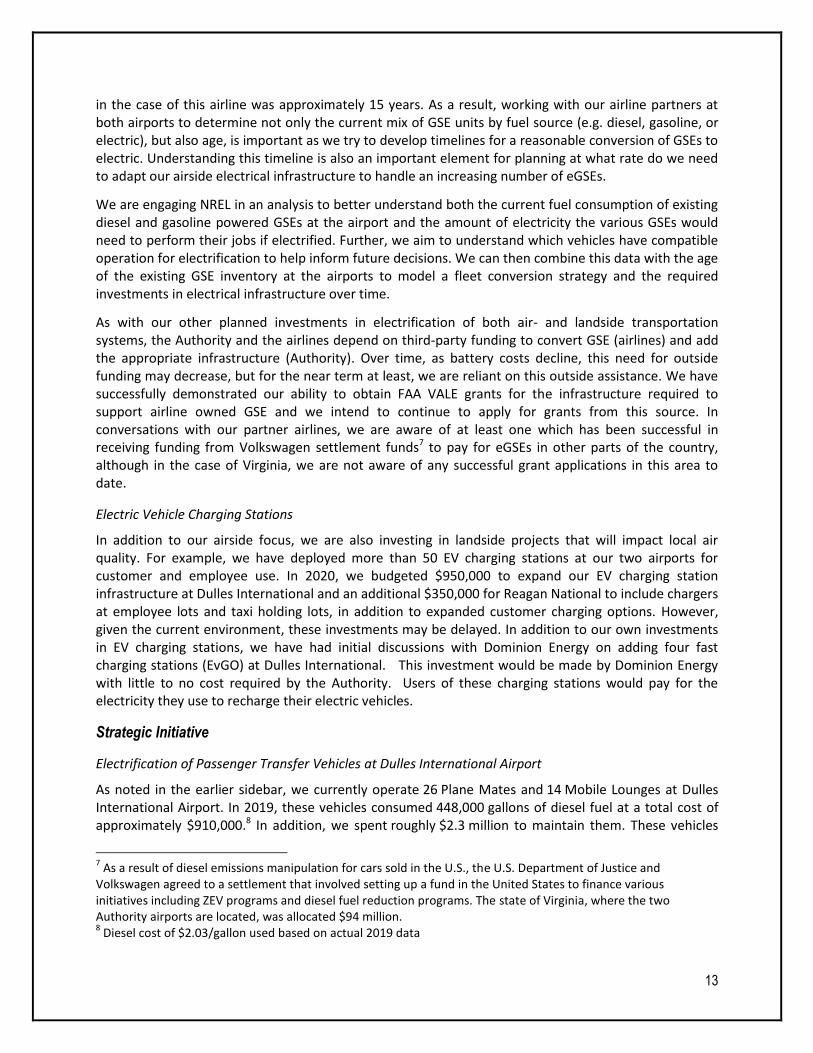
Electric Vehicle Charging Stations
In addition to our airside focus, we are also investing in landside projects that will impact local air quality. For example, we have deployed more than 50 EV charging stations at our two airports for customer and employee use. In 2020, we budgeted $950,000 to expand our EV charging station infrastructure at Dulles International and an additional $350,000 for Reagan National to include chargers at employee lots and taxi holding lots, in addition to expanded customer charging options. However, given the current environment, these investments may be delayed. In addition to our own investments in EV charging stations, we have had initial discussions with Dominion Energy on adding four fast charging stations (EvGO) at Dulles International. This investment would be made by Dominion Energy with little to no cost required by the Authority. Users of these charging stations would pay for the electricity they use to recharge their electric vehicles.
Strategic Initiative
Electrification of Passenger Transfer Vehicles at Dulles International Airport
As noted in the earlier sidebar, we currently operate 26 Plane Mates and 14 Mobile Lounges at Dulles International Airport. In 2019, these vehicles consumed 448,000 gallons of diesel fuel at a total cost of approximately $910,000.8 In addition, we spent roughly $2.3 million to maintain them. These vehicles
7 As a result of diesel emissions manipulation for cars sold in the U.S., the U.S. Department of Justice and
Volkswagen agreed to a settlement that involved setting up a fund in the United States to finance various initiatives including ZEV programs and diesel fuel reduction programs. The state of Virginia, where the two Authority airports are located, was allocated $94 million. 8 Diesel cost of $2.03/gallon used based on actual 2019 data
14
are using what is known as Tier 2 diesel engine technology which is outdated and in need of upgrading. The use of Tier 2 diesel engines in these vehicles results in significant emissions, negatively impacting airside air quality at the airport.
As a result, the Authority has been evaluating its options to electrify these vehicles over the coming years subject to availability of both internal and external funding. We hosted Industry Days in both 2019 and 2020 with large vehicle manufacturers to explore the various electrification options at our disposal and expect to issue a formal Request for Proposal in 2020. Any effort to electrify these vehicles is longer term in nature; we will need to finance the development of a prototype first to ensure that these unique vehicles will work as effectively as our original systems before committing to large-scale production.
If we determine that electrification of the PTVs is not a feasible alternative at this time, either due to a lack of funding support from the Federal Aviation Administration (FAA) or technical limitations of electric PTVs and their ability to meet our daily service requirements for passengers at Dulles International, the Authority will then upgrade a certain number of PTVs to newer, Tier 4, diesel engine technology.9 This upgrade will have air quality benefits and reduce our operating costs associated with these vehicles.
Benefits of Upgrading to Tier 4 Diesel Technology
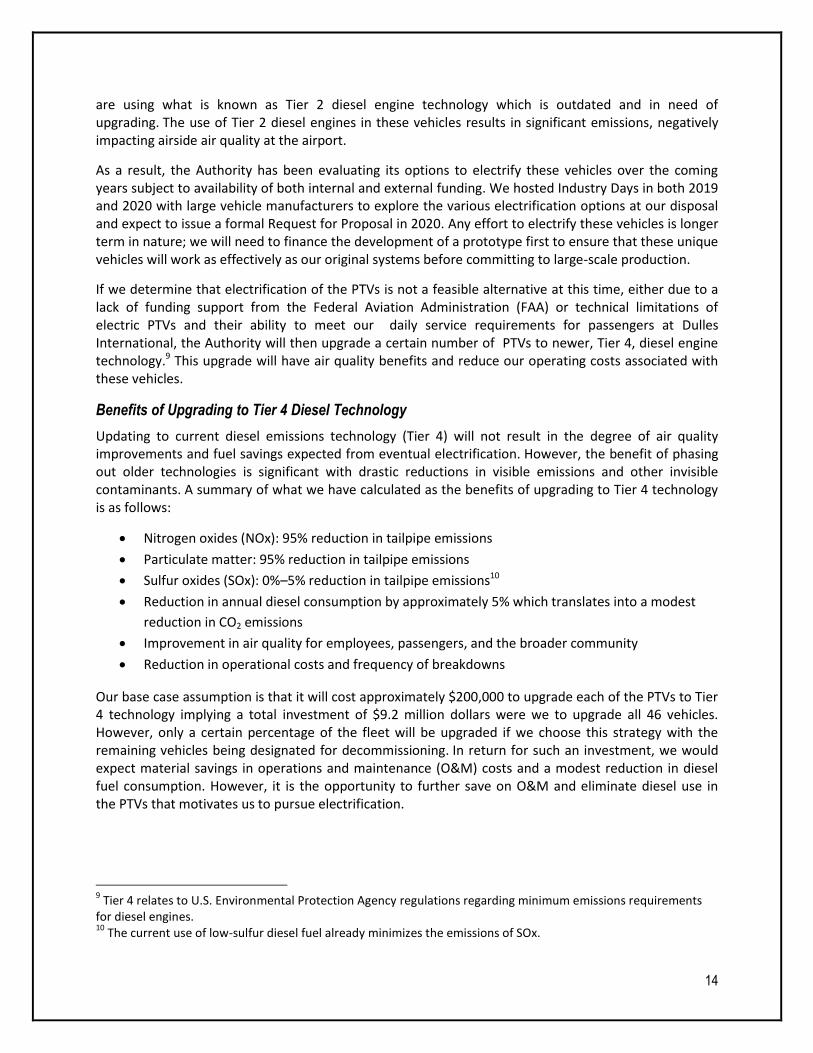
Updating to current diesel emissions technology (Tier 4) will not result in the degree of air quality improvements and fuel savings expected from eventual electrification. However, the benefit of phasing out older technologies is significant with drastic reductions in visible emissions and other invisible contaminants. A summary of what we have calculated as the benefits of upgrading to Tier 4 technology is as follows:
Nitrogen oxides (NOx): 95% reduction in tailpipe emissions
Particulate matter: 95% reduction in tailpipe emissions
Sulfur oxides (SOx): 0%–5% reduction in tailpipe emissions10
Reduction in annual diesel consumption by approximately 5% which translates into a modest
reduction in CO2 emissions
Improvement in air quality for employees, passengers, and the broader community
Reduction in operational costs and frequency of breakdowns
Our base case assumption is that it will cost approximately $200,000 to upgrade each of the PTVs to Tier 4 technology implying a total investment of $9.2 million dollars were we to upgrade all 46 vehicles. However, only a certain percentage of the fleet will be upgraded if we choose this strategy with the remaining vehicles being designated for decommissioning. In return for such an investment, we would expect material savings in operations and maintenance (O&M) costs and a modest reduction in diesel fuel consumption. However, it is the opportunity to further save on O&M and eliminate diesel use in the PTVs that motivates us to pursue electrification.
9 Tier 4 relates to U.S. Environmental Protection Agency regulations regarding minimum emissions requirements
for diesel engines. 10
The current use of low-sulfur diesel fuel already minimizes the emissions of SOx.
15
Benefits of Electrifying Passenger Transfer Vehicles
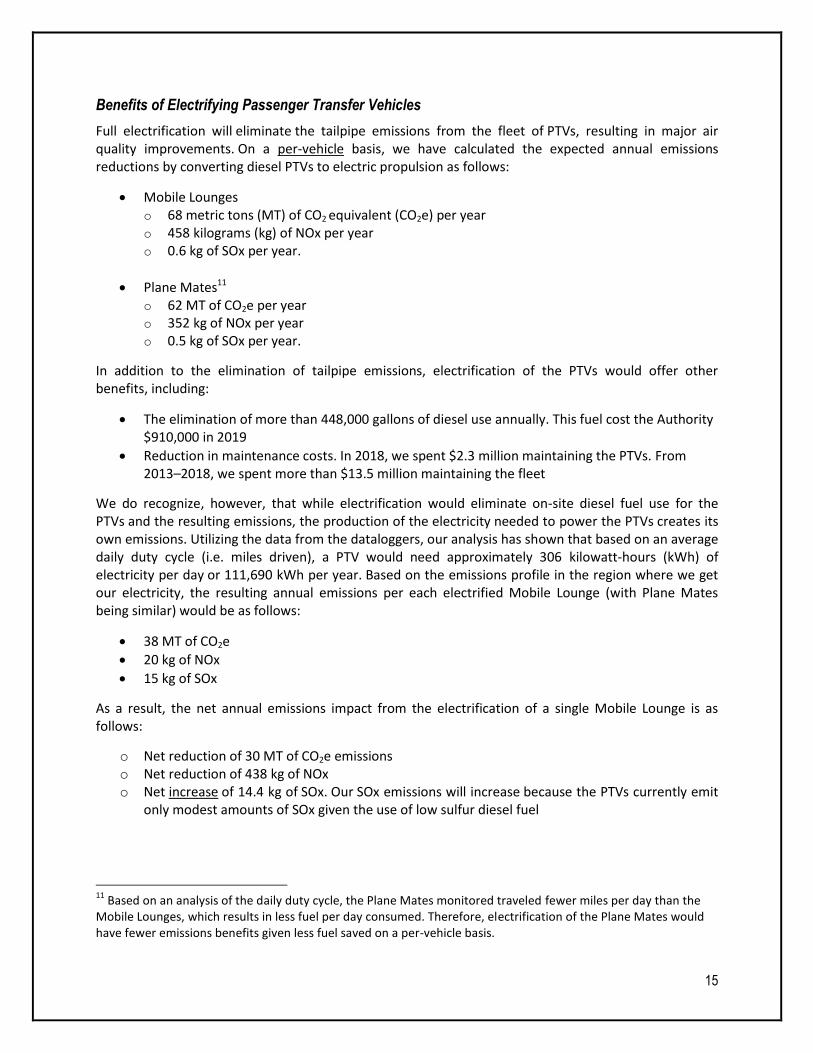
Full electrification will eliminate the tailpipe emissions from the fleet of PTVs, resulting in major air quality improvements. On a per-vehicle basis, we have calculated the expected annual emissions reductions by converting diesel PTVs to electric propulsion as follows:
Mobile Lounges o 68 metric tons (MT) of CO2 equivalent (CO2e) per year o 458 kilograms (kg) of NOx per year o 0.6 kg of SOx per year.
Plane Mates11 o 62 MT of CO2e per year o 352 kg of NOx per year o 0.5 kg of SOx per year.
In addition to the elimination of tailpipe emissions, electrification of the PTVs would offer other benefits, including:
The elimination of more than 448,000 gallons of diesel use annually. This fuel cost the Authority $910,000 in 2019
Reduction in maintenance costs. In 2018, we spent $2.3 million maintaining the PTVs. From 2013–2018, we spent more than $13.5 million maintaining the fleet
We do recognize, however, that while electrification would eliminate on-site diesel fuel use for the PTVs and the resulting emissions, the production of the electricity needed to power the PTVs creates its own emissions. Utilizing the data from the dataloggers, our analysis has shown that based on an average daily duty cycle (i.e. miles driven), a PTV would need approximately 306 kilowatt-hours (kWh) of electricity per day or 111,690 kWh per year. Based on the emissions profile in the region where we get our electricity, the resulting annual emissions per each electrified Mobile Lounge (with Plane Mates being similar) would be as follows:
38 MT of CO2e
20 kg of NOx
15 kg of SOx
As a result, the net annual emissions impact from the electrification of a single Mobile Lounge is as follows:
o Net reduction of 30 MT of CO2e emissions o Net reduction of 438 kg of NOx o Net increase of 14.4 kg of SOx. Our SOx emissions will increase because the PTVs currently emit
only modest amounts of SOx given the use of low sulfur diesel fuel
11
Based on an analysis of the daily duty cycle, the Plane Mates monitored traveled fewer miles per day than the Mobile Lounges, which results in less fuel per day consumed. Therefore, electrification of the Plane Mates would have fewer emissions benefits given less fuel saved on a per-vehicle basis.
16
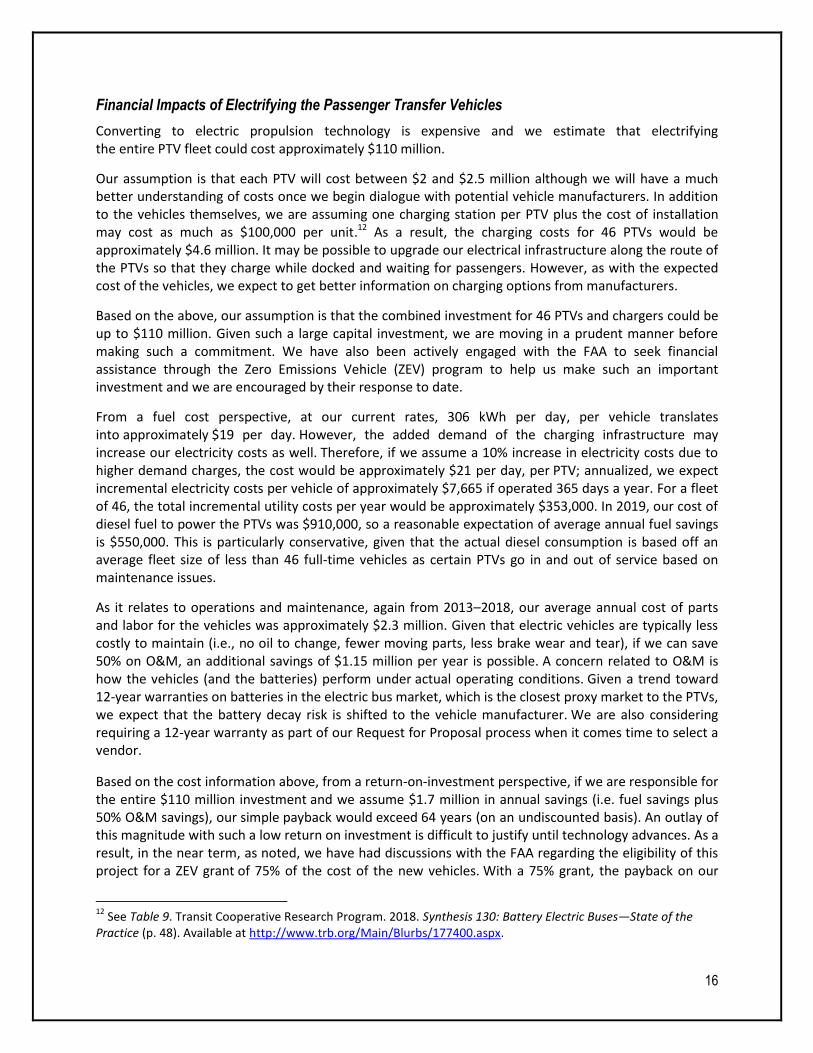
Financial Impacts of Electrifying the Passenger Transfer Vehicles
Converting to electric propulsion technology is expensive and we estimate that electrifying the entire PTV fleet could cost approximately $110 million.
Our assumption is that each PTV will cost between $2 and $2.5 million although we will have a much better understanding of costs once we begin dialogue with potential vehicle manufacturers. In addition to the vehicles themselves, we are assuming one charging station per PTV plus the cost of installation may cost as much as $100,000 per unit.12 As a result, the charging costs for 46 PTVs would be approximately $4.6 million. It may be possible to upgrade our electrical infrastructure along the route of the PTVs so that they charge while docked and waiting for passengers. However, as with the expected cost of the vehicles, we expect to get better information on charging options from manufacturers.
Based on the above, our assumption is that the combined investment for 46 PTVs and chargers could be up to $110 million. Given such a large capital investment, we are moving in a prudent manner before making such a commitment. We have also been actively engaged with the FAA to seek financial assistance through the Zero Emissions Vehicle (ZEV) program to help us make such an important investment and we are encouraged by their response to date.
From a fuel cost perspective, at our current rates, 306 kWh per day, per vehicle translates into approximately $19 per day. However, the added demand of the charging infrastructure may increase our electricity costs as well. Therefore, if we assume a 10% increase in electricity costs due to higher demand charges, the cost would be approximately $21 per day, per PTV; annualized, we expect incremental electricity costs per vehicle of approximately $7,665 if operated 365 days a year. For a fleet of 46, the total incremental utility costs per year would be approximately $353,000. In 2019, our cost of diesel fuel to power the PTVs was $910,000, so a reasonable expectation of average annual fuel savings is $550,000. This is particularly conservative, given that the actual diesel consumption is based off an average fleet size of less than 46 full-time vehicles as certain PTVs go in and out of service based on maintenance issues.
As it relates to operations and maintenance, again from 2013–2018, our average annual cost of parts and labor for the vehicles was approximately $2.3 million. Given that electric vehicles are typically less costly to maintain (i.e., no oil to change, fewer moving parts, less brake wear and tear), if we can save 50% on O&M, an additional savings of $1.15 million per year is possible. A concern related to O&M is how the vehicles (and the batteries) perform under actual operating conditions. Given a trend toward 12-year warranties on batteries in the electric bus market, which is the closest proxy market to the PTVs, we expect that the battery decay risk is shifted to the vehicle manufacturer. We are also considering requiring a 12-year warranty as part of our Request for Proposal process when it comes time to select a vendor.
Based on the cost information above, from a return-on-investment perspective, if we are responsible for the entire $110 million investment and we assume $1.7 million in annual savings (i.e. fuel savings plus 50% O&M savings), our simple payback would exceed 64 years (on an undiscounted basis). An outlay of this magnitude with such a low return on investment is difficult to justify until technology advances. As a result, in the near term, as noted, we have had discussions with the FAA regarding the eligibility of this project for a ZEV grant of 75% of the cost of the new vehicles. With a 75% grant, the payback on our
12
See Table 9. Transit Cooperative Research Program. 2018. Synthesis 130: Battery Electric Buses—State of the Practice (p. 48). Available at http://www.trb.org/Main/Blurbs/177400.aspx.
17
investment (25%) would be approximately 16 years, for vehicles that have historically been kept in service for more than forty years. During this service life, battery replacements may be necessary, with current technology estimated to require replacement once every ten years, adding another factor to our decision.
Looking forward however, we do project maintenance costs on the current PTVs to increase substantially with a 15-year forecast of $3.4 million per year. In addition, as battery costs continue to decline, it is possible that our current cost estimates for the new electric PTVs are overly conservative. For example, if we can acquire new PTVs at a cost of $1.5 million per vehicle, which is still roughly 65% more than the cost of an electric bus in today’s market, our total investment including charging infrastructure would be approximately $74 million. With fuel savings of $550,000 per year and maintenance savings of $1.7 million for a total of $2.25 million, after a ZEV grant of 75%, the payback on our investment (25%) would be approximately 8 years. As we continue to gather more information from manufacturers, we will fine tune our analysis. In addition, we will maintain our dialogue with the FAA and approach other potential funders to assist in this initiative.
Best Practices Opportunities
Electrification of Bus Fleets
Another important pillar of our fuel reduction and air quality improvement goals is to evaluate our options for electrifying the Authority’s bus fleets over time. Like the PTVs, diesel and compressed natural gas (CNG) buses emit harmful landside emissions and are expensive to operate and maintain. As noted earlier, our bus fleet across both airports totals 47 vehicles, with 26 diesel buses in operation at Dulles International and another 21 buses at Reagan National, of which 15 are diesel and 6 are CNG.13 This fleet of buses completes more than 500,000 annual individual trips to and from garages, terminals, parking lots, and rental car centers each year, accumulating more than 2 million miles in the process. This translates into more than 480,000 gallons of diesel fuel use per year at a cost of approximately $970,000 and an additional 34,000 gallons equivalent of CNG at a cost of $45,000. In addition to fuel costs, in 2019, we spent approximately $380,000 maintaining the 21 buses at Reagan National and just over $1 million dollars maintaining the 26 buses at Dulles International.
Prior to the current slowdown in air travel, we had previously included funding for new EV buses in our 2020 budget. With current economic conditions and reduction in near term demand, the existing bus fleet’s life cycle can be extended, and procurements are planned for later years. As with the PTVs, we will continue to seek financial assistance from the FAA and others (i.e., Volkswagen) to reduce the financial impact to the Authority. In addition, as electric buses become more mainstream, vendor financing and novel battery lease structures may also be options.
Emissions Benefit from Electrifying a Diesel Bus
As a bus approaches the end of its useful life (i.e., 15 years), it is typically replaced to maintain our level of service to airport customers and employees. Traditionally, we have replaced a diesel bus with a current-technology diesel bus or with a CNG bus. Moving forward, however, our efforts will be more focused on replacing an existing diesel or CNG bus with an EV bus with the priority being replacements of diesel buses at Dulles International given their condition.
13
We acquired our CNG buses for Reagan National in 2007. At that time, buying EV buses was not an option. Today, we are not considering any additional CNG purchases given the EV options available and the expected cost declines going forward.

18
From a local air quality perspective, EV buses are the preferred alternative. In Table 3, our analysis shows reductions across the board for on-site emissions when a diesel bus and an electric bus are compared along the same route. The analysis used nearly 55,000 miles per year to calculate the emissions impacts as this is the average distance a diesel bus in our Dulles International fleet traveled in 2019. More than 11,000 gallons of diesel fuel were used to complete these 55,000 miles.
19
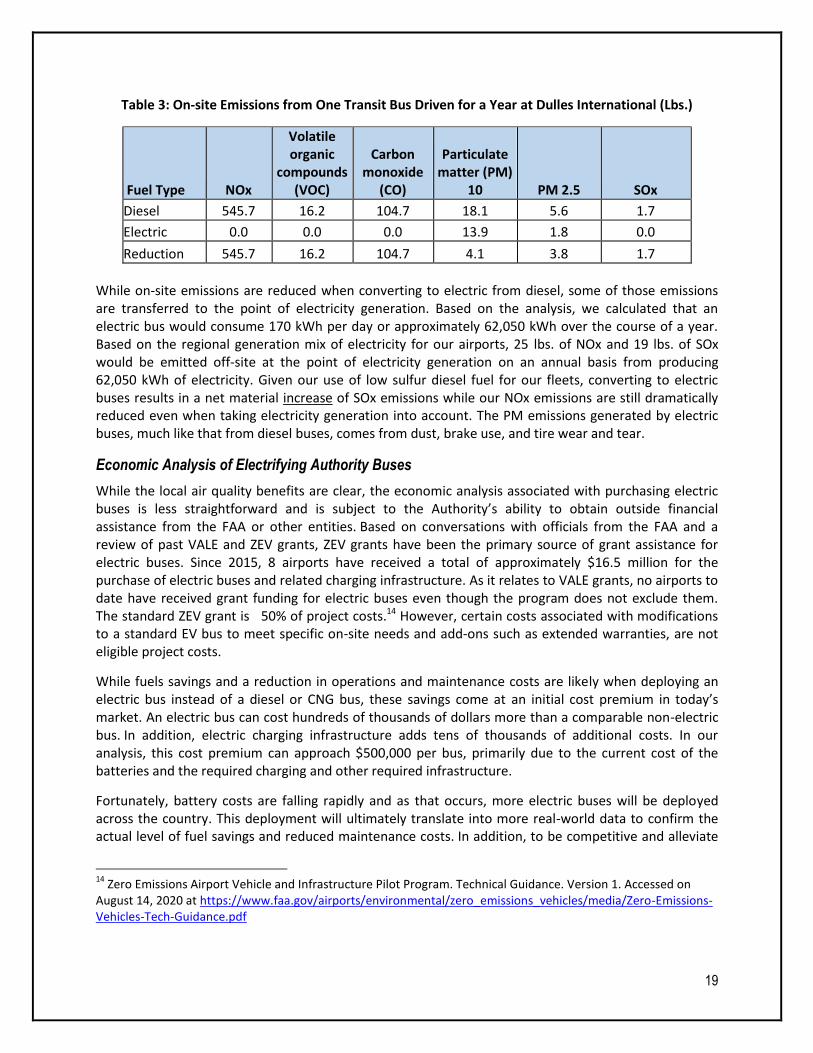
Table 3: On-site Emissions from One Transit Bus Driven for a Year at Dulles International (Lbs.)
Fuel Type NOx
Volatile organic
compounds (VOC)
Carbon monoxide
(CO)
Particulate matter (PM)
10 PM 2.5 SOx
Diesel 545.7 16.2 104.7 18.1 5.6 1.7
Electric 0.0 0.0 0.0 13.9 1.8 0.0
Reduction 545.7 16.2 104.7 4.1 3.8 1.7
While on-site emissions are reduced when converting to electric from diesel, some of those emissions are transferred to the point of electricity generation. Based on the analysis, we calculated that an electric bus would consume 170 kWh per day or approximately 62,050 kWh over the course of a year. Based on the regional generation mix of electricity for our airports, 25 lbs. of NOx and 19 lbs. of SOx would be emitted off-site at the point of electricity generation on an annual basis from producing 62,050 kWh of electricity. Given our use of low sulfur diesel fuel for our fleets, converting to electric buses results in a net material increase of SOx emissions while our NOx emissions are still dramatically reduced even when taking electricity generation into account. The PM emissions generated by electric buses, much like that from diesel buses, comes from dust, brake use, and tire wear and tear.
Economic Analysis of Electrifying Authority Buses
While the local air quality benefits are clear, the economic analysis associated with purchasing electric buses is less straightforward and is subject to the Authority’s ability to obtain outside financial assistance from the FAA or other entities. Based on conversations with officials from the FAA and a review of past VALE and ZEV grants, ZEV grants have been the primary source of grant assistance for electric buses. Since 2015, 8 airports have received a total of approximately $16.5 million for the purchase of electric buses and related charging infrastructure. As it relates to VALE grants, no airports to date have received grant funding for electric buses even though the program does not exclude them. The standard ZEV grant is 50% of project costs.14 However, certain costs associated with modifications to a standard EV bus to meet specific on-site needs and add-ons such as extended warranties, are not eligible project costs.
While fuels savings and a reduction in operations and maintenance costs are likely when deploying an electric bus instead of a diesel or CNG bus, these savings come at an initial cost premium in today’s market. An electric bus can cost hundreds of thousands of dollars more than a comparable non-electric bus. In addition, electric charging infrastructure adds tens of thousands of additional costs. In our analysis, this cost premium can approach $500,000 per bus, primarily due to the current cost of the batteries and the required charging and other required infrastructure.
Fortunately, battery costs are falling rapidly and as that occurs, more electric buses will be deployed across the country. This deployment will ultimately translate into more real-world data to confirm the actual level of fuel savings and reduced maintenance costs. In addition, to be competitive and alleviate
14
Zero Emissions Airport Vehicle and Infrastructure Pilot Program. Technical Guidance. Version 1. Accessed on August 14, 2020 at https://www.faa.gov/airports/environmental/zero_emissions_vehicles/media/Zero-Emissions-Vehicles-Tech-Guidance.pdf
20
the concern over battery life, as noted above, electric bus manufacturers are beginning to offer up to 12-year warranties on the batteries. This would limit the risk to the Authority that we would have to incur an expensive battery replacement to the final three years of a typical 15-year useful life. Finally, manufacturers are also getting creative with alternative financing options to reduce the impact of the initial cost premium. For example, there are now options in the market to buy the bus (minus the battery) at a cost comparable to diesel and then separately, lease the battery.15 The anticipated fuel and maintenance savings are then expected to offset the cost of the battery lease.
In the initial financial analysis conducted by NREL, we compared the economics of replacing a diesel bus at the end of its useful life with either a new diesel bus or an electric bus (with a dedicated charger).16 Using actual bus fleet information from Dulles International and industry data, we have calculated the time it would take for the Authority to recoup its additional investment in an electric bus over what we would have invested in a new diesel bus.
Replace a Diesel Bus with an Electric Bus
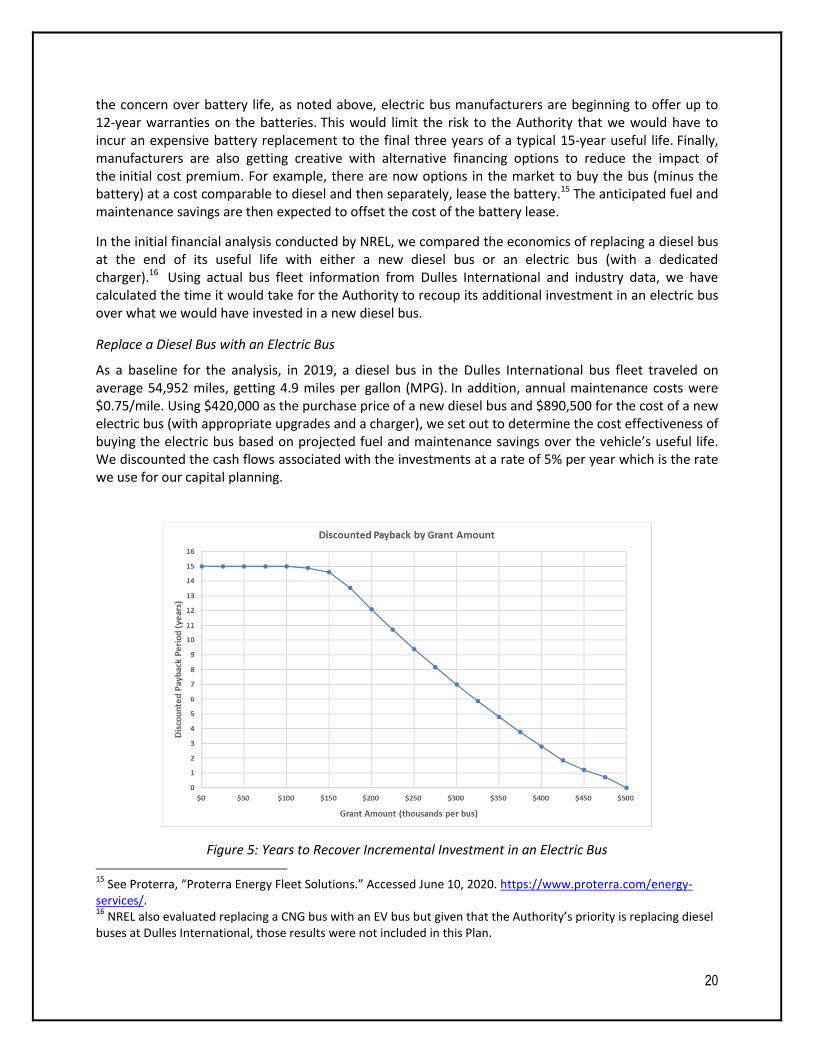
As a baseline for the analysis, in 2019, a diesel bus in the Dulles International bus fleet traveled on average 54,952 miles, getting 4.9 miles per gallon (MPG). In addition, annual maintenance costs were $0.75/mile. Using $420,000 as the purchase price of a new diesel bus and $890,500 for the cost of a new electric bus (with appropriate upgrades and a charger), we set out to determine the cost effectiveness of buying the electric bus based on projected fuel and maintenance savings over the vehicle’s useful life. We discounted the cash flows associated with the investments at a rate of 5% per year which is the rate we use for our capital planning.
Figure 5: Years to Recover Incremental Investment in an Electric Bus
15
See Proterra, “Proterra Energy Fleet Solutions.” Accessed June 10, 2020. https://www.proterra.com/energy-services/. 16
NREL also evaluated replacing a CNG bus with an EV bus but given that the Authority’s priority is replacing diesel buses at Dulles International, those results were not included in this Plan.
21
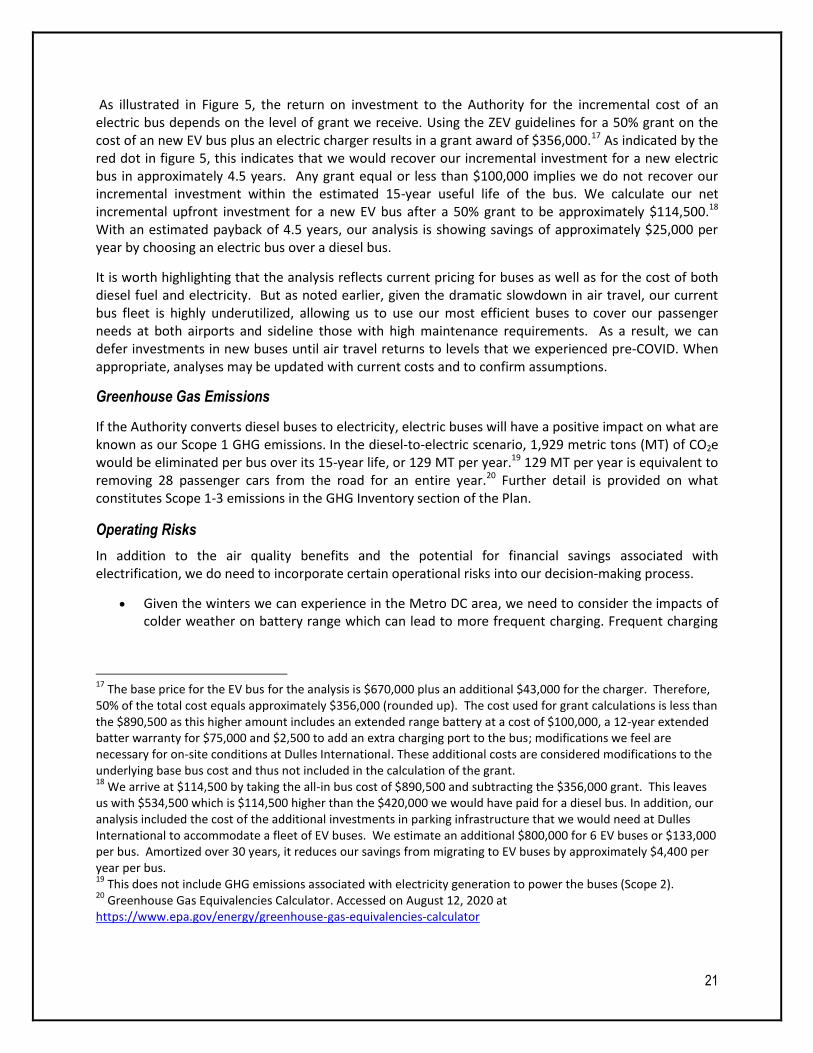
As illustrated in Figure 5, the return on investment to the Authority for the incremental cost of an electric bus depends on the level of grant we receive. Using the ZEV guidelines for a 50% grant on the cost of an new EV bus plus an electric charger results in a grant award of $356,000.17 As indicated by the red dot in figure 5, this indicates that we would recover our incremental investment for a new electric bus in approximately 4.5 years. Any grant equal or less than $100,000 implies we do not recover our incremental investment within the estimated 15-year useful life of the bus. We calculate our net incremental upfront investment for a new EV bus after a 50% grant to be approximately $114,500.18 With an estimated payback of 4.5 years, our analysis is showing savings of approximately $25,000 per year by choosing an electric bus over a diesel bus.
It is worth highlighting that the analysis reflects current pricing for buses as well as for the cost of both diesel fuel and electricity. But as noted earlier, given the dramatic slowdown in air travel, our current bus fleet is highly underutilized, allowing us to use our most efficient buses to cover our passenger needs at both airports and sideline those with high maintenance requirements. As a result, we can defer investments in new buses until air travel returns to levels that we experienced pre-COVID. When appropriate, analyses may be updated with current costs and to confirm assumptions.
Greenhouse Gas Emissions
If the Authority converts diesel buses to electricity, electric buses will have a positive impact on what are known as our Scope 1 GHG emissions. In the diesel-to-electric scenario, 1,929 metric tons (MT) of CO2e would be eliminated per bus over its 15-year life, or 129 MT per year.19 129 MT per year is equivalent to removing 28 passenger cars from the road for an entire year.20 Further detail is provided on what constitutes Scope 1-3 emissions in the GHG Inventory section of the Plan.
Operating Risks
In addition to the air quality benefits and the potential for financial savings associated with electrification, we do need to incorporate certain operational risks into our decision-making process.
Given the winters we can experience in the Metro DC area, we need to consider the impacts of colder weather on battery range which can lead to more frequent charging. Frequent charging
17
The base price for the EV bus for the analysis is $670,000 plus an additional $43,000 for the charger. Therefore, 50% of the total cost equals approximately $356,000 (rounded up). The cost used for grant calculations is less than the $890,500 as this higher amount includes an extended range battery at a cost of $100,000, a 12-year extended batter warranty for $75,000 and $2,500 to add an extra charging port to the bus; modifications we feel are necessary for on-site conditions at Dulles International. These additional costs are considered modifications to the underlying base bus cost and thus not included in the calculation of the grant. 18
We arrive at $114,500 by taking the all-in bus cost of $890,500 and subtracting the $356,000 grant. This leaves us with $534,500 which is $114,500 higher than the $420,000 we would have paid for a diesel bus. In addition, our analysis included the cost of the additional investments in parking infrastructure that we would need at Dulles International to accommodate a fleet of EV buses. We estimate an additional $800,000 for 6 EV buses or $133,000 per bus. Amortized over 30 years, it reduces our savings from migrating to EV buses by approximately $4,400 per year per bus. 19
This does not include GHG emissions associated with electricity generation to power the buses (Scope 2). 20
Greenhouse Gas Equivalencies Calculator. Accessed on August 12, 2020 at https://www.epa.gov/energy/greenhouse-gas-equivalencies-calculator

22
of batteries can decrease their expected lifespan. With a 12-year battery warranty, this risk can be reduced although not eliminated
Recharging electric batteries can take more time than refueling our bus fleets with diesel or CNG. Care must be taken in choosing appropriate recharging strategies, such as overnight charging or installation of more costly fast chargers for meeting Authority needs.
Finally, switching to electric buses will increase our reliance on electricity. As a result, recharging strategies should include an understanding of preferred methods to maintain operations in the event of a prolonged power outage. This could include specifying larger onboard energy storage (batteries), redundant systems, or other mitigation methods. In addition, to the degree we deploy stationary batteries at our facilities, we may be able to mitigate some of this risk with back-up energy supplies on site.
We are looking at implementing electric conversions as our buses come to the end of their useful lives. In addition, we will likely maintain a certain number of non-electric buses as back-ups and/or install energy storage should grid power be unavailable. As a result, we can prepare for many of these potential operational risks over time. Also, as we add electric buses to our fleets, we will gain important experience related to fueling, maintaining, and operating the fleet concurrently with technological advancements in the electric bus industry. Both factors should make longer-term conversions to electric more straightforward.
Hybrid Car and Truck Fleet
Across our airports and toll road operations, in addition to our bus fleets, the Authority manages a fleet of approximately 750 vehicles. Less than 1% of these vehicles currently use alternative fuels (including hybrids and EVs) of any kind. However, we have near-term plans to trade out non-hybrid vehicles for 41 new hybrid ones, primarily for our Dulles International police fleet. Over time, we plan to continue adding hybrid and potentially electric vehicles to our fleet given the air quality benefits and the potential cost benefits of having a vehicle fleet less dependent on petroleum. For example, one analysis NREL conducted was a comparison of the ozone emissions between hybrid electric vehicles (HEV) and conventional light duty vehicles (LDV). In particular, the analysis focused on NOx and VOC emissions because these are the main emissions that form ground-level ozone, otherwise known as smog. The results showed that HEVs emit 41% less of these ground level ozone precursors than LDVs. This benefit would be in addition to the other air quality benefits associated with the electrification of buses, PTVs, and GSE discussed above. It is noted that an initial review of snow removal equipment and emergency response vehicles has been performed and current technology is not available to meet the primary needs of the Authority. These technologies will be reviewed on a regular basis for potential improvements. It is also noted that hybrid electric fire trucks are beginning to be tested in service with some organizations and we will monitor those developments as well.
Additional Transportation-Related Best Practice Opportunities
Beyond our primary electrification efforts, there is more the Authority can do to improve our overall transportation networks and promote more sustainable means of accessing the airports. These include:
Partnering with our stakeholders to promote alternative fuel use for taxis, transportation companies, and hotel shuttle buses
Improving non-motorized access to Reagan National (which is discussed in the public transit section of the Sustainability Plan)
23
Landside Transportation Options
How our customers and employees get to and from the airports is an area that we can influence to varying degrees. We currently mandate that rental car companies offer EVs and HEVs to ensure that our customers have access to the types of vehicles they prefer. In addition, elsewhere in the Sustainability Plan, we discuss our successful partnership with WMATA and the 4 million people using Metrorail to access Reagan National each year and how we intend to replicate that success when Metrorail arrives at Dulles International in 2021. Also discussed was the EV charging infrastructure that is available to our customers and soon to our employees and car service companies. Finally, we have also made great strides eliminating unnecessary idling at our toll booths along the DTR and our goal of getting as close to 100% EZ pass usage and/or open road tolling as we can over time from our current levels of approximately 93%.
However, there is more we can do when it comes to creating more sustainable access options for our airports. For example, as it relates to taxis and car sharing services, we intend to learn from other airports experiencing similar issues by examining:
Preferential fees and other advantages (i.e., “first in line”) for drop off and pick up for electric and other high-MPG vehicles
Strategies to reduce idling, circling, and curbside congestion including the use of advanced technology to optimize traffic patterns
Preferential support of electrification of taxis, livery vehicles, and transportation network companies
We also intend to begin conversations with hotels and others operating courtesy shuttles and buses to encourage the adoption of EVs for these services as well as identify any opportunities for shared shuttle services. As with transportation network companies and taxis, we will evaluate multiple strategies to encourage electric and other alternative fuel vehicle use over traditional diesel and gas-powered vehicles.
Summary
Through the continuation of existing activities such as the use of ground power and PCA, electrification of GSE, installation of EV charging stations, the launch of a new strategic initiative related to the electrification of our iconic PTVs, and emulation of best practice opportunities used by peer airports across the country, our goal is to materially reduce the use of petroleum-based fuels across all of the Authority’s facilities over time. We intend to leverage our internal expertise, third-party technical assistance, and outside financial support to pursue electrification-based strategies across all our transportation systems in a smart and cost-effective manner. As we reduce our petroleum fuel consumption over time, as co-benefits, we will also be limiting our impact on the natural environment, improving local air quality, reducing GHG emissions, and contributing to the resilience our operations through fuel diversification. Longer term, we expect electrification options to emerge for air travel itself. In collaboration with our airline partners, we intend to be ready for such a future as well.
24
Increase Efficiency of Our Built Environment Sustainable energy use is the practice of conserving and optimizing energy consumption, managing demand, and using power from renewable resources. Such practices lead to higher levels of building efficiency across the Authority’s physical assets. With a renewed focus on energy use, over time we will strive to maintain a stable level of purchased energy consumption (i.e. on a per-passenger basis) despite increases in both expected electricity use for transportation systems and passengers (i.e., increased plug loads) through dynamic responses to loads rather than maintaining energy systems in a constant state. In addition, we intend to increase the use of renewable energy resources to power our facilities as the continued decline in the costs of such resources makes them increasingly more attractive to us moving forward.
Baseline
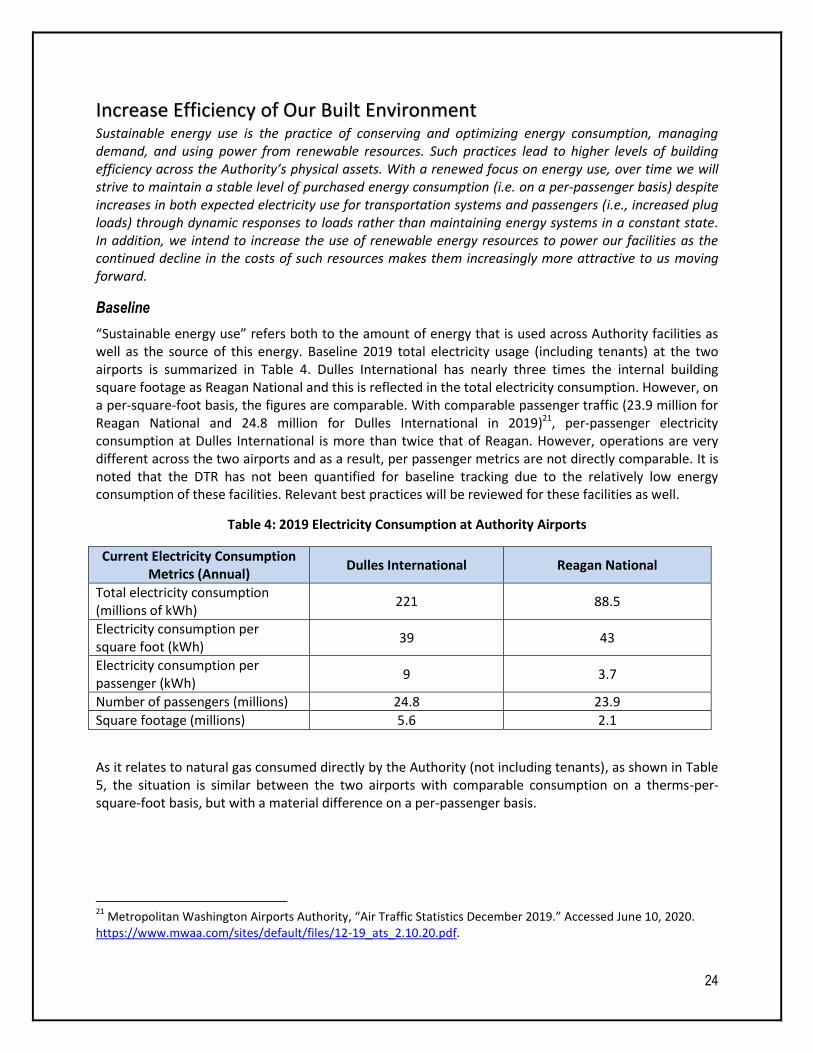
“Sustainable energy use” refers both to the amount of energy that is used across Authority facilities as well as the source of this energy. Baseline 2019 total electricity usage (including tenants) at the two airports is summarized in Table 4. Dulles International has nearly three times the internal building square footage as Reagan National and this is reflected in the total electricity consumption. However, on a per-square-foot basis, the figures are comparable. With comparable passenger traffic (23.9 million for Reagan National and 24.8 million for Dulles International in 2019)21, per-passenger electricity consumption at Dulles International is more than twice that of Reagan. However, operations are very different across the two airports and as a result, per passenger metrics are not directly comparable. It is noted that the DTR has not been quantified for baseline tracking due to the relatively low energy consumption of these facilities. Relevant best practices will be reviewed for these facilities as well.
Table 4: 2019 Electricity Consumption at Authority Airports
Current Electricity Consumption Metrics (Annual)
Dulles International Reagan National
Total electricity consumption (millions of kWh)
221 88.5
Electricity consumption per square foot (kWh)
39 43
Electricity consumption per passenger (kWh)
9 3.7
Number of passengers (millions) 24.8 23.9
Square footage (millions) 5.6 2.1
As it relates to natural gas consumed directly by the Authority (not including tenants), as shown in Table 5, the situation is similar between the two airports with comparable consumption on a therms-per-square-foot basis, but with a material difference on a per-passenger basis.
21
Metropolitan Washington Airports Authority, “Air Traffic Statistics December 2019.” Accessed June 10, 2020. https://www.mwaa.com/sites/default/files/12-19_ats_2.10.20.pdf.

25
Table 5: 2019 Natural Gas Consumption at Authority Airports
Current Natural Gas Consumption Metrics (Annual)
Dulles International Reagan National
Total natural gas consumption (therms)
3,720,311 1,518,722
Natural gas consumption per square foot (therms)
0.66 0.74
Natural gas consumption per passenger (therms)
0.15 0.06
Number of passengers (millions) 24.8 23.9
Square footage (millions) 5.6 2.1
The Authority’s current renewable energy portfolio consists of a 10-kilowatt (kW) solar installation at a DTR travel center facility and a new 10 kW PV system installed on the Transportation Network Companies (TNC) canopy at Dulles International. The TNC waiting area is where ride share companies such as Uber and Lyft park while waiting to pick up airport customers. As several renewable energy technologies are currently economically viable, we are partnering with our utility, Dominion Energy, to evaluate a possible large-scale solar farm at Dulles International and are studying the feasibility of solar and battery storage at Reagan National. Currently, Dominion Energy’s electricity mix includes 5% renewable energy along with an additional 42% of emissions-free nuclear energy. In 2019, Dominion announced its target to achieve net zero emissions by 2050. As a result, over time, we expect our purchased electricity to become cleaner and less impactful to the environment as well.
Metrics to Measure Success
To track our progress in increasing the energy efficiency of our various built environments, the Authority intends to monitor our overall energy use at the airport level as well as on a per-passenger basis. In addition, as we continue to install more efficient lighting throughout our facilities, we will track the percentage of facilities with LED and other energy-efficient lighting systems with the goal of achieving and maintaining levels approaching 100% energy-efficient lighting where feasible over time. Finally, if we add on-site renewable energy generation at our facilities, we will track progress in terms of installed generation capacity (kW). We will also monitor progress that Dominion Energy makes towards its emissions-free goals and incorporate that information into our sustainability reporting.
Existing Activities
The Authority has implemented many sustainable energy use initiatives that not only reduce electricity consumption but also save us money. Examples of some of these activities include the following:
Reagan National Central Utility Plant
The installation of a high efficiency chiller at the Reagan National’s central utility plant (CUP) saves more than 600,000 kWh and $38,000 per year. Reagan National also has access to thermal storage facilities where we can chill large quantities of water at night when electricity prices are lower. We then use this chilled water for daytime cooling purposes throughout our terminals and concourses. This thermal storage allows Reagan National to participate in demand response programs offered by our regional grid operator, PJM, resulting in economic benefits to us in the form of rebates.
26
HVAC Upgrades at Dulles International Terminal C/D
According to our baseline data, Terminal C/D consumes 48 kWh/square foot of electricity per year compared to 23 kWh/square foot per year for Terminal A/B. In absolute terms, Terminal C/D consumes approximately 9% more electricity per year than Terminal A/B despite being less than half the size. Initially built as a temporary structure, Terminal C/D was never interconnected to the Dulles International CUP but instead has been serviced by more than 140 rooftop HVAC units which is why it is materially less energy efficient than Terminal A/B. We are currently in the process of replacing most of these existing rooftop units with more efficient ones. Hypothetically, if Terminal C/D’s electricity consumption per square foot were to be reduced to the level of Terminal A/B, the annual savings would amount to 17 million kWh, or approximately 8% of the total amount of electricity consumed at the entire airport based on 2019 data. Given that we spent more than $13 million on electricity for Dulles International in 2019, an 8% reduction would equate to annual savings of roughly $1 million. However, while it does put the electricity consumption of Terminal C/D into perspective, reductions of this magnitude are unlikely even with the HVAC upgrades. Regardless, upon completing the HVAC overhaul, we will recalculate energy consumption per square foot in Terminal C/D to see both how it compares to Terminal A/B and to determine what more we can do to further lower electricity consumption.
LED Lighting Upgrade Programs
Both Dulles International and Reagan National have established LED lighting upgrade programs where traditional light fixtures are swapped out for LEDs on a systematic basis. These initiatives are saving us on average $440,000 and $240,000 per year at Dulles International and Reagan National, respectively.
Building Green and Sustainable by Updating our Design Manual
When we build new facilities or materially renovate existing facilities at our airports, we are committing to a level of energy consumption that can last for decades. Our Design Manual and our Procurement Manual are what guide how we and our tenants, both build and operate our facilities and to what degree we are building with sustainability in mind. The most recent updates to our Design Manual are being done with an emphasis on sustainability. In addition, we are evaluating the incorporation of LEED principles and advanced ASHRAE standards into the updates as well. One area of focus will be a greater emphasis on lifecycle costing to compliment more traditional first cost-based decision making. We acknowledge that investments in more efficient equipment and more sustainably produced building materials may cost more than similar, less efficient, and less sustainable options. However, the cost savings and other benefits associated with these more efficient and sustainable investments can often result in net overall savings.
We also want to ensure that the minimum standards for construction in the Design Manual are as sustainable as possible with regards to lighting, high-efficiency HVAC equipment, variable speed controls and devices, the use of daylighting, and much more. For example, in the current Design Manual, our tenant guidelines reference a lighting power density of 3.0 watts per square foot. Since the 2014 updates, industry has advanced significantly with more current recommendations across the country (i.e., International Energy Conservation Code 2015 and 2018, California Building Codes, etc.) of 1.0 to 1.5 watts or less per square foot. By requiring more efficient lighting practices, over time, we can reduce our overall electricity consumption. Emphasizing lifecycle costing and lighting power density adjustments are representative examples of the changes that we will be making in the Design Manual so that we build and guide others to build much more sustainably throughout our airport facilities.
27
Strategic Initiative
Large Scale Solar Photovoltaic Development at Dulles International
As noted, we are partnering with our utility, Dominion Energy, to determine the feasibility of developing up to 100 MW of solar photovoltaic (PV) generation on more than 1,000 acres of available land we have at Dulles International. In 2019, we formalized this partnership and feasibility studies are underway now which include an analysis of the potential to include battery energy storage in the project for enhanced grid reliability. Dominion will be financing the project. While all the electricity generated by the solar farm will likely be fed directly into the utility grid for region-wide distribution, we are evaluating options to purchase some amount of electricity for our own airport operations. Regardless, it is a very exciting and public demonstration of our commitment to the environment, supports Dominion Energy with their clean energy and GHG emissions reduction goals. Our partnership with Dominion Energy is also indicative of our broader renewable energy strategy as we carefully manage our resources. We will look for opportunities to partner with third parties who can use the tax credits; enter into power purchase agreements (PPA); and explore avenues for monetizing our available land through land lease arrangements to minimize capital expenditures with equivalent or better results.
Best Practices Opportunities
Solar Energy and Battery Storage at Reagan National
Given Reagan National’s limited geographic footprint, large-scale solar such as we are pursuing at Dulles International is not feasible. However, there are opportunities for smaller and more targeted solar installations on various rooftops across the facility. On behalf of the Authority, NREL conducted a sitewide analysis of Reagan National to determine how much solar we could install across facilities as well as the costs and benefits of doing so. NREL also included opportunities for battery energy storage in their analysis to determine if we can add resiliency elements to any potential solar investments along with potential for reducing electricity demand charges. We understand that with current grid modernization, energy storage near major users is becoming a key element in efficiency and rate management. The preliminary results of the NREL analysis, summarized below, indicate that there are cost-effective opportunities to deploy both solar and battery storage at Reagan National primarily due to the ability to reduce our billed energy demand charges at the airport.
Technoeconomic Results for Solar-Plus-Storage at Reagan National
There are opportunities for us to stabilize our electricity costs by reducing demand charges and possibly add resiliency benefits to our facilities at Reagan National through investments in solar and battery energy storage. The return on a direct investment of Authority capital in this area is very low with resiliency benefits, and stabilization of demand charges a qualitative factor not currently quantified in relation to return on investment. Based on current utility rate structures and other assumptions, approximately 900 kW of solar PV with 200 kW of battery storage could be installed at Reagan National. Over a 25-year time frame, this project could provide an estimated net present value benefit (NPV) of approximately $700,000 if connected to the South Substation. 900 kW of solar would occupy less than 4% of the current 2,400,000 square feet of roof space at Reagan National. In addition, installing 400 kW of grid-charged battery energy storage (without solar) would have a (NPV) of approximately $600,000 if connected to the North Substation. However, the projected total electricity savings over this 25-year analysis period is less than 1.5% of our projected electricity costs without investments in solar and storage. As a result, given what would be a capital investment exceeding $3 million dollars, pursuing third party finance and ownership options makes more financial sense for the Authority.
28
Given the availability of federal tax incentives for renewable energy projects, it is common for organizations like ours which do not have a federal tax liability, to partner with entities that do for the project to benefit from tax savings. Given the modest projected returns from a direct investment of Authority capital into these projects, we evaluated scenarios where a third party would finance, operate and own the solar plus storage arrays and sell electricity to the Authority under Power Purchase Agreement (PPA) arrangements. This analysis indicated that we could reduce our electricity costs if we were to install approximately 1.2 MW of solar plus 200 kW of battery storage at the South Substation and an additional 400 kW of standalone storage at the North Substation. In the case of solar plus storage at the South Substation, lifetime electricity savings would be approximately 2-2.5%. For a standalone storage project at the North Substation, the projected returns are not much greater than what we would realize if we owned the project while minimizing capital expenditures. This is because standalone storage only benefits from federal tax incentives when paired with solar.22
Based on this analysis, were we to pursue a project of this type at Reagan National, a third party owned and managed solar plus storage project interconnected at the South Substation would be the likely choice. While lifetime savings of such a project are still relatively low, we would accrue them without making a capital investment. The electricity costs savings could be complimented by a stabilization of energy rates, and potential resiliency benefits (i.e. operating certain facilities during a power outage) from pairing storage with solar although quantifying these benefits from a monetary perspective is difficult. Finally, proceeding with such a project would also likely bring positive public relations benefits as a demonstration of our commitment to sustainability.
Participation in Green Power Programs
In addition to installing solar PV onsite at our airports, there are other opportunities to offset the emissions associated with our electricity use. Other major airports use carbon offsets as a component of their sustainability plans, including Dallas Fort Worth (DFW) and Los Angeles World Airports (LAWA). Our utility, Dominion Energy, offers the opportunity to purchase Renewable Energy Certificates (RECs) through its Green Power Program.23 RECs represent the environmental benefits of renewable energy generation. Purchasing RECs can offset the impacts of our consumption of non-renewable energy at our facilities while supporting regional renewable energy generation.
Reagan National: At an additional cost of 1.3 cents per kWh, offsetting 10%24 of our electricity use would cost us $114,000 per year based on our 2019 electricity consumption of 88 million kWh. At this level, we would also qualify for recognition for EPA’s Green Power Partnership program
Dulles International: The EPA offset requirement to earn recognition at Dulles International would be 7% as annual consumption at the airport exceeds 100 million kWh.25 To offset 7% of
22
There is an on-going debate in Congress related to tax credits for standalone storage. To the degree that such credits are enacted, the financial analysis for standalone storage under third party ownership models would show better results. 23
Dominion Energy, “Dominion Energy Green Power for My Business.” Accessed June 10, 2020. https://www.dominionenergy.com/large-business/renewable-energy-programs/green-power/green-power-for-my-business. 24
EPA, “Green Power Partnership: Partnership Green Power Use Requirements.” Accessed June 10, 2020. https://www.epa.gov/greenpower/partnership-green-power-use-requirements. 25
Ibid.
29
electricity generation with RECs, the cost to Dulles International would be $201,000 per year based on 2019 electricity consumption of 221 million kWh
Feasibility of Combined Heat and Power at Dulles International
Combined heat and power (CHP) refers to the onsite production of electricity from a turbine and the capture of waste heat from this turbine to heat water. This hot water is then sent throughout the airport to heat the facilities when needed. Currently, we purchase both electricity and natural gas from our utility partners. Investing in a CHP facility would involve using natural gas to power a turbine to generate electricity instead of purchasing electricity. The goal with an investment in CHP is that over time, the initial capital costs of the equipment and ongoing natural gas fuel costs required to power the turbine are offset by the reduction in electricity costs. The addition of CHP might also provide resilience benefits in the form of onsite generation of power in times when the larger electricity grid is down.
In 2013, the Authority commissioned an evaluation of the potential for CHP at both of our airports. At that time, the initial results were positive, particularly at Dulles International. At the time of the study, the financial payback of converting to CHP was less than 11 years.26 This study assumed a cost for natural gas of $5.86/million British Thermal Units (MMBtu). Since 2018, the cost of natural gas has been consistently under $4.00/MMBtu and often closer to $2.00/MMBtu (although some long-term projections indicate costs may rise). As a result, we believe it is prudent to update this CHP analysis to determine if it is an investment we should make in the future. Therefore, we have asked our partner, NREL, to conduct an updated analysis in 2020 and we will explore our CHP options based on the results. The results of this analysis will be included in our future sustainability reports.
From a GHG emissions perspective, CHP would result in a reduction in our Scope 2 emissions at Dulles International (e.g., purchased electricity) but an increase in our Scope 1 emissions (e.g., on-site natural gas combustion). The current GHG emissions factor for purchased utilities for Dulles International is 100 kg CO2e per MMBtu.27 For on-site combustion of natural gas, the GHG emissions are less at 60 kg CO2e per MMBtu.28 So, in addition to the energy efficiency gains and the potential cost savings resulting from an investment in CHP, our GHG emissions would decline as well. However, this improvement could be temporary as the regional grid itself moves towards cleaner sources of electricity as was noted above given Dominion Energy’s clean energy goals.
Supporting the Creation of Renewable Electricity from our Municipal Solid Waste
As we discuss in the section on Sustainable Waste Management practices, one goal of the Authority is to reduce the amount of municipal solid waste (MSW) we generate. However, while we evaluate options for reducing our MSW generation, what we currently generate is used as a raw material to create electricity. Both Virginia and the federal government (through the Energy Policy Act of 2005) consider the conversion of MSW into electricity through combustion as a renewable energy resource. After separating out recyclable material, our remaining MSW is taken by our waste haulers to what is known as a Waste to Energy (WtE) facility in Fairfax, Virginia where it is incinerated at high temperature, generating electricity using steam turbine technology. WtE conversion reduces the weight of MSW by
26
“Cogeneration Study Summary Report.” Ricondo & Associates, Inc. with CH2M Hill, Inc., June 2013. 27
See SRVC Subregion data in EPA, “Emissions & Generation Resource Integrated Database (eGRID) eGRID2018.” Accessed June 10, 2020. https://www.epa.gov/energy/emissions-generation-resource-integrated-database-egrid. 28
The Climate Registry, “2019 Default Emissions Factors.” Accessed June 10, 2020. https://www.theclimateregistry.org/wp-content/uploads/2019/05/The-Climate-Registry-2019-Default-Emission-Factor-Document.pdf.
30
roughly 80% so that the amount eventually sent to the landfill is less than 20% of the initial waste we generate overall. The electricity produced at the WtE facility flows back onto the grid for consumption by homes and businesses throughout the region. According to the U.S. Energy Information Association, 500–600 kWh of electricity can be generated by incinerating one ton of MSW in a WtE facility.29
Reagan National
Based on the 5,300 tons of MSW that Reagan National sent to the WtE facility in 2019, at 550 kWh per ton, we supported the generation of 2,915,000 kWh of electricity last year alone. Our waste provided the equivalent of 3.3% of the electricity we used at Reagan National in 2019. This is also equivalent to the production of a 2.15-MW solar farm30 and enough electricity to power 266 homes.31
Dulles International
Based on the 9,500 tons of MSW Dulles International sent to the WtE facility in 2019, we supported the generation of 5,225,000 kWh of electricity last year alone. Our waste provided the equivalent of 2.4% of the electricity we used at Dulles in 2019. This is also the equivalent to the production of a 3.75-MW solar farm32 and enough electricity to power 476 homes for an entire year.33
Maintaining our Current Level of Electricity Consumption in a More Electrified Airport
The airport of the future will be one more reliant on electricity than ever before. As airports and society grapple with air quality issues and other environmental concerns, electrification is a potential solution to many of our current problems and is currently cost effective at utility-level scale. For example, converting airport bus fleets to electricity improves local air quality, reduces GHG emissions, and saves on both fuel and maintenance costs. Electrifying the wide array of airside GSE such as baggage loaders, food service trucks, and plane tugs improves the working conditions for our airside employees and partners by reducing fumes from gas and diesel-powered equipment as well as noise levels. eGSE can also save airlines money by reducing fuel and maintenance costs. Furthermore, as more airport customers and employees travel to and from the airport in EVs, the need for the Authority to offer more EV charging stations will continue to grow. Lastly, we have seen and anticipate continuing to see ever-increasing plug-load usage in our terminals as more and more customers are utilizing our electric infrastructure to charge devices. This wholesale migration to a more electrified airport has tremendous benefits along with challenges as we need to ensure our electrical infrastructure remains robust enough over time to handle all of this expected incremental electrical load.
One of the ways we are preparing for this electrified future is by working with our partner, NREL, to analyze and model the impact of electrification over time. Knowing in advance the required electrical upgrades required to support an all-electric bus fleet, electric PTVs, increased plug loads, additional EV charging stations, and a ground service equipment fleet that is increasingly more electrified over time, for example, creates the opportunity for us to plan and budget for the required investments in our current infrastructure. Opportunities for fast charging, wireless charging, and spot charging of these vehicles throughout the day to complement overnight charging is also something we are focused on.
29
U.S. Energy Information Administration, “Biomass explained.” Accessed June 10, 2020. https://www.eia.gov/energyexplained/biomass/waste-to-energy-in-depth.php. 30
NREL, “PVWatts Calculator.” Accessed June 10, 2020. https://pvwatts.nrel.gov/pvwatts.php. 31
Using Energy Information Administration data of 10,972 kWh per year for an average US household. 32
NREL, “PVWatts Calculator.” 33
Ibid.
31
Based on the initial results of this analysis, we know that each EV bus we add to our fleet will require 170 kWh per day to complete its daily route before recharging again at night. We also know that an average PTV will consume approximately 306 kWh per day. Therefore, with 26 buses and 46 PTV, the total estimated annual consumption by these two fleets if fully electrified is 6.75 million kWh or roughly 3.0% of Dulles International’s 2019 electricity consumption. With 21 buses at Reagan National, full electrification represents roughly 1.5% of 2019 electricity consumption. Layering in electric GSEs over time at both locations will further increase the electricity consumption from these electrified transportation systems and equipment.
By modeling various scenarios of increased electricity consumption that may result as we electrify major elements of our airport operations, we can also set more realistic goals as it relates to overall airport electricity consumption. For example, rather than targeting a reduction in electricity use on a per-passenger basis, based on the data, maintaining our 2019 per-passenger levels going forward may in fact be quite an achievement as we electrify our operations.
Summary
The decisions made in the built environment in many cases have impacts lasting 50 or more years.
Upfront savings from investing in lower-cost but less-efficient products and materials can be offset by higher operating costs for decades to come. Careful, deliberate consideration from a sustainability perspective is critical when it comes to new construction and renovations. Once built, operating our facilities directly impacts how much energy we consume. Making smart investments in operations will lead to more sustainable levels of energy consumption over time. The last element to our sustainable energy strategy is the source of the energy that we consume and where it is produced. Procuring more renewable and emission-free electricity from our utility partners and complimenting that with on-site renewable energy generation is a priority so that the energy we do use is as clean and sustainably produced as possible. Together, these three pillars of smart building, efficient operations, and renewably sourced energy underlie one of our major priorities in our ongoing sustainability planning process, sustainable energy usage.
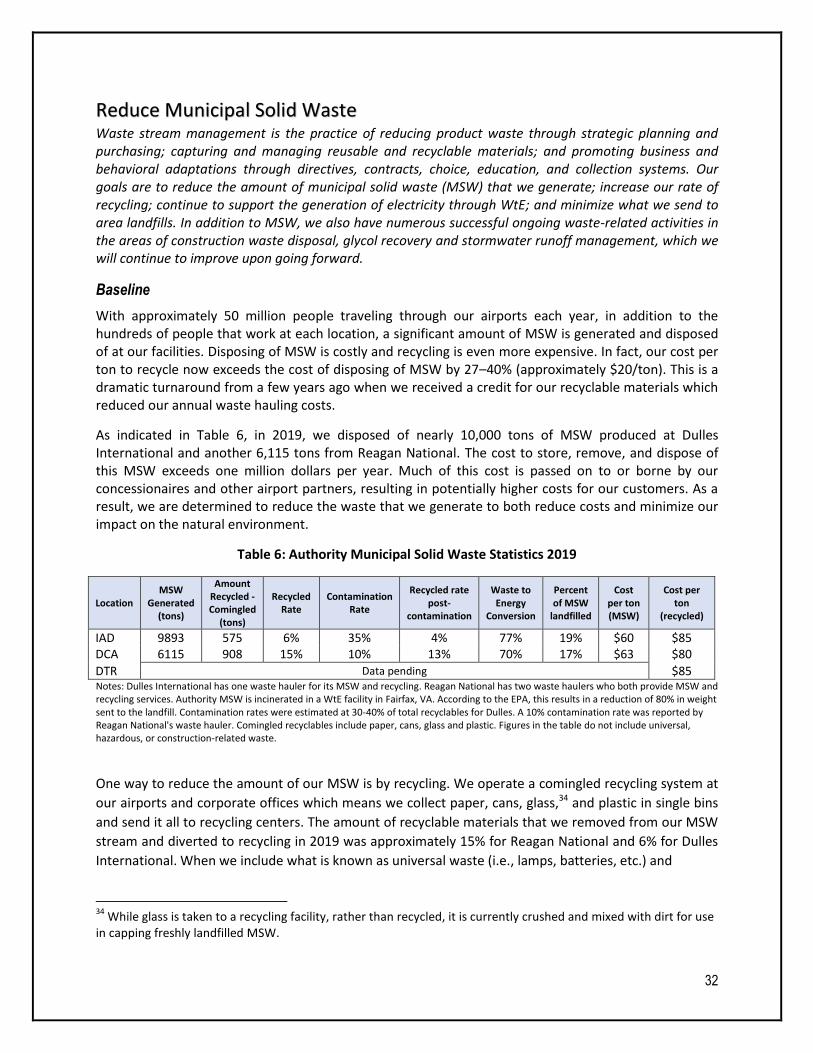
32
Reduce Municipal Solid Waste Waste stream management is the practice of reducing product waste through strategic planning and purchasing; capturing and managing reusable and recyclable materials; and promoting business and behavioral adaptations through directives, contracts, choice, education, and collection systems. Our goals are to reduce the amount of municipal solid waste (MSW) that we generate; increase our rate of recycling; continue to support the generation of electricity through WtE; and minimize what we send to area landfills. In addition to MSW, we also have numerous successful ongoing waste-related activities in the areas of construction waste disposal, glycol recovery and stormwater runoff management, which we will continue to improve upon going forward.
Baseline
With approximately 50 million people traveling through our airports each year, in addition to the hundreds of people that work at each location, a significant amount of MSW is generated and disposed of at our facilities. Disposing of MSW is costly and recycling is even more expensive. In fact, our cost per ton to recycle now exceeds the cost of disposing of MSW by 27–40% (approximately $20/ton). This is a dramatic turnaround from a few years ago when we received a credit for our recyclable materials which reduced our annual waste hauling costs.
As indicated in Table 6, in 2019, we disposed of nearly 10,000 tons of MSW produced at Dulles International and another 6,115 tons from Reagan National. The cost to store, remove, and dispose of this MSW exceeds one million dollars per year. Much of this cost is passed on to or borne by our concessionaires and other airport partners, resulting in potentially higher costs for our customers. As a result, we are determined to reduce the waste that we generate to both reduce costs and minimize our impact on the natural environment.
Table 6: Authority Municipal Solid Waste Statistics 2019
Location MSW
Generated (tons)
Amount Recycled - Comingled
(tons)
Recycled Rate
Contamination Rate
Recycled rate post-
contamination
Waste to Energy
Conversion
Percent of MSW
landfilled
Cost per ton (MSW)
Cost per ton
(recycled)
IAD 9893 575 6% 35% 4% 77% 19% $60 $85 DCA 6115 908 15% 10% 13% 70% 17% $63 $80
DTR Data pending $85 Notes: Dulles International has one waste hauler for its MSW and recycling. Reagan National has two waste haulers who both provide MSW and recycling services. Authority MSW is incinerated in a WtE facility in Fairfax, VA. According to the EPA, this results in a reduction of 80% in weight sent to the landfill. Contamination rates were estimated at 30-40% of total recyclables for Dulles. A 10% contamination rate was reported by Reagan National's waste hauler. Comingled recyclables include paper, cans, glass and plastic. Figures in the table do not include universal, hazardous, or construction-related waste.
One way to reduce the amount of our MSW is by recycling. We operate a comingled recycling system at
our airports and corporate offices which means we collect paper, cans, glass,34 and plastic in single bins
and send it all to recycling centers. The amount of recyclable materials that we removed from our MSW
stream and diverted to recycling in 2019 was approximately 15% for Reagan National and 6% for Dulles
International. When we include what is known as universal waste (i.e., lamps, batteries, etc.) and
34
While glass is taken to a recycling facility, rather than recycled, it is currently crushed and mixed with dirt for use in capping freshly landfilled MSW.
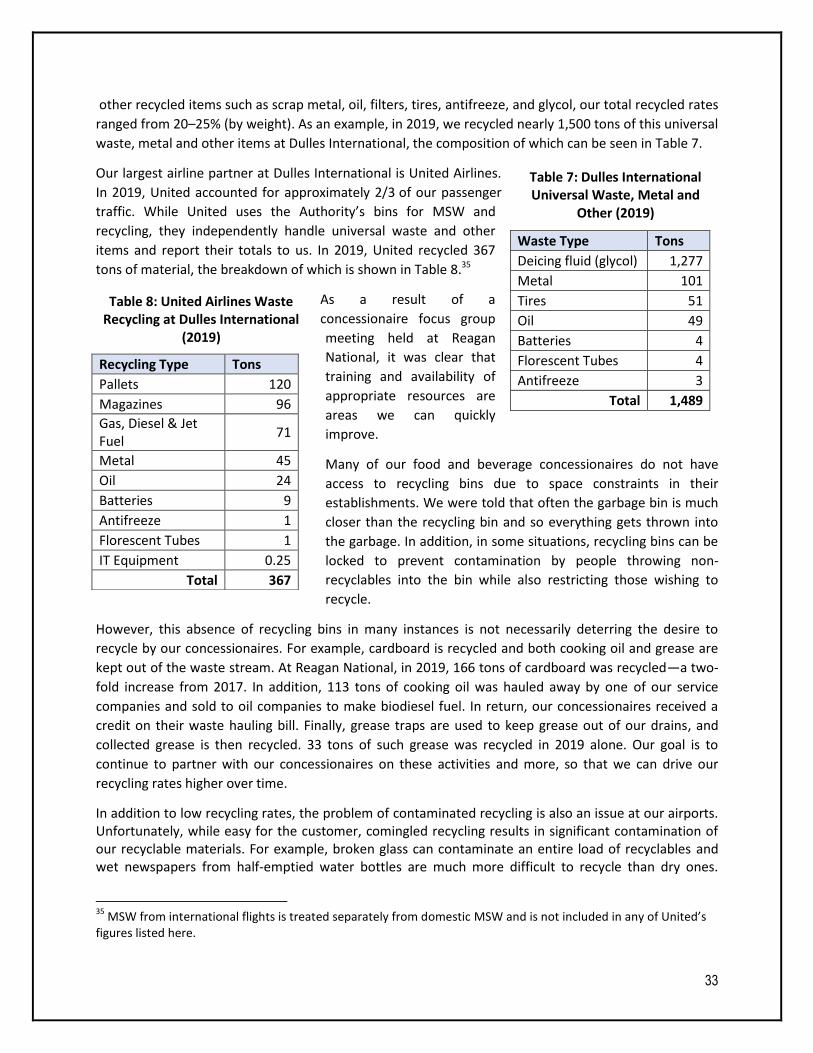
33
other recycled items such as scrap metal, oil, filters, tires, antifreeze, and glycol, our total recycled rates
ranged from 20–25% (by weight). As an example, in 2019, we recycled nearly 1,500 tons of this universal
waste, metal and other items at Dulles International, the composition of which can be seen in Table 7.
Our largest airline partner at Dulles International is United Airlines.
In 2019, United accounted for approximately 2/3 of our passenger
traffic. While United uses the Authority’s bins for MSW and
recycling, they independently handle universal waste and other
items and report their totals to us. In 2019, United recycled 367
tons of material, the breakdown of which is shown in Table 8.35
As a result of a
concessionaire focus group
meeting held at Reagan
National, it was clear that
training and availability of
appropriate resources are
areas we can quickly
improve.
Many of our food and beverage concessionaires do not have
access to recycling bins due to space constraints in their
establishments. We were told that often the garbage bin is much
closer than the recycling bin and so everything gets thrown into
the garbage. In addition, in some situations, recycling bins can be
locked to prevent contamination by people throwing non-
recyclables into the bin while also restricting those wishing to
recycle.
However, this absence of recycling bins in many instances is not necessarily deterring the desire to
recycle by our concessionaires. For example, cardboard is recycled and both cooking oil and grease are
kept out of the waste stream. At Reagan National, in 2019, 166 tons of cardboard was recycled—a two-
fold increase from 2017. In addition, 113 tons of cooking oil was hauled away by one of our service
companies and sold to oil companies to make biodiesel fuel. In return, our concessionaires received a
credit on their waste hauling bill. Finally, grease traps are used to keep grease out of our drains, and
collected grease is then recycled. 33 tons of such grease was recycled in 2019 alone. Our goal is to
continue to partner with our concessionaires on these activities and more, so that we can drive our
recycling rates higher over time.
In addition to low recycling rates, the problem of contaminated recycling is also an issue at our airports. Unfortunately, while easy for the customer, comingled recycling results in significant contamination of our recyclable materials. For example, broken glass can contaminate an entire load of recyclables and wet newspapers from half-emptied water bottles are much more difficult to recycle than dry ones.
35
MSW from international flights is treated separately from domestic MSW and is not included in any of United’s figures listed here.
Waste Type Tons
Deicing fluid (glycol) 1,277
Metal 101
Tires 51
Oil 49
Batteries 4
Florescent Tubes 4
Antifreeze 3
Total 1,489
Recycling Type Tons
Pallets 120
Magazines 96
Gas, Diesel & Jet Fuel
71
Metal 45
Oil 24
Batteries 9
Antifreeze 1
Florescent Tubes 1
IT Equipment 0.25
Total 367
Table 7: Dulles International Universal Waste, Metal and
Other (2019)
Table 8: United Airlines Waste Recycling at Dulles International
(2019)
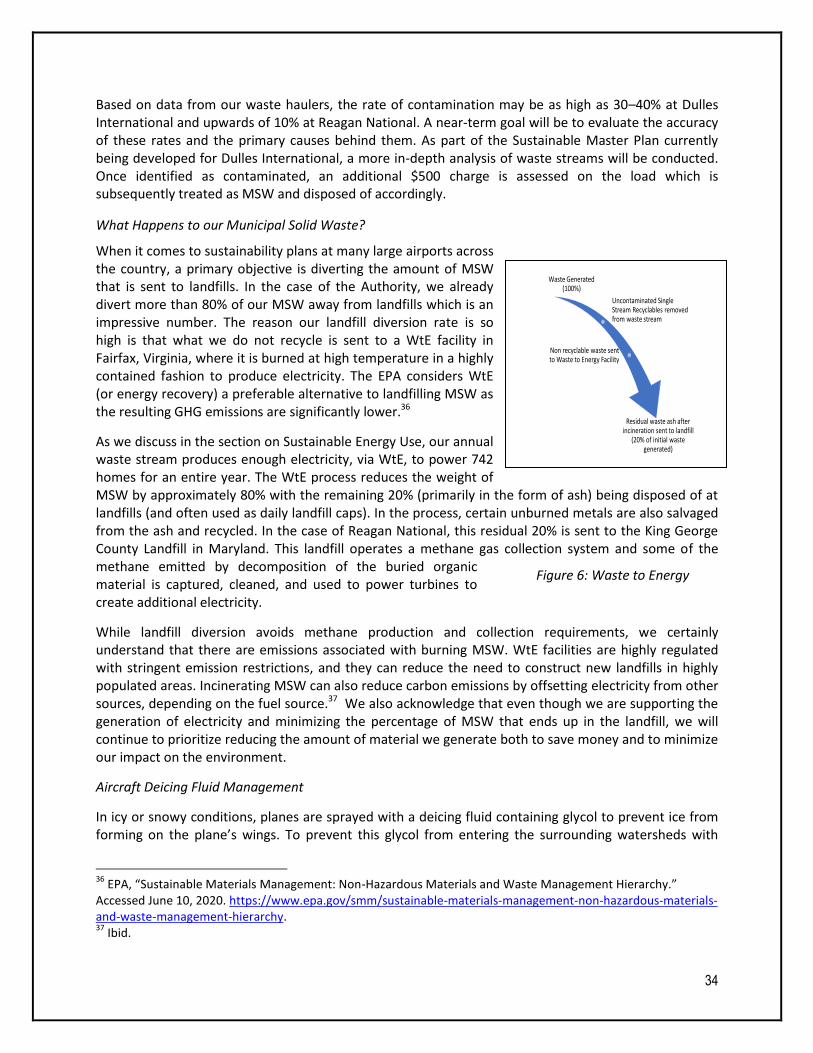
34
Based on data from our waste haulers, the rate of contamination may be as high as 30–40% at Dulles International and upwards of 10% at Reagan National. A near-term goal will be to evaluate the accuracy of these rates and the primary causes behind them. As part of the Sustainable Master Plan currently being developed for Dulles International, a more in-depth analysis of waste streams will be conducted. Once identified as contaminated, an additional $500 charge is assessed on the load which is subsequently treated as MSW and disposed of accordingly.
What Happens to our Municipal Solid Waste?
When it comes to sustainability plans at many large airports across the country, a primary objective is diverting the amount of MSW that is sent to landfills. In the case of the Authority, we already divert more than 80% of our MSW away from landfills which is an impressive number. The reason our landfill diversion rate is so high is that what we do not recycle is sent to a WtE facility in Fairfax, Virginia, where it is burned at high temperature in a highly contained fashion to produce electricity. The EPA considers WtE (or energy recovery) a preferable alternative to landfilling MSW as the resulting GHG emissions are significantly lower.36
As we discuss in the section on Sustainable Energy Use, our annual waste stream produces enough electricity, via WtE, to power 742 homes for an entire year. The WtE process reduces the weight of MSW by approximately 80% with the remaining 20% (primarily in the form of ash) being disposed of at landfills (and often used as daily landfill caps). In the process, certain unburned metals are also salvaged from the ash and recycled. In the case of Reagan National, this residual 20% is sent to the King George County Landfill in Maryland. This landfill operates a methane gas collection system and some of the methane emitted by decomposition of the buried organic material is captured, cleaned, and used to power turbines to create additional electricity.
While landfill diversion avoids methane production and collection requirements, we certainly understand that there are emissions associated with burning MSW. WtE facilities are highly regulated with stringent emission restrictions, and they can reduce the need to construct new landfills in highly populated areas. Incinerating MSW can also reduce carbon emissions by offsetting electricity from other sources, depending on the fuel source.37 We also acknowledge that even though we are supporting the generation of electricity and minimizing the percentage of MSW that ends up in the landfill, we will continue to prioritize reducing the amount of material we generate both to save money and to minimize our impact on the environment.
Aircraft Deicing Fluid Management
In icy or snowy conditions, planes are sprayed with a deicing fluid containing glycol to prevent ice from forming on the plane’s wings. To prevent this glycol from entering the surrounding watersheds with
36
EPA, “Sustainable Materials Management: Non-Hazardous Materials and Waste Management Hierarchy.” Accessed June 10, 2020. https://www.epa.gov/smm/sustainable-materials-management-non-hazardous-materials-and-waste-management-hierarchy. 37
Ibid.
Waste Generated (100%)
Uncontaminated Single Stream Recyclables removed from waste stream
Non recyclable waste sent to Waste to Energy Facility
Residual waste ash after incineration sent to landfill
(20% of initial waste generated)
Figure 6: Waste to Energy
35
negative repercussions to flora and fauna, we have a well-developed system to not only capture, but sell glycol to a third party for reuse. In the winter of 2018–19, we captured 800,000 gallons of deicing liquid containing glycol. We sold this glycol and received $113,000 in return. Since 1999, we have recovered 16 million gallons of liquid containing glycol at our two airports. Our goal is to continue to increase our collection rate beyond 56%, as it stands today, if we can do so in a cost-effective manner. As part of that goal, we will complete a new deicing collection system at Reagan National this year.
Project Journey Investments
Along with the energy and water efficiency measures included in Project Journey at Reagan National, we are also making significant investments to minimize our impact on the surrounding environment resulting from this major airport improvement effort. During demolition of hangars to make way for Project Journey, we recovered and safely disposed of more than 290 pounds of refrigerants. In addition, we have installed additional hydrant fuel leak detection systems, oil-water separators, and glycol diversion vaults in line with similar investments previously made at our airports.
Stormwater Quality
In order to protect the Chesapeake Bay Watershed within which we operate, the Authority has installed more than 70 oil-water separators and other water quality improvement structures to help filter sediments and other contaminants from the effluent prior to being discharged back into local waterways. As part of the construction of the fourth runway at Dulles International, we installed five biological treatment units to minimize impacts of stormwater runoff from this project. We are also installing 16 stormwater management facilities along the DTR as part of the Metrorail expansion to Dulles International.
Best Practices Opportunities
Reduce Our Solid Waste
While recycling is important, we think there are opportunities to reduce the overall quantity of waste generated at our facilities. Our lowest-cost waste is the ton of waste that is not created. Some of the areas we intend to focus on going forward are the following:
Reduce Packaging
We need to consider how the Authority and our concessionaire partners can reduce the amount of packaging (i.e. plastics, Styrofoam, pallets, bags, cardboard, etc.) that comes into and is used at the airport. There may be bulk buying opportunities across concessionaires that reduce the number of deliveries. This would have the co-benefit of reducing diesel truck trips to and from our facilities, improving landside air quality and reducing congestion. This may also include minimizing the use of plastic bags and reducing what is provided to the customer in terms of napkins, utensils, condiment packages and similar items that they do not request or need and ultimately throw out. We have only recently initiated these conversations with concessionaires based on the positive feedback received in the concessionaire sustainability survey conducted in 2019. Near term, we can evaluate a voluntary program with a limited number of food and beverage concessionaires to see if we can demonstrate measurable reductions in package and plastic related MSW. Other airports have banned certain types of packaging and plastics. Rather than take this approach, we prefer to work collaboratively with our concessionaires to see what we can develop on a voluntary basis. As concessionaires are charged for MSW removal, there is an opportunity for them to reduce costs by minimizing waste.
36
Food Donation Programs
Based on our concessionaire focus group discussions, a limited number of them individually participate in packaged food donation programs which send food to shelters. However, most simply discard past-date food into the trash. This results in tons of wasted food that could improve the lives of community members struggling with hunger, as well as higher MSW disposal costs. There are certain logistical and security challenges associated with such programs, but it does appear to be a relatively low-cost initiative with meaningful benefits to the surrounding communities. Many of our peer airports have more comprehensive food donation programs and we intend to study those and see what we can replicate at our facilities.
Abandoned Luggage
A surprisingly large number of suitcases and other assorted luggage is left behind at our airports. If a wheel breaks on a suitcase, for example, or if a passenger needs to consolidate two bags into one at the gate, often these bags are simply left behind in the terminal and for the most part end up in the trash. It is possible that this luggage could be repaired and donated to homeless shelters, foster care facilities, or secondhand stores. Regardless, it is an example of some of the non-traditional waste we handle and the need to be creative and think about low cost ways to minimize what ends up in our waste stream.
Increase Rates of Recycling
What the data tells us is that we have a lot of work to do with regards to outreach and education for our airport stakeholders as to the proper way to recycle. We also must think creatively about how we provide recycling services to all our concessionaires given the limited space within which they operate. Fortunately, many of these issues with recycling are behavioral in nature, and ideally can be addressed in relatively low-cost ways. For example, we can:
Ensure that labeling of bins is clear as to what is recyclable and what is trash to minimize contamination
Develop standardized training materials for all new employees at our concessions and continuously reinforce these standards so everyone knows how and where to recycle
Work with our cleaning crews to make sure they dispose of trash and recyclables properly, giving them additional equipment and training if necessary
In addition to these lower-cost measures, other higher-cost opportunities to increase our recycling rates and reduce contamination include the following:
Continue to add recycling bins across our facilities to make sure a recycle bin is always co-located with a garbage bin. As we heard from our concessionaires, the closest bin is the easiest to use and so we need to make it easy for people to recycle. Per our waste management contract at Dulles, the annual cost to rent a recycle bin is $240/year. As we add recycling bins, our recycling costs will increase as well at a $20 per-ton premium over MSW
Install liquid disposal stations throughout the airport (including at Transportation Security Administration) to reduce both the incidence of contamination and the weight of our recyclables, each of which imply higher costs. We have held initial conversations with our beverage partner, Pepsi, on financing these disposal stations, which cost approximately $2,000 each
37
Continue to add no-touch water bottle refill stations across our facilities. These refill stations minimize the purchase of on-site single serve refreshments, which ultimately add to our waste stream
Evaluate Pilot Composting Options
Many airports compost organic material to reduce the tons of MSW that is landfilled or otherwise disposed of. Organic material creates methane, a GHG, when left to decompose in a landfill. It is also dense, and its weight adds significant cost to our MSW stream for which we currently pay $60–$63/ton to remove. On-site composting is difficult for airports given the desire to reduce wildlife attractants to our facilities and runways. As a result, airports that compost typically have their organic material sent to third-party, industrial composting facilities.
When discussing composting, there is also a distinction between what is known as pre-consumer organic material and post-consumer material. Think of a prepared salad where the prep kitchen ends up with odds and ends of various vegetables. Currently, this material (pre-consumer organics) is tossed in the trash. When our customer enjoys her salad, whatever food is left over is considered post-consumer organic waste, which is also thrown into the trash, often with napkins, plastic utensils, and plastic serving containers of some sort. As a result, pre-consumer organic material collection at a limited number of prep kitchens is much simpler to manage than post-consumer collection which would require multiple bins throughout our food courts, significant customer education on what can be composted, and higher rates of contamination.
Conversations with our waste hauling partners in early 2020 indicated the Authority’s composting options are limited as well as expensive—as much as 10 times the cost of municipal solid waste. In addition to cost, the simple lack of space in our food and beverage concessions is another limitation that would need to be addressed. As noted above, our concessionaires currently do not have room for recycling bins, so adding a third bin to the mix would be difficult. We are just beginning to study this issue as part of our sustainability planning and while we believe the investment required for wide-scale composting may not currently meet our cost-benefit parameters, we will continue to gather data to make a more definitive decision. We may find that a small pilot with our commercial food prep kitchens, for example, is worth the smaller investment of time and money to accurately determine the potential volume of organic material we can remove from our waste stream and if composting on a larger scale in the future is realistic or not.
Dulles International Airport Master Planning Process
In addition to our renewed efforts on sustainability planning, the Authority is currently involved in the development of our new Master Plan for Dulles International. Per FAA guidance, airport master plans require “a plan for recycling and minimizing the generation of airport solid waste, consistent with applicable State and local recycling laws."38 These plans need to include how we currently dispose of MSW, construction and demolition waste, organic waste, and domestic deplaned waste, as well as our plans for the future. As a result, many of the initiatives discussed in this section on Sustainable Waste Management lay the foundation for updates to our long-range waste management plans that will be
38
See FAA, “Memorandum: Guidance on Airport Recycling, Reuse, and Waste Reduction Plans.” Accessed June 10,
2020. https://www.faa.gov/airports/environmental/media/airport-recycling-reuse-waste-reduction-plans-
guidance.pdf.
38
incorporated into our current Dulles International Master Planning process and eventually the planning process for Reagan National as well.
Salt Use Along the Dulles Toll Road
While rock salt is an effective means to protect drivers along the DTR from icy and snowy conditions, this salt eventually makes its way into surrounding waterways with negative environmental repercussions. The quantity of salt we need to use is dependent on weather conditions. Nonetheless, there are potential replacements for rock salt that have fewer impacts on the environment but are still effective. In addition, we may be able to improve our process for applying rock salt to the roads, so that the total quantity needed is reduced. One area that could be explored is utilization of pavement monitoring systems to evaluate the current and potential temperature of the roadway system based on weather forecast, chemical composition sensors, and pavement temperature sensors. These systems can enable operators to forecast the need to apply the appropriate chemicals prior to impending weather events, and monitor areas that may need reapplication. The result is more targeted application of safety products, with less waste and environmental impacts.
Summary
With over 16,000 tons of municipal solid waste generated each year across our airports and other facilities, there are many opportunities to reduce this amount and save money in the process. Rethinking the process by which goods enter our airports for subsequent distribution to concessionaires may create opportunities for waste reduction. Our rates of recycling are relatively low, and contamination of recyclable materials also appears to be an issue. Despite the higher costs, we will continually look for ways to improve on both metrics. Nonetheless, we are fortunate that what we do not recycle is sent to a WtE facility as raw material to produce electricity. As a result, the percentage of our waste that is disposed of at the landfill is low compared to our peers. Finally, improving on our waste stream management practices is also a team effort and we look forward to working with our various partners in this area.
39
Develop and Maintain a Culture of Sustainable Administration Sustainable Administration is the practice of executing sustainability policy through directives, guidance, contracting agreements, manuals, purchases, and services. The goal is to develop a culture of sustainability and codify sustainable practices throughout the Authority’s administration of the airports and the Dulles Toll Road. In addition, ensuring that sustainability is incorporated in planning and design decisions of any new construction or major renovation projects and operational decisions are important as that is when it can be the most practical and cost effective. Sustainable Administration encompasses fundamental documentation such as Procurement Manuals, Design Manuals, Master Plans, and Capital Investment Plans as well as tenant and concessionaire lease agreements, vendor contracts (i.e. waste hauling contracts, cleaning contracts, etc.), and other purchasing decisions. In addition, Sustainable Administration practices seek to influence day to day behaviors such as reducing waste throughout corporate offices; exploring telecommuting options; and eliminating unnecessary work travel.
Baseline
To date, the Authority has incorporated many sustainable practices into the day-to-day management of the airport facilities and toll road, minimizing our impacts on the natural environment and in many cases, generating cost savings. However, by intentionally codifying sustainable practices and guidance into all planning, operations, and purchasing decisions, we intend to further the development of a culture of sustainable administration. We will put policy and directives in place where we have control and provide sustainable guidance and options where we have influence such as with our tenant lease agreements.
Metrics to Measure Success
We intend to measure our success in promoting a more sustainable operating environment in many ways. As it relates to more administrative practices, much of the positive benefits of our activities will be measured in other categories of the sustainability plan. For example, as we update our Design Manual with more stringent water consumption standards, over time, we will document the results of such policies through our sustainable water initiatives as we seek to use less water on a per passenger basis going forward. In addition, as we add sustainability-related clauses to our tenant lease agreements, we hope to see benefits in our sustainable waste management practices and in the reduction of electricity use. Regardless, there are certain metrics that we can use to directly measure our progress in promoting a more sustainable administrative culture. These include the following.
Given how rapidly building code requirements and standards change and how new technologies quickly become cost effective, it is imperative that we keep our Design Manual and related documentation up to date. We are currently updating our 2014 Design Manual to a 2020 version and our goal is to improve our ability to evaluate emerging technologies between formal manual updates
One of the planned initiatives under the sustainability plan is to create a Sustainability Committee to improve coordination across the many Authority stakeholders. Success metrics related to the committee would include the actual establishment of the committee, the frequency of meetings,
40
and documented impacts resulting from enhanced coordination amongst participants
As leases and contracts come up for renewal with our various service providers and tenants, one potential metric to track is the number of these renewed agreements that include new sustainability related standards, clauses, and guidance. The sustainability committee will work with our legal department, and others, to define these standards, clauses and guidance. Peer airports will be a source of representative language for the committee to consider
Finally, the sustainability plan documents multiple goals and activities across many categories. The Sustainability Committee would have the responsibility to track the progress towards, and attainment of the plan’s goals, as well propose new goals and activities as additional opportunities arise
Existing Activities
We are currently engaged in many activities with the goal of creating a more sustainable way of conducting our business across Authority-operated facilities.
Design Manual Update
One of our highest priorities is updating the 2014 Design Manual so that we codify more forward-looking requirements related to building envelope design; mechanical, electrical, and plumbing infrastructure; environmental requirements; and landscaping for us and our tenants. This effort supports a broader reach in improving the Authority’s and our tenants’ operations by reducing energy and water consumption, waste generation, and promoting more sustainable operations. This update will be completed in 2020. The sustainability planning process and the Design Manual update are being carried out in a coordinated fashion so that the Manual supports the Authority’s broader sustainability goals. The Manual will be updated on a recurring basis to capture advances in sustainable building practices.
Sustainable Master Plan
We are in the process of developing our 10-year Sustainable Master Plan at Dulles International where sustainability will be embedded into all our planning processes going forward. We expect this plan to be completed in 2021.
Partnership with the National Renewable Energy Laboratory
We have partnered with NREL to re-examine our operations from a sustainable energy and water use perspective and will incorporate suggested recommendations that come out of this partnership, as is financially feasible. Under the Authority’s direction, among many activities, NREL has or is:
Guided the development of the Sustainability Plan
Managing the update of the 2014 Design Manual with an emphasis on sustainability
Developed our first greenhouse gas emissions inventory
Measured daily duty cycles of representative Passenger Transfer Vehicles (PTV) using data-loggers to calculate daily mileage, fuel consumption and idling times. This data is supporting our efforts to procure new Passenger Transfer Vehicles
Assessed the feasibility of solar power and battery energy storage at Reagan National
41
Developed 2018 and 2019 Baseline Inventories for both airports with summary energy, water, municipal solid waste, and transportation metrics
Conducted a cost-benefit analysis of replacing diesel and CNG buses with electric buses
Compared ground level ozone impacts of hybrid electric vehicles with traditional internal combustion engine vehicles to support efforts to add hybrid vehicles to our fleets
Initiating an airside electrification study related to ground service and other airside equipment to determine options for increasing the use of electric vehicles and implications for our electric infrastructure
Initiating resiliency assessments at both airports to help us better understand areas of potential vulnerability and to be better prepared to manage critical infrastructure during power outages
Gathering data for an updated cost-benefit analysis for the use of Combined Heat and Power (CHP) at Dulles International
Concessionaire Sustainability Survey
We conducted a Concessionaire Sustainability Survey in 2019 and received encouraging feedback from concessionaires on their interest in wanting to reduce water and energy use, recycle more, and consider composting initiatives. We will continue to engage our concessionaire partners through additional surveys and focus group meetings on sustainability as we seek to present a consistent experience for our airport customers throughout our facilities.
Best Practices Opportunities
As is illustrated by the list of existing activities, we are proud of what we have accomplished to date. However, there are many opportunities that exist to increase our sustainability, improve efficiency, and decrease our impacts on the environment. Some of the initiatives we are considering include the following.
Review Our Current Operational Procedures, Contracts, and Leases to Add Sustainability Requirements
Although we are currently focused on updating the Design Manual, we will be turning our attention to the other contracts, leases, and agreements that we negotiate with our airlines and other airport partners; and our internal operational procedures, to determine what language, if any, we can add to encourage more sustainable practices. This will be done where appropriate rather than a blanket policy that all new agreements need to contain updated sustainability requirements. We of course need to strike a balance between promoting our sustainability interests with that of managing the burdens we may be placing on our staff and partners. Sustainability can come at a cost, which is ultimately passed on to the end consumer—our customer. It can also imply lower revenues for the Authority if it impacts profitability of our concessionaires. That is why we do not intend to simply require more sustainable practices on the part of our concessionaires and staff, but preferably look for ways where we can partner with them on such practices. Reducing the amount of MSW generated at our facilities by reducing packaging, plastics, and Styrofoam use is one area in which we will need to partner with everyone. Ensuring that our contracts with outside cleaning companies require the purchase of environmentally preferred products (i.e., cleaning supplies, paper, etc.) is also an area for partnership as we know these products are often more costly. In addition, just like our own internal telecommuting strategies, we would like to explore opportunities with our concessionaires regarding decreasing the frequency of commuting for their own employees and/or promoting shorter commutes. As we continue
42
to hold concessionaire and internal focus groups, what these partnerships will look like will become more defined.
Establish a Sustainability Committee
The creation of a Sustainability Committee comprised of representatives from the various specialties within the Authority and our many stakeholders would establish a regular forum to support on-going sustainability efforts and identify opportunities to partner on specific activities. As part of this committee, an Authority chairperson could be assigned to perform primary duties of a sustainability coordinator or this role could rotate amongst different Authority staff members. The role of this coordinator would be to manage committee participation across stakeholder groups, and act as a primary internal advocate for sustainable practices and meeting our goals as laid out in the Sustainability Plan.
Conduct Green Meetings and Continue with Telecommuting Practices
While some activities may involve higher costs, there are those that do not and that might even save us money. Recent shifts including telecommuting and the move to virtual meetings is one of those activities. Telecommuting results in reductions in commuting and congestion. According to the Texas A&M Transportation Institute,39 Metro DC has the third worst traffic in the nation with drivers spending more than 100 hours per year in traffic delays. Virtual meetings have the added benefits of reducing printing and handouts. In addition, for those meetings that require being on site, we want to make sure we add a virtual option to all our meetings to allow our dispersed staff to attend from their primary facilities when it isn’t necessary to have all parties in one location. While the impacts are modest from these activities, these seemingly small behaviors set the tone for the bigger ambitions we have for ourselves.
Publicly Recognize Our Concessionaires Operating in a Sustainable Manner
Other major airports around the country promote and celebrate their concessionaires that are operating in a sustainable fashion. When we surveyed our concessionaires in 2019, we heard from them that they too would like some level of acknowledgement of their sustainable activities. Many consumers today, including our airport customers, seek out opportunities to vote with their pocketbooks and want to give their business to those operating in a sustainable fashion. Employees also want to work for companies that are doing the right thing, from an environmental and socially responsible perspective. Making it easy for our airport customers to know where to find these concessionaires throughout the airport is something we should be doing. Ideally, not only will a program of this sort recognize those concessionaires employing sustainable practices but also encourage all concessionaires to think more sustainably about how they conduct their business at the airport.
Summary
Implementing, codifying, and promoting a culture of sustainable administration is a key component of our sustainability planning process. Codifying a higher level of sustainable requirements across all of the Authority’s documentation, contracts, practices, and plans increases the likelihood that the desired outcomes, whether it be less fuel use, a reduction in municipal solid waste generation, and airport
39
The Washington Post, “‘It’s a waste of time’: Washington is No. 3 in traffic congestion, study says,” Aug. 22, 2019, https://www.washingtonpost.com/local/trafficandcommuting/its-a-waste-of-time-washington-is-no-3-in-traffic-congestion-study-says/2019/08/22/e6602e0e-c4d6-11e9-b72f-b31dfaa77212_story.html.

43
operations that are less impactful on the natural environment, are achieved. However, these activities will take time and require strong partnerships as we not only seek to improve how we administer our facilities and operations, but also, how best to influence the many partners that we rely on to operate our airports to do so in a sustainable manner.
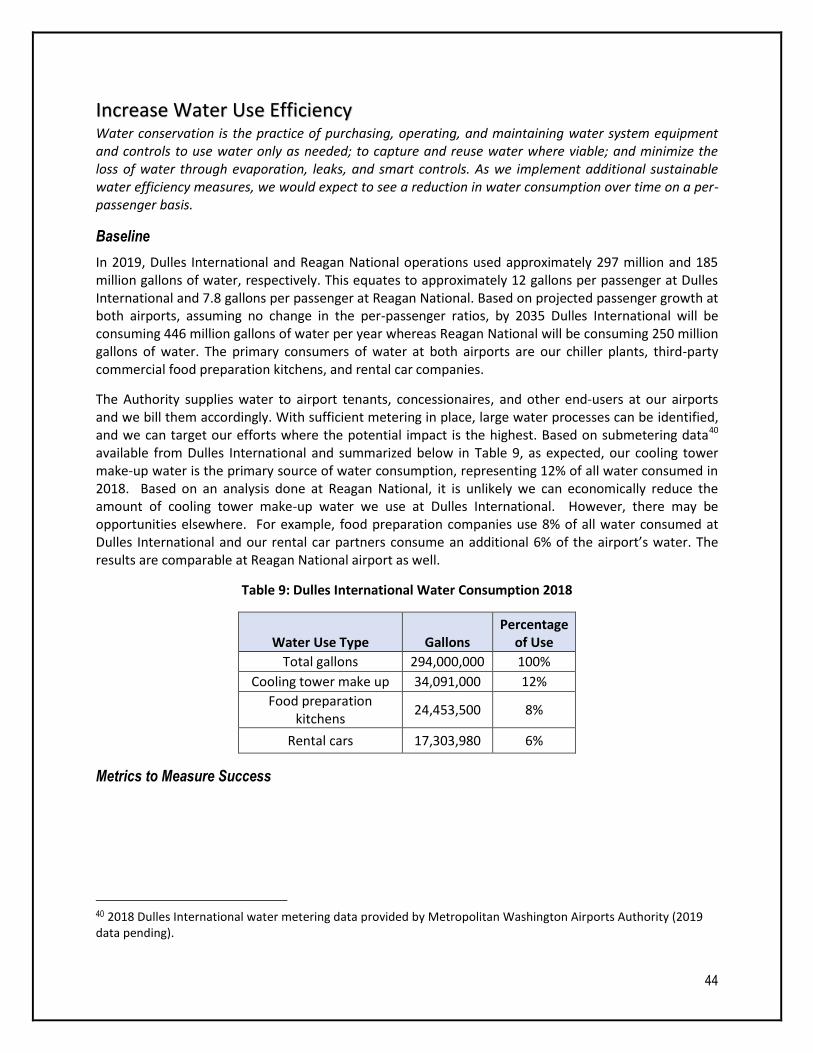
44
Increase Water Use Efficiency Water conservation is the practice of purchasing, operating, and maintaining water system equipment and controls to use water only as needed; to capture and reuse water where viable; and minimize the loss of water through evaporation, leaks, and smart controls. As we implement additional sustainable water efficiency measures, we would expect to see a reduction in water consumption over time on a per-passenger basis.
Baseline
In 2019, Dulles International and Reagan National operations used approximately 297 million and 185 million gallons of water, respectively. This equates to approximately 12 gallons per passenger at Dulles International and 7.8 gallons per passenger at Reagan National. Based on projected passenger growth at both airports, assuming no change in the per-passenger ratios, by 2035 Dulles International will be consuming 446 million gallons of water per year whereas Reagan National will be consuming 250 million gallons of water. The primary consumers of water at both airports are our chiller plants, third-party commercial food preparation kitchens, and rental car companies.
The Authority supplies water to airport tenants, concessionaires, and other end-users at our airports and we bill them accordingly. With sufficient metering in place, large water processes can be identified, and we can target our efforts where the potential impact is the highest. Based on submetering data40 available from Dulles International and summarized below in Table 9, as expected, our cooling tower make-up water is the primary source of water consumption, representing 12% of all water consumed in 2018. Based on an analysis done at Reagan National, it is unlikely we can economically reduce the amount of cooling tower make-up water we use at Dulles International. However, there may be opportunities elsewhere. For example, food preparation companies use 8% of all water consumed at Dulles International and our rental car partners consume an additional 6% of the airport’s water. The results are comparable at Reagan National airport as well.
Table 9: Dulles International Water Consumption 2018
Water Use Type Gallons Percentage
of Use
Total gallons 294,000,000 100%
Cooling tower make up 34,091,000 12%
Food preparation kitchens
24,453,500 8%
Rental cars 17,303,980 6%
Metrics to Measure Success
40 2018 Dulles International water metering data provided by Metropolitan Washington Airports Authority (2019 data pending).
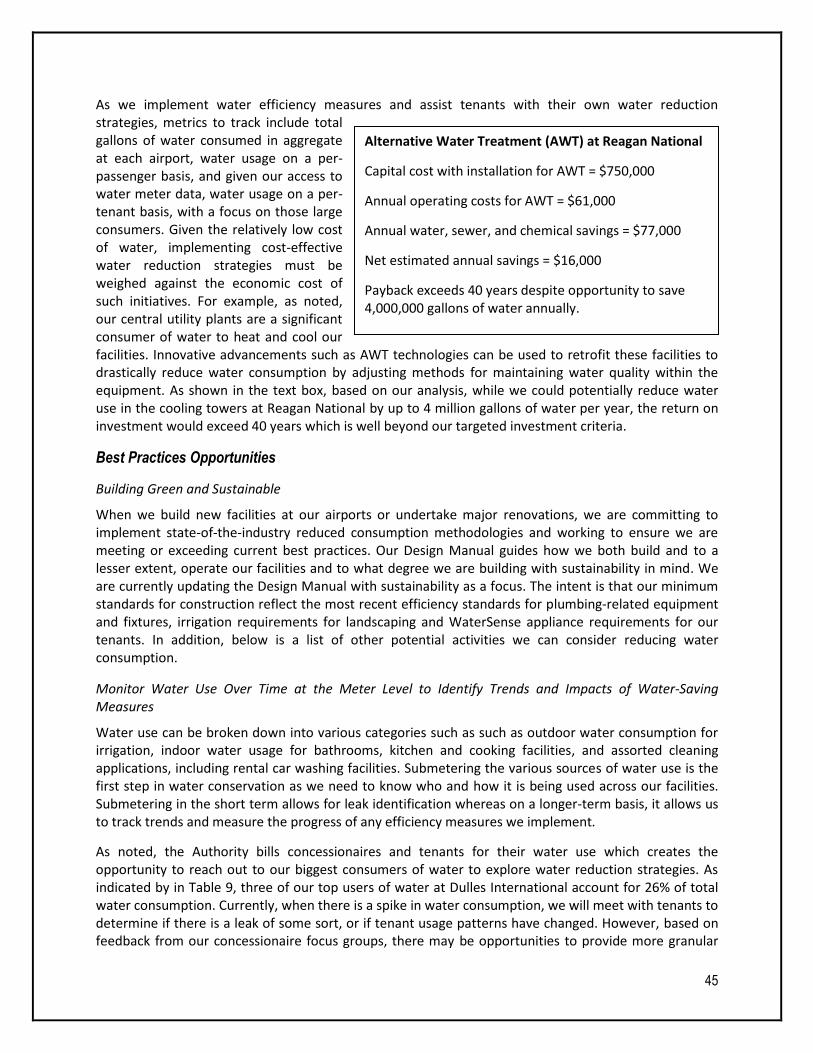
45
As we implement water efficiency measures and assist tenants with their own water reduction strategies, metrics to track include total gallons of water consumed in aggregate at each airport, water usage on a per-passenger basis, and given our access to water meter data, water usage on a per-tenant basis, with a focus on those large consumers. Given the relatively low cost of water, implementing cost-effective water reduction strategies must be weighed against the economic cost of such initiatives. For example, as noted, our central utility plants are a significant consumer of water to heat and cool our facilities. Innovative advancements such as AWT technologies can be used to retrofit these facilities to drastically reduce water consumption by adjusting methods for maintaining water quality within the equipment. As shown in the text box, based on our analysis, while we could potentially reduce water use in the cooling towers at Reagan National by up to 4 million gallons of water per year, the return on investment would exceed 40 years which is well beyond our targeted investment criteria.
Best Practices Opportunities
Building Green and Sustainable
When we build new facilities at our airports or undertake major renovations, we are committing to implement state-of-the-industry reduced consumption methodologies and working to ensure we are meeting or exceeding current best practices. Our Design Manual guides how we both build and to a lesser extent, operate our facilities and to what degree we are building with sustainability in mind. We are currently updating the Design Manual with sustainability as a focus. The intent is that our minimum standards for construction reflect the most recent efficiency standards for plumbing-related equipment and fixtures, irrigation requirements for landscaping and WaterSense appliance requirements for our tenants. In addition, below is a list of other potential activities we can consider reducing water consumption.
Monitor Water Use Over Time at the Meter Level to Identify Trends and Impacts of Water-Saving Measures
Water use can be broken down into various categories such as such as outdoor water consumption for irrigation, indoor water usage for bathrooms, kitchen and cooking facilities, and assorted cleaning applications, including rental car washing facilities. Submetering the various sources of water use is the first step in water conservation as we need to know who and how it is being used across our facilities. Submetering in the short term allows for leak identification whereas on a longer-term basis, it allows us to track trends and measure the progress of any efficiency measures we implement.
As noted, the Authority bills concessionaires and tenants for their water use which creates the opportunity to reach out to our biggest consumers of water to explore water reduction strategies. As indicated by in Table 9, three of our top users of water at Dulles International account for 26% of total water consumption. Currently, when there is a spike in water consumption, we will meet with tenants to determine if there is a leak of some sort, or if tenant usage patterns have changed. However, based on feedback from our concessionaire focus groups, there may be opportunities to provide more granular
Alternative Water Treatment (AWT) at Reagan National
Capital cost with installation for AWT = $750,000
Annual operating costs for AWT = $61,000
Annual water, sewer, and chemical savings = $77,000
Net estimated annual savings = $16,000
Payback exceeds 40 years despite opportunity to save 4,000,000 gallons of water annually.
46
water reports to measure and monitor longer-term usage patterns. This would be particularly relevant should we partner with concessionaires on water reduction strategies with the goal of measuring the results.
Food Preparation Operations
As noted, food preparation companies used more than 24 million gallons of water at Dulles International in 2018. It is not surprising that food preparation companies, and food and beverage establishments in general, use significant quantities of water to maintain a clean and hygienic environment. However, there are ways that we may be able to work with them to reduce water use. For example, most food service businesses defrost their frozen food by continuously running tap water over it. Tens of thousands of gallons of potable water are used in this manner, all of which is eventually sent down the drain. While running tap water over frozen food is a USDA-recommended manner for thawing, there are now new, low-cost methods coming on to the market that can materially reduce this water use (i.e., Boss Defrost, CNSRV WTR, etc.). We intend to explore some of these new methods with our concessionaire partners to see if they are feasible options. In addition, we can survey the equipment being used to determine if there are more water-efficient appliances and devices the concessionaires could be using to reduce water consumption.
Rental Car Water Usage
As noted above, our rental car partners at Dulles International used 6%, or more than 17 million gallons of water in 2018. Based on an initial analysis, rental car water usage at Reagan National may be as high as 10% of total airport consumption.41 Based on this data, we plan to conduct outreach to these rental car companies to discuss ways to use less water while keeping their cars clean for the next set of customers. Potential options could include using 100% recycling systems that reclaim and reuse all water not lost to evaporation, reducing sewage runoff and potable water consumption in the process. Harvested rainwater instead of potable water to wash cars is also worth investigating. Finally, there may be adjustments to, or replacement of, elements of the current car washing equipment that result in less potable water use per car wash.
Irrigation Needs at Dulles International and the Dulles Toll Road
Based on potential usage, we plan to focus upon our current water consumption for irrigation at Dulles International and the DTR. Submetering and monitoring of systems can determine if there are opportunities to reduce the water usage in this area. Given Reagan National’s more modest geographic footprint, irrigation is not deemed a high priority now; however, it may be examined in the future.
Evaluate Rain and Stormwater Harvesting Options to Reduce the Use of Potable Water
Opportunities for non-potable water usage at airports can represent a significant percentage of total water consumption as it includes irrigation, rental car and aircraft washing facilities, and cooling towers. Using potable water for such things is unnecessary. Capturing and diverting rainwater can also positively impact stormwater management practices, decreasing flows into nearby bodies of water. While our initial assumptions lead us to believe that the return on investment for installing the required infrastructure to capture rainwater airport-wide would be low, there may exist more strategic and targeted ways to pursue this water conservation measure in the future. For example, there are
41
2018 Reagan National tenant utility data provided by Metropolitan Washington Airports Authority (2019 data pending).
47
examples of other airports adding water collection infrastructure to a new construction project (i.e., a parking garage) when costs are lower, and channeling this rainwater to nearby bathroom facilities (water closets and urinals). Virginia code allows for and encourages the use of rainwater harvesting for non-potable water uses.42 As a result, there may be opportunities for us to learn from other large enterprises in the state that are implementing rainwater harvesting strategies. The potential for rain and stormwater harvesting will also be addressed in the updated Design Manual so that opportunities for such systems will at a minimum be considered at the outset of the planning and design phase for any new construction.
Other Simple, Low-Cost and Effective Ways to Reduce Water Use
Our concessionaires and partners at the airport are often the people closest to the day-to-day operations of our facilities, and we can benefit from this on-the-ground experience. For example, the company that processes our fryer oil and grease traps, B&P Environmental One, made the observation in the concessionaire focus group session that when the screens on the fryer oil bins are not cleaned, fryer oil spills on the ground adjacent to the exterior tank. As a result, cleaning crews then use water and cleaning chemicals to clean up the spilled oil, potentially leaving residual chemicals that could travel with rainwater to our local watershed. By updating training and following a regular cleaning schedule for the bin screens, not only can B&P capture more fryer oil to sell for reuse, we also reduce water consumption, along with time and effort of our staff. Based on this focus group session, we plan to evaluate a system whereby concessionaires and other airport partners can easily communicate with us to share their ideas for more sustainable practices. Other major airports have successfully used similar communications systems. As with the fryer oil screens, we believe that many of our partners will also have simple but effective ideas that can potentially add up to material reductions in water usage as well as lower energy consumption and better waste stream management.
Summary
Between our two airports, we consume nearly 500,000,000 gallons of water each year. By 2035, we could be consuming as much as 750,000,000 gallons. Implementing creative ways to reduce our water consumption in a financially responsible manner is challenging given the low cost of water. However, through more stringent standards in the Design Manual, outreach to tenants, and a more concerted effort on our part to lower water use in our operations, we believe we can make material improvements in our water metrics on a per-passenger basis going forward.
42
See Code of Virginia, § 32.1-248.2. “Use of rainwater and reuse of gray water; regulations.” https://law.lis.virginia.gov/vacode/title32.1/chapter6/section32.1-248.2/ (Accessed June 10, 2020).
48
Encourage Efficient Use of Public Transportation
Promoting Sustainable Access to Dulles International and Reagan National Airports
According to the Texas A&M Transportation Institute,43 Metro DC has the third-worst traffic in the nation with drivers spending more than 100 hours per year in traffic delays. This is compounded by the air quality issues that all this stop-and-go traffic creates. Of course, our airports are a microcosm of this wider metro-level issue as our customers and employees experience congestion and delays getting to and from their flights and their jobs at peak times throughout the day. Adding to the traffic has been the explosive growth of the ride sharing industry which can add to curbside and road congestion. As part of our sustainability efforts, we intend to continue to promote, as feasible with current public health concerns, the use of public transit and other non-vehicle access to our airports.
Baseline
The Authority already has an abundance of opportunities for our customers and employees to get to and from the airport without the use of personal or ride sharing vehicles. Reagan National has been served by the Washington, D.C. Metrorail for many years, and in 2018, 4 million people used the train to access the airport. Currently, there is no Metrorail access to Dulles International, but service is scheduled to begin in 2021. Until the extension of Metrorail is completed, express bus shuttle access to Dulles International is available from various locations in the Metropolitan D.C. area. The Authority provides our employees with subsidized public transit passes to encourage alternative forms of commuting to work. Currently, approximately 160 of our employees have been issued such passes. Reagan National is also unique in that it is very close to a growing urban population which allows for foot, bike, and scooter access as well.
43
See Hedgpeth, Dana. “’It’s a waste of time’: Washington is No. 3 in traffic congestion, study says,” Washington Post. August 22, 2019. https://www.washingtonpost.com/local/trafficandcommuting/its-a-waste-of-time-washington-is-no-3-in-traffic-congestion-study-says/2019/08/22/e6602e0e-c4d6-11e9-b72f-b31dfaa77212_story.html (Accessed June 10, 2020).
49
Metrics to Measure Success
Public transit access to our airports is one category of our Sustainability Plan where we have certain clearly defined metrics to measure over time. Metrorail ridership is clearly one such metric. In addition, the number of subsidized passes we issue to employees and as important, how often they are used is another metric we can consider monitoring, if feasible. Measuring non-vehicle access to Reagan National is somewhat more difficult to quantify. A potential early initiative of the Sustainability Committee will be to evaluate the value of and options for measuring this non-vehicle access. Potential options could include monitoring pathway counts at key intersections, abundance of alternative transportation vehicles parked at the terminal (i.e. bikes and scooters), and/or surveys.
Existing Activities and Opportunities for Increasing Utilization
Washington Metropolitan Area Transit Authority (WMATA) Metrorail Service
As noted, over 4 million people used the Washington, D.C. Metrorail service in 2018 to go to and from Reagan National and we will look for ways to increase that number in years ahead.44 Promotional campaigns in partnership with WMATA and other activities which drive ridership higher will be explored in the coming years. Just as exciting is the scheduled completion of the Metrorail’s Silver Line to Dulles International in 2021. The Authority is currently overseeing the construction of this line and we look forward to partnering with WMATA in outreach to airline passengers and airport employees to encourage them to travel to Dulles International via the Metro to cut down on low-occupancy vehicle use and associated emissions. Currently, public transit options to Dulles International are available by express bus shuttles. Our expectation is that upon the launch of Metrorail service, ridership numbers for the express buses would decline. We also expect that Metrorail access to Dulles International will result in more of our Dulles-based employees taking advantage of our subsidized public transit passes as we would like to see the number of users grow well beyond the current number of 160.
Non-Vehicle Access to Reagan National
When it comes to non-motorized access to airports, the Authority is fortunate that Reagan National is likely one of most accessible large airports in the United States by foot. From Crystal City, Virginia, home to many hotels, offices, and apartment complexes, it is less than 1.5 miles to the airport. Crystal City is also home to Amazon’s new East Coast headquarters, where hundreds of new jobs are being created. In addition to walking, bike and scooter access to the airport is also easy with popular bike path access nearby. To encourage more of this non-motorized access to Reagan, there are many things we will be considering as we move forward with our Sustainability Plan implementation. For example, we intend to assess our options in some of the following areas:
Completion of non-vehicle access counts for key locations to establish baseline usage
Providing secure facilities to lock bicycles and scooters
Improving the lighting and security features along the path and tunnels connecting the airport to nearby communities to enhance safety and accessibility
44
COVID-19 has led to an unprecedented reduction in Metrorail ridership. Regaining ridership levels approaching the 4 million level from 2018 might take several years. As a result, ridership metrics may be modified to reflect revised baselines to be established over the coming years of recovery.
50
Installation of charging infrastructure for e-bikes and e-scooters (subject to demand and cost)
Offering washroom facilities so airport customers and employees can shower before heading to work or boarding their flight
Summary
Sustainable airport access is an area of the Sustainability Plan that builds off our existing strengths with existing Metrorail service to one our airports (Reagan National) and pending service to the other (Dulles International). The growth of our neighbor, Crystal City, also creates a positive dynamic by putting Reagan National close to thousands of potential airport customers and employees. While the current COVID-19 crisis creates significant near-term challenges to public transit use, we hope current low ridership levels are temporary and we are excited to participate in the challenge of reinvigorating Metrorail usage.
51
Greenhouse Gas Emissions Inventory A GHG emissions inventory is one of the key baseline analyses that will help inform our activities under the Sustainability Plan. According to the International Civil Aviation Organization, 4.8 billion passengers flew on scheduled commercial flights in 2018 in addition to 58 million tons of freight.45 However, along with these impressive numbers comes the detrimental environmental impacts of airline flight, including the significant emissions of heat-trapping, global GHGs, including CO2. The aviation industry was responsible for approximately 2.4% of global CO2 emissions in 2018.46 Accounting for additional airline flight impacts (i.e., contrails, other GHG emissions, etc.), the industry’s total contribution to global emissions approaches 5%.47 The aviation industry in the United States is responsible for upwards of 20–25% of this global amount. According to the EPA, the aviation industry in the United States accounts for 3% of total national GHG emissions and 12% of emissions by the transportation sector in general.48
While the airlines that operate these aircraft are responsible for their emissions, many of our peers in the U.S. airport industry are already tracking GHG emissions both inside and outside their operational control boundary. Of those, many have established emissions reductions targets, and a few have even achieved carbon neutrality. While many of the investments described throughout this Sustainability Plan will result in lower GHG emissions, up until now, the Authority has not completed a comprehensive GHG inventory. However, as part of our focus on sustainability, we recently commissioned a GHG inventory to establish a baseline for what are called Scope 1 and Scope 2 emissions. These categories are defined under what is known as the Greenhouse Gas Protocol49 and they can be summarized as follows:
Scope 1 emissions occur directly from sources that are owned or controlled by the Authority. Our Scope 1 emissions are primarily the use of natural gas for space and water heating, our diesel and CNG bus fleets, the PTVs at Dulles International, our vehicle fleet, diesel GPUs and PCA units, diesel generators, propane use, and refrigerants.
Scope 2 emissions occur indirectly from the production of the electricity which the Authority purchases from Dominion Energy to power our on-site operations.
Scope 3 emissions occur indirectly because of the activities of the Authority but occur from sources outside of our boundary of ownership and control. The primary source of Scope 3 emissions for any airport are those generated by airline jet fuel use. However, other sources include the electricity and natural gas used by our tenants, the offsite disposal of our garbage, private transportation used by our employees and customers to get to and from the airport, and hotel shuttles.
With this first inventory, our initial focus is upon the emissions we can influence (Scopes 1 and 2), and then encouraging and supporting our tenants in their pursuit of Scope 3 emission reductions. With an
45
International Civil Aviation Organization, “The World of Air Transport in 2018.” Accessed June 10, 2020. https://www.icao.int/annual-report-2018/Pages/the-world-of-air-transport-in-2018.aspx 46
Environmental and Energy Study Institute, “Fact Sheet: The Growth in Greenhouse Gas Emissions from Commercial Aviation.” Accessed June 10, 2020. https://www.eesi.org/papers/view/fact-sheet-the-growth-in-greenhouse-gas-emissions-from-commercial-aviation. 47
Ibid. 48
EPA, “Regulations for Greenhouse Gas Emissions from Aircraft.” Accessed June 10, 2020. https://www.epa.gov/regulations-emissions-vehicles-and-engines/regulations-greenhouse-gas-emissions-aircraft. 49
Greenhouse Gas Protocol, “We set the standards to measure and manage emissions.” Accessed June 10, 2020. https://ghgprotocol.org/.
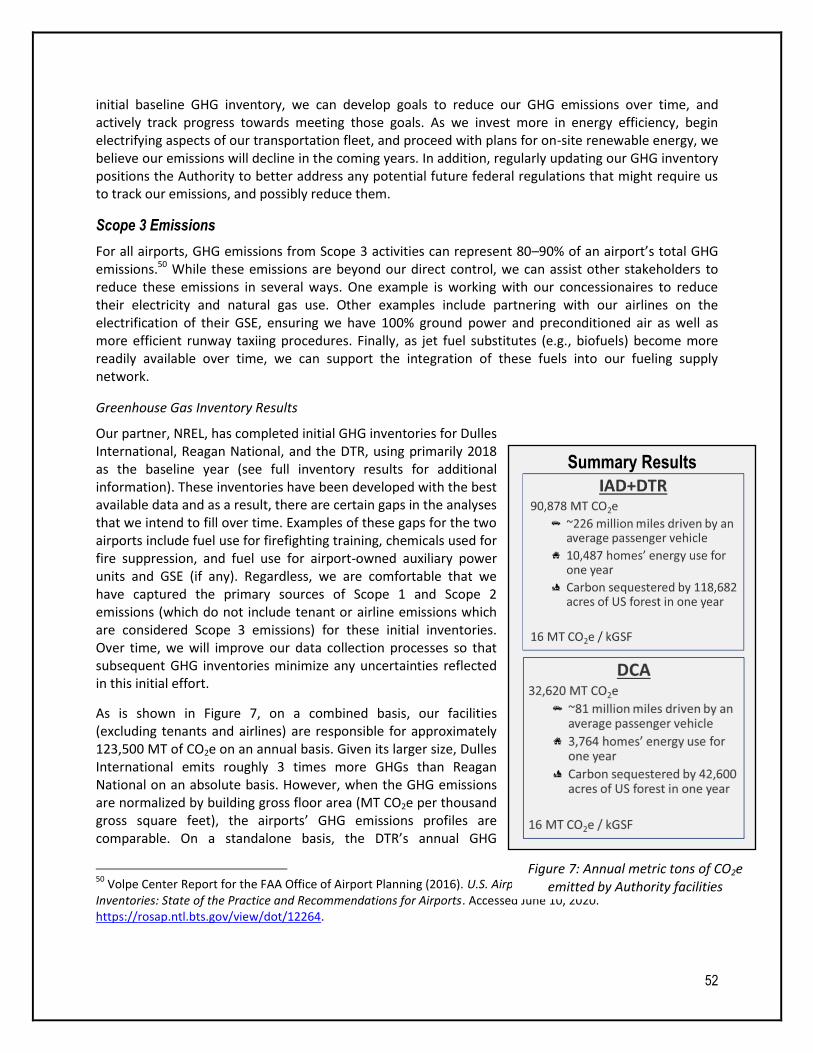
52
initial baseline GHG inventory, we can develop goals to reduce our GHG emissions over time, and actively track progress towards meeting those goals. As we invest more in energy efficiency, begin electrifying aspects of our transportation fleet, and proceed with plans for on-site renewable energy, we believe our emissions will decline in the coming years. In addition, regularly updating our GHG inventory positions the Authority to better address any potential future federal regulations that might require us to track our emissions, and possibly reduce them.
Scope 3 Emissions
For all airports, GHG emissions from Scope 3 activities can represent 80–90% of an airport’s total GHG emissions.50 While these emissions are beyond our direct control, we can assist other stakeholders to reduce these emissions in several ways. One example is working with our concessionaires to reduce their electricity and natural gas use. Other examples include partnering with our airlines on the electrification of their GSE, ensuring we have 100% ground power and preconditioned air as well as more efficient runway taxiing procedures. Finally, as jet fuel substitutes (e.g., biofuels) become more readily available over time, we can support the integration of these fuels into our fueling supply network.
Greenhouse Gas Inventory Results
Our partner, NREL, has completed initial GHG inventories for Dulles International, Reagan National, and the DTR, using primarily 2018 as the baseline year (see full inventory results for additional information). These inventories have been developed with the best available data and as a result, there are certain gaps in the analyses that we intend to fill over time. Examples of these gaps for the two airports include fuel use for firefighting training, chemicals used for fire suppression, and fuel use for airport-owned auxiliary power units and GSE (if any). Regardless, we are comfortable that we have captured the primary sources of Scope 1 and Scope 2 emissions (which do not include tenant or airline emissions which are considered Scope 3 emissions) for these initial inventories. Over time, we will improve our data collection processes so that subsequent GHG inventories minimize any uncertainties reflected in this initial effort.
As is shown in Figure 7, on a combined basis, our facilities (excluding tenants and airlines) are responsible for approximately 123,500 MT of CO2e on an annual basis. Given its larger size, Dulles International emits roughly 3 times more GHGs than Reagan National on an absolute basis. However, when the GHG emissions are normalized by building gross floor area (MT CO2e per thousand gross square feet), the airports’ GHG emissions profiles are comparable. On a standalone basis, the DTR’s annual GHG
50
Volpe Center Report for the FAA Office of Airport Planning (2016). U.S. Airport Greenhouse Gas Emissions Inventories: State of the Practice and Recommendations for Airports. Accessed June 10, 2020. https://rosap.ntl.bts.gov/view/dot/12264.
Summary Results
Figure 7: Annual metric tons of CO2e emitted by Authority facilities
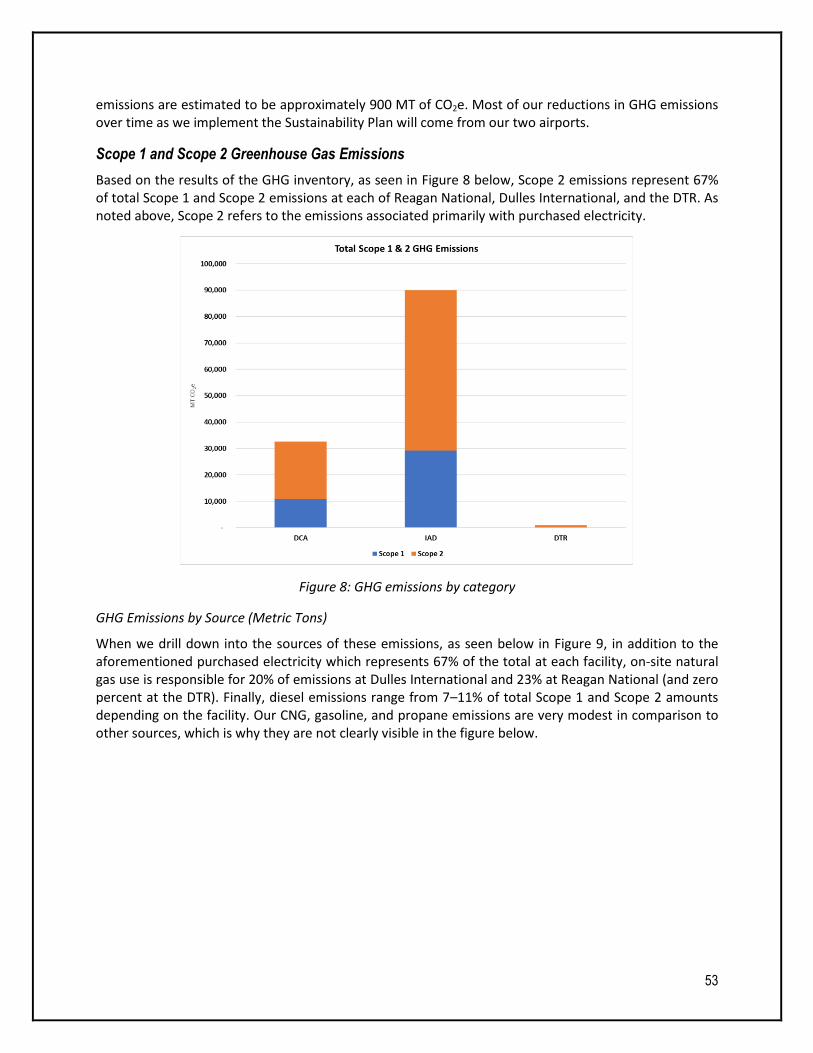
53
emissions are estimated to be approximately 900 MT of CO2e. Most of our reductions in GHG emissions over time as we implement the Sustainability Plan will come from our two airports.
Scope 1 and Scope 2 Greenhouse Gas Emissions
Based on the results of the GHG inventory, as seen in Figure 8 below, Scope 2 emissions represent 67% of total Scope 1 and Scope 2 emissions at each of Reagan National, Dulles International, and the DTR. As noted above, Scope 2 refers to the emissions associated primarily with purchased electricity.
Figure 8: GHG emissions by category
GHG Emissions by Source (Metric Tons)
When we drill down into the sources of these emissions, as seen below in Figure 9, in addition to the aforementioned purchased electricity which represents 67% of the total at each facility, on-site natural gas use is responsible for 20% of emissions at Dulles International and 23% at Reagan National (and zero percent at the DTR). Finally, diesel emissions range from 7–11% of total Scope 1 and Scope 2 amounts depending on the facility. Our CNG, gasoline, and propane emissions are very modest in comparison to other sources, which is why they are not clearly visible in the figure below.
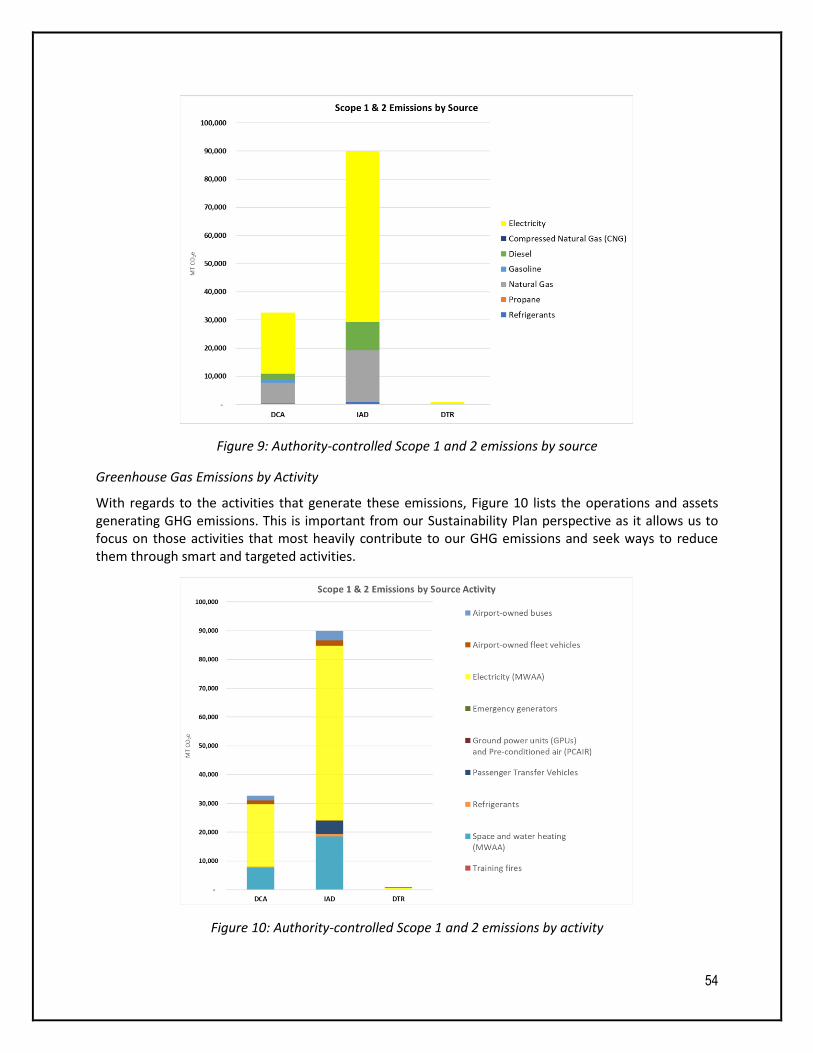
54
Figure 9: Authority-controlled Scope 1 and 2 emissions by source
Greenhouse Gas Emissions by Activity
With regards to the activities that generate these emissions, Figure 10 lists the operations and assets generating GHG emissions. This is important from our Sustainability Plan perspective as it allows us to focus on those activities that most heavily contribute to our GHG emissions and seek ways to reduce them through smart and targeted activities.
Figure 10: Authority-controlled Scope 1 and 2 emissions by activity
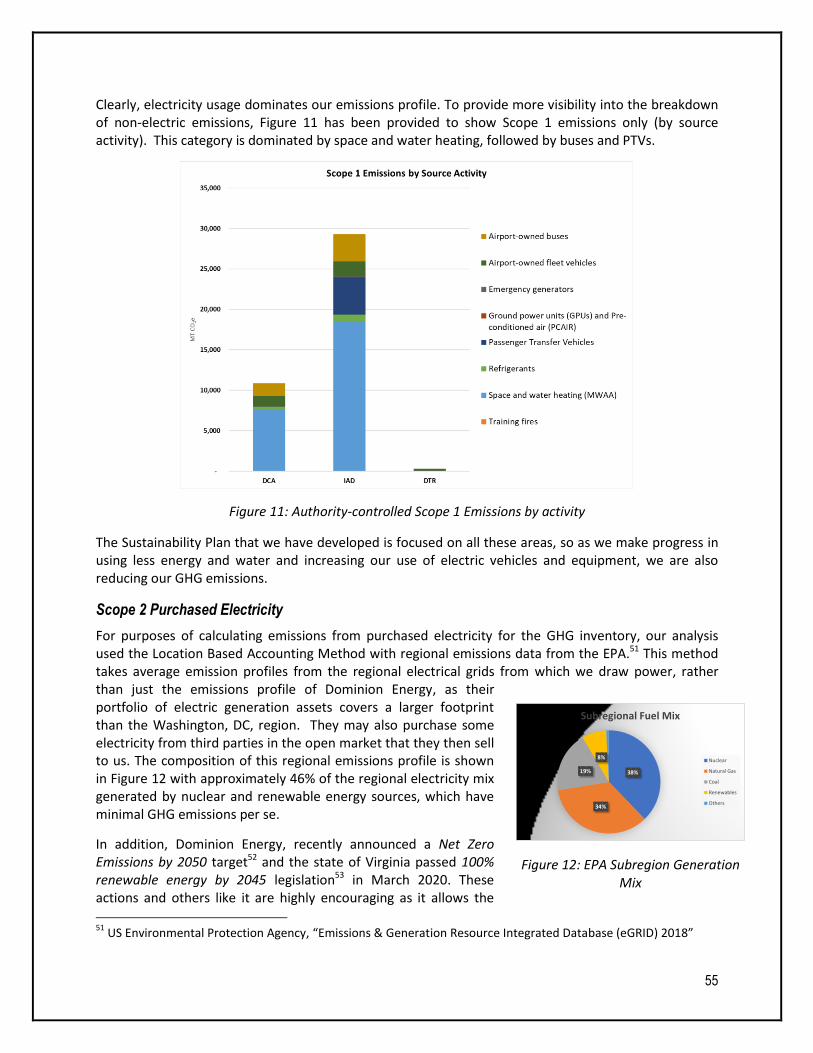
55
Clearly, electricity usage dominates our emissions profile. To provide more visibility into the breakdown of non-electric emissions, Figure 11 has been provided to show Scope 1 emissions only (by source activity). This category is dominated by space and water heating, followed by buses and PTVs.
Figure 11: Authority-controlled Scope 1 Emissions by activity
The Sustainability Plan that we have developed is focused on all these areas, so as we make progress in using less energy and water and increasing our use of electric vehicles and equipment, we are also reducing our GHG emissions.
Scope 2 Purchased Electricity
For purposes of calculating emissions from purchased electricity for the GHG inventory, our analysis used the Location Based Accounting Method with regional emissions data from the EPA.51 This method takes average emission profiles from the regional electrical grids from which we draw power, rather than just the emissions profile of Dominion Energy, as their portfolio of electric generation assets covers a larger footprint than the Washington, DC, region. They may also purchase some electricity from third parties in the open market that they then sell to us. The composition of this regional emissions profile is shown in Figure 12 with approximately 46% of the regional electricity mix generated by nuclear and renewable energy sources, which have minimal GHG emissions per se.
In addition, Dominion Energy, recently announced a Net Zero Emissions by 2050 target52 and the state of Virginia passed 100% renewable energy by 2045 legislation53 in March 2020. These actions and others like it are highly encouraging as it allows the
51
US Environmental Protection Agency, “Emissions & Generation Resource Integrated Database (eGRID) 2018”
Figure 12: EPA Subregion Generation Mix
38%
34%
19%
8%
Subregional Fuel Mix
Nuclear
Natural Gas
Coal
Renewables
Others
56
Authority to focus on reducing Scope 1 and 3 emissions through energy efficiency and electrification, while parallel efforts by others are focused on actions that will reduce our Scope 2 emissions.
Summary
One can consider our GHG Inventory as a performance tracking tool for the progress we make (or do not make) in the implementation of our Sustainability Plan. For example, as we meet our goals of reducing diesel fuel use and operating our facilities more efficiently, we hope to generate material reductions in our GHG emissions over time as well. Converting from diesel to electric transportation systems transfers higher-emitting Scope 1 activities (e.g., combusting diesel on-site) to lower-emitting Scope 2 activities (i.e., purchased electricity). As these Scope 2-related activities themselves gradually become less GHG intensive, the net benefit to the Authority and our GHG emissions profile is positive. With our first GHG inventory now complete, we intend to regularly update it to measure our progress and to make summary information available to the public.
52
See Dominion Energy, “4Q 2019 Earnings Conference Call Slide Presentation.” Accessed June 10, 2020. https://s2.q4cdn.com/510812146/files/doc_financials/2019/q4/2020-02-11-DE-IR-Q4-2019-earnings-call-slides-vTC-II.pdf. 53
See Virginia General Assembly, “2020 Session: HB 1526 Electric utility regulation; environmental goals.” Accessed June 10, 2020. https://lis.virginia.gov/cgi-bin/legp604.exe?201+sum+HB1526.
57
Resiliency Improve resiliency through committed partnerships, intentional system operations, and diversification.
Resiliency in the Context of Sustainability
In today’s world where weather-related events can wreak havoc on airline schedules, cybercrimes can shut down networks, and electricity outages can paralyze airports, we are constantly investing in our infrastructure, operations, and people to make our facilities more resilient. Throughout this report, a base assumption is an electrified future, from our bus fleet to our ground service equipment, and even planes in the longer-term. Our operations are shifting as technologies mature and the costs associated with alternative energy sources continue to decline. Additionally, on the customer side, we will see continued growth in electronic and electric vehicles usage. These technologies require additional electrical infrastructure at our facilities to deliver energy from a wire rather than a pipeline. As industry trends towards electrification, this shift supports our air quality, GHG emissions, and life cycle cost goals, but also creates a potential vulnerability related to disruptions in our electricity supply, particularly as our energy sources become less redundant.
As we evaluate the options to electrify our operations, we will do so responsibly, planning for the low-probability, high-risk potential of a commercial power outage. What this means is that while we may migrate to an electric bus fleet, for example, we may continue to operate a certain number of diesel buses as back-ups. We will also remain vigilant about maintaining our back-up diesel generators should they be called on to support our critical operations during a power outage. It also means that as we evaluate the installation of a 100-MW solar farm at Dulles International during the next three years; working with our partners on that project to determine the feasibility of adding battery energy storage for resilience purposes to compliment the project’s primary goal of renewable energy generation while dedicating necessary energy delivery to our facilities in the event of a grid outage.
One of the exciting things we are doing in this area is conducting resilience assessments at our facilities with our partner, NREL. This project was initiated in 2020 and an outline of the activities is as follows:
Using the NREL resilience assessment methodology, we will work together to score threats and vulnerabilities, along with impacts and likelihoods of occurrence. Threat identification can include natural, human, and technological threats and hazards, and areas of impact will be determined by the assessment teams based on areas of control or collaboration. This assessment will also take into consideration the activities we are incorporating throughout the rest of this Sustainability Plan and the growing reliance on electricity usage
After the risk assessment has been conducted and a ranking of these risks has been established, NREL will provide a list of potential mitigation measures for consideration
The Authority will thoughtfully review the list of potential mitigation measures and select those which most improve our resilience while supporting other goals such as sustainability and economic responsibility
We will then develop an action plan for implementation to mitigate risks. Mitigation measures could be operational in nature (such as O&M improvements, or procedures, practices, and trainings that will enhance resilience), institutional (such as improving access to real-time data for improved system management, enhancing operational intelligence, or engaging stakeholders through planning processes to solicit ideas and gain buy-in on new processes to develop a culture of resilience), and technological (such as microgrids, diesel generators, onsite renewable
58
energy systems, systems with black-start capabilities, thermal storage, battery energy storage systems (BESS), passive survivability and energy efficiency to reduce the need for power during an outage, diversifying heating fuels, or long-term planning in the form of comprehensive continuity of operations plans (COOPs))
As a result of this work, the Authority expects to be better positioned to face threats that have the
potential to jeopardize our ability to maintain and operate our facilities and ensure the safety of our
employees and customers. As we update this Sustainability Plan on an annual basis, we will report the
progress made on enhancing resilience.
59
Next Steps
With our first formal Sustainability Plan, the Authority is setting the foundation for a future in which
sustainable practices become part of the fabric of how we operate our facilities. Increasingly our
customers, employees, and airport partners expect that sustainability is a prominent consideration
when we invest in our infrastructure, operations, and people. Of course, we are completing this plan
during unprecedented times and so from an economic perspective, we will continue to be good
stewards of our resources and make decisions that are financially sound. As discussed in the document,
many of our most ambitious activities will rely on third party financial support and so we are realistic as
to how fast many elements of this plan can be implemented in the near term. Fortunately, the
Authority has been actively investing in sustainability for many years and so simply building off the
excellent work our staff is already doing in this area gives us momentum as we go forward. This plan
intends to reinforce current practices, whether it be glycol recovery or LED lighting retrofits, for
example, while setting new goals in the areas of transportation systems electrification to reduce diesel
and gasoline use; more efficient consumption of energy and water; reducing the generation of municipal
solid waste; promoting greater use of public transportation to access our airports; and deepening a
culture of sustainable administration. With the concurrent update of our Design Manual, we are also
adopting more stringent minimum construction standards and practices so that when we invest in major
renovations and new buildings and facilities, we are helping to ensure lower energy and water use for
the next several decades. Therefore, as we chart a path back to 50 million air travelers using our
airports each year, by executing on our Sustainability Plan, we will meet the needs of these travelers in a
more sustainable fashion.
APPENDIX A.2
2020 Corporate Social Responsibility Report

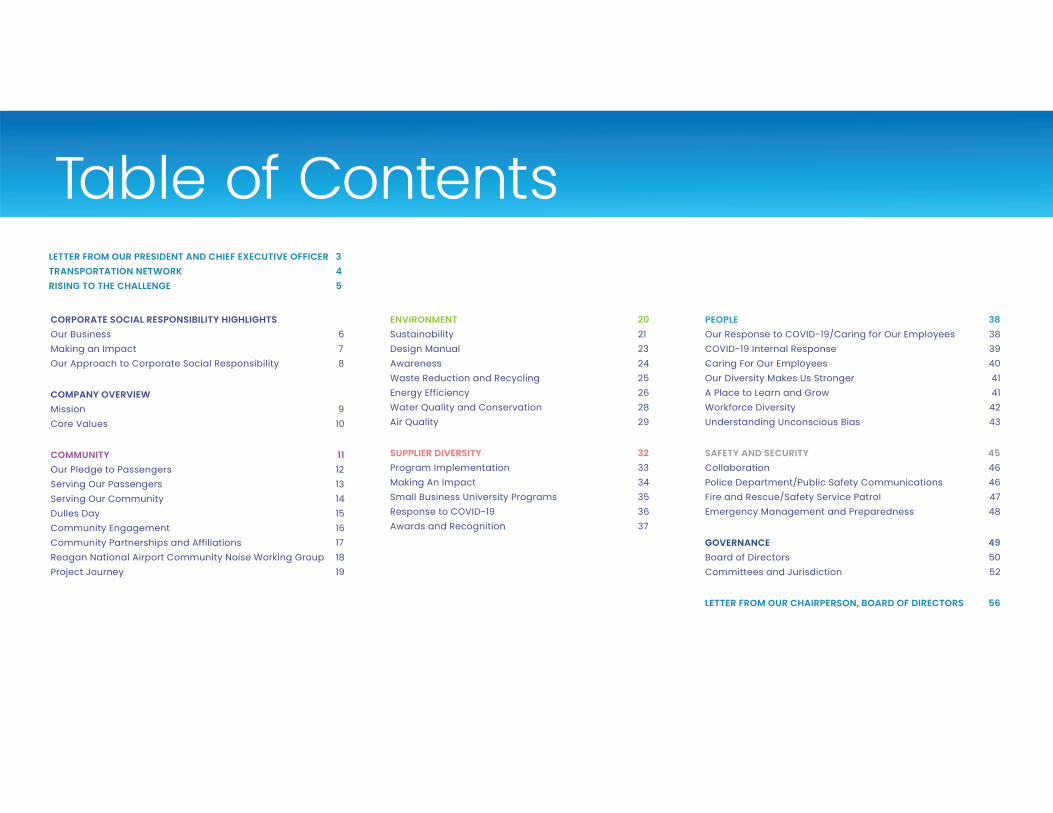
CORPORATE SOCIAL RESPONSIBILITY HIGHLIGHTS
Our Business 6
Making an Impact 7
Our Approach to Corporate Social Responsibility 8
COMPANY OVERVIEW
Mission 9
Core Values 10
COMMUNITY 11
Our Pledge to Passengers 12
Serving Our Passengers 13
Serving Our Community 14
Dulles Day 15
Community Engagement 16
Community Partnerships and Affiliations 17
Reagan National Airport Community Noise Working Group 18
Project Journey 19
ENVIRONMENT 20
Sustainability 21
Design Manual 23
Awareness 24
Waste Reduction and Recycling 25
Energy Efficiency 26
Water Quality and Conservation 28
Air Quality 29
SUPPLIER DIVERSITY 32
Program Implementation 33
Making An Impact 34
Small Business University Programs 35
Response to COVID-19 36
Awards and Recognition 37
Table of ContentsLETTER FROM OUR PRESIDENT AND CHIEF EXECUTIVE OFFICER 3
TRANSPORTATION NETWORK 4
RISING TO THE CHALLENGE 5
PEOPLE 38
Our Response to COVID-19/Caring for Our Employees 38
COVID-19 Internal Response 39
Caring For Our Employees 40
Our Diversity Makes Us Stronger 41
A Place to Learn and Grow 41
Workforce Diversity 42
Understanding Unconscious Bias 43
SAFETY AND SECURITY 45
Collaboration 46
Police Department/Public Safety Communications 46
Fire and Rescue/Safety Service Patrol 47
Emergency Management and Preparedness 48
GOVERNANCE 49
Board of Directors 50
Committees and Jurisdiction 52
LETTER FROM OUR CHAIRPERSON, BOARD OF DIRECTORS 56
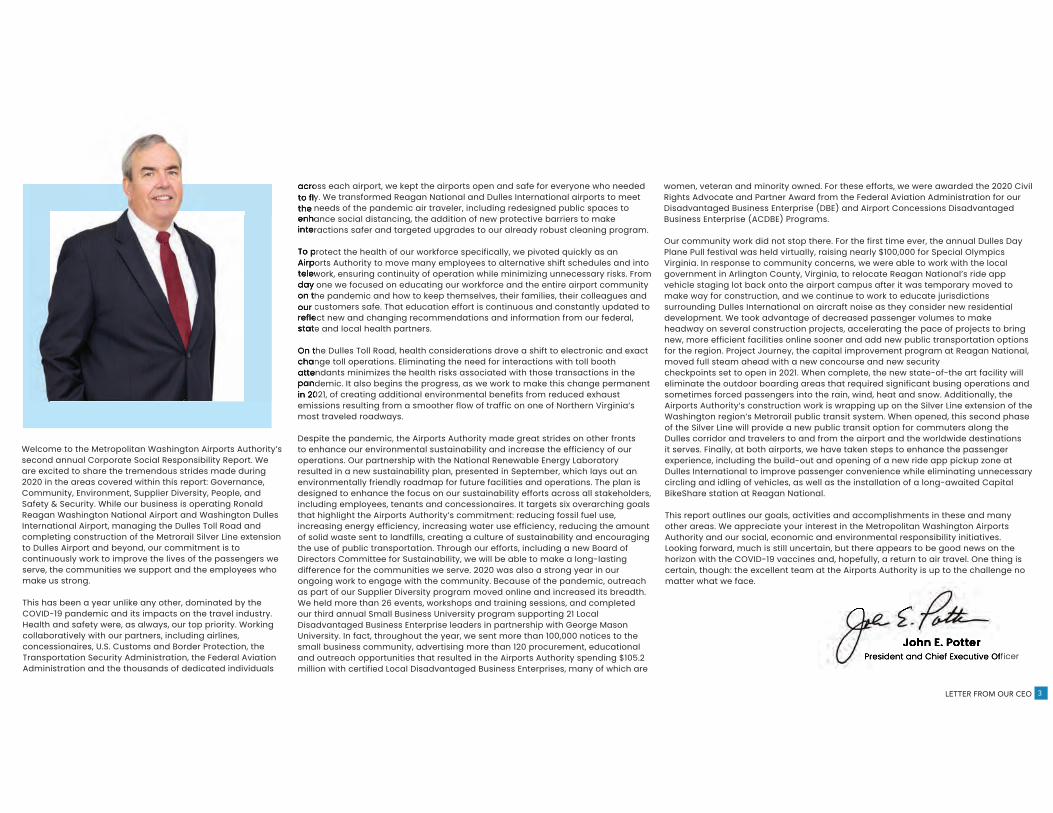
Welcome to the Metropolitan Washington Airports Authority’s second annual Corporate Social Responsibility Report. We are excited to share the tremendous strides made during 2020 in the areas covered within this report: Governance, Community, Environment, Supplier Diversity, People, and Safety & Security. While our business is operating Ronald Reagan Washington National Airport and Washington Dulles International Airport, managing the Dulles Toll Road and completing construction of the Metrorail Silver Line extension to Dulles Airport and beyond, our commitment is to continuously work to improve the lives of the passengers we serve, the communities we support and the employees who make us strong.
This has been a year unlike any other, dominated by the COVID-19 pandemic and its impacts on the travel industry. Health and safety were, as always, our top priority. Working collaboratively with our partners, including airlines, concessionaires, U.S. Customs and Border Protection, the Transportation Security Administration, the Federal Aviation Administration and the thousands of dedicated individuals
across each airport, we kept the airports open and safe for everyone who needed to fly. We transformed Reagan National and Dulles International airports to meet the needs of the pandemic air traveler, including redesigned public spaces to enhance social distancing, the addition of new protective barriers to make interactions safer and targeted upgrades to our already robust cleaning program.
To protect the health of our workforce specifically, we pivoted quickly as an Airports Authority to move many employees to alternative shift schedules and into telework, ensuring continuity of operation while minimizing unnecessary risks. From day one we focused on educating our workforce and the entire airport community on the pandemic and how to keep themselves, their families, their colleagues and our customers safe. That education effort is continuous and constantly updated to reflect new and changing recommendations and information from our federal, state and local health partners.
On the Dulles Toll Road, health considerations drove a shift to electronic and exact change toll operations. Eliminating the need for interactions with toll booth attendants minimizes the health risks associated with those transactions in the pandemic. It also begins the progress, as we work to make this change permanent in 2021, of creating additional environmental benefits from reduced exhaust emissions resulting from a smoother flow of traffic on one of Northern Virginia’s most traveled roadways.
Despite the pandemic, the Airports Authority made great strides on other fronts to enhance our environmental sustainability and increase the efficiency of our operations. Our partnership with the National Renewable Energy Laboratory resulted in a new sustainability plan, presented in September, which lays out an environmentally friendly roadmap for future facilities and operations. The plan is designed to enhance the focus on our sustainability efforts across all stakeholders, including employees, tenants and concessionaires. It targets six overarching goals that highlight the Airports Authority’s commitment: reducing fossil fuel use, increasing energy efficiency, increasing water use efficiency, reducing the amount of solid waste sent to landfills, creating a culture of sustainability and encouraging the use of public transportation. Through our efforts, including a new Board of Directors Committee for Sustainability, we will be able to make a long-lasting difference for the communities we serve. 2020 was also a strong year in our ongoing work to engage with the community. Because of the pandemic, outreach as part of our Supplier Diversity program moved online and increased its breadth. We held more than 26 events, workshops and training sessions, and completed our third annual Small Business University program supporting 21 Local Disadvantaged Business Enterprise leaders in partnership with George Mason University. In fact, throughout the year, we sent more than 100,000 notices to the small business community, advertising more than 120 procurement, educational and outreach opportunities that resulted in the Airports Authority spending $105.2 million with certified Local Disadvantaged Business Enterprises, many of which are
women, veteran and minority owned. For these efforts, we were awarded the 2020 Civil Rights Advocate and Partner Award from the Federal Aviation Administration for our Disadvantaged Business Enterprise (DBE) and Airport Concessions Disadvantaged Business Enterprise (ACDBE) Programs.
Our community work did not stop there. For the first time ever, the annual Dulles Day Plane Pull festival was held virtually, raising nearly $100,000 for Special Olympics Virginia. In response to community concerns, we were able to work with the local government in Arlington County, Virginia, to relocate Reagan National’s ride app vehicle staging lot back onto the airport campus after it was temporary moved to make way for construction, and we continue to work to educate jurisdictions surrounding Dulles International on aircraft noise as they consider new residential development. We took advantage of decreased passenger volumes to make headway on several construction projects, accelerating the pace of projects to bring new, more efficient facilities online sooner and add new public transportation options for the region. Project Journey, the capital improvement program at Reagan National, moved full steam ahead with a new concourse and new security checkpoints set to open in 2021. When complete, the new state-of-the art facility will eliminate the outdoor boarding areas that required significant busing operations and sometimes forced passengers into the rain, wind, heat and snow. Additionally, the Airports Authority’s construction work is wrapping up on the Silver Line extension of the Washington region’s Metrorail public transit system. When opened, this second phase of the Silver Line will provide a new public transit option for commuters along the Dulles corridor and travelers to and from the airport and the worldwide destinations it serves. Finally, at both airports, we have taken steps to enhance the passenger experience, including the build-out and opening of a new ride app pickup zone at Dulles International to improve passenger convenience while eliminating unnecessary circling and idling of vehicles, as well as the installation of a long-awaited Capital BikeShare station at Reagan National.
This report outlines our goals, activities and accomplishments in these and many other areas. We appreciate your interest in the Metropolitan Washington Airports Authority and our social, economic and environmental responsibility initiatives. Looking forward, much is still uncertain, but there appears to be good news on the horizon with the COVID-19 vaccines and, hopefully, a return to air travel. One thing is certain, though: the excellent team at the Airports Authority is up to the challenge no matter what we face.
John E. PotterPresident and Chief Executive Officer
LETTER FROM OUR CEO 3

Corporate Social Responsibility Report | Table of Contents 3TRANSPORTATION NETWORK 4
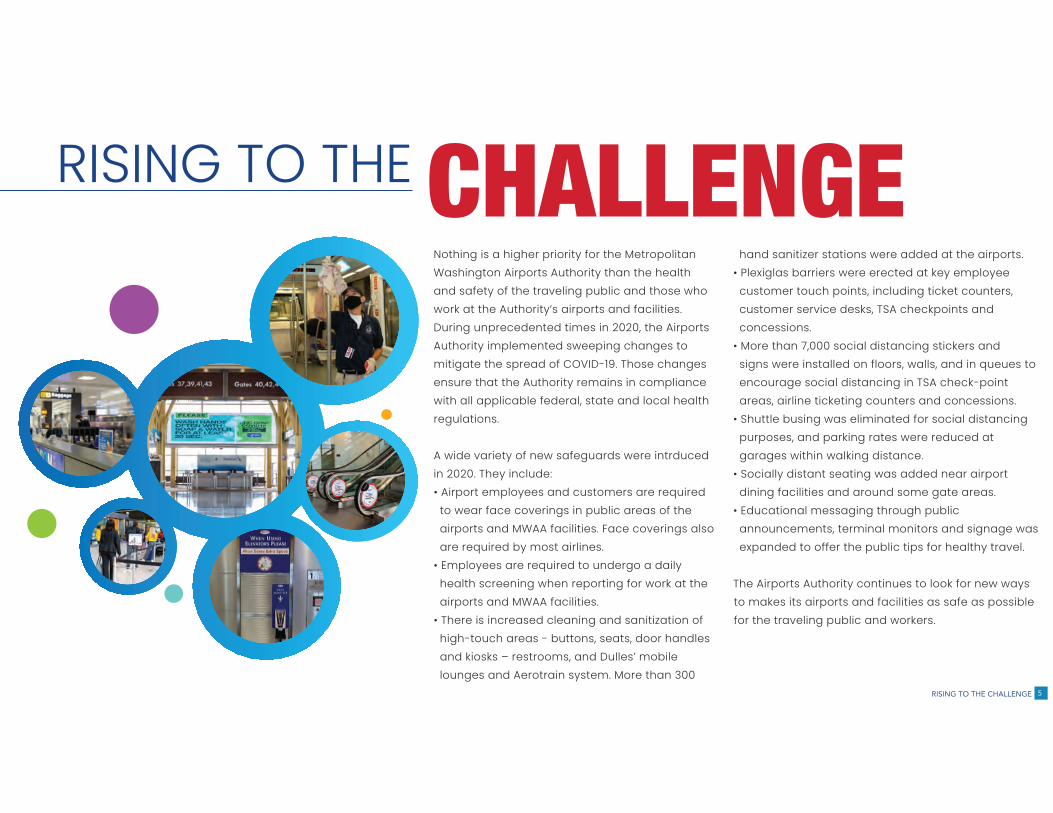
Nothing is a higher priority for the Metropolitan
Washington Airports Authority than the health
and safety of the traveling public and those who
work at the Authority’s airports and facilities.
During unprecedented times in 2020, the Airports
Authority implemented sweeping changes to
mitigate the spread of COVID-19. Those changes
ensure that the Authority remains in compliance
with all applicable federal, state and local health
regulations.
A wide variety of new safeguards were intrduced
in 2020. They include:
• Airport employees and customers are required
to wear face coverings in public areas of the
airports and MWAA facilities. Face coverings also
are required by most airlines.
• Employees are required to undergo a daily
health screening when reporting for work at the
airports and MWAA facilities.
• There is increased cleaning and sanitization of
high-touch areas - buttons, seats, door handles
and kiosks – restrooms, and Dulles’ mobile
lounges and Aerotrain system. More than 300
hand sanitizer stations were added at the airports.
• Plexiglas barriers were erected at key employee
customer touch points, including ticket counters,
customer service desks, TSA checkpoints and
concessions.
• More than 7,000 social distancing stickers and
signs were installed on floors, walls, and in queues to
encourage social distancing in TSA check-point
areas, airline ticketing counters and concessions.
• Shuttle busing was eliminated for social distancing
purposes, and parking rates were reduced at
garages within walking distance.
• Socially distant seating was added near airport
dining facilities and around some gate areas.
• Educational messaging through public
announcements, terminal monitors and signage was
expanded to offer the public tips for healthy travel.
The Airports Authority continues to look for new ways
to makes its airports and facilities as safe as possible
for the traveling public and workers.
CHALLENGERISING TO THE
RISING TO THE CHALLENGE 5
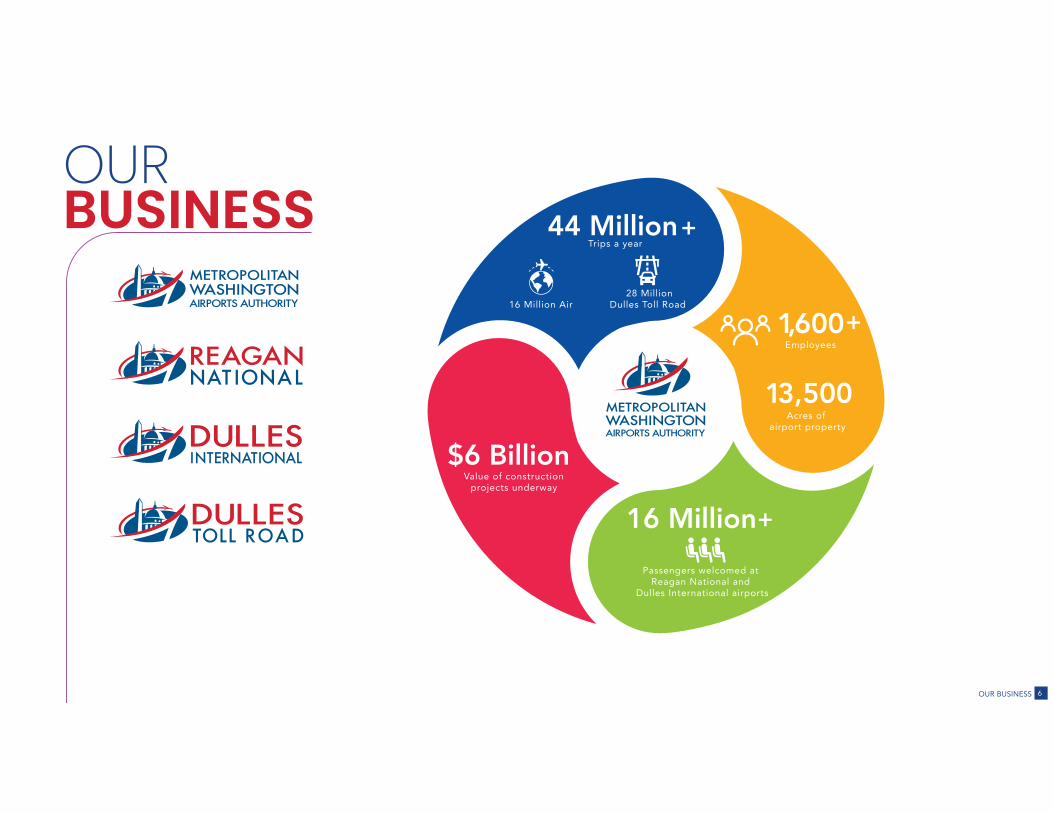
OUR
Trips a year 44 Million+
16 Million Air28 Million
Dulles Toll Road
Value of construction projects underway
$6 Billion
Passengers welcomed at Reagan National and
Dulles International airports
16 Million+
Employees
1,600+
13,500Acres of
airport property
BUSINESS
OUR BUSINESS 6
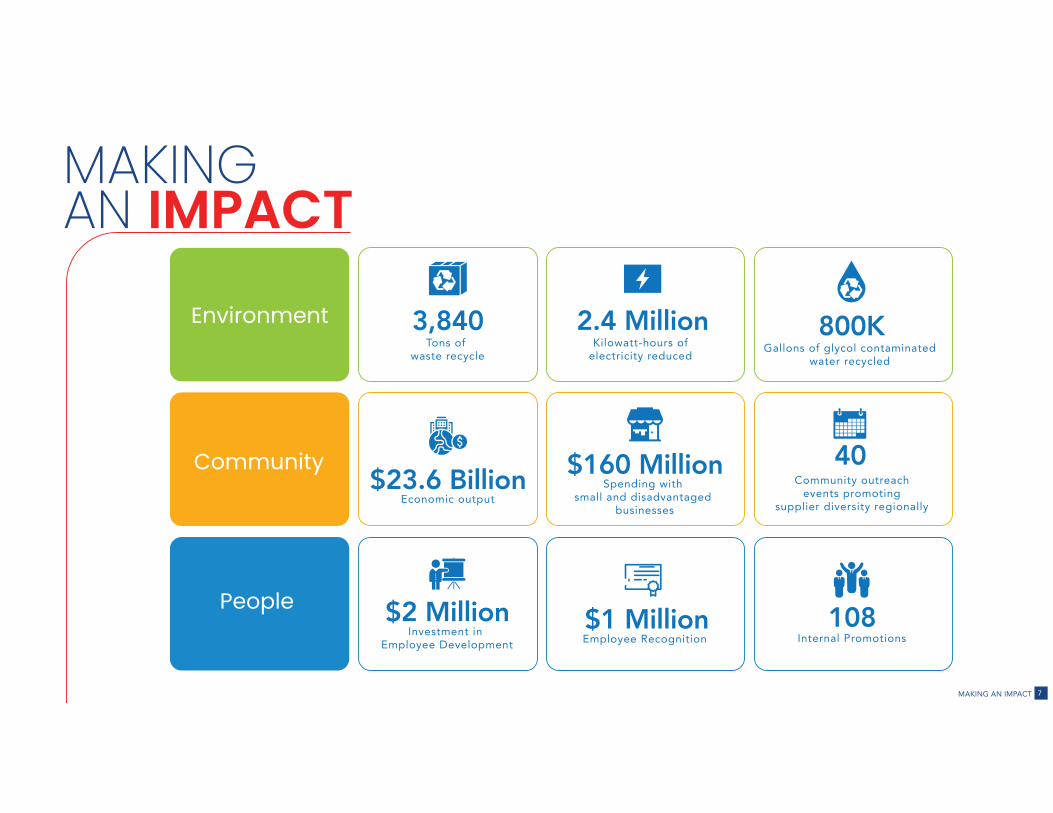
3,840Tons of
waste recycle
2.4 MillionKilowatt-hours of
electricity reduced
800KGallons of glycol contaminated
water recycled
$23.6 BillionEconomic output
$160 MillionSpending with
small and disadvantaged businesses
40Community outreach
events promoting supplier diversity regionally
$2 MillionInvestment in
Employee Development
$1 MillionEmployee Recognition Internal Promotions
108
Environment
People
Community
MAKINGAN IMPACT
MAKING AN IMPACT 7
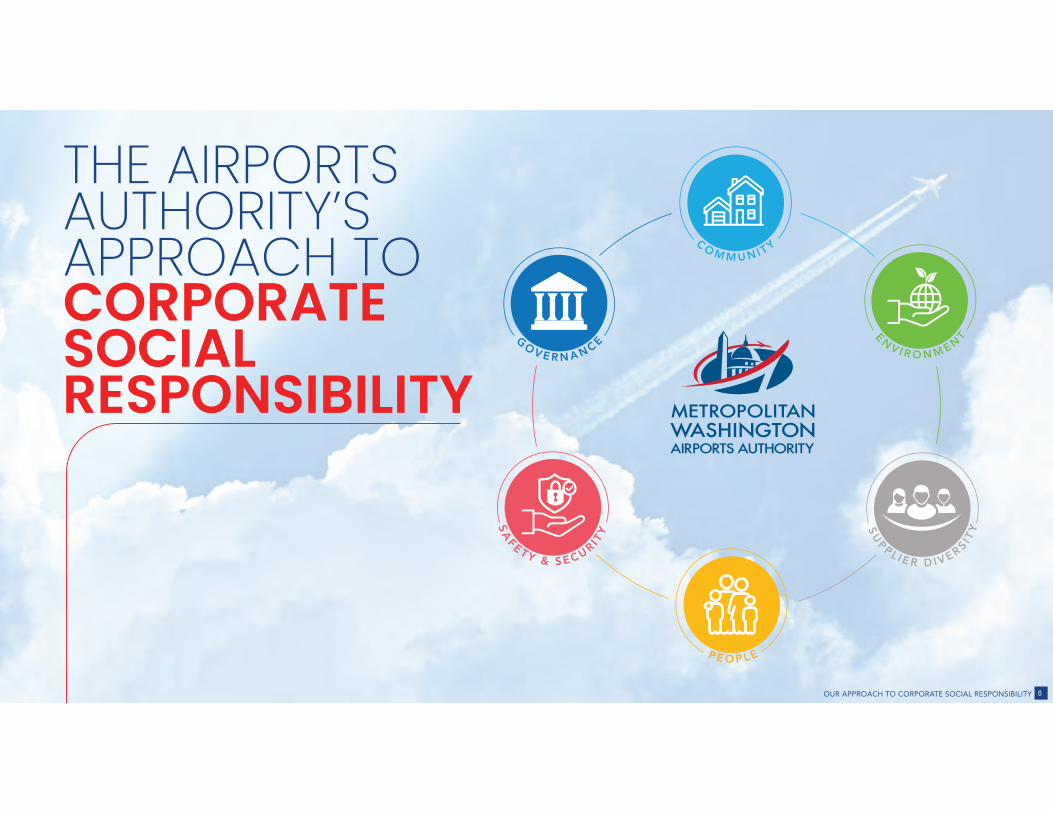
THE AIRPORTS
CORPORATE
SU
P P L I E R D I V E R S I TY
C O M M U N I TY
E
N V I R O N M E N
TGO V E R N A N CE
P E O P L E
SA
F E T Y & S E C U R I TY
SOCIALRESPONSIBILITY
AUTHORITY’SAPPROACH TO
OUR APPROACH TO CORPORATE SOCIAL RESPONSIBILITY 8
MISSIONThe Authority's mission is to develop, promote and operate safely Reagan National and Dulles International airports, continually striving to improve our efficiency, customer orientation and the level of air service offered at National and Dulles. We will be the best managed airports in the United States.
MISSION 9

CORE VALUES
COLLABORATION
Working togetherwithin and across
our functions to give our very best.
PRIDE
Proud of ourorganization
and everything ‘we’ do.
MUTUALRESPECT
Treating everyone fairly and embracing
diversity.
INTEGRITY
Doing what we saywe will do.
The Authority’s commitment to excellence is reflected in its four core values:
CORE VALUES 10
Serving the community and supporting local organizations are critical parts of the Airports
Authority’s commitment to the National Capital Region. The Authority’s employees
participate in a wide variety of events and organizations that support and strengthen
local communities in Virginia, the District of Columbia and Maryland. The goal is to facilitate
a corporate culture that encourages and takes pride in a wide range of efforts to embrace
diversity and promote the common good.
COMMUNITY
COMMUNITY 11
Community
Our Pledge to Passengers
The Metropolitan Washington
Airports Authority pledges to:
• Serve the traveling public
• Provide a safe, predictable,
enjoyable travel experience
• Continuously improve customer
service, convenience,
innovation and engagement
• Always be advocates for our
passengers with all entities
affecting their journey
COMMUNITY 12
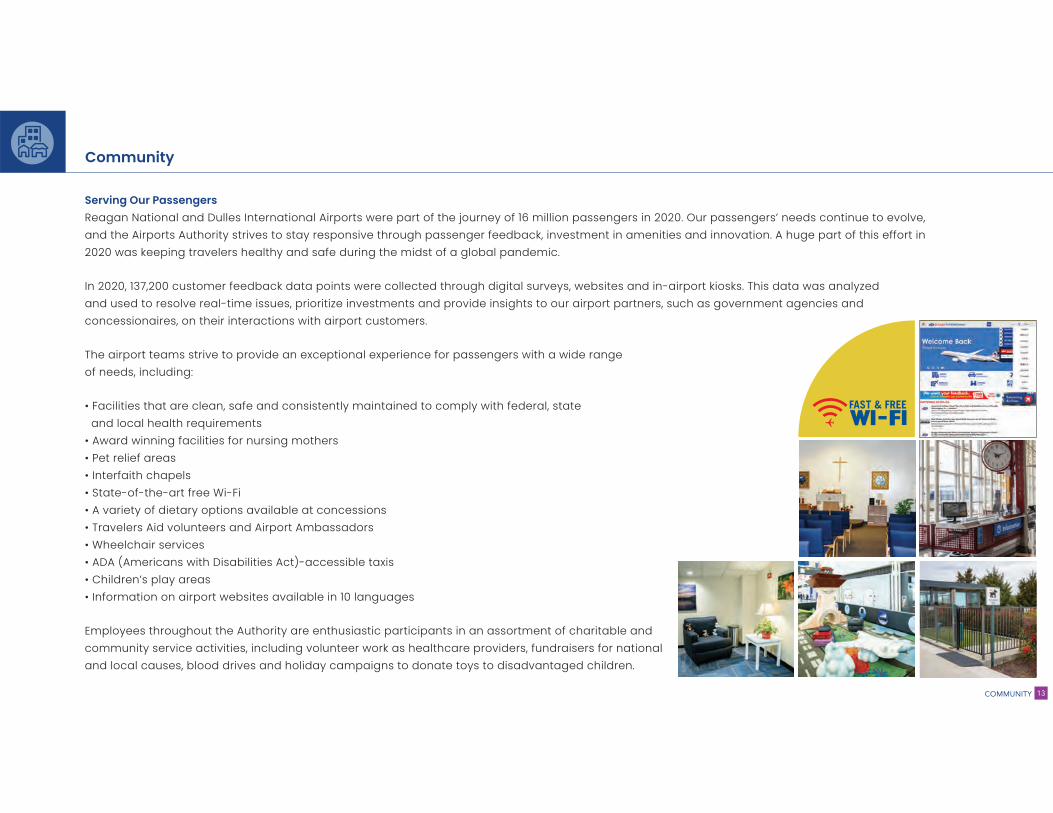
Serving Our Passengers
Reagan National and Dulles International Airports were part of the journey of 16 million passengers in 2020. Our passengers’ needs continue to evolve,
and the Airports Authority strives to stay responsive through passenger feedback, investment in amenities and innovation. A huge part of this effort in
2020 was keeping travelers healthy and safe during the midst of a global pandemic.
In 2020, 137,200 customer feedback data points were collected through digital surveys, websites and in-airport kiosks. This data was analyzed
and used to resolve real-time issues, prioritize investments and provide insights to our airport partners, such as government agencies and
concessionaires, on their interactions with airport customers.
The airport teams strive to provide an exceptional experience for passengers with a wide range
of needs, including:
• Facilities that are clean, safe and consistently maintained to comply with federal, state
and local health requirements
• Award winning facilities for nursing mothers
• Pet relief areas
• Interfaith chapels
• State-of-the-art free Wi-Fi
• A variety of dietary options available at concessions
• Travelers Aid volunteers and Airport Ambassadors
• Wheelchair services
• ADA (Americans with Disabilities Act)-accessible taxis
• Children’s play areas
• Information on airport websites available in 10 languages
Employees throughout the Authority are enthusiastic participants in an assortment of charitable and
community service activities, including volunteer work as healthcare providers, fundraisers for national
and local causes, blood drives and holiday campaigns to donate toys to disadvantaged children.
Community
FAST & FREE
COMMUNITY 13
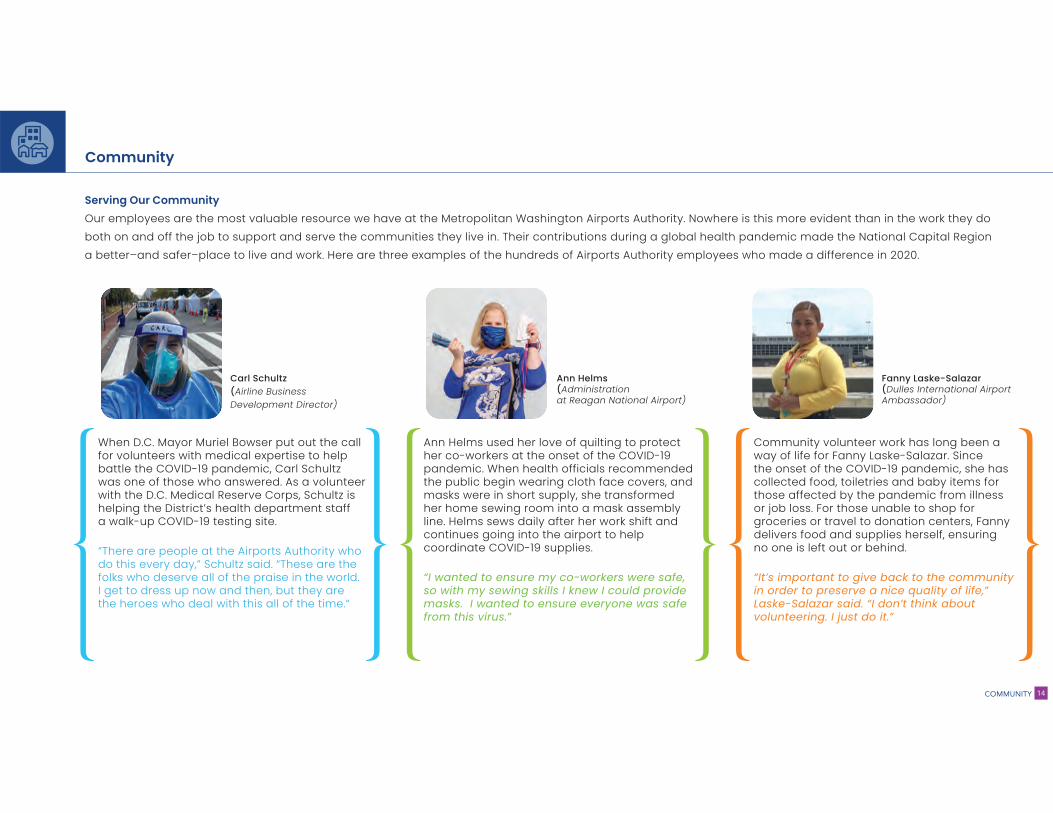
Community
Serving Our Community
Our employees are the most valuable resource we have at the Metropolitan Washington Airports Authority. Nowhere is this more evident than in the work they do
both on and off the job to support and serve the communities they live in. Their contributions during a global health pandemic made the National Capital Region
a better–and safer–place to live and work. Here are three examples of the hundreds of Airports Authority employees who made a difference in 2020.
Ann Helms used her love of quilting to protect her co-workers at the onset of the COVID-19 pandemic. When health officials recommended the public begin wearing cloth face covers, and masks were in short supply, she transformed her home sewing room into a mask assembly line. Helms sews daily after her work shift and continues going into the airport to help coordinate COVID-19 supplies.
“I wanted to ensure my co-workers were safe, so with my sewing skills I knew I could provide masks. I wanted to ensure everyone was safe from this virus.”
When D.C. Mayor Muriel Bowser put out the call for volunteers with medical expertise to help battle the COVID-19 pandemic, Carl Schultz was one of those who answered. As a volunteer with the D.C. Medical Reserve Corps, Schultz is helping the District’s health department staff a walk-up COVID-19 testing site.
“There are people at the Airports Authority who do this every day,” Schultz said. “These are the folks who deserve all of the praise in the world. I get to dress up now and then, but they are the heroes who deal with this all of the time.”
Community volunteer work has long been a way of life for Fanny Laske-Salazar. Since the onset of the COVID-19 pandemic, she has collected food, toiletries and baby items for those affected by the pandemic from illness or job loss. For those unable to shop for groceries or travel to donation centers, Fanny delivers food and supplies herself, ensuring no one is left out or behind.
“It’s important to give back to the community in order to preserve a nice quality of life,” Laske-Salazar said. “I don’t think about volunteering. I just do it.”
Carl Schultz (Airline Business Development Director)
Ann Helms (Administration at Reagan National Airport)
Fanny Laske-Salazar(Dulles International Airport Ambassador)
COMMUNITY 14
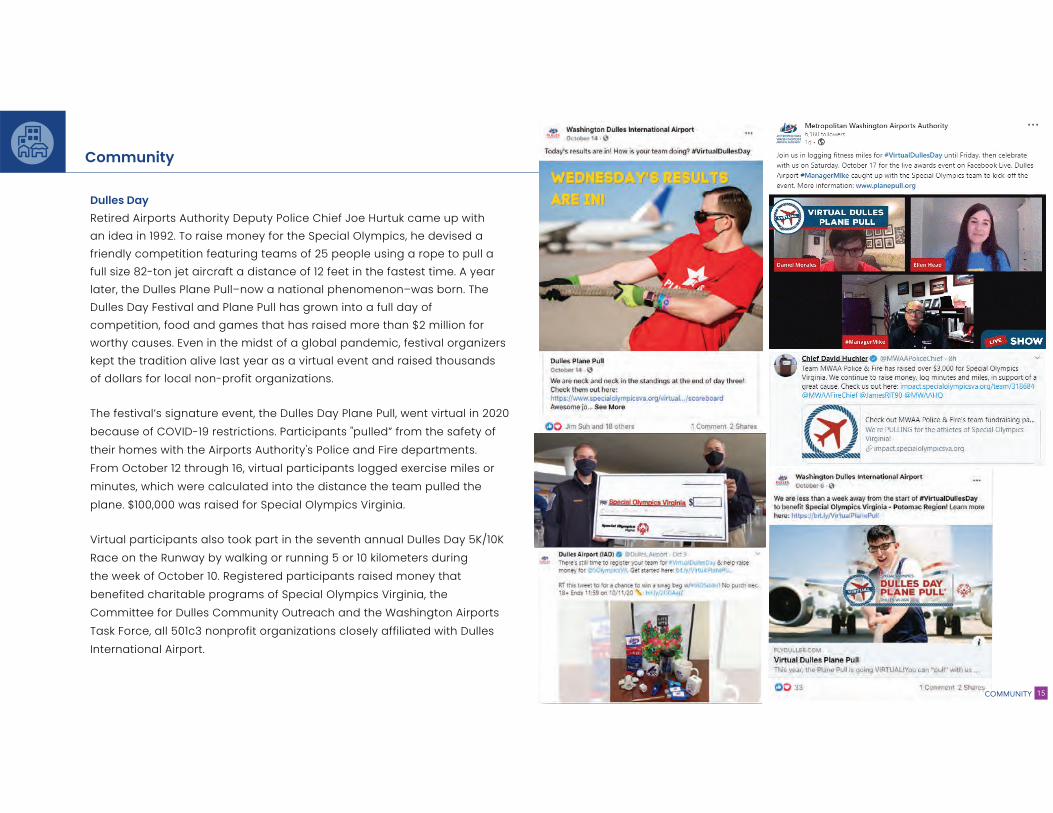
Dulles Day
Retired Airports Authority Deputy Police Chief Joe Hurtuk came up with
an idea in 1992. To raise money for the Special Olympics, he devised a
friendly competition featuring teams of 25 people using a rope to pull a
full size 82-ton jet aircraft a distance of 12 feet in the fastest time. A year
later, the Dulles Plane Pull–now a national phenomenon–was born. The
Dulles Day Festival and Plane Pull has grown into a full day of
competition, food and games that has raised more than $2 million for
worthy causes. Even in the midst of a global pandemic, festival organizers
kept the tradition alive last year as a virtual event and raised thousands
of dollars for local non-profit organizations.
The festival’s signature event, the Dulles Day Plane Pull, went virtual in 2020
because of COVID-19 restrictions. Participants "pulled” from the safety of
their homes with the Airports Authority's Police and Fire departments.
From October 12 through 16, virtual participants logged exercise miles or
minutes, which were calculated into the distance the team pulled the
plane. $100,000 was raised for Special Olympics Virginia.
Virtual participants also took part in the seventh annual Dulles Day 5K/10K
Race on the Runway by walking or running 5 or 10 kilometers during
the week of October 10. Registered participants raised money that
benefited charitable programs of Special Olympics Virginia, the
Committee for Dulles Community Outreach and the Washington Airports
Task Force, all 501c3 nonprofit organizations closely affiliated with Dulles
International Airport.
COMMUNITY 15
Community
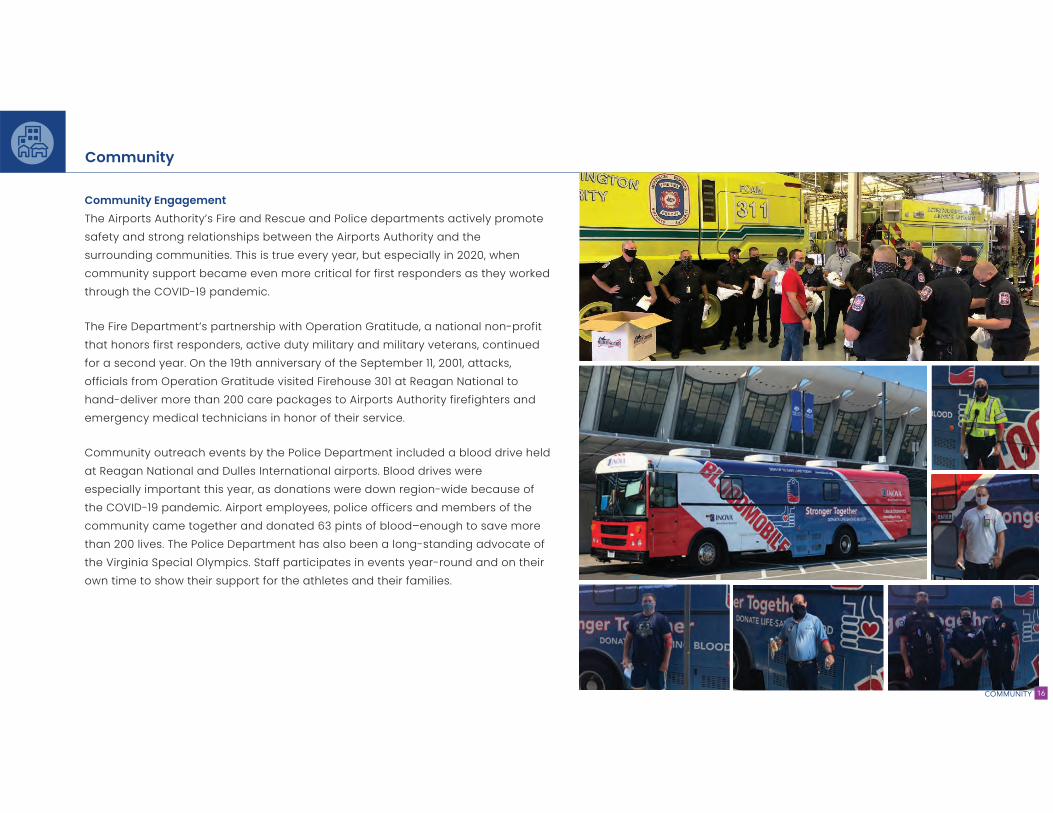
Community Engagement
The Airports Authority’s Fire and Rescue and Police departments actively promote
safety and strong relationships between the Airports Authority and the
surrounding communities. This is true every year, but especially in 2020, when
community support became even more critical for first responders as they worked
through the COVID-19 pandemic.
The Fire Department’s partnership with Operation Gratitude, a national non-profit
that honors first responders, active duty military and military veterans, continued
for a second year. On the 19th anniversary of the September 11, 2001, attacks,
officials from Operation Gratitude visited Firehouse 301 at Reagan National to
hand-deliver more than 200 care packages to Airports Authority firefighters and
emergency medical technicians in honor of their service.
Community outreach events by the Police Department included a blood drive held
at Reagan National and Dulles International airports. Blood drives were
especially important this year, as donations were down region-wide because of
the COVID-19 pandemic. Airport employees, police officers and members of the
community came together and donated 63 pints of blood–enough to save more
than 200 lives. The Police Department has also been a long-standing advocate of
the Virginia Special Olympics. Staff participates in events year-round and on their
own time to show their support for the athletes and their families.
Community
COMMUNITY 16

The Airports Authority is affiliated with dozens of business groups, chambers of commerce, civic organizations and trade associations to work on issues affecting the
Greater Capital Region. Along with the business community and state, federal and local governments, these groups are key partners in accomplishing our shared
goals for the future. The Airports Authority also is affiliated with business organizations representing ethnic communities across the region, including the Conference of
Minority Transportation Officials, and Black, Hispanic and Asian chambers of commerce.
Community Partnerships and Affiliations
Community
COMMUNITY 17
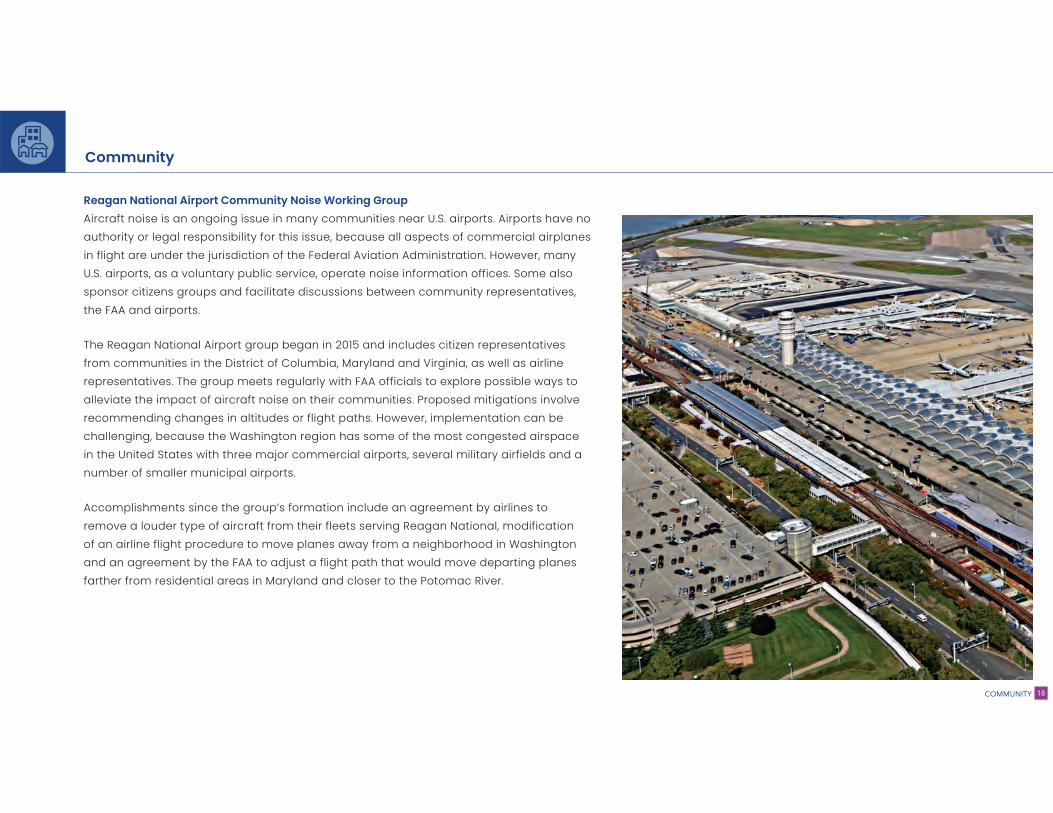
Reagan National Airport Community Noise Working Group
Aircraft noise is an ongoing issue in many communities near U.S. airports. Airports have no
authority or legal responsibility for this issue, because all aspects of commercial airplanes
in flight are under the jurisdiction of the Federal Aviation Administration. However, many
U.S. airports, as a voluntary public service, operate noise information offices. Some also
sponsor citizens groups and facilitate discussions between community representatives,
the FAA and airports.
The Reagan National Airport group began in 2015 and includes citizen representatives
from communities in the District of Columbia, Maryland and Virginia, as well as airline
representatives. The group meets regularly with FAA officials to explore possible ways to
alleviate the impact of aircraft noise on their communities. Proposed mitigations involve
recommending changes in altitudes or flight paths. However, implementation can be
challenging, because the Washington region has some of the most congested airspace
in the United States with three major commercial airports, several military airfields and a
number of smaller municipal airports.
Accomplishments since the group’s formation include an agreement by airlines to
remove a louder type of aircraft from their fleets serving Reagan National, modification
of an airline flight procedure to move planes away from a neighborhood in Washington
and an agreement by the FAA to adjust a flight path that would move departing planes
farther from residential areas in Maryland and closer to the Potomac River.
Community
COMMUNITY 18
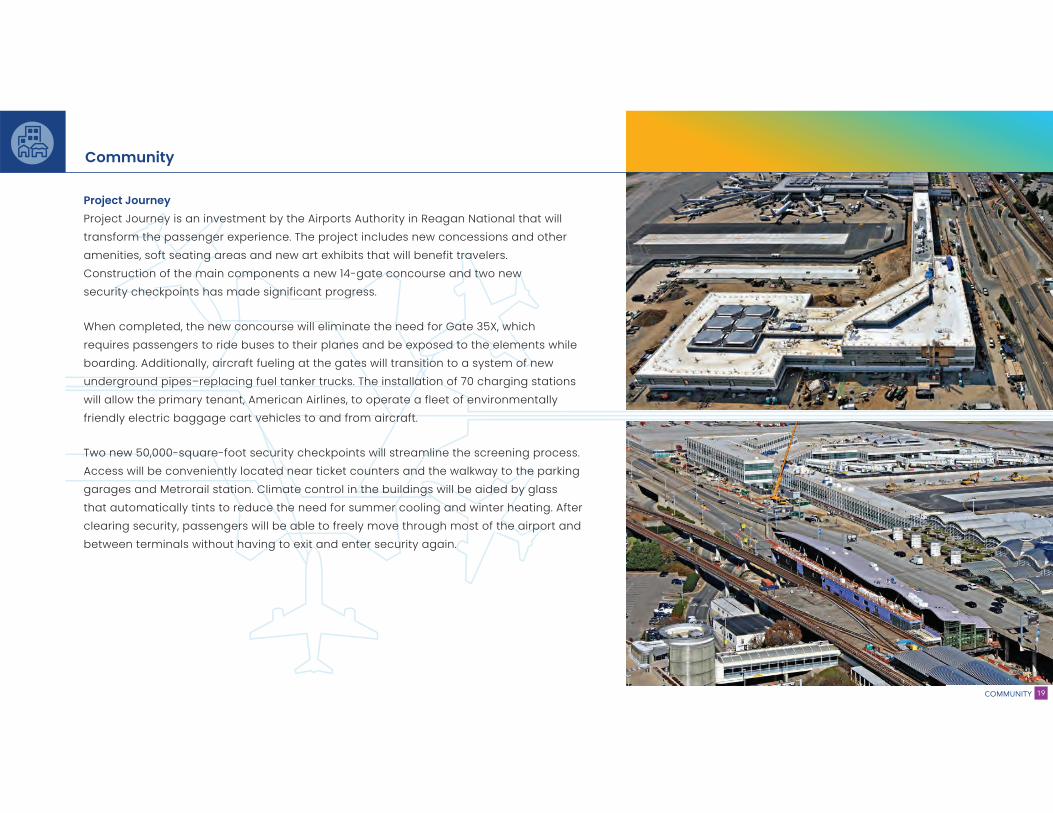
Project Journey
Project Journey is an investment by the Airports Authority in Reagan National that will
transform the passenger experience. The project includes new concessions and other
amenities, soft seating areas and new art exhibits that will benefit travelers.
Construction of the main components a new 14-gate concourse and two new
security checkpoints has made significant progress.
When completed, the new concourse will eliminate the need for Gate 35X, which
requires passengers to ride buses to their planes and be exposed to the elements while
boarding. Additionally, aircraft fueling at the gates will transition to a system of new
underground pipes–replacing fuel tanker trucks. The installation of 70 charging stations
will allow the primary tenant, American Airlines, to operate a fleet of environmentally
friendly electric baggage cart vehicles to and from aircraft.
Two new 50,000-square-foot security checkpoints will streamline the screening process.
Access will be conveniently located near ticket counters and the walkway to the parking
garages and Metrorail station. Climate control in the buildings will be aided by glass
that automatically tints to reduce the need for summer cooling and winter heating. After
clearing security, passengers will be able to freely move through most of the airport and
between terminals without having to exit and enter security again.
tion o
f e
c
de
ai
d d i
omponents a new 14-gate con
made significant progres
n
e
si
ati
e
er
having t
r
ble to freely move
ter secu
ld
mlin
nd
d
Two new 50,000 square
nt
t a
the
gs will be aided by
and winter h
ost of the airpo
rav
nd two new
r Gate 35X, w
posed to the eleme
of n
rney is an inve
m the passenge
ft seating a
ction of the m
rity checkpoints ha
ne
ur
n
e
t,
t v cr
wil
u
n the buildingd g
at
e
tio
e installa
iti
g p p p g
e
C
e t
e
xi
cu
ed
ma
e
ab
vehicles to and from aircraftv ra
pe
rse will elim
ne
es
he
c
Community
COMMUNITY 19
The Airports Authority remains committed to developing and implementing
sustainable business practices while providing world class transportation
facilities. The Authority has continued this commitment into 2020 by
streamlining the many existing sustainability initiatives into its first
Sustainability Plan. The Sustainability Plan is an integral step in weaving
sustainability into the fabric of Authority policies, procedures and operations.
The Authority understands the importance of the environment so that even
through the COVID-19 pandemic, we continue to advance and refine our
operations to be more sustainable.
ENVIRONMENT
ENVIRONMENT 20
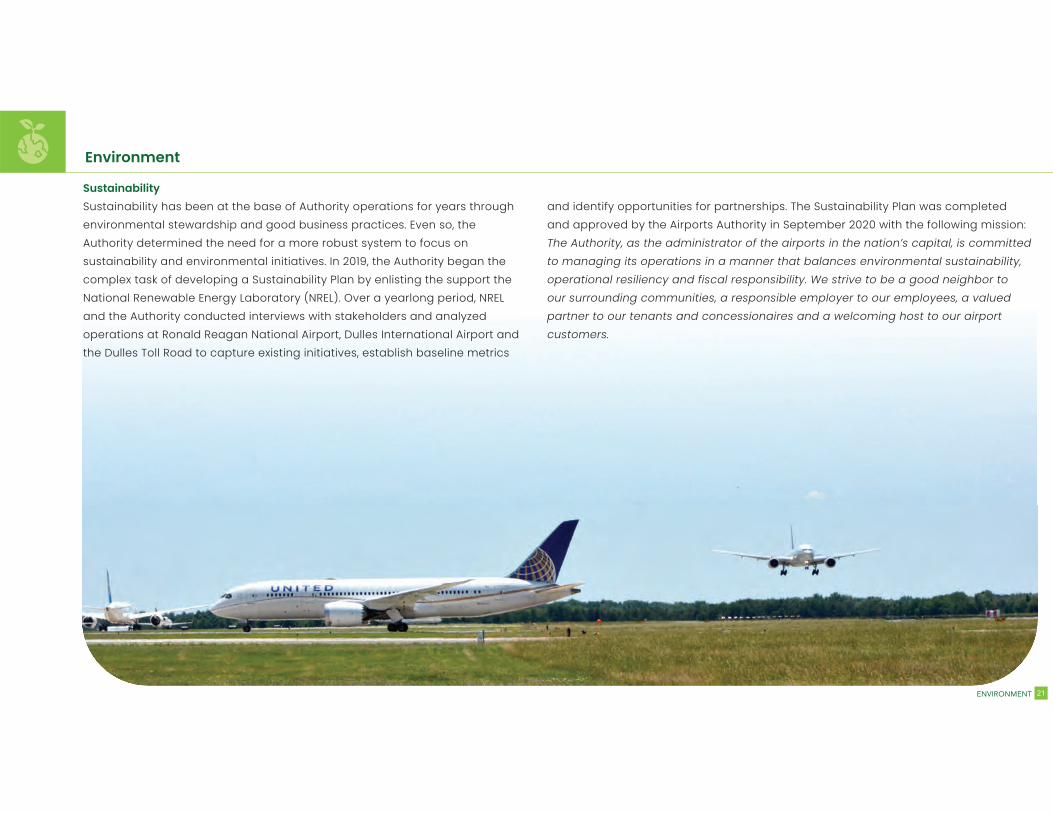
Sustainability
Sustainability has been at the base of Authority operations for years through
environmental stewardship and good business practices. Even so, the
Authority determined the need for a more robust system to focus on
sustainability and environmental initiatives. In 2019, the Authority began the
complex task of developing a Sustainability Plan by enlisting the support the
National Renewable Energy Laboratory (NREL). Over a yearlong period, NREL
and the Authority conducted interviews with stakeholders and analyzed
operations at Ronald Reagan National Airport, Dulles International Airport and
the Dulles Toll Road to capture existing initiatives, establish baseline metrics
Environment
and identify opportunities for partnerships. The Sustainability Plan was completed
and approved by the Airports Authority in September 2020 with the following mission:
The Authority, as the administrator of the airports in the nation’s capital, is committed
to managing its operations in a manner that balances environmental sustainability,
operational resiliency and fiscal responsibility. We strive to be a good neighbor to
our surrounding communities, a responsible employer to our employees, a valued
partner to our tenants and concessionaires and a welcoming host to our airport
customers.
ENVIRONMENT 21
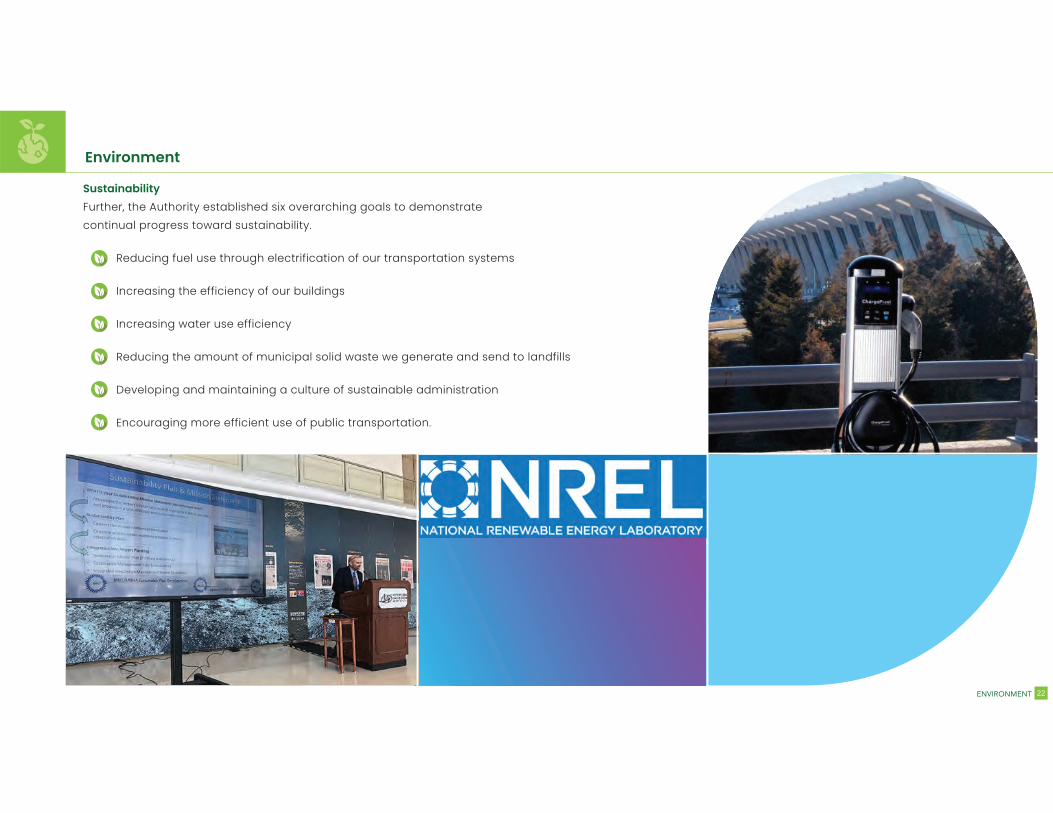
Sustainability
Further, the Authority established six overarching goals to demonstrate
continual progress toward sustainability.
Reducing fuel use through electrification of our transportation systems
Increasing the efficiency of our buildings
Increasing water use efficiency
Reducing the amount of municipal solid waste we generate and send to landfills
Developing and maintaining a culture of sustainable administration
Encouraging more efficient use of public transportation.
Environment
ENVIRONMENT 22
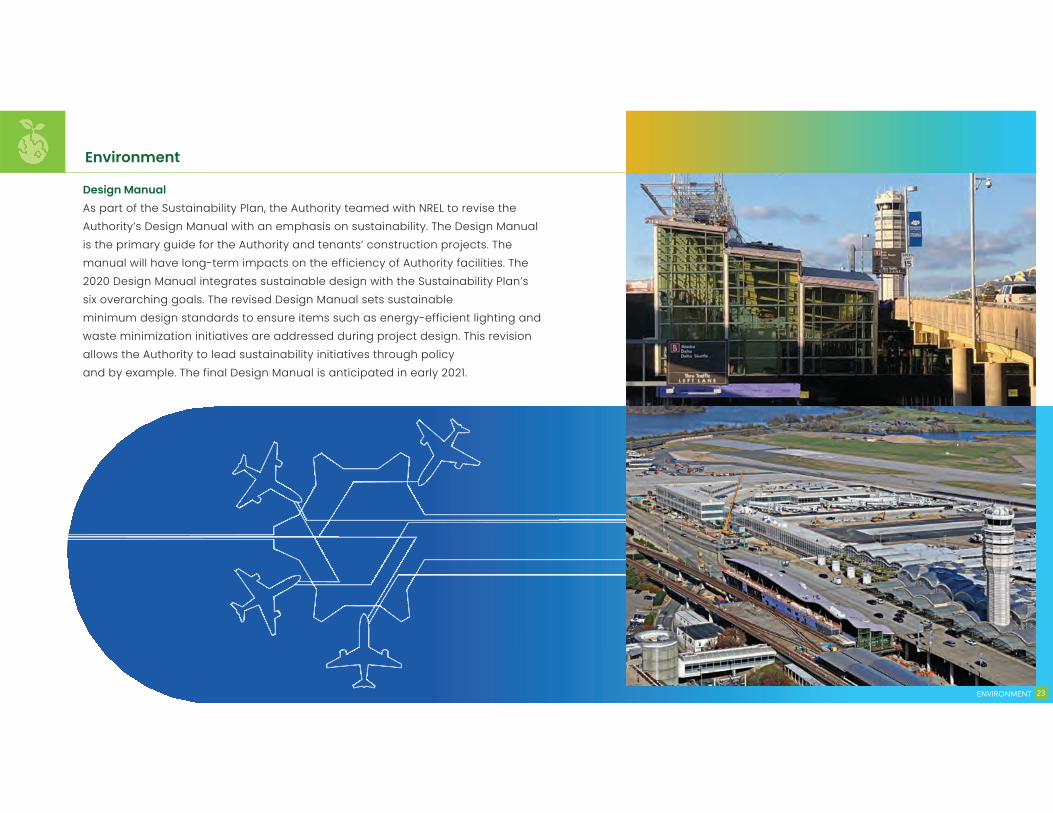
Design Manual
As part of the Sustainability Plan, the Authority teamed with NREL to revise the
Authority’s Design Manual with an emphasis on sustainability. The Design Manual
is the primary guide for the Authority and tenants’ construction projects. The
manual will have long-term impacts on the efficiency of Authority facilities. The
2020 Design Manual integrates sustainable design with the Sustainability Plan’s
six overarching goals. The revised Design Manual sets sustainable
minimum design standards to ensure items such as energy-efficient lighting and
waste minimization initiatives are addressed during project design. This revision
allows the Authority to lead sustainability initiatives through policy
and by example. The final Design Manual is anticipated in early 2021.
Environment
ENVIRONMENT 23
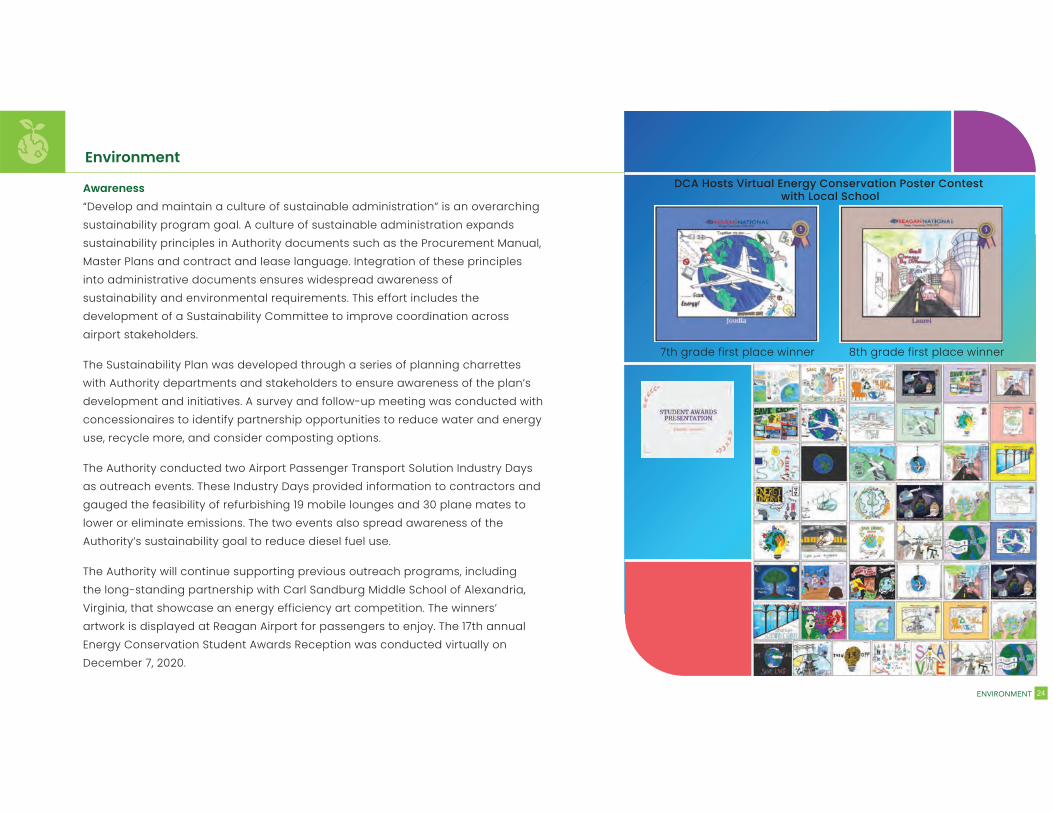
Environment
Awareness
“Develop and maintain a culture of sustainable administration” is an overarching
sustainability program goal. A culture of sustainable administration expands
sustainability principles in Authority documents such as the Procurement Manual,
Master Plans and contract and lease language. Integration of these principles
into administrative documents ensures widespread awareness of
sustainability and environmental requirements. This effort includes the
development of a Sustainability Committee to improve coordination across
airport stakeholders.
The Sustainability Plan was developed through a series of planning charrettes
with Authority departments and stakeholders to ensure awareness of the plan’s
development and initiatives. A survey and follow-up meeting was conducted with
concessionaires to identify partnership opportunities to reduce water and energy
use, recycle more, and consider composting options.
The Authority conducted two Airport Passenger Transport Solution Industry Days
as outreach events. These Industry Days provided information to contractors and
gauged the feasibility of refurbishing 19 mobile lounges and 30 plane mates to
lower or eliminate emissions. The two events also spread awareness of the
Authority’s sustainability goal to reduce diesel fuel use.
The Authority will continue supporting previous outreach programs, including
the long-standing partnership with Carl Sandburg Middle School of Alexandria,
Virginia, that showcase an energy efficiency art competition. The winners’
artwork is displayed at Reagan Airport for passengers to enjoy. The 17th annual
Energy Conservation Student Awards Reception was conducted virtually on
December 7, 2020.
ENVIRONMENT 24
7th grade first place winner 8th grade first place winner
DCA Hosts Virtual Energy Conservation Poster Contest with Local School
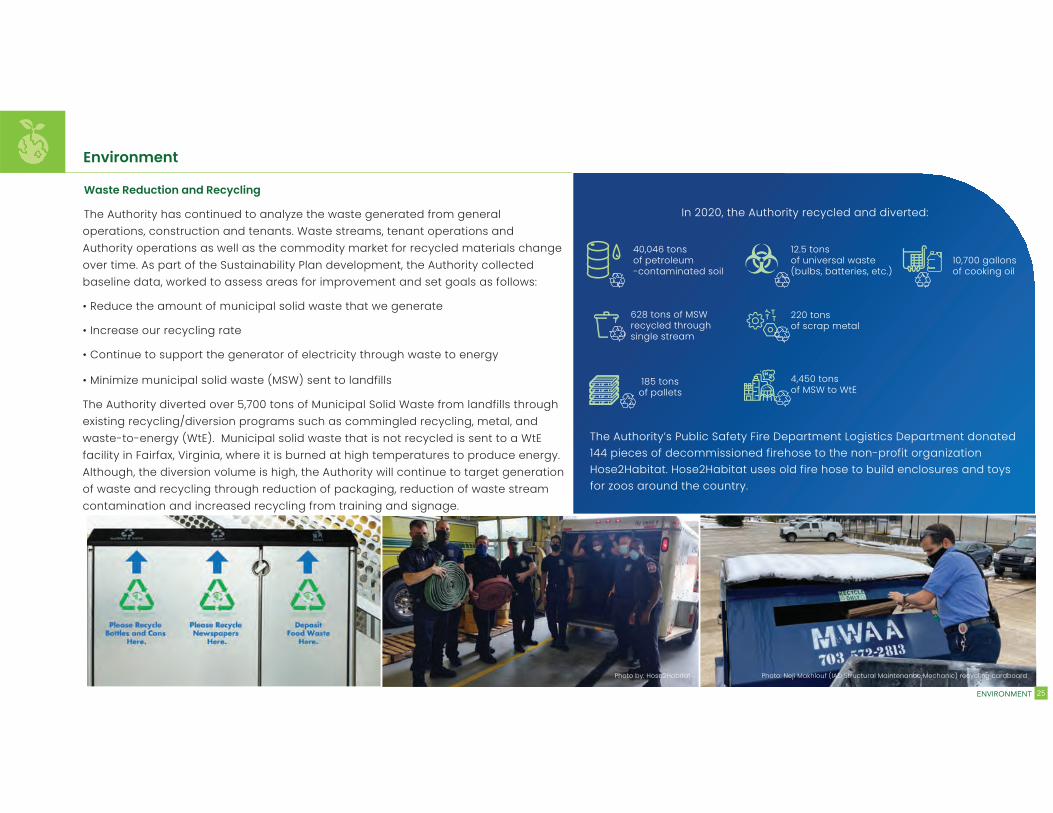
The Authority’s Public Safety Fire Department Logistics Department donated 144 pieces of decommissioned firehose to the non-profit organization Hose2Habitat. Hose2Habitat uses old fire hose to build enclosures and toys for zoos around the country.
Environment
In 2020, the Authority recycled and diverted:
10,700 gallons of cooking oil
40,046 tons of petroleum-contaminated soil
12.5 tons of universal waste (bulbs, batteries, etc.)
ENVIRONMENT 25
Waste Reduction and Recycling
The Authority has continued to analyze the waste generated from general
operations, construction and tenants. Waste streams, tenant operations and
Authority operations as well as the commodity market for recycled materials change
over time. As part of the Sustainability Plan development, the Authority collected
baseline data, worked to assess areas for improvement and set goals as follows:
• Reduce the amount of municipal solid waste that we generate
• Increase our recycling rate
• Continue to support the generator of electricity through waste to energy
• Minimize municipal solid waste (MSW) sent to landfills
The Authority diverted over 5,700 tons of Municipal Solid Waste from landfills through
existing recycling/diversion programs such as commingled recycling, metal, and
waste-to-energy (WtE). Municipal solid waste that is not recycled is sent to a WtE
facility in Fairfax, Virginia, where it is burned at high temperatures to produce energy.
Although, the diversion volume is high, the Authority will continue to target generation
of waste and recycling through reduction of packaging, reduction of waste stream
contamination and increased recycling from training and signage.
628 tons of MSW recycled through single stream
185 tons of pallets
220 tons of scrap metal
4,450 tons of MSW to WtE
Photo by: Hose2Habitat Photo: Neji Makhlouf (IAD Structural Maintenance Mechanic) recycling cardboard
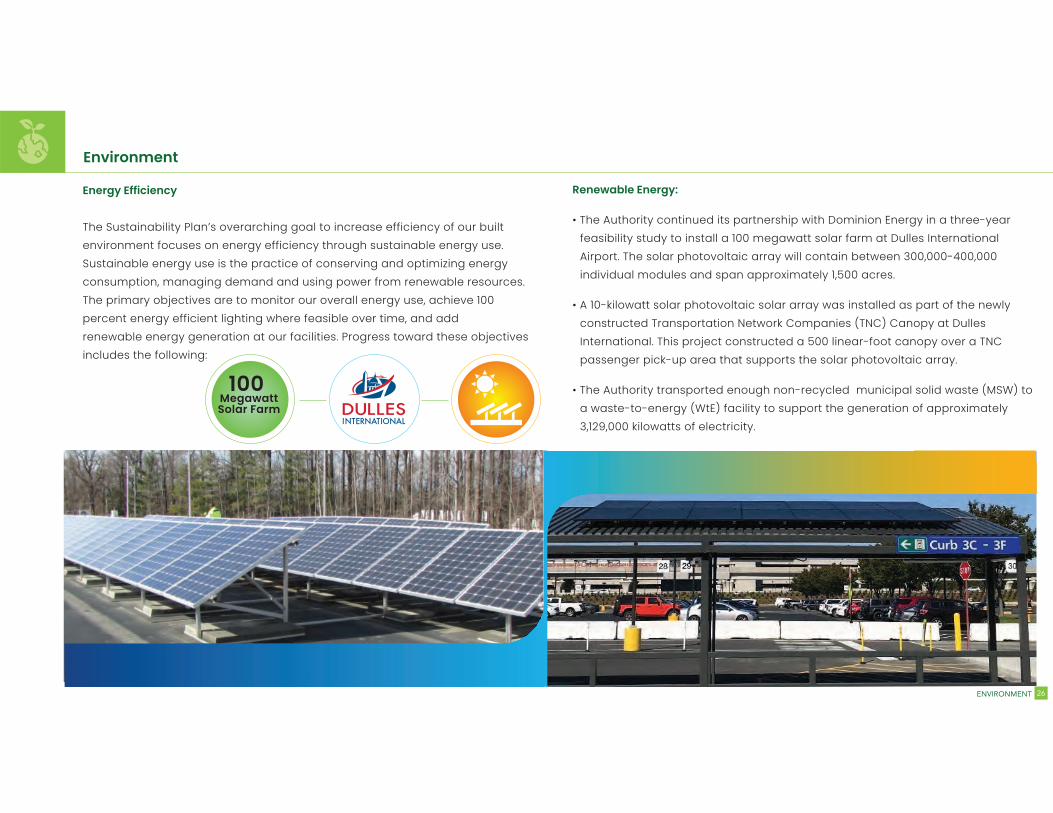
Energy Efficiency
The Sustainability Plan’s overarching goal to increase efficiency of our built
environment focuses on energy efficiency through sustainable energy use.
Sustainable energy use is the practice of conserving and optimizing energy
consumption, managing demand and using power from renewable resources.
The primary objectives are to monitor our overall energy use, achieve 100
percent energy efficient lighting where feasible over time, and add
renewable energy generation at our facilities. Progress toward these objectives
includes the following:
Environment
Renewable Energy:
• The Authority continued its partnership with Dominion Energy in a three-year
feasibility study to install a 100 megawatt solar farm at Dulles International
Airport. The solar photovoltaic array will contain between 300,000-400,000
individual modules and span approximately 1,500 acres.
• A 10-kilowatt solar photovoltaic solar array was installed as part of the newly
constructed Transportation Network Companies (TNC) Canopy at Dulles
International. This project constructed a 500 linear-foot canopy over a TNC
passenger pick-up area that supports the solar photovoltaic array.
• The Authority transported enough non-recycled municipal solid waste (MSW) to
a waste-to-energy (WtE) facility to support the generation of approximately
3,129,000 kilowatts of electricity.
100 MegawattSolar Farm
ENVIRONMENT 26
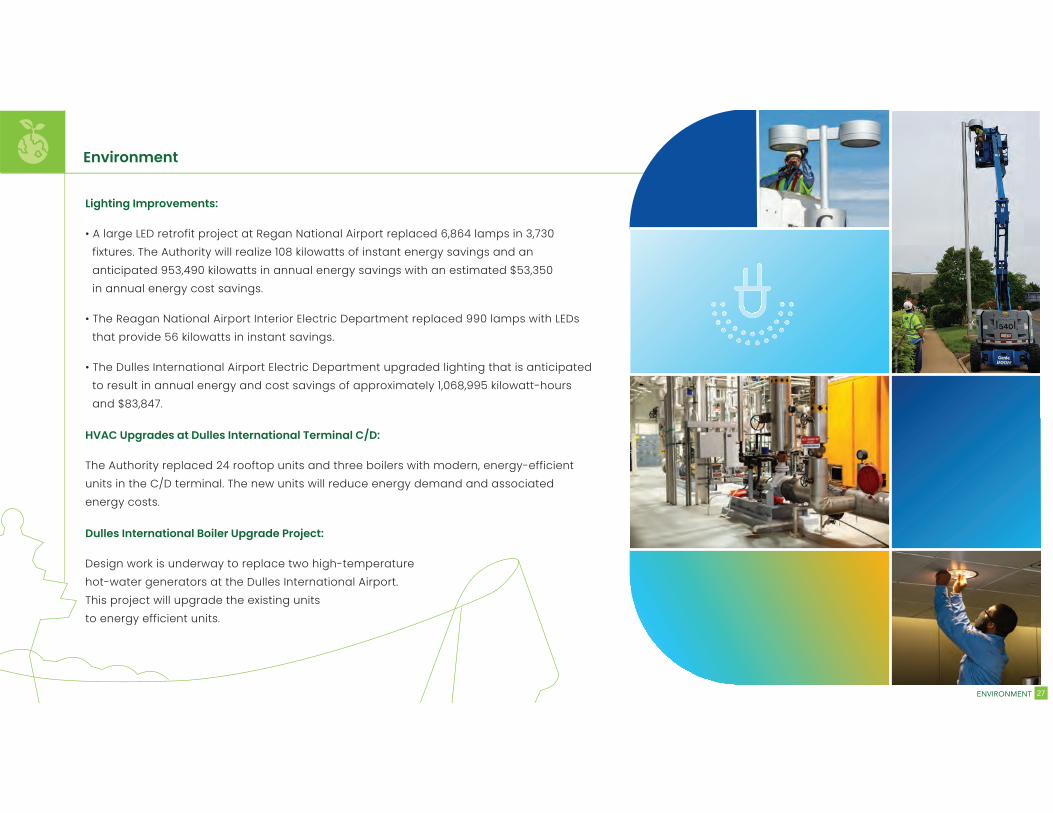
Lighting Improvements:
• A large LED retrofit project at Regan National Airport replaced 6,864 lamps in 3,730
fixtures. The Authority will realize 108 kilowatts of instant energy savings and an
anticipated 953,490 kilowatts in annual energy savings with an estimated $53,350
in annual energy cost savings.
• The Reagan National Airport Interior Electric Department replaced 990 lamps with LEDs
that provide 56 kilowatts in instant savings.
• The Dulles International Airport Electric Department upgraded lighting that is anticipated
to result in annual energy and cost savings of approximately 1,068,995 kilowatt-hours
and $83,847.
HVAC Upgrades at Dulles International Terminal C/D:
The Authority replaced 24 rooftop units and three boilers with modern, energy-efficient
units in the C/D terminal. The new units will reduce energy demand and associated
energy costs.
Dulles International Boiler Upgrade Project:
Design work is underway to replace two high-temperature
hot-water generators at the Dulles International Airport.
This project will upgrade the existing units
to energy efficient units.
Environment
ENVIRONMENT 27
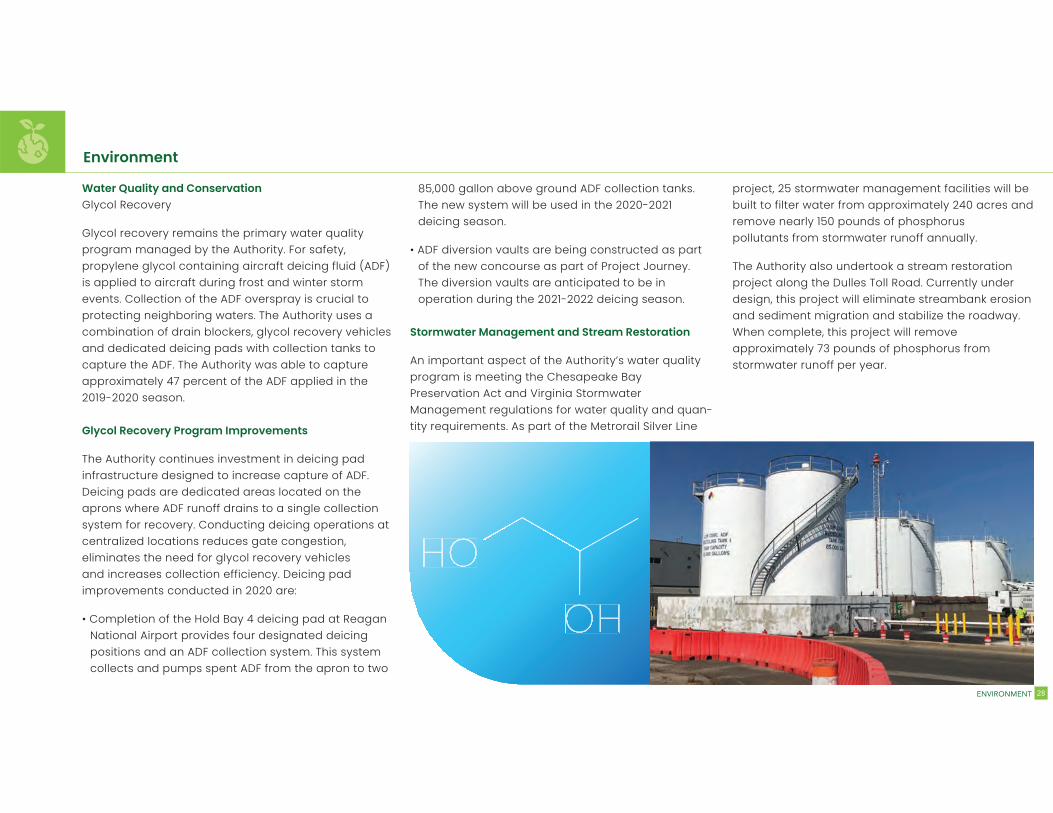
Water Quality and ConservationGlycol Recovery
Glycol recovery remains the primary water quality program managed by the Authority. For safety, propylene glycol containing aircraft deicing fluid (ADF) is applied to aircraft during frost and winter storm events. Collection of the ADF overspray is crucial to protecting neighboring waters. The Authority uses a combination of drain blockers, glycol recovery vehicles and dedicated deicing pads with collection tanks to capture the ADF. The Authority was able to capture approximately 47 percent of the ADF applied in the 2019-2020 season.
Glycol Recovery Program Improvements
The Authority continues investment in deicing pad infrastructure designed to increase capture of ADF. Deicing pads are dedicated areas located on the aprons where ADF runoff drains to a single collection system for recovery. Conducting deicing operations at centralized locations reduces gate congestion, eliminates the need for glycol recovery vehicles and increases collection efficiency. Deicing pad improvements conducted in 2020 are:
• Completion of the Hold Bay 4 deicing pad at Reagan National Airport provides four designated deicing positions and an ADF collection system. This system collects and pumps spent ADF from the apron to two
Environment
85,000 gallon above ground ADF collection tanks. The new system will be used in the 2020-2021 deicing season.
• ADF diversion vaults are being constructed as part of the new concourse as part of Project Journey. The diversion vaults are anticipated to be in operation during the 2021-2022 deicing season.
Stormwater Management and Stream Restoration
An important aspect of the Authority’s water quality program is meeting the Chesapeake Bay Preservation Act and Virginia Stormwater Management regulations for water quality and quan-tity requirements. As part of the Metrorail Silver Line
project, 25 stormwater management facilities will be built to filter water from approximately 240 acres and remove nearly 150 pounds of phosphorus pollutants from stormwater runoff annually.
The Authority also undertook a stream restoration project along the Dulles Toll Road. Currently under design, this project will eliminate streambank erosion and sediment migration and stabilize the roadway. When complete, this project will remove approximately 73 pounds of phosphorus from stormwater runoff per year.
ENVIRONMENT 28
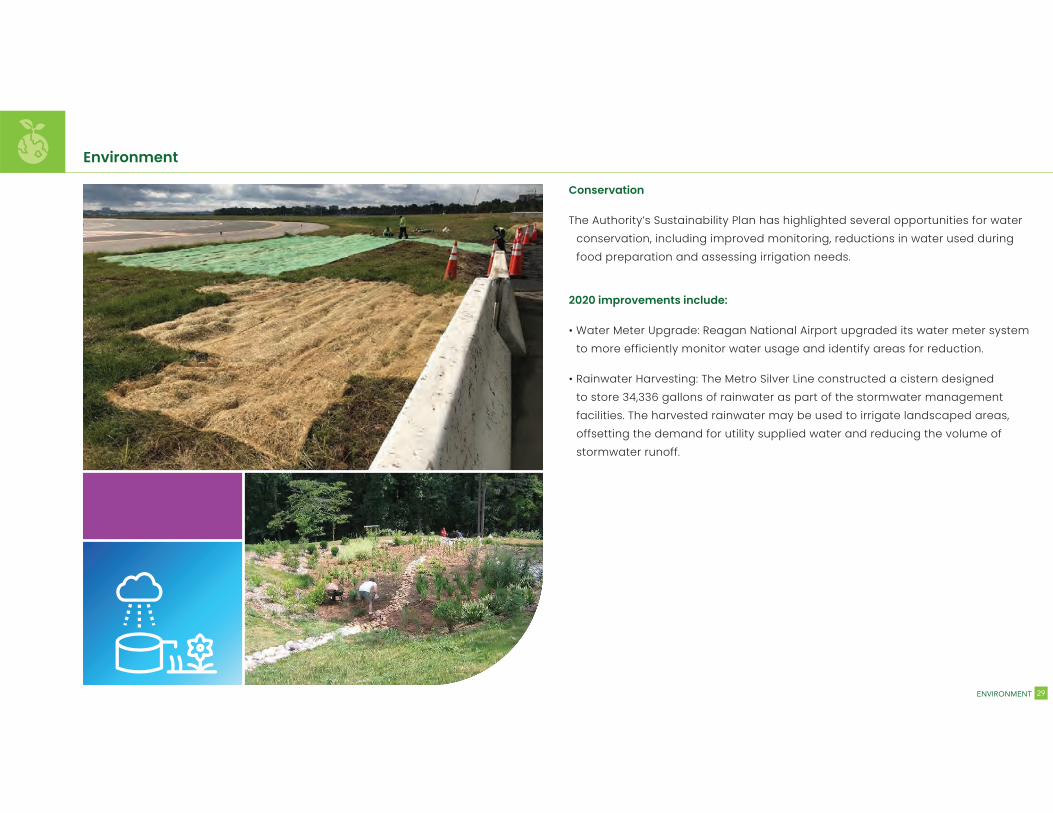
Conservation
The Authority’s Sustainability Plan has highlighted several opportunities for water
conservation, including improved monitoring, reductions in water used during
food preparation and assessing irrigation needs.
2020 improvements include:
• Water Meter Upgrade: Reagan National Airport upgraded its water meter system
to more efficiently monitor water usage and identify areas for reduction.
• Rainwater Harvesting: The Metro Silver Line constructed a cistern designed
to store 34,336 gallons of rainwater as part of the stormwater management
facilities. The harvested rainwater may be used to irrigate landscaped areas,
offsetting the demand for utility supplied water and reducing the volume of
stormwater runoff.
Environment
ENVIRONMENT 29
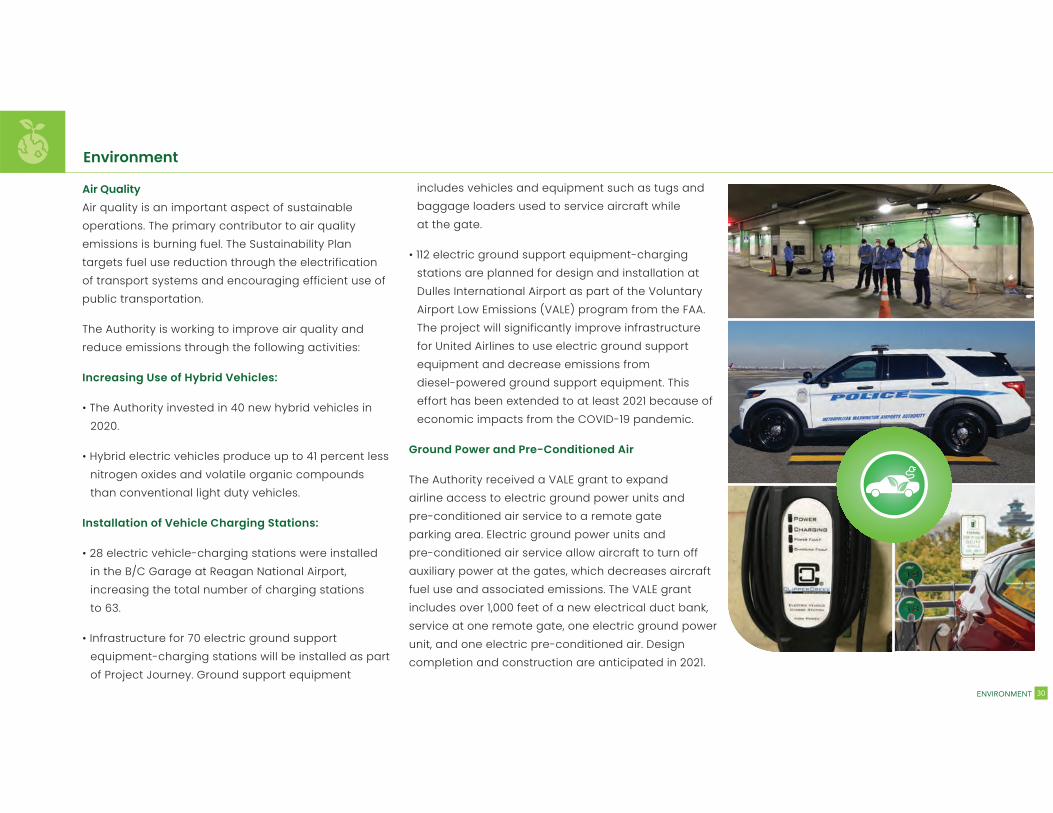
Air Quality
Air quality is an important aspect of sustainable
operations. The primary contributor to air quality
emissions is burning fuel. The Sustainability Plan
targets fuel use reduction through the electrification
of transport systems and encouraging efficient use of
public transportation.
The Authority is working to improve air quality and
reduce emissions through the following activities:
Increasing Use of Hybrid Vehicles:
• The Authority invested in 40 new hybrid vehicles in
2020.
• Hybrid electric vehicles produce up to 41 percent less
nitrogen oxides and volatile organic compounds
than conventional light duty vehicles.
Installation of Vehicle Charging Stations:
• 28 electric vehicle-charging stations were installed
in the B/C Garage at Reagan National Airport,
increasing the total number of charging stations
to 63.
• Infrastructure for 70 electric ground support
equipment-charging stations will be installed as part
of Project Journey. Ground support equipment
Environment
includes vehicles and equipment such as tugs and
baggage loaders used to service aircraft while
at the gate.
• 112 electric ground support equipment-charging
stations are planned for design and installation at
Dulles International Airport as part of the Voluntary
Airport Low Emissions (VALE) program from the FAA.
The project will significantly improve infrastructure
for United Airlines to use electric ground support
equipment and decrease emissions from
diesel-powered ground support equipment. This
effort has been extended to at least 2021 because of
economic impacts from the COVID-19 pandemic.
Ground Power and Pre-Conditioned Air
The Authority received a VALE grant to expand
airline access to electric ground power units and
pre-conditioned air service to a remote gate
parking area. Electric ground power units and
pre-conditioned air service allow aircraft to turn off
auxiliary power at the gates, which decreases aircraft
fuel use and associated emissions. The VALE grant
includes over 1,000 feet of a new electrical duct bank,
service at one remote gate, one electric ground power
unit, and one electric pre-conditioned air. Design
completion and construction are anticipated in 2021.
ENVIRONMENT 30
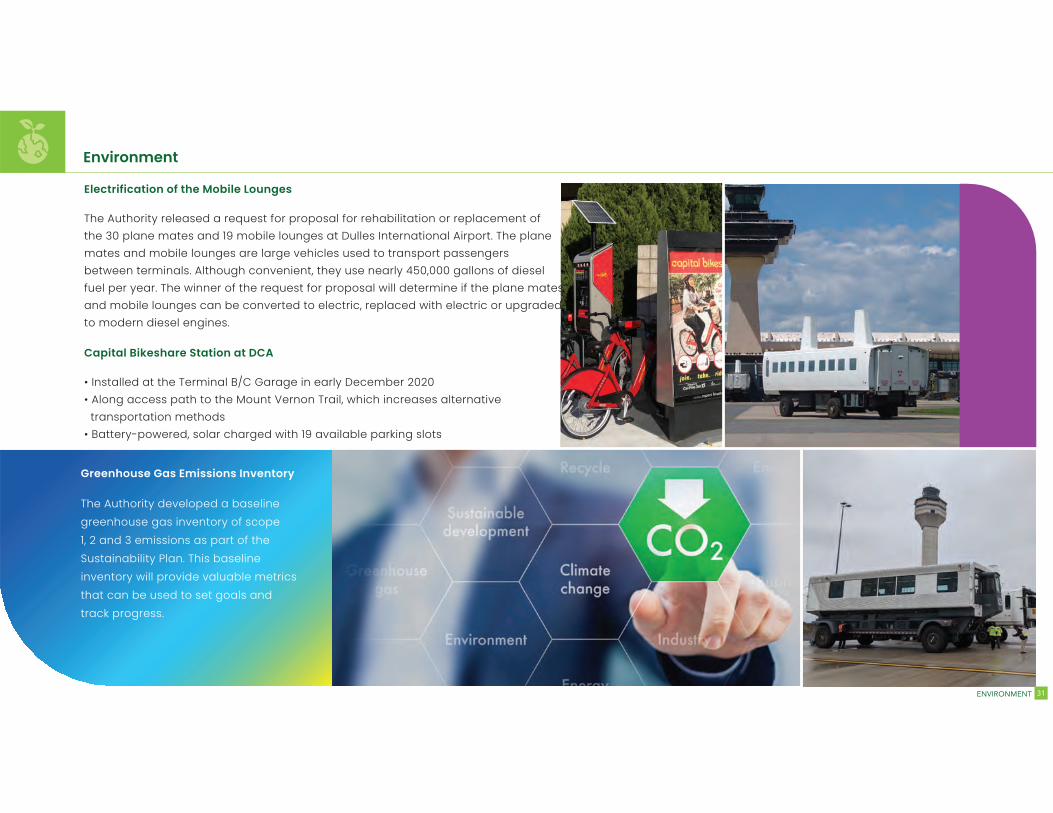
Environment
Greenhouse Gas Emissions Inventory
The Authority developed a baseline
greenhouse gas inventory of scope
1, 2 and 3 emissions as part of the
Sustainability Plan. This baseline
inventory will provide valuable metrics
that can be used to set goals and
track progress.
ENVIRONMENT 31
Electrification of the Mobile Lounges
The Authority released a request for proposal for rehabilitation or replacement of
the 30 plane mates and 19 mobile lounges at Dulles International Airport. The plane
mates and mobile lounges are large vehicles used to transport passengers
between terminals. Although convenient, they use nearly 450,000 gallons of diesel
fuel per year. The winner of the request for proposal will determine if the plane mates
and mobile lounges can be converted to electric, replaced with electric or upgraded
to modern diesel engines.
Capital Bikeshare Station at DCA
• Installed at the Terminal B/C Garage in early December 2020
• Along access path to the Mount Vernon Trail, which increases alternative
transportation methods
• Battery-powered, solar charged with 19 available parking slots
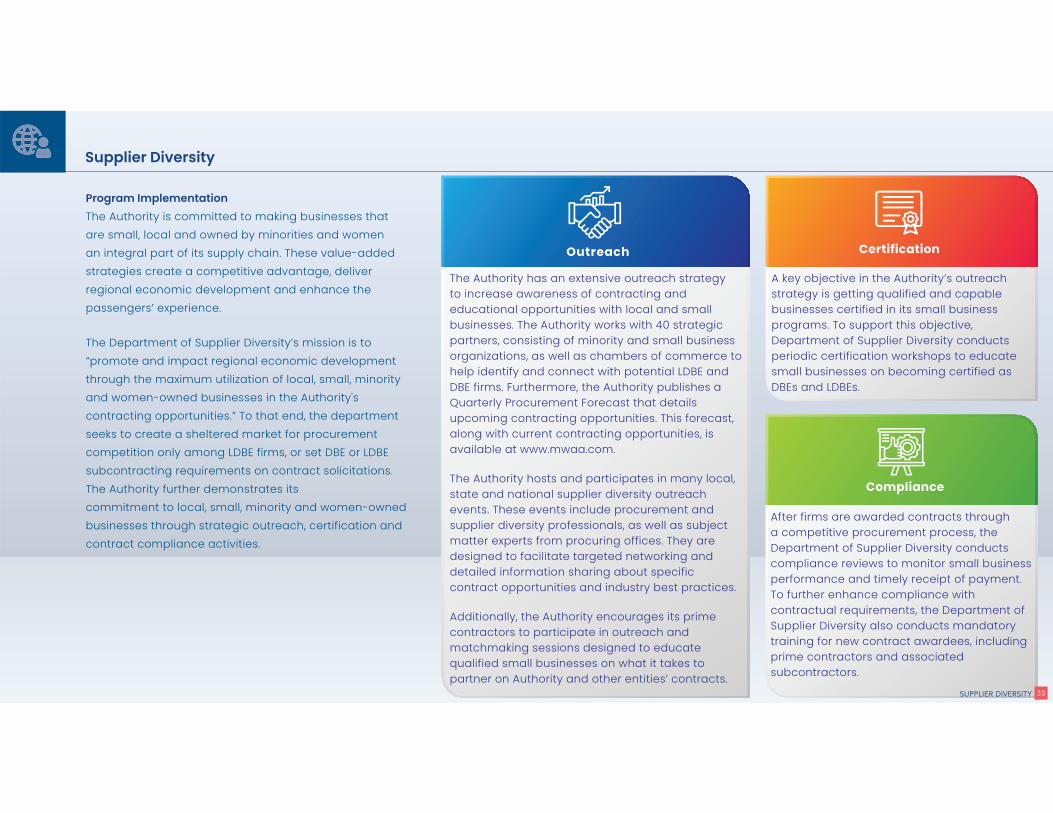
Program Implementation
The Authority is committed to making businesses that
are small, local and owned by minorities and women
an integral part of its supply chain. These value-added
strategies create a competitive advantage, deliver
regional economic development and enhance the
passengers’ experience.
The Department of Supplier Diversity’s mission is to
“promote and impact regional economic development
through the maximum utilization of local, small, minority
and women-owned businesses in the Authority's
contracting opportunities.” To that end, the department
seeks to create a sheltered market for procurement
competition only among LDBE firms, or set DBE or LDBE
subcontracting requirements on contract solicitations.
The Authority further demonstrates its
commitment to local, small, minority and women-owned
businesses through strategic outreach, certification and
contract compliance activities.
Supplier Diversity
Outreach
The Authority has an extensive outreach strategy to increase awareness of contracting and educational opportunities with local and small businesses. The Authority works with 40 strategic partners, consisting of minority and small business organizations, as well as chambers of commerce to help identify and connect with potential LDBE and DBE firms. Furthermore, the Authority publishes a Quarterly Procurement Forecast that details upcoming contracting opportunities. This forecast, along with current contracting opportunities, is available at www.mwaa.com.
The Authority hosts and participates in many local, state and national supplier diversity outreach events. These events include procurement and supplier diversity professionals, as well as subject matter experts from procuring offices. They are designed to facilitate targeted networking and detailed information sharing about specific contract opportunities and industry best practices.
Additionally, the Authority encourages its prime contractors to participate in outreach and matchmaking sessions designed to educate qualified small businesses on what it takes to partner on Authority and other entities’ contracts.
Certification
A key objective in the Authority’s outreach strategy is getting qualified and capable businesses certified in its small business programs. To support this objective, Department of Supplier Diversity conducts periodic certification workshops to educate small businesses on becoming certified as DBEs and LDBEs.
Compliance
After firms are awarded contracts through a competitive procurement process, the Department of Supplier Diversity conducts compliance reviews to monitor small business performance and timely receipt of payment. To further enhance compliance with contractual requirements, the Department of Supplier Diversity also conducts mandatory training for new contract awardees, including prime contractors and associated subcontractors.
SUPPLIER DIVERSITY 33
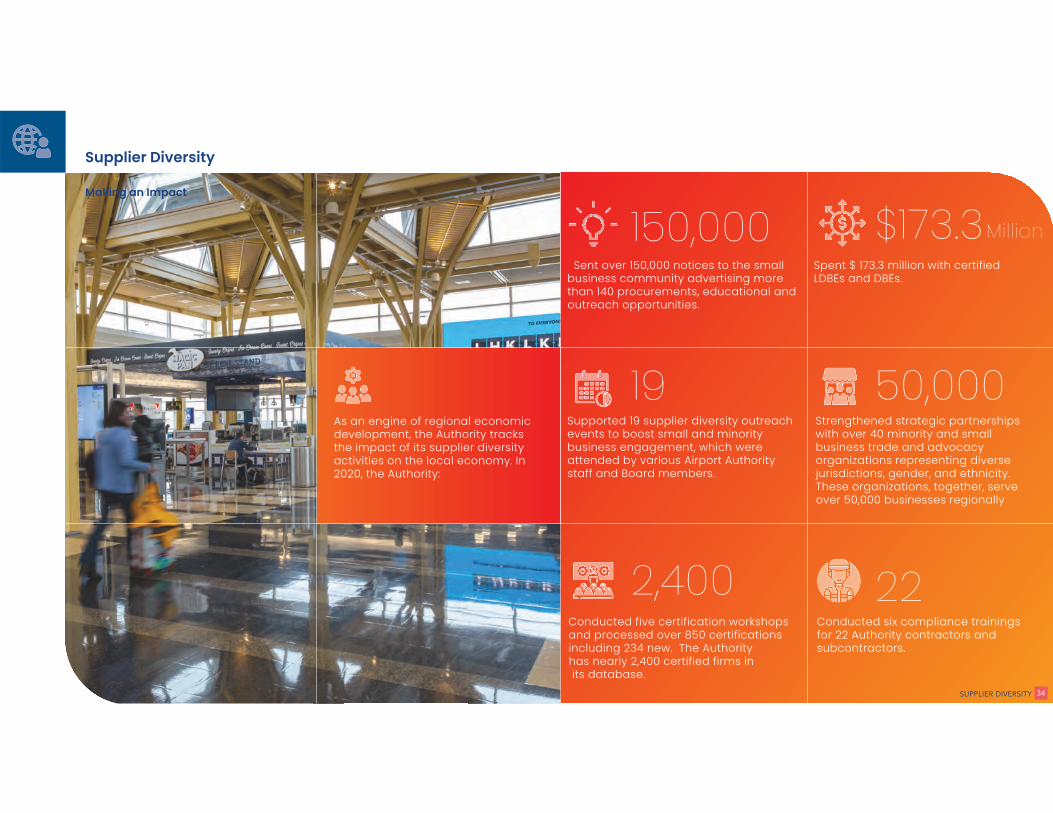
Making an Impact
As an engine of regional economic development, the Authority tracks the impact of its supplier diversity activities on the local economy. In 2020, the Authority:
150,000 $173.3
19 50,000
2,400 22
Sent over 150,000 notices to the small business community advertising more than 140 procurements, educational and outreach opportunities.
Spent $ 173.3 million with certified LDBEs and DBEs.
Supported 19 supplier diversity outreach events to boost small and minority business engagement, which were attended by various Airport Authority staff and Board members.
Strengthened strategic partnerships with over 40 minority and small business trade and advocacy organizations representing diverse jurisdictions, gender, and ethnicity. These organizations, together, serve over 50,000 businesses regionally
Conducted five certification workshops and processed over 850 certifications including 234 new. The Authority has nearly 2,400 certified firms in its database.
Conducted six compliance trainings for 22 Authority contractors and subcontractors.
Supplier Diversity
SUPPLIER DIVERSITY 34
Million
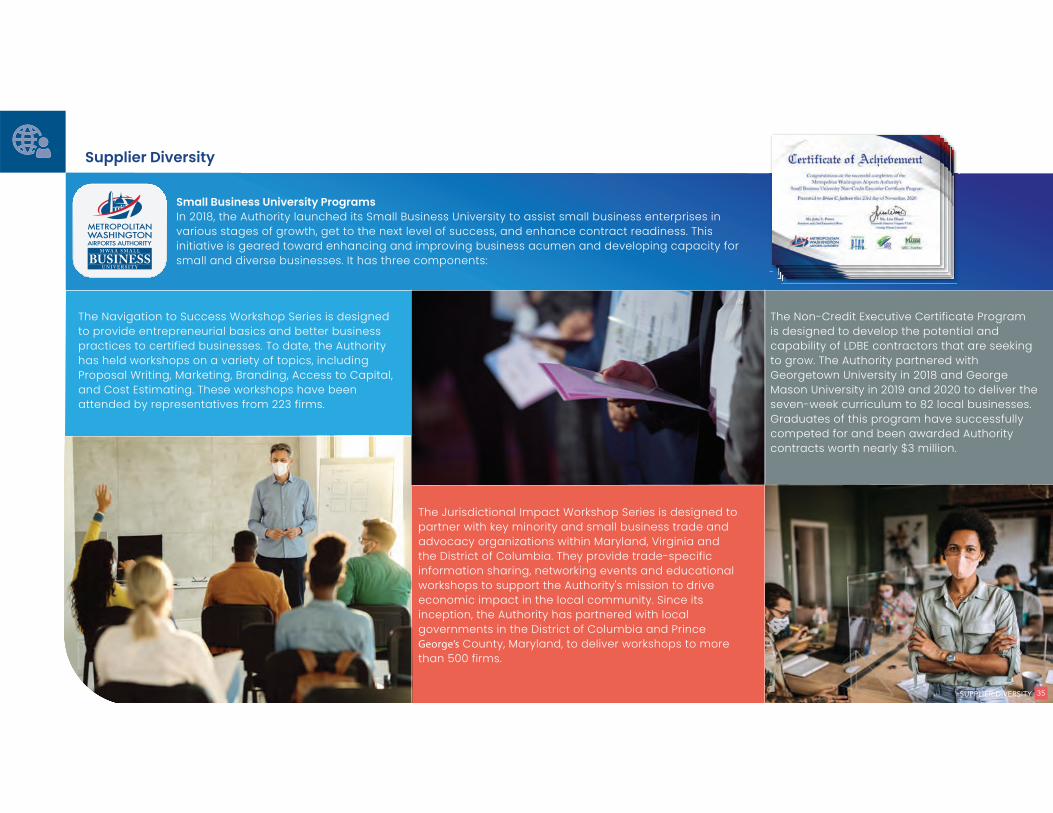
The Navigation to Success Workshop Series is designed to provide entrepreneurial basics and better business practices to certified businesses. To date, the Authority has held workshops on a variety of topics, including Proposal Writing, Marketing, Branding, Access to Capital, and Cost Estimating. These workshops have been attended by representatives from 223 firms.
The Jurisdictional Impact Workshop Series is designed to partner with key minority and small business trade and advocacy organizations within Maryland, Virginia and the District of Columbia. They provide trade-specific information sharing, networking events and educational workshops to support the Authority's mission to drive economic impact in the local community. Since its inception, the Authority has partnered with local governments in the District of Columbia and Prince George’s County, Maryland, to deliver workshops to more than 500 firms.
The Non-Credit Executive Certificate Program is designed to develop the potential and capability of LDBE contractors that are seeking to grow. The Authority partnered with Georgetown University in 2018 and George Mason University in 2019 and 2020 to deliver the seven-week curriculum to 82 local businesses. Graduates of this program have successfully competed for and been awarded Authority contracts worth nearly $3 million.
Small Business University ProgramsIn 2018, the Authority launched its Small Business University to assist small business enterprises in various stages of growth, get to the next level of success, and enhance contract readiness. This initiative is geared toward enhancing and improving business acumen and developing capacity for small and diverse businesses. It has three components:
Supplier Diversity
SUPPLIER DIVERSITY 35
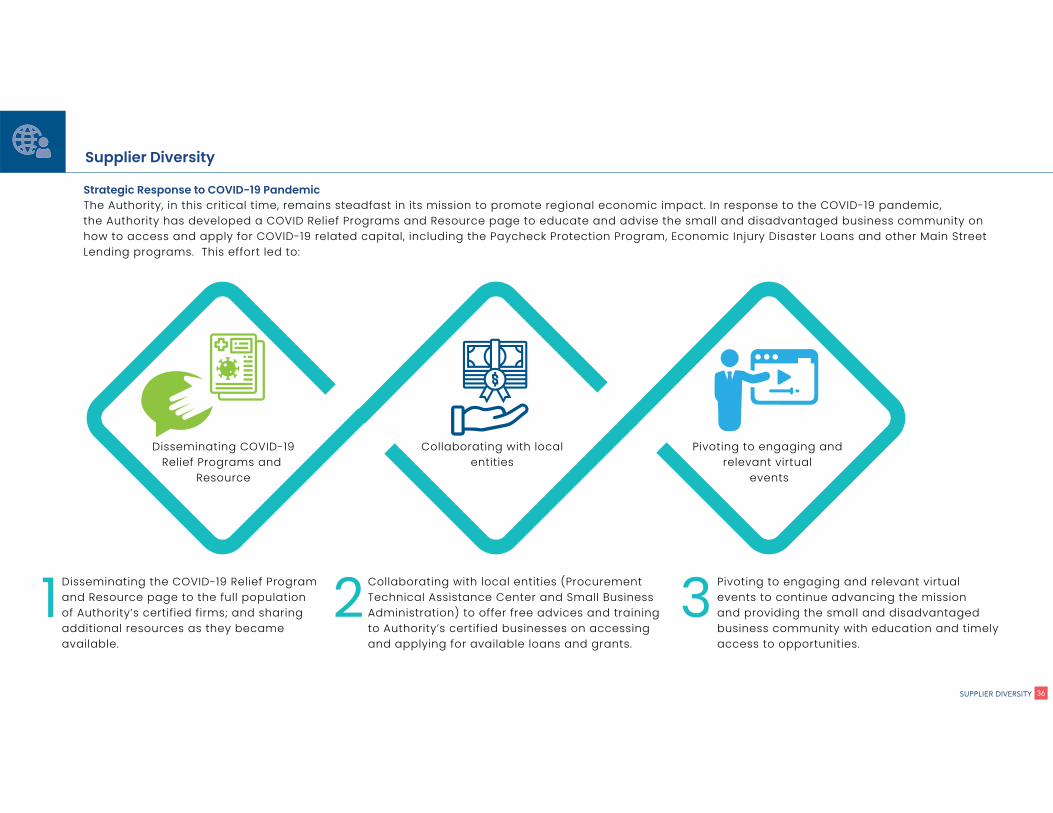
The Authority, in this critical time, remains steadfast in its mission to promote regional economic impact. In response to the COVID-19 pandemic, the Authority has developed a COVID Relief Programs and Resource page to educate and advise the small and disadvantaged business community on how to access and apply for COVID-19 related capital, including the Paycheck Protection Program, Economic Injury Disaster Loans and other Main Street Lending programs. This effort led to:
Supplier Diversity
Disseminating the COVID-19 Relief Program and Resource page to the full population of Authority’s certified firms; and sharing additional resources as they became available.
Collaborating with local entities (Procurement Technical Assistance Center and Small Business Administration) to offer free advices and training to Authority’s certified businesses on accessing and applying for available loans and grants.
Pivoting to engaging and relevant virtual events to continue advancing the mission and providing the small and disadvantaged business community with education and timely access to opportunities.
Disseminating COVID-19Relief Programs and
Resource
Collaborating with local entities
Pivoting to engaging and relevant virtual
events
1 2 3SUPPLIER DIVERSITY 36
Strategic Response to COVID-19 Pandemic

“2020 Civil Rights Advocate and Partner Award for DBE &
ACDBE Programs” for the the Authority’s enhanced outreach efforts, supplier
development programs and consistent achievement of DBE and ACDBE participation in federally funded
contracts and concessions opportunities
“Best Public Transportation Airports Authority for Minority Business
Enterprises by Maryland Gov. Larry Hogan on behalf of the Maryland
Washington Minority Companies Association (2018)
"Women Presidents’ Educational Organization Awards" for the Authority’s
commitment to and demonstrated support for women-owned businesses
(2017 and 2018)
“Diversity Inclusive Organization” by the American DBE Magazine (2018)
Nomination as a “Catalyst of Minority Business Inclusion” by the Airport Minority
Advisory Council (2018)
Awards and RecognitionIn recent years, the Authority has received multiple awards and recognition from key minority and small business organizations and elected officials, in recognition of its demonstrated commitment to supplier diversity and economic impact in the region. These recognitions include:
Supplier Diversity
SUPPLIER DIVERSITY 37
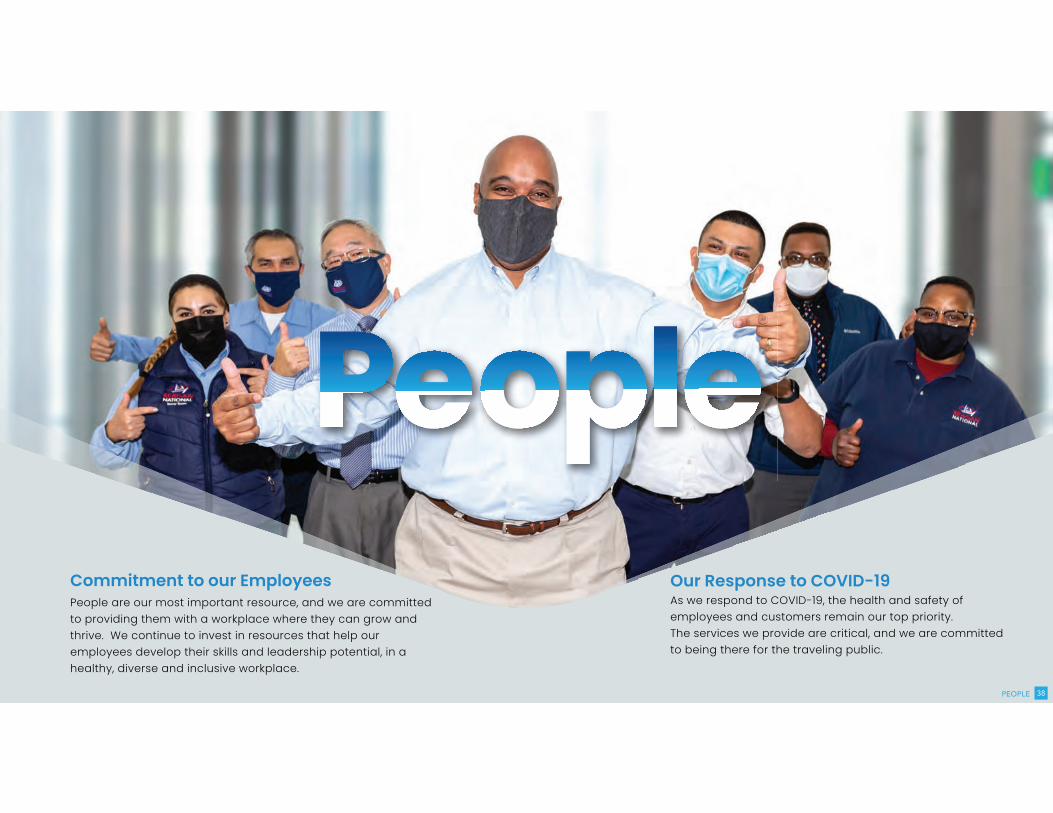
Commitment to our EmployeesPeople are our most important resource, and we are committed to providing them with a workplace where they can grow and thrive. We continue to invest in resources that help our employees develop their skills and leadership potential, in a healthy, diverse and inclusive workplace.
Our Response to COVID-19As we respond to COVID-19, the health and safety of employees and customers remain our top priority. The services we provide are critical, and we are committed to being there for the traveling public.
PEOPLE 38
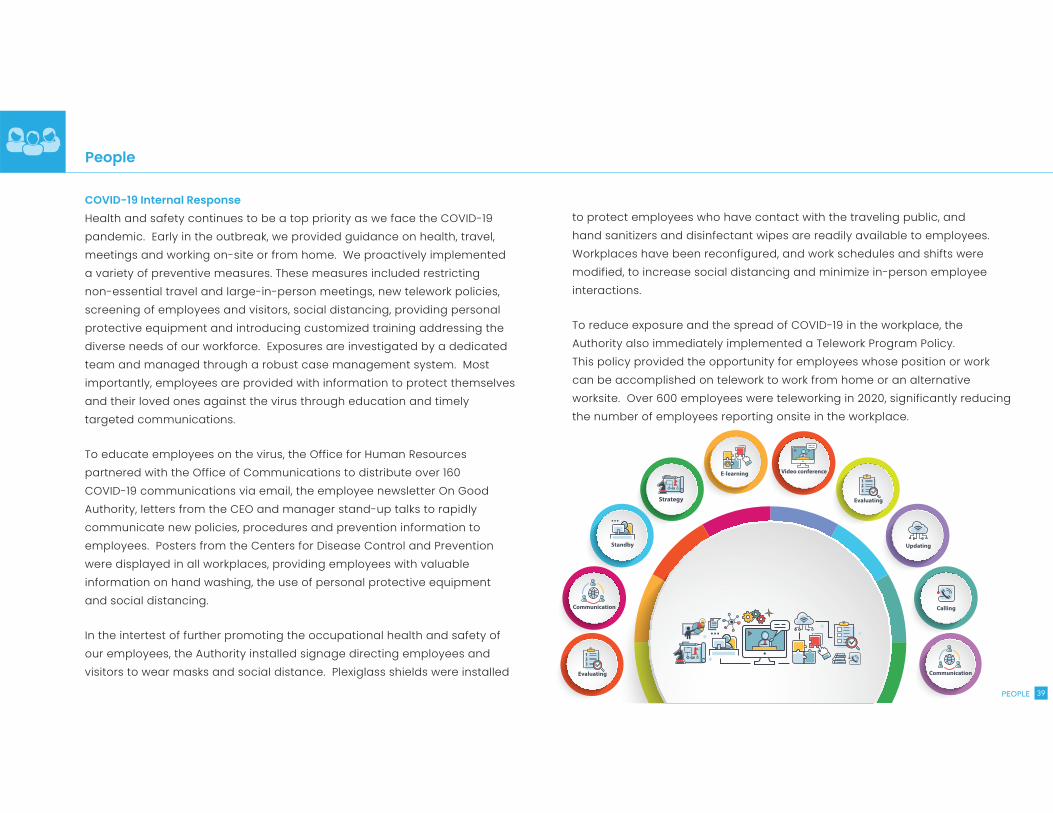
COVID-19 Internal Response
Health and safety continues to be a top priority as we face the COVID-19
pandemic. Early in the outbreak, we provided guidance on health, travel,
meetings and working on-site or from home. We proactively implemented
a variety of preventive measures. These measures included restricting
non-essential travel and large-in-person meetings, new telework policies,
screening of employees and visitors, social distancing, providing personal
protective equipment and introducing customized training addressing the
diverse needs of our workforce. Exposures are investigated by a dedicated
team and managed through a robust case management system. Most
importantly, employees are provided with information to protect themselves
and their loved ones against the virus through education and timely
targeted communications.
To educate employees on the virus, the Office for Human Resources
partnered with the Office of Communications to distribute over 160
COVID-19 communications via email, the employee newsletter On Good
Authority, letters from the CEO and manager stand-up talks to rapidly
communicate new policies, procedures and prevention information to
employees. Posters from the Centers for Disease Control and Prevention
were displayed in all workplaces, providing employees with valuable
information on hand washing, the use of personal protective equipment
and social distancing.
In the intertest of further promoting the occupational health and safety of
our employees, the Authority installed signage directing employees and
visitors to wear masks and social distance. Plexiglass shields were installed
People
to protect employees who have contact with the traveling public, and
hand sanitizers and disinfectant wipes are readily available to employees.
Workplaces have been reconfigured, and work schedules and shifts were
modified, to increase social distancing and minimize in-person employee
interactions.
To reduce exposure and the spread of COVID-19 in the workplace, the
Authority also immediately implemented a Telework Program Policy.
This policy provided the opportunity for employees whose position or work
can be accomplished on telework to work from home or an alternative
worksite. Over 600 employees were teleworking in 2020, significantly reducing
the number of employees reporting onsite in the workplace.
PEOPLE 39
Caring for our employees
The Airports Authority always has believed in taking care our employees’ wellbeing.
Knowing that healthy employees are productive employees, we offer medical and
dental insurance at group rates, along with an employee assistance program that
is fully paid for by the company. We also offer financial planning–both for today
and for tomorrow-with flexible spending accounts, long-term disability and life
insurance programs and a 457 plan, which includes a company match.
We recognize a great career comes with great balance, so we offer generous paid
time-off programs, including holidays, vacation and sick leave. Employees can learn
about their own health through health screenings and take part in various optional
programs throughout the year focused on physical, mental and emotional wellness.
People
In 2020, the Airports Authority partnered with local departments of health to ensure our
employees have access to the approved COVID-19 vaccines. In late December, first
responders began receiving their first doses. This important milestone represents
a step forward for greater safety for our employees and the traveling public
PEOPLE 40
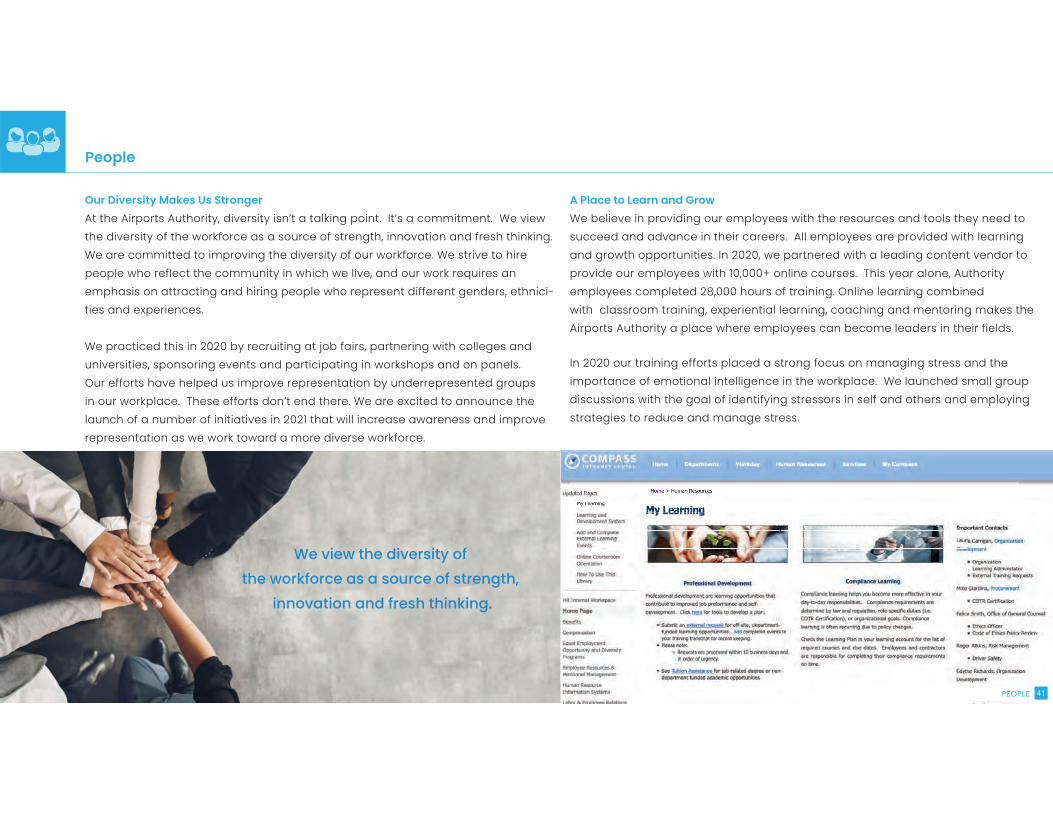
Our Diversity Makes Us Stronger
At the Airports Authority, diversity isn’t a talking point. It’s a commitment. We view
the diversity of the workforce as a source of strength, innovation and fresh thinking.
We are committed to improving the diversity of our workforce. We strive to hire
people who reflect the community in which we live, and our work requires an
emphasis on attracting and hiring people who represent different genders, ethnici-
ties and experiences.
We practiced this in 2020 by recruiting at job fairs, partnering with colleges and
universities, sponsoring events and participating in workshops and on panels.
Our efforts have helped us improve representation by underrepresented groups
in our workplace. These efforts don’t end there. We are excited to announce the
launch of a number of initiatives in 2021 that will increase awareness and improve
representation as we work toward a more diverse workforce.
We attract a diverse range of candidates through various employment programs,
such as our Skilled Trades Apprentice Program, Professional Development Intern
Program and our Chantilly Disability Program. We recognize that our internal em-
A Place to Learn and Grow
We believe in providing our employees with the resources and tools they need to
succeed and advance in their careers. All employees are provided with learning
and growth opportunities. In 2020, we partnered with a leading content vendor to
provide our employees with 10,000+ online courses. This year alone, Authority
employees completed 28,000 hours of training. Online learning combined
with classroom training, experiential learning, coaching and mentoring makes the
Airports Authority a place where employees can become leaders in their fields.
In 2020 our training efforts placed a strong focus on managing stress and the
importance of emotional intelligence in the workplace. We launched small group
discussions with the goal of identifying stressors in self and others and employing
strategies to reduce and manage stress.
With the new normal, managing emotions and using them effectively has never
been more important. We launched and recorded a webinar, “Emotional Intelligence
in a Virtual Work Environment.” Employees gained an understanding of emotional
intelligence and learned strategies to enhance underutilized elements. We view the diversity of
the workforce as a source of strength,
innovation and fresh thinking.
People
PEOPLE 41
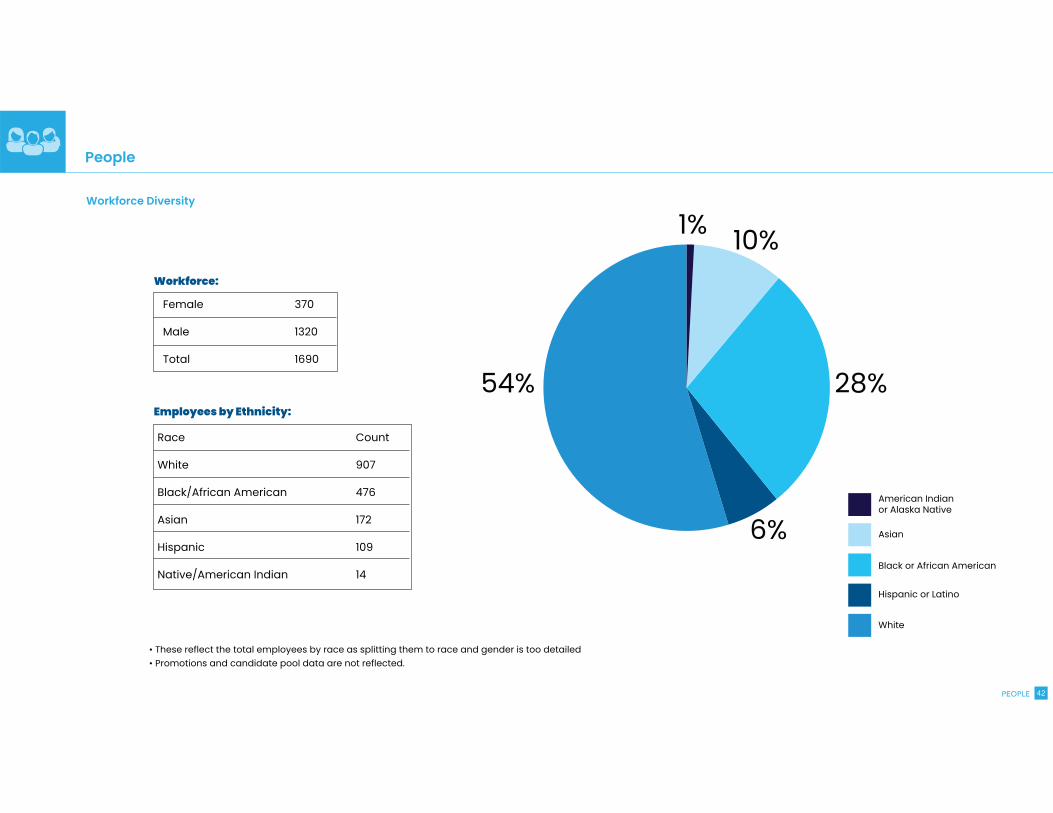
People
Workforce Diversity
Female 370
Male 1320
Total 1690
Workforce:
Employees by Ethnicity:
Race Count
White 907
Black/African American 476
Asian 172
Hispanic 109
Native/American Indian 14
• These reflect the total employees by race as splitting them to race and gender is too detailed• Promotions and candidate pool data are not reflected.
American Indian or Alaska Native
Black or African American
Asian
Hispanic or Latino
White
1% 10%
28%
6%
54%
PEOPLE 42
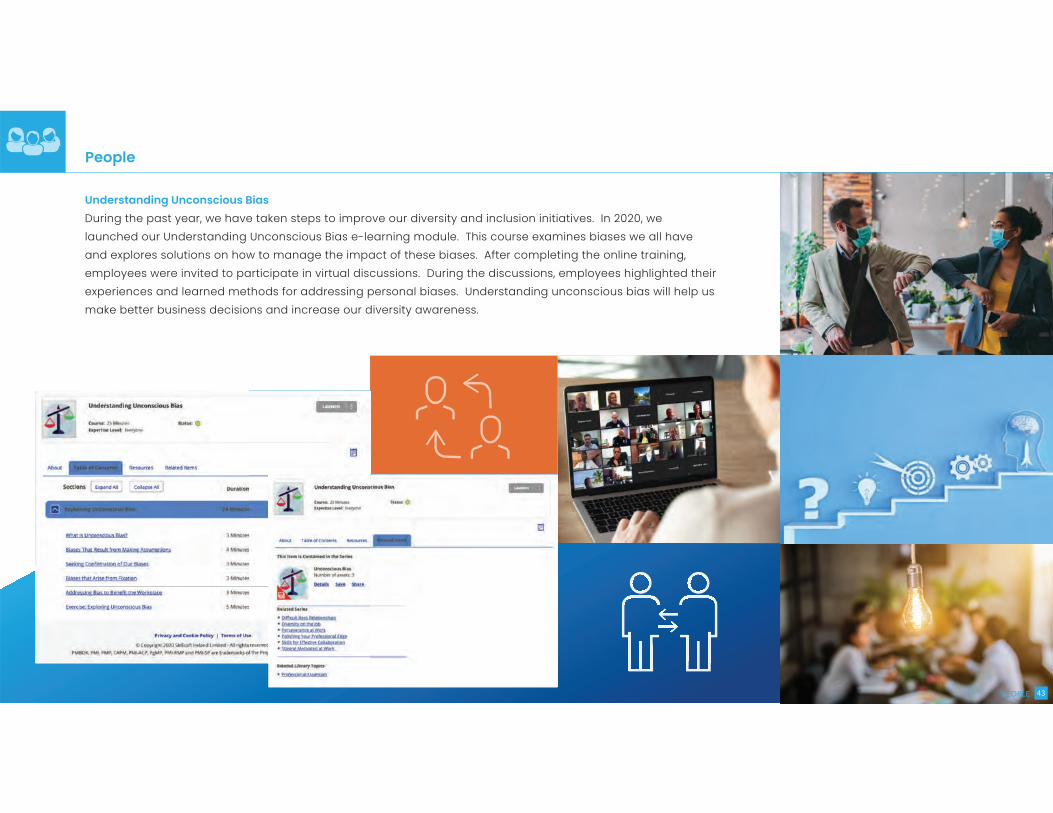
Understanding Unconscious Bias
During the past year, we have taken steps to improve our diversity and inclusion initiatives. In 2020, we
launched our Understanding Unconscious Bias e-learning module. This course examines biases we all have
and explores solutions on how to manage the impact of these biases. After completing the online training,
employees were invited to participate in virtual discussions. During the discussions, employees highlighted their
experiences and learned methods for addressing personal biases. Understanding unconscious bias will help us
make better business decisions and increase our diversity awareness.
People
PEOPLE 43
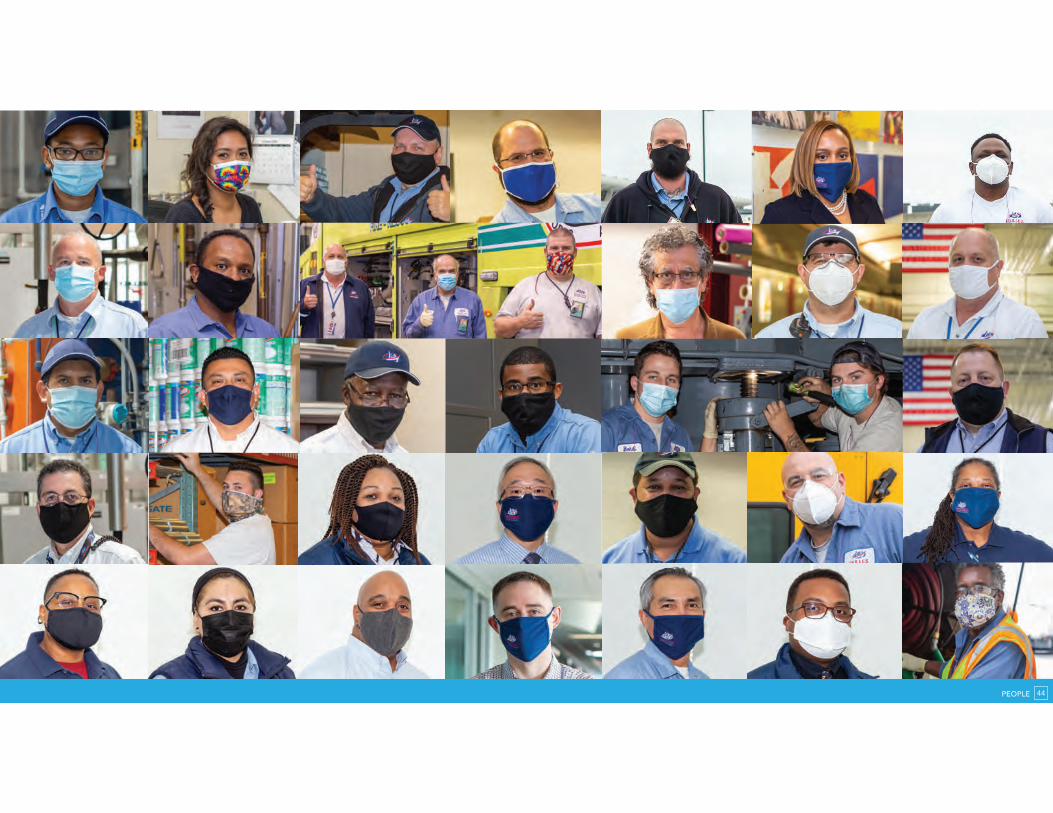
PEOPLE 44
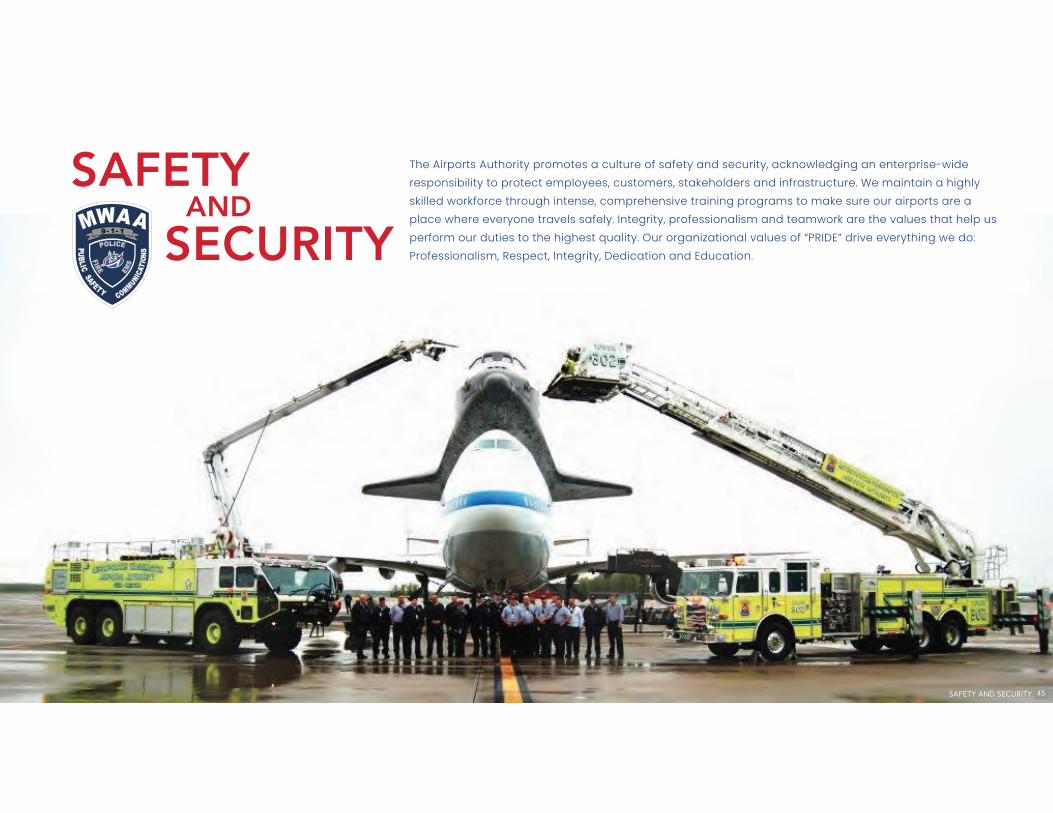
The Airports Authority promotes a culture of safety and security, acknowledging an enterprise-wide
responsibility to protect employees, customers, stakeholders and infrastructure. We maintain a highly
skilled workforce through intense, comprehensive training programs to make sure our airports are a
place where everyone travels safely. Integrity, professionalism and teamwork are the values that help us
perform our duties to the highest quality. Our organizational values of “PRIDE” drive everything we do:
Professionalism, Respect, Integrity, Dedication and Education.SECURITY
SAFETYAND
SAFETY AND SECURITY 45
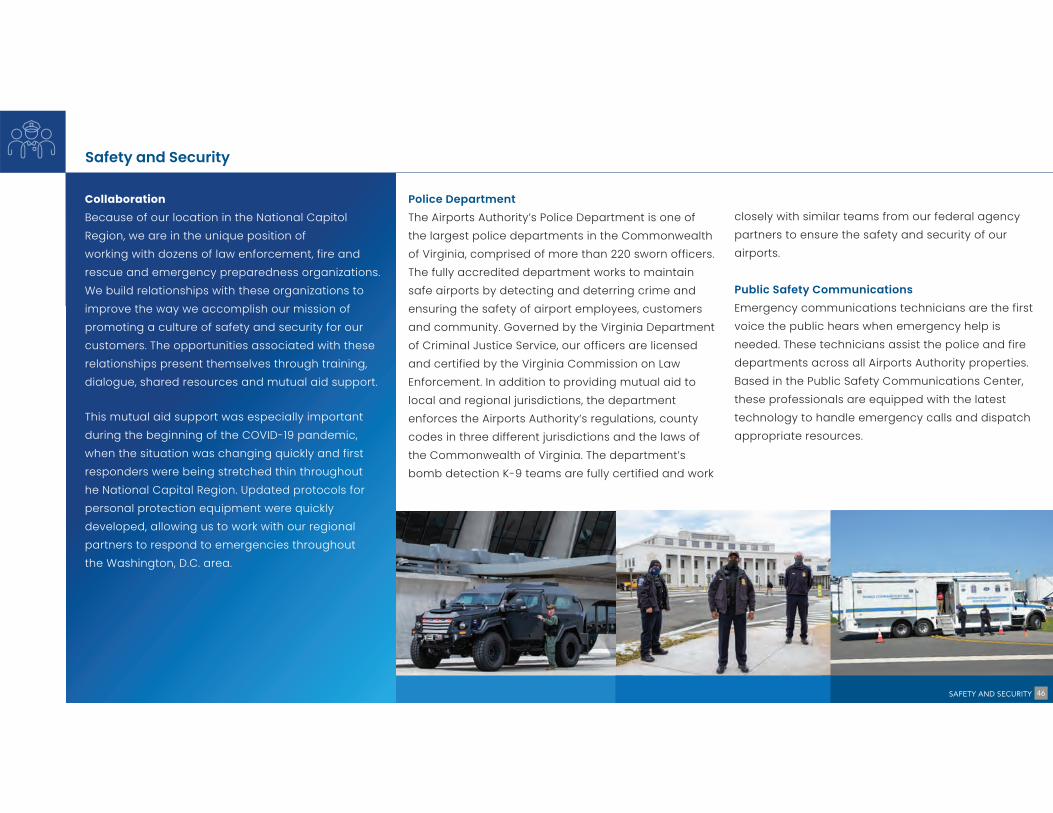
Police Department
The Airports Authority’s Police Department is one of
the largest police departments in the Commonwealth
of Virginia, comprised of more than 220 sworn officers.
The fully accredited department works to maintain
safe airports by detecting and deterring crime and
ensuring the safety of airport employees, customers
and community. Governed by the Virginia Department
of Criminal Justice Service, our officers are licensed
and certified by the Virginia Commission on Law
Enforcement. In addition to providing mutual aid to
local and regional jurisdictions, the department
enforces the Airports Authority’s regulations, county
codes in three different jurisdictions and the laws of
the Commonwealth of Virginia. The department’s
bomb detection K-9 teams are fully certified and work
closely with similar teams from our federal agency
partners to ensure the safety and security of our
airports.
Public Safety Communications
Emergency communications technicians are the first
voice the public hears when emergency help is
needed. These technicians assist the police and fire
departments across all Airports Authority properties.
Based in the Public Safety Communications Center,
these professionals are equipped with the latest
technology to handle emergency calls and dispatch
appropriate resources.
Collaboration
Because of our location in the National Capitol
Region, we are in the unique position of
working with dozens of law enforcement, fire and
rescue and emergency preparedness organizations.
We build relationships with these organizations to
improve the way we accomplish our mission of
promoting a culture of safety and security for our
customers. The opportunities associated with these
relationships present themselves through training,
dialogue, shared resources and mutual aid support.
This mutual aid support was especially important
during the beginning of the COVID-19 pandemic,
when the situation was changing quickly and first
responders were being stretched thin throughout
he National Capital Region. Updated protocols for
personal protection equipment were quickly
developed, allowing us to work with our regional
partners to respond to emergencies throughout
the Washington, D.C. area.
Safety and Security
SAFETY AND SECURITY 46
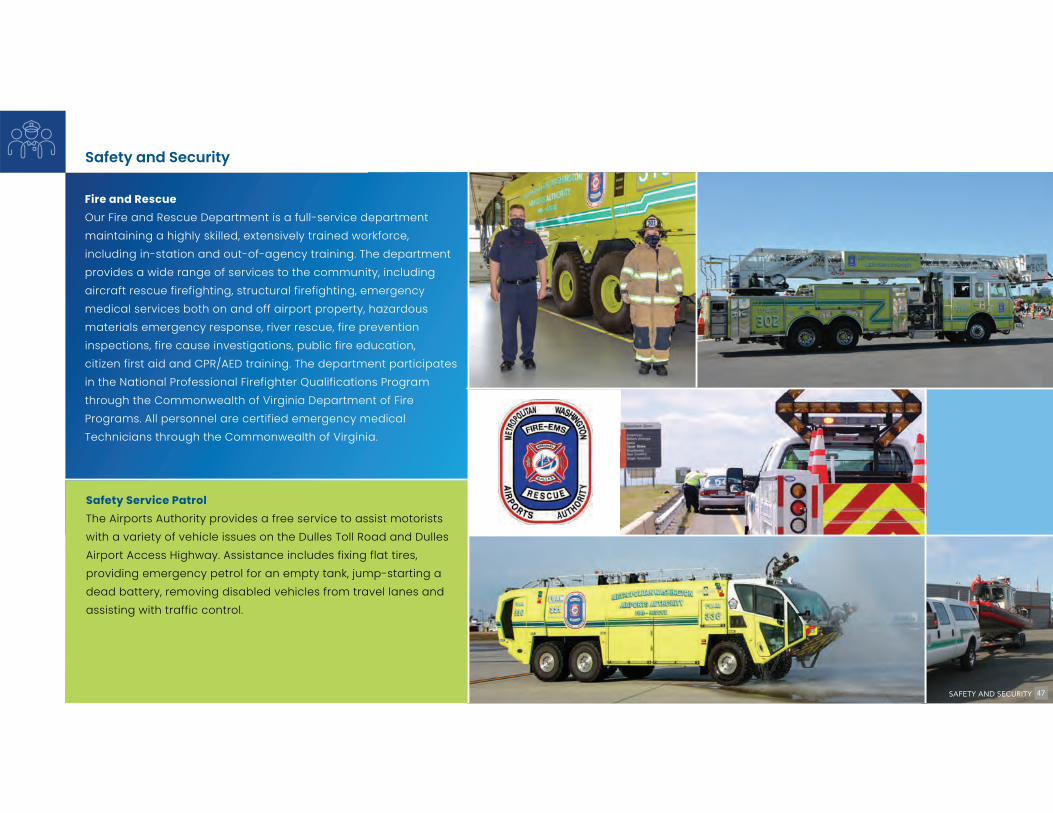
Fire and Rescue
Our Fire and Rescue Department is a full-service department
maintaining a highly skilled, extensively trained workforce,
including in-station and out-of-agency training. The department
provides a wide range of services to the community, including
aircraft rescue firefighting, structural firefighting, emergency
medical services both on and off airport property, hazardous
materials emergency response, river rescue, fire prevention
inspections, fire cause investigations, public fire education,
citizen first aid and CPR/AED training. The department participates
in the National Professional Firefighter Qualifications Program
through the Commonwealth of Virginia Department of Fire
Programs. All personnel are certified emergency medical
Technicians through the Commonwealth of Virginia.
Safety Service Patrol
The Airports Authority provides a free service to assist motorists
with a variety of vehicle issues on the Dulles Toll Road and Dulles
Airport Access Highway. Assistance includes fixing flat tires,
providing emergency petrol for an empty tank, jump-starting a
dead battery, removing disabled vehicles from travel lanes and
assisting with traffic control.
Safety and Security
SAFETY AND SECURITY 47
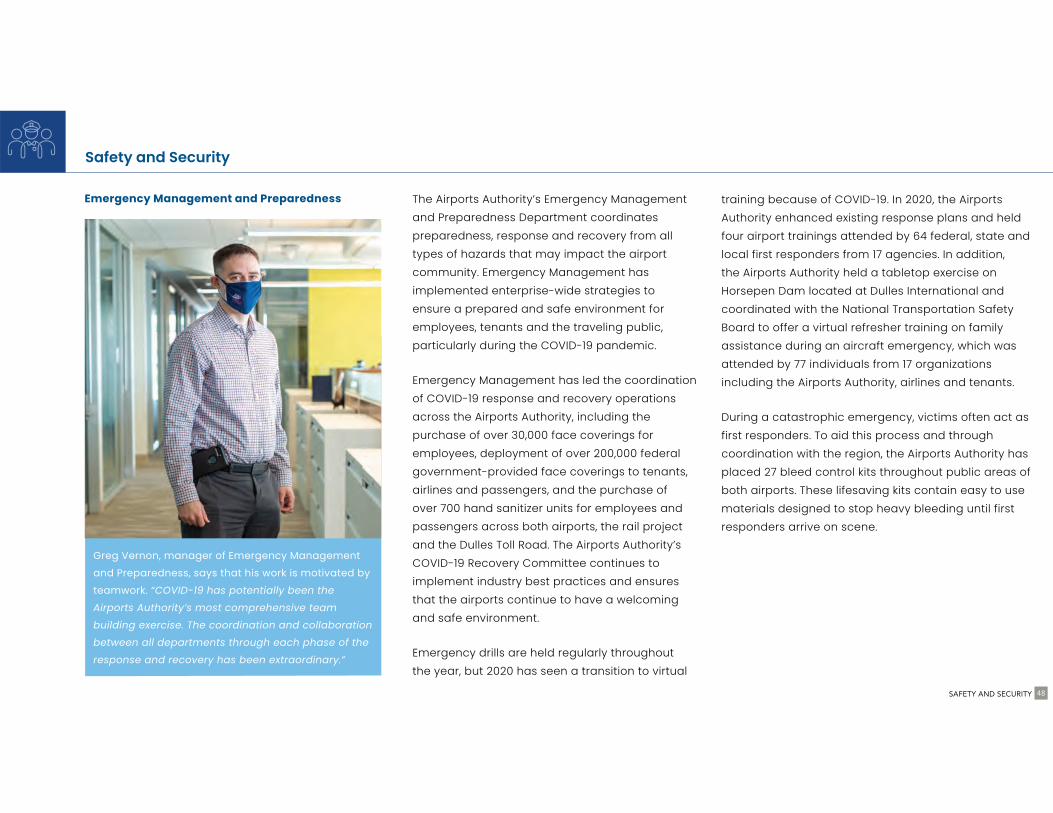
The Airports Authority’s Emergency Management
and Preparedness Department coordinates
preparedness, response and recovery from all
types of hazards that may impact the airport
community. Emergency Management has
implemented enterprise-wide strategies to
ensure a prepared and safe environment for
employees, tenants and the traveling public,
particularly during the COVID-19 pandemic.
Emergency Management has led the coordination
of COVID-19 response and recovery operations
across the Airports Authority, including the
purchase of over 30,000 face coverings for
employees, deployment of over 200,000 federal
government-provided face coverings to tenants,
airlines and passengers, and the purchase of
over 700 hand sanitizer units for employees and
passengers across both airports, the rail project
and the Dulles Toll Road. The Airports Authority’s
COVID-19 Recovery Committee continues to
implement industry best practices and ensures
that the airports continue to have a welcoming
and safe environment.
Emergency drills are held regularly throughout
the year, but 2020 has seen a transition to virtual
training because of COVID-19. In 2020, the Airports
Authority enhanced existing response plans and held
four airport trainings attended by 64 federal, state and
local first responders from 17 agencies. In addition,
the Airports Authority held a tabletop exercise on
Horsepen Dam located at Dulles International and
coordinated with the National Transportation Safety
Board to offer a virtual refresher training on family
assistance during an aircraft emergency, which was
attended by 77 individuals from 17 organizations
including the Airports Authority, airlines and tenants.
During a catastrophic emergency, victims often act as
first responders. To aid this process and through
coordination with the region, the Airports Authority has
placed 27 bleed control kits throughout public areas of
both airports. These lifesaving kits contain easy to use
materials designed to stop heavy bleeding until first
responders arrive on scene.
Safety and Security
SAFETY AND SECURITY 48
Emergency Management and Preparedness
Greg Vernon, manager of Emergency Management
and Preparedness, says that his work is motivated by
teamwork. “COVID-19 has potentially been the
Airports Authority’s most comprehensive team
building exercise. The coordination and collaboration
between all departments through each phase of the
response and recovery has been extraordinary.”

We are committed to maintaining the highest standards in corporate governance. Part of this commitment is ensuring the
Airports Authority’s core values of Collaboration, Integrity, Mutual Respect, and Pride are aligned throughout the company
and demonstrated through our dedication to compliance, ethics, integrity, and the fiduciary and civic responsibilities
ingrained in the company’s creation. We maintain strong, continuous dialogue with the various stakeholders of the
Airports Authority, including the communities in which we reside, the airlines, concessionaires and other tenants, airport
employees and, most importantly, our passengers. The result is a better focus and direction for the betterment of the
broader airport community.GOVERNANCE 49

Board of Directors
The Board of Directors fosters the long-term success of the Airports Authority,
promoting the common interests of airport stakeholders. The Board’s makeup is set
in federal statute and includes 17 members appointed by the governor of Virginia
(7), the mayor of the District of Columbia (4), the governor of Maryland (3), and
the president of the United States with advice and consent of the U.S. Senate (3).
Directors may serve up to two consecutive six-year terms. The Board chair is
elected each year by vote of the full Board and may serve up to two consecutive
one-year terms.
2020 Governance Goal and Performance Summary
Our goal is effective corporate governance to ensure long-term success in support
of the Airports Authority’s core mission to facilitate the flow of people, goods and
ideas to and through the National Capital Region, particularly in the face of
unprecedented challenges from COVID-19.
Performance
• All Board committees overseen by co-chairs from different jurisdictions
• Annual election of Board leadership
• All directors participate in annual ethics training
• Formalized financial disclosure and conflict of interest declaration process
Board Composition and Tenure
As of December 31, 2020, the Board of Directors consisted of 14 directors,
seven of whom were appointed by the governor of Virginia, four of whom
were appointed by the mayor of the District of Columbia, and three of
whom were appointed by the governor of Maryland. The three federal
appointee positions were vacant for the full year. The bios of the current
directors can be found at https://www.mwaa.com/about/Board-members.
GOVERNANCE 50
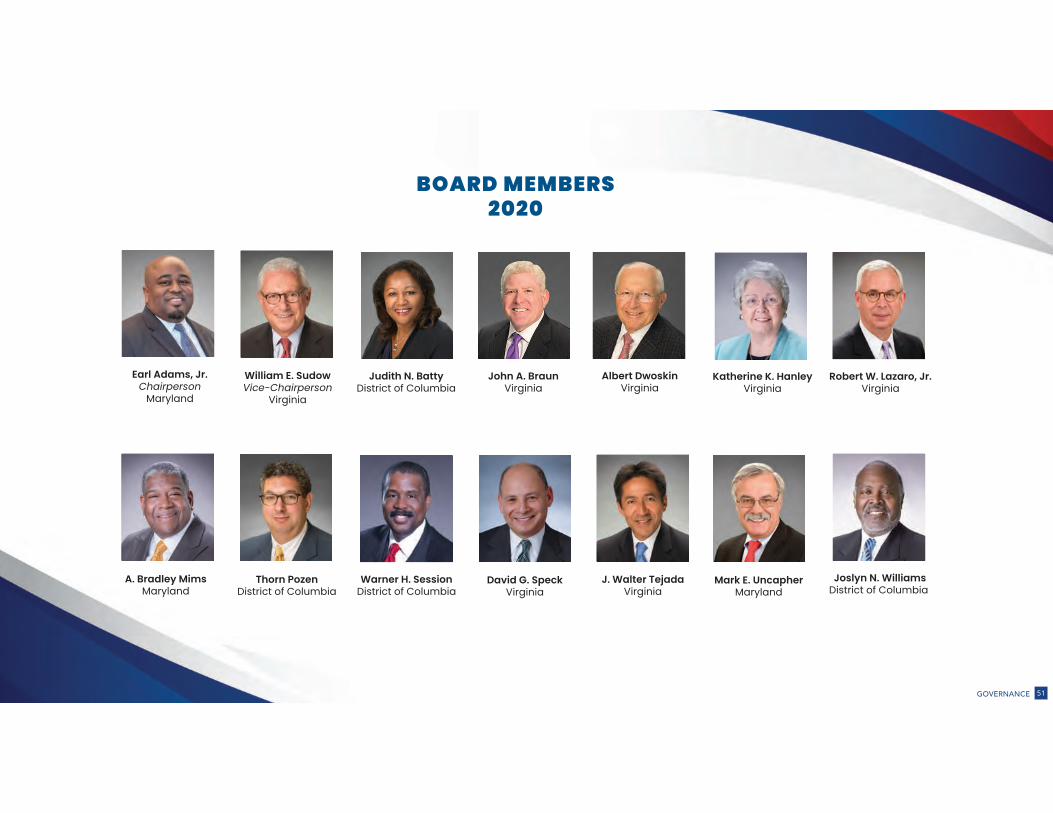
Judith N. BattyDistrict of Columbia
John A. BraunVirginia
Albert DwoskinVirginia
Katherine K. HanleyVirginia
A. Bradley MimsMaryland
Thorn PozenDistrict of Columbia
David G. SpeckVirginia
William E. SudowVice-Chairperson
Virginia
J. Walter TejadaVirginia
Mark E. UncapherMaryland
Joslyn N. WilliamsDistrict of Columbia
Warner H. SessionDistrict of Columbia
Earl Adams, Jr.Chairperson
Maryland
Robert W. Lazaro, Jr.Virginia
BOARD MEMBERS2020
GOVERNANCE 51
Committees and Jurisdiction
Standing Committees:
Business Administration Committee:
• Concessions: sets policy and provides oversight for contracts and leases over
$3 million in annual spending
• Construction: sets policy and provides oversight for contracts (non-competitively
awarded), except on Toll Road and Metrorail project-related contracts
• Goods and Services: reviews and makes recommendations for goods and services
contracts over $3 million in annual spending, except design services and
construction management contracts, various professional financial services
contracts and legal service contracts
• Ground Transportation: sets policy and regulations and provides oversight relative
to all ground transportation
• Policy and Oversight: sets policy and provides oversight related to LDBE and
DBE programs
• Procurement: sets policy and provides oversight on general procurement issues,
including the Contracting Manual and insurance. Also reviews, protects and
recommends Board decisions as applicable based on the solicitation
Dulles Corridor Committee:
• Dulles Toll Road: reviews and makes recommendations to the Board
on contracts for goods and services over $3 million in annual spending,
as well as noncompetitively awarded construction contracts
• Metrorail Project: reviews and makes recommendations to the Board on
contracts for goods and services over $3 million in annual spending, as well as
amendments to Silver Line rail construction contracts
• General: sets policy and provides oversight on regional transportation issues
related to the Toll Road and Metrorail project
Finance Committee:
• Financings: sets policy and provides oversight for banks and banking services,
reviews and makes recommendations to the Board on bond/financing issues,
bond anticipation notes, other debt instruments and transactions
• Financial Documents: reviews the Airports Authority’s budget
• Policies and Oversight: sets policy and provides oversight for financial policies
and reports, forecasting and investments
• Services: conducts selection process and makes recommendations on
professional financial services providers
Strategic Development Committee:
• Airlines: reviews and makes recommendations to the Board regarding contracts
and leases, including the Airport Use Agreement and Premises Lease
• Air Service: sets policy and provides oversight for development and marketing of
the airports, tourism and Reagan National Airport restrictions
GOVERNANCE 52
• Construction: sets policy and provides oversight (excluding the Dulles Toll Road)
for the capital construction program, construction management, environmental
issues, facilities development and historic preservation (excluding issues related
to the Metrorail project); reviews and makes recommendations to the Board for
construction management and design contracts over $3 million in
annual spending
• Master Plans: reviews and approves airport master plan changes, including
amendments to layout plans
• Noise: sets policy and provides oversight
• Real Property: sets policy and provides oversight regarding the development and
other uses of Airports Authority property; reviews and makes recommendations
to the Board on transactions, including land acquisition and disposal of Airports
Authority property and easements, except as related to the Toll Road and
Metrorail Project
• Regulations: reviews and makes recommendations to the Board on regulations
(except for areas specifically within the jurisdiction of other committees)
• Strategic Plans: sets policy and provides oversight on Airports Authority strategic
framework
Committees (at the call of the committee chair)
Ethics Review Committee
• Provides guidelines for Code of Ethical Responsibilities in accordance with the
Board ethics policy and bylaws
• Reviews all code of ethics reports and provides oversight on recommendations
made by the ethics officer regarding allegations of violations
• Conducts further inquiry and refers matters to the Board as necessary
Executive and Governance Committee
• Establishes governance policies and regulations for the Airports Authority
• Provides oversight and makes recommendations to the Board, including the
following areas:
- Airport revenue uses/diversion
- Board and committee meeting policies and procedures
- Board and employee Business Expense Policy
- Board and employee ethics policies
- Bylaws
- Delegations of authority to the Board and/or president and CEO
- Director indemnification
- Document management
- Executive staff employment agreements
GOVERNANCE 53
- Freedom of Information
- Government relations
- Marketing and branding
• Resolutions
• Evaluates and sets annual compensation for the president and CEO,
vice president and secretary, vice president for audit, and Office of Audit staff
• Plans for the Board retreat
Human Resources Committee
• Employees: sets policy and provides oversight regarding organizational
framework and compensation and benefits; reviews and makes
recommendations to the Board regarding insurance (e.g. employee health
insurance) for contracts over $3 million in annual spending
• Human Capital Development: provides oversight of training and development
of existing employees and management; develops opportunities for internships
or apprenticeships
• Labor: sets policy and provides oversight on union agreements
• Regulations: reviews and makes recommendations to the Board, except for
areas specifically within the jurisdiction of other committees
Nominations Committee
• Recommends a slate of candidates for the selection of Board officers at the
annual meeting of the Board
Risk Management Committee
• Audit related:
- Approves the audit activities of the vice president for audit with respect to the
annual risk assessment and audit plan, as well as the audit activities of the
external independent auditors
- Determines duties and responsibilities of the vice president for audit
- Makes recommendations to the Board on the selection of the vice president
of audit with the advice and recommendation of the president and CEO
• Provides policy and oversight, reviews audit results and monitors the
implementation of recommendations
• Internal Controls and Risk Management: sets policy and provides oversight
relating to all internal controls and risk management not specifically within the
jurisdiction of other committees, including implementation of enterprise
resource planning, insurance coverage and application of the
Sarbanes-Oxley Act
• Legal-related: establishes procedures and policies for the engagement of
attorneys by the Airports Authority, including rates and other terms of
engagement. Provides litigation oversight, guidance and approval when
necessary
GOVERNANCE 54
Sustainability Committee
• Reviews and makes recommendations to the Risk Management Committee
regarding the Airports Authority’s energy audit and project execution plan
• Reviews and makes recommendations to the Board on sustainability issues
within the Airports Authority’s Design Manual
• Recommends policy and provides oversight for the Airports Authority’s:
- Corporate Sustainability Plan
- Corporate sustainability goals and initiatives that incorporate beneficial
environmental, economic and social aspects
• Comprehensive strategies to achieve waste, energy, water quality and air quality
sustainability goals for facilities, equipment, vehicles and airport operations.
GOVERNANCE 55
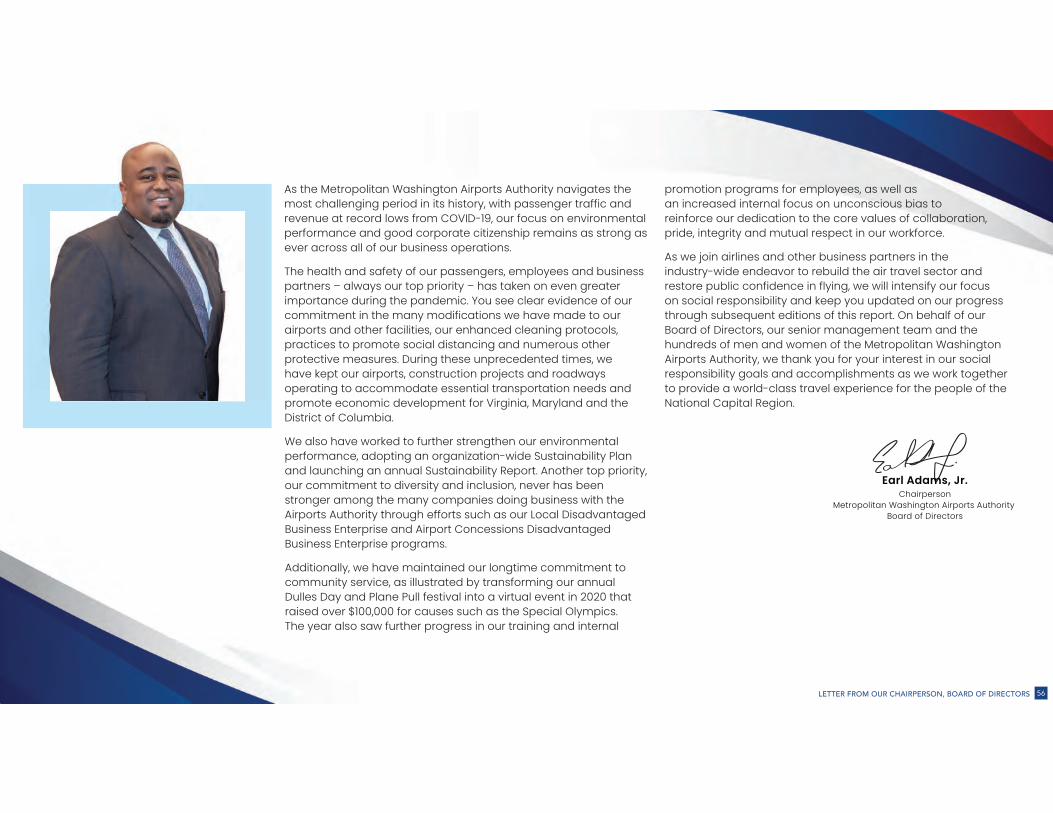
As the Metropolitan Washington Airports Authority navigates the most challenging period in its history, with passenger traffic and revenue at record lows from COVID-19, our focus on environmental performance and good corporate citizenship remains as strong as ever across all of our business operations.
The health and safety of our passengers, employees and business partners – always our top priority – has taken on even greater importance during the pandemic. You see clear evidence of our commitment in the many modifications we have made to our airports and other facilities, our enhanced cleaning protocols, practices to promote social distancing and numerous other protective measures. During these unprecedented times, we have kept our airports, construction projects and roadways operating to accommodate essential transportation needs and promote economic development for Virginia, Maryland and the District of Columbia.
We also have worked to further strengthen our environmental performance, adopting an organization-wide Sustainability Plan and launching an annual Sustainability Report. Another top priority, our commitment to diversity and inclusion, never has been stronger among the many companies doing business with the Airports Authority through efforts such as our Local Disadvantaged Business Enterprise and Airport Concessions Disadvantaged Business Enterprise programs.
Additionally, we have maintained our longtime commitment to community service, as illustrated by transforming our annual Dulles Day and Plane Pull festival into a virtual event in 2020 that raised over $100,000 for causes such as the Special Olympics. The year also saw further progress in our training and internal
ChairpersonMetropolitan Washington Airports Authority
Board of Directors
promotion programs for employees, as well as an increased internal focus on unconscious bias to reinforce our dedication to the core values of collaboration, pride, integrity and mutual respect in our workforce.
As we join airlines and other business partners in the industry-wide endeavor to rebuild the air travel sector and restore public confidence in flying, we will intensify our focus on social responsibility and keep you updated on our progress through subsequent editions of this report. On behalf of our Board of Directors, our senior management team and the hundreds of men and women of the Metropolitan Washington Airports Authority, we thank you for your interest in our social responsibility goals and accomplishments as we work together to provide a world-class travel experience for the people of the National Capital Region.
Earl Adams, Jr.
56LETTER FROM OUR CHAIRPERSON, BOARD OF DIRECTORS
New Photo
MWAA.COMYour Journey Begins with Us