Metropolitan Transportation Authority
19
Metropolitan Transportation Authority November 2008 Financial Plan 2009-2012 1 03/22/22 13:25 1 Metropolitan Transportation Authority November 20, 2008 MTA 2009 Final Proposed Budget November Financial Plan 2009-2012 DJC
-
Upload
linus-barry -
Category
Documents
-
view
29 -
download
0
description
MTA 2009 Final Proposed Budget November Financial Plan 2009-2012. DJC. November 20, 2008. Metropolitan Transportation Authority. 1. July Financial Plan Closing Cash Balance ($ in millions). What got better? What got worse? ($ in millions). Deficit Prior to Gap Closing ($ in millions). - PowerPoint PPT Presentation
Transcript of Metropolitan Transportation Authority
Metropolitan Transportation AuthorityNovember 2008 Financial Plan 2009-2012
104/19/23 20:49
1Metropolitan Transportation Authority
November 20, 2008
MTA 2009Final Proposed Budget
November Financial Plan 2009-2012
DJC
Metropolitan Transportation AuthorityNovember 2008 Financial Plan 2009-2012
2
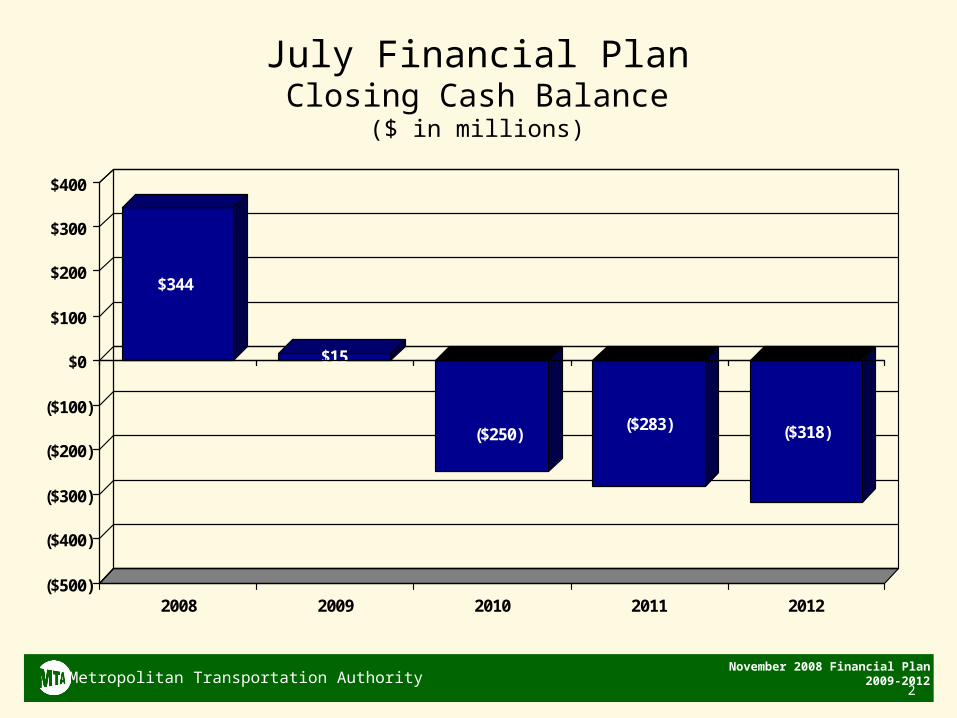
July Financial PlanClosing Cash Balance
($ in millions)
$344
$15
($250)($283) ($318)
($500)
($400)
($300)
($200)
($100)
$0
$100
$200
$300
$400
2008 2009 2010 2011 2012
Metropolitan Transportation AuthorityNovember 2008 Financial Plan 2009-2012
3
2008 2009 2010
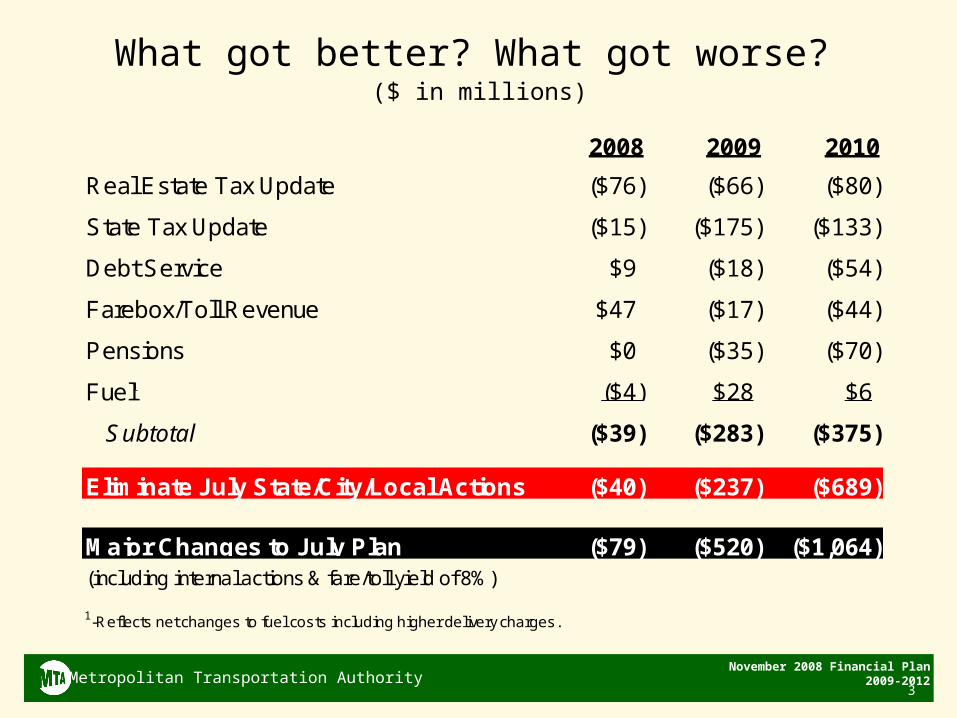
Real Estate Tax Update ($76) ($66) ($80)
State Tax Update ($15) ($175) ($133)
Debt Service $9 ($18) ($54)
Farebox/Toll Revenue $47 ($17) ($44)
Pensions $0 ($35) ($70)
Fuel1 ($4) $28 $6
SubtotalSubtotal ($39) ($283) ($375)
Eliminate July State/City/Local Actions ($40) ($237) ($689)
($79) ($520) ($1,064)(including internal actions & fare/toll yield of 8%)
1-Reflects net changes to fuel costs including higher delivery charges.
Major Changes to July Plan
What got better? What got worse? ($ in millions)
Metropolitan Transportation AuthorityNovember 2008 Financial Plan 2009-2012
4
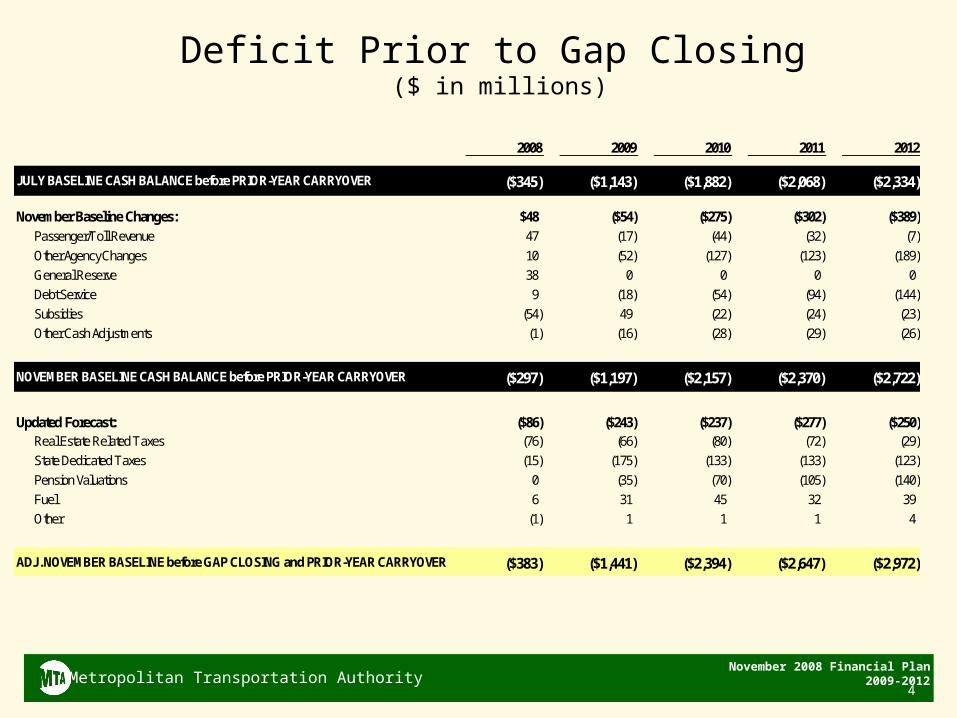
Deficit Prior to Gap Closing ($ in millions)
2008 2009 2010 2011 2012
JULY BASELINE CASH BALANCE before PRIOR-YEAR CARRYOVER ($345) ($1,143) ($1,882) ($2,068) ($2,334)
November Baseline Changes: $48 ($54) ($275) ($302) ($389)Passenger/Toll Revenue 47 (17) (44) (32) (7)Other Agency Changes 10 (52) (127) (123) (189)General Reserve 38 0 0 0 0Debt Service 9 (18) (54) (94) (144)Subsidies (54) 49 (22) (24) (23)Other Cash Adjustments (1) (16) (28) (29) (26)
NOVEMBER BASELINE CASH BALANCE before PRIOR-YEAR CARRYOVER ($297) ($1,197) ($2,157) ($2,370) ($2,722)
Updated Forecast: ($86) ($243) ($237) ($277) ($250)Real Estate Related Taxes (76) (66) (80) (72) (29)State Dedicated Taxes (15) (175) (133) (133) (123)Pension Valuations 0 (35) (70) (105) (140)Fuel 6 31 45 32 39Other (1) 1 1 1 4
ADJ. NOVEMBER BASELINE before GAP CLOSING and PRIOR-YEAR CARRYOVER ($383) ($1,441) ($2,394) ($2,647) ($2,972)
Metropolitan Transportation AuthorityNovember 2008 Financial Plan 2009-2012
5
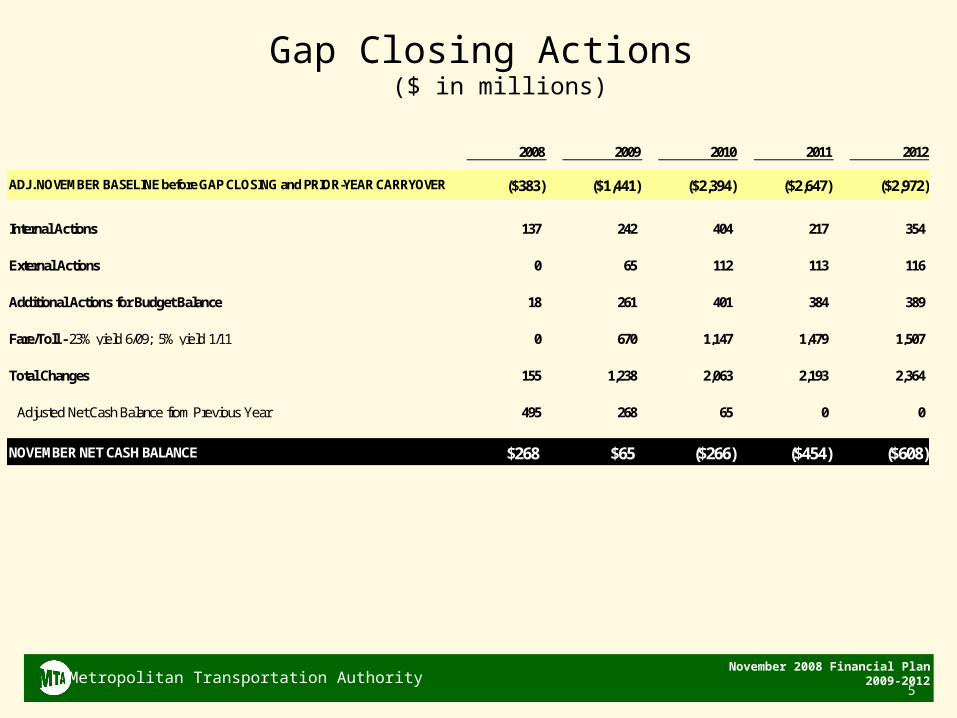
Gap Closing Actions ($ in millions)
2008 2009 2010 2011 2012
ADJ. NOVEMBER BASELINE before GAP CLOSING and PRIOR-YEAR CARRYOVER ($383) ($1,441) ($2,394) ($2,647) ($2,972)
Internal Actions 137 242 404 217 354
External Actions 0 65 112 113 116
Additional Actions for Budget Balance 18 261 401 384 389
Fare/Toll - 23% yield 6/09; 5% yield 1/11 0 670 1,147 1,479 1,507
Total Changes 155 1,238 2,063 2,193 2,364
Adjusted Net Cash Balance from Previous Year 495 268 65 0 0
NOVEMBER NET CASH BALANCE $268 $65 ($266) ($454) ($608)
Metropolitan Transportation AuthorityNovember 2008 Financial Plan 2009-2012
6
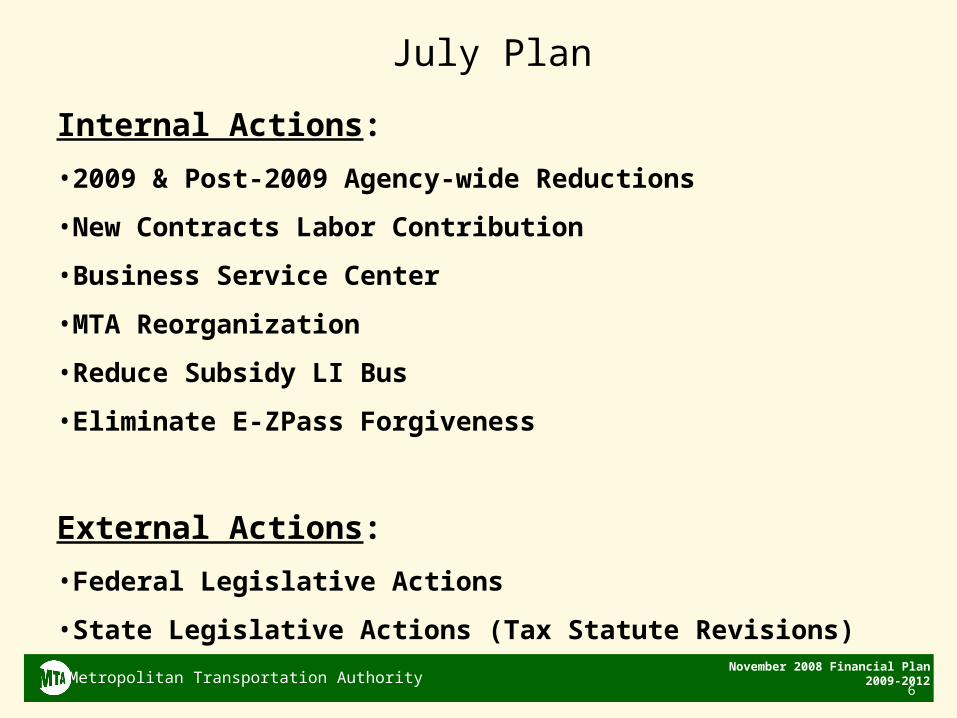
Internal Actions:
•2009 & Post-2009 Agency-wide Reductions
•New Contracts Labor Contribution
•Business Service Center
•MTA Reorganization
•Reduce Subsidy LI Bus
•Eliminate E-ZPass Forgiveness
External Actions:
•Federal Legislative Actions
•State Legislative Actions (Tax Statute Revisions)
July Plan
Metropolitan Transportation AuthorityNovember 2008 Financial Plan 2009-2012
7
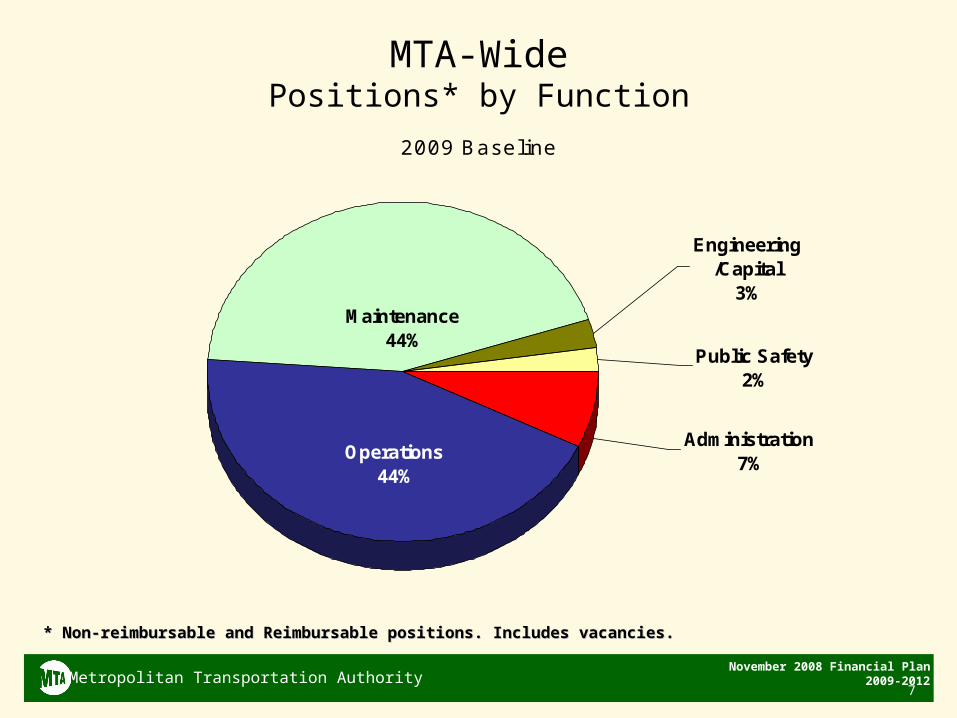
MTA-WidePositions* by Function
* Non-reimbursable and Reimbursable positions. Includes vacancies.* Non-reimbursable and Reimbursable positions. Includes vacancies.
2009 Baseline
Administration7%
Public Safety2%
Operations44%
Maintenance44%
Engineering/Capital
3%
Metropolitan Transportation AuthorityNovember 2008 Financial Plan 2009-2012
8
Managerial Cuts and Other Actions for Budget Balance
• Maximize administrative overhead reductions
– Managerial reductions greater than 5%
• Ensure safety, security, and reliability
• Fulfill fundamental mission of getting people where they need to go
Metropolitan Transportation AuthorityNovember 2008 Financial Plan 2009-2012
9
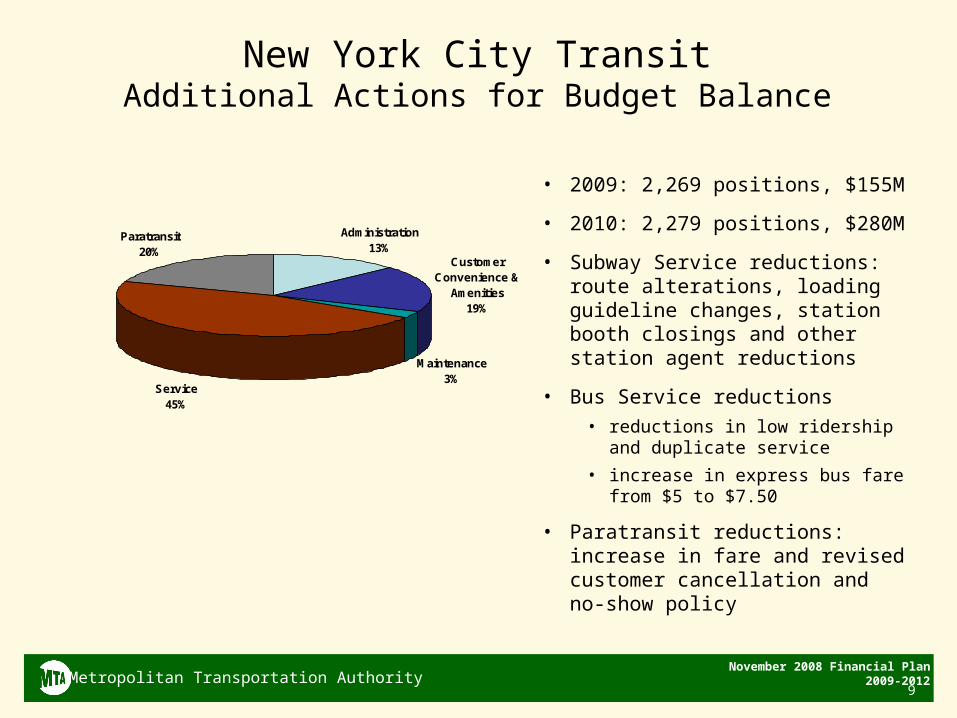
New York City TransitAdditional Actions for Budget Balance
• 2009: 2,269 positions, $155M
• 2010: 2,279 positions, $280M
• Subway Service reductions: route alterations, loading guideline changes, station booth closings and other station agent reductions
• Bus Service reductions
• reductions in low ridership and duplicate service
• increase in express bus fare from $5 to $7.50
• Paratransit reductions: increase in fare and revised customer cancellation and no-show policy
Administration13%
Customer Convenience &
Amenities19%
Maintenance3%
Paratransit20%
Service45%
Metropolitan Transportation AuthorityNovember 2008 Financial Plan 2009-2012
10
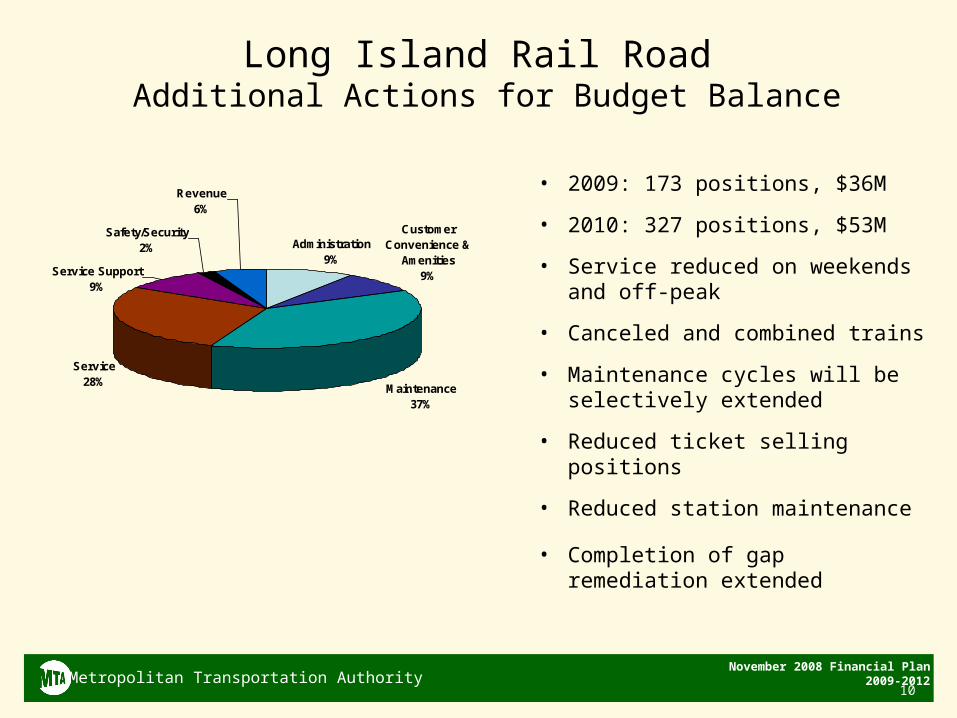
Long Island Rail Road Additional Actions for Budget Balance
• 2009: 173 positions, $36M
• 2010: 327 positions, $53M
• Service reduced on weekends and off-peak
• Canceled and combined trains
• Maintenance cycles will be selectively extended
• Reduced ticket selling positions
• Reduced station maintenance
• Completion of gap remediation extended
Customer Convenience &
Amenities9%
Maintenance37%
Service Support9%
Safety/Security2%
Revenue6%
Administration9%
Service28%
Metropolitan Transportation AuthorityNovember 2008 Financial Plan 2009-2012
11
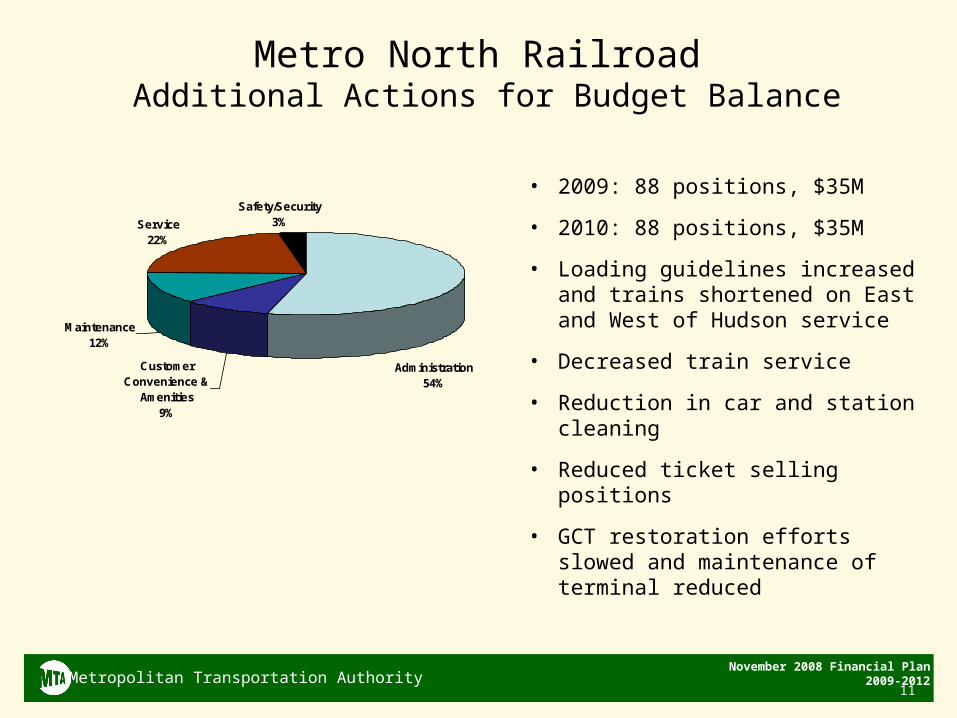
Metro North Railroad Additional Actions for Budget Balance
• 2009: 88 positions, $35M
• 2010: 88 positions, $35M
• Loading guidelines increased and trains shortened on East and West of Hudson service
• Decreased train service
• Reduction in car and station cleaning
• Reduced ticket selling positions
• GCT restoration efforts slowed and maintenance of terminal reduced
Customer Convenience &
Amenities9%
Maintenance12%
Safety/Security3%Service
22%
Administration54%
Metropolitan Transportation AuthorityNovember 2008 Financial Plan 2009-2012
12
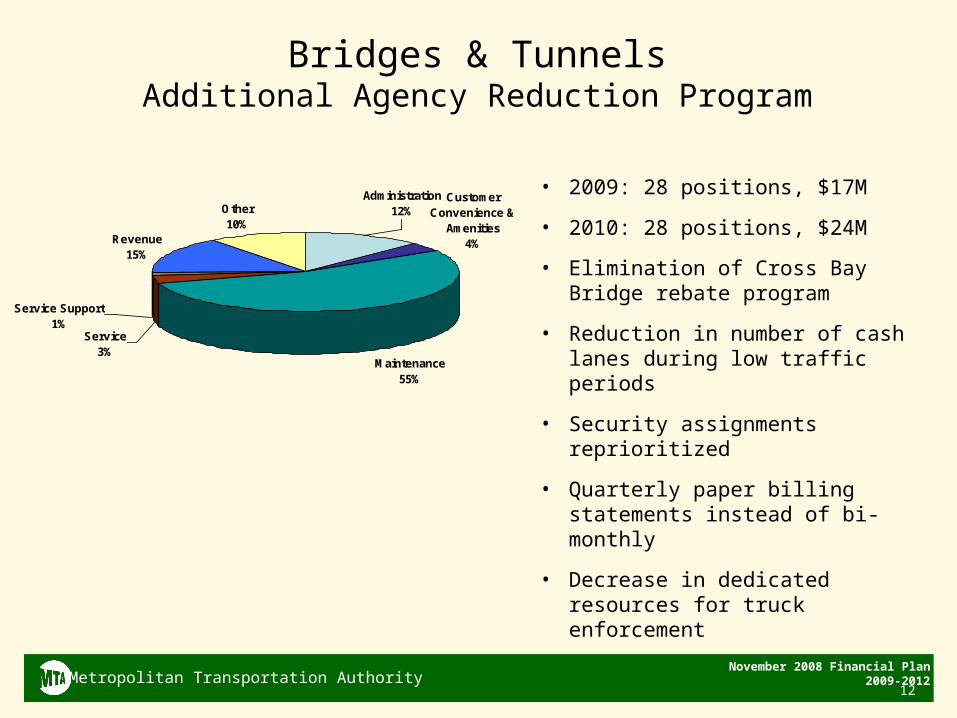
Bridges & TunnelsAdditional Agency Reduction Program
Customer Convenience &
Amenities4%
Maintenance55%
Revenue15%
Other10%
Service Support1%
Administration12%
Service3%
• 2009: 28 positions, $17M
• 2010: 28 positions, $24M
• Elimination of Cross Bay Bridge rebate program
• Reduction in number of cash lanes during low traffic periods
• Security assignments reprioritized
• Quarterly paper billing statements instead of bi-monthly
• Decrease in dedicated resources for truck enforcement
Metropolitan Transportation AuthorityNovember 2008 Financial Plan 2009-2012
13
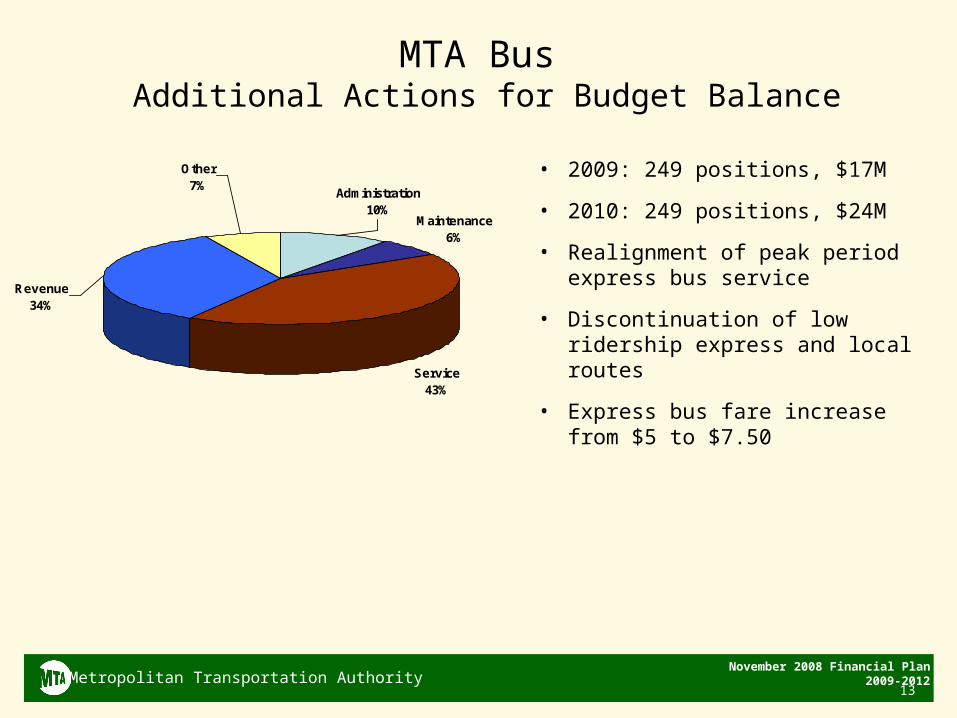
MTA Bus Additional Actions for Budget Balance
Maintenance6%
Service43%
Other7%
Administration10%
Revenue34%
• 2009: 249 positions, $17M
• 2010: 249 positions, $24M
• Realignment of peak period express bus service
• Discontinuation of low ridership express and local routes
• Express bus fare increase from $5 to $7.50
Metropolitan Transportation AuthorityNovember 2008 Financial Plan 2009-2012
14
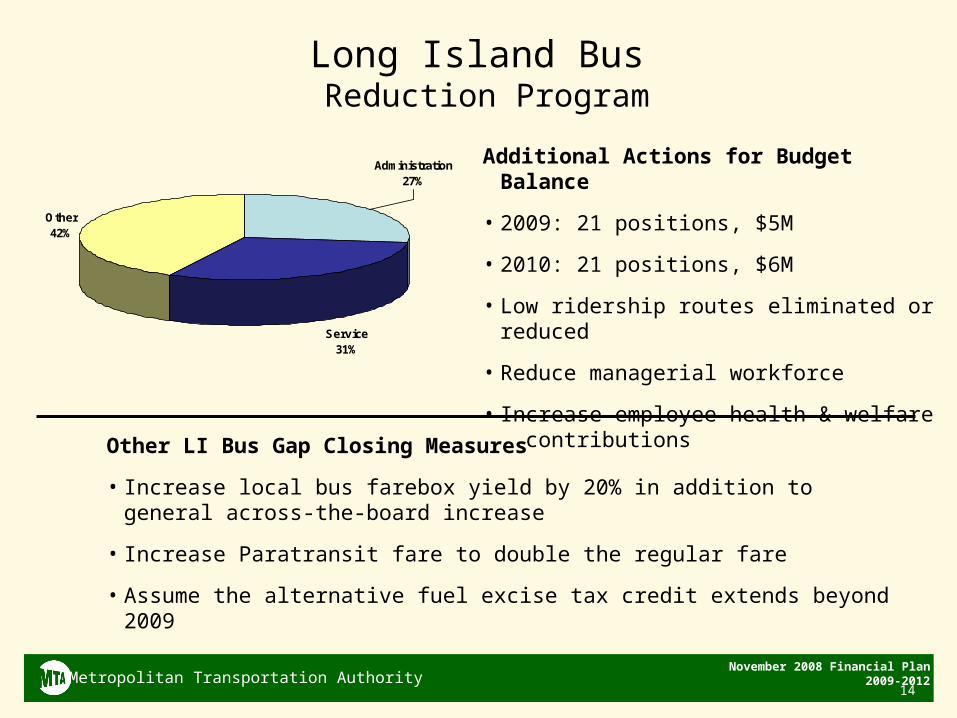
Long Island Bus Reduction Program
Service31%
Other42%
Administration27%
Additional Actions for Budget Balance
• 2009: 21 positions, $5M
• 2010: 21 positions, $6M
• Low ridership routes eliminated or reduced
• Reduce managerial workforce
• Increase employee health & welfare contributions
Other LI Bus Gap Closing Measures
• Increase local bus farebox yield by 20% in addition to general across-the-board increase
• Increase Paratransit fare to double the regular fare
• Assume the alternative fuel excise tax credit extends beyond 2009
Metropolitan Transportation AuthorityNovember 2008 Financial Plan 2009-2012
15
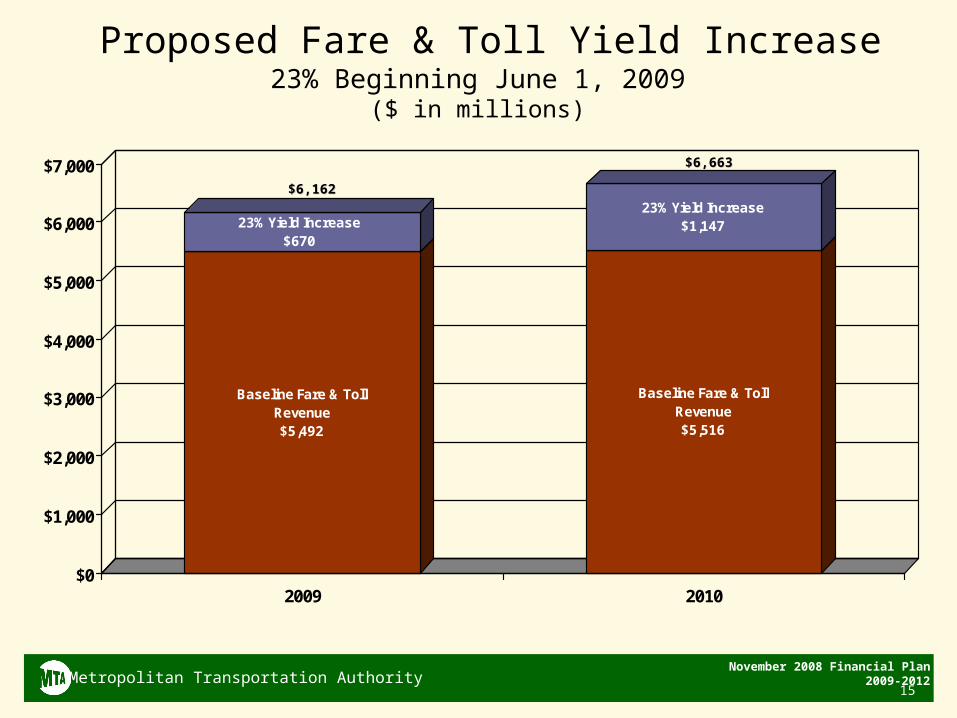
Proposed Fare & Toll Yield Increase23% Beginning June 1, 2009
($ in millions)
Baseline Fare & Toll Revenue$5,492
23% Yield Increase$670
Baseline Fare & Toll Revenue$5,516
23% Yield Increase$1,147
$0
$1,000
$2,000
$3,000
$4,000
$5,000
$6,000
$7,000
2009 2010
$6,162$6,162
$6,663$6,663
Metropolitan Transportation AuthorityNovember 2008 Financial Plan 2009-2012
16
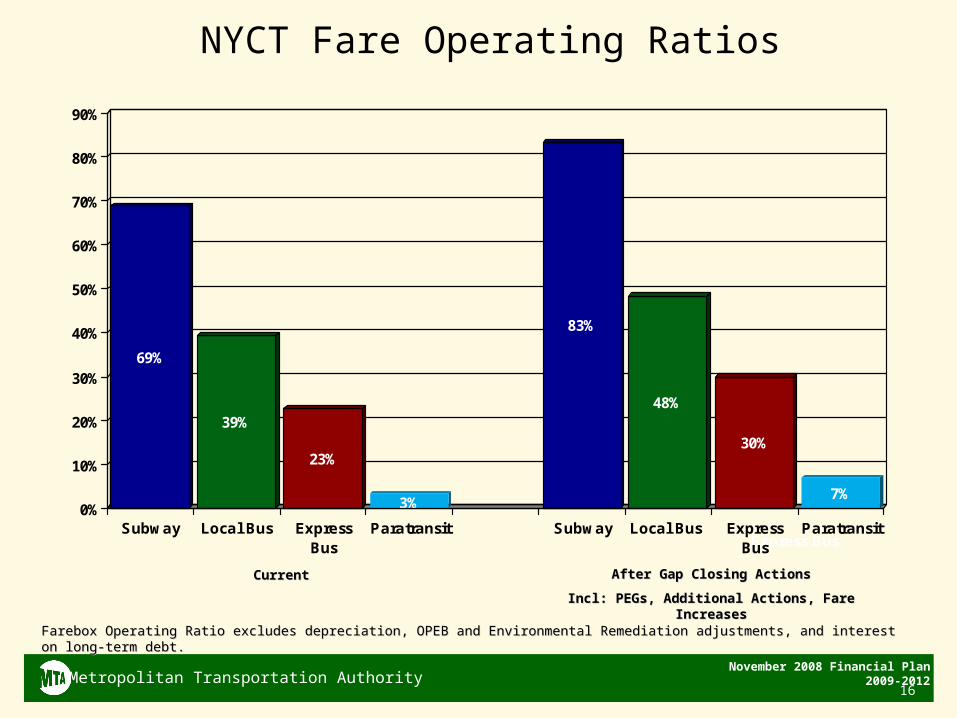
NYCT Fare Operating Ratios
69%
39%
Express Bus
23%
3%
83%
48%
30%
7%0%
10%
20%
30%
40%
50%
60%
70%
80%
90%
Subway Local Bus ExpressBus
Paratransit Subway Local Bus ExpressBus
Paratransit
CurrentCurrent After Gap Closing ActionsAfter Gap Closing Actions
Incl: PEGs, Additional Actions, Fare IncreasesIncl: PEGs, Additional Actions, Fare Increases
Farebox Operating Ratio excludes depreciation, OPEB and Environmental Remediation adjustments, and interest on long-term debt.Farebox Operating Ratio excludes depreciation, OPEB and Environmental Remediation adjustments, and interest on long-term debt.
Metropolitan Transportation AuthorityNovember 2008 Financial Plan 2009-2012
17
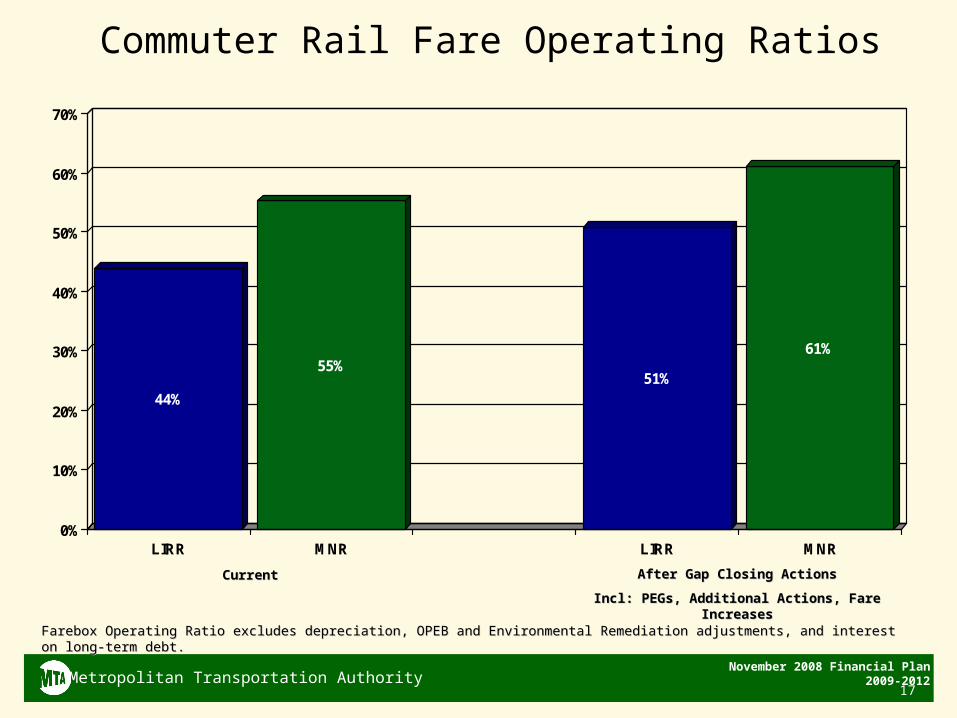
Commuter Rail Fare Operating Ratios
44%
55%51%
61%
0%
10%
20%
30%
40%
50%
60%
70%
LIRR MNR LIRR MNR
CurrentCurrent After Gap Closing ActionsAfter Gap Closing Actions
Incl: PEGs, Additional Actions, Fare IncreasesIncl: PEGs, Additional Actions, Fare Increases
Farebox Operating Ratio excludes depreciation, OPEB and Environmental Remediation adjustments, and interest on long-term debt.Farebox Operating Ratio excludes depreciation, OPEB and Environmental Remediation adjustments, and interest on long-term debt.
Metropolitan Transportation AuthorityNovember 2008 Financial Plan 2009-2012
18
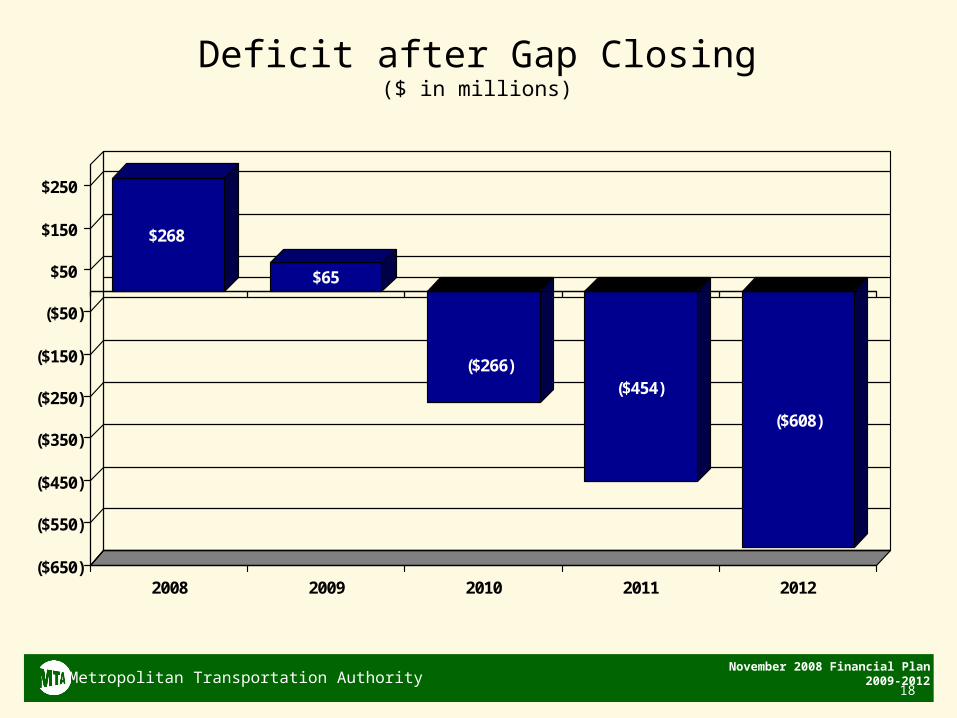
$268
$65
($266)($454)
($608)
($650)
($550)
($450)
($350)
($250)
($150)
($50)
$50
$150
$250
2008 2009 2010 2011 2012
Deficit after Gap Closing($ in millions)
Metropolitan Transportation AuthorityNovember 2008 Financial Plan 2009-2012
19
• Today
– MTA Board Authorization for public hearings
• Remainder of 2008
– Input from board members, elected officials, & public on Final Proposed 2009 budget.
– Release of Ravitch Commission report
– 2009 Budget Adoption
• January
– Public hearings for June 1, 2009 tariff and service changes
Process Going Forward