Metropolitan Transportation Authority Defined Benefit ...
56
Metropolitan Transportation Authority Defined Benefit Pension Plan (A Fiduciary Component Unit of the Metropolitan Transportation Authority) Financial Statements as of and for the Years Ended December 31, 2019 and 2018, Supplemental Schedules, and Independent Auditors’ Report
Transcript of Metropolitan Transportation Authority Defined Benefit ...
Metropolitan Transportation Authority Defined Benefit Pension Plan
(A Fiduciary Component Unit of the Metropolitan Transportation Authority)
Financial Statements as of and for the Years Ended December 31, 2019 and 2018, Supplemental Schedules, and Independent Auditors’ Report
METROPOLITAN TRANSPORTATION AUTHORITY DEFINED BENEFIT PENSION PLAN
TABLE OF CONTENTS
Page
INDEPENDENT AUDITORS’ REPORT 1-2
MANAGEMENT’S DISCUSSION AND ANALYSIS (UNAUDITED) 3-9
FINANCIAL STATEMENTS: Statements of Plan Net Position as of December 31, 2019 and 2018 10 Statements of Changes in Plan Net Position for the Years Ended December 31, 2019 and 2018 11 Notes to Financial Statements 12-50
REQUIRED SUPPLEMENTARY INFORMATION (UNAUDITED): Schedule of Changes in the Employers' Net Pension Liability and Related Ratios — Schedule I 51 Schedule of Employer Contributions — Schedule II 52-53 Schedule of Investment Returns — Schedule III 54
- 1 -
INDEPENDENT AUDITORS’ REPORT
To the Board of Managers of Pensions Metropolitan Transportation Authority Defined Benefit Pension Plan
Report on the Financial Statements
We have audited the accompanying statements of plan net position of the Metropolitan Transportation Authority Defined Benefit Pension Plan (the “Plan”) as of December 31, 2019 and 2018, and the related statements of changes in plan net position for the years then ended, and the related notes to the financial statements, which collectively comprise the Plan’s basic financial statements as listed in the table of contents.
Management’s Responsibility for the Financial Statements
Management is responsible for the preparation and fair presentation of these financial statements in accordance with accounting principles generally accepted in the United States of America; this includes the design, implementation, and maintenance of internal control relevant to the preparation and fair presentation of financial statements that are free from material misstatement, whether due to fraud or error.
Auditors’ Responsibility
Our responsibility is to express an opinion on these financial statements based on our audits. We conducted our audits in accordance with auditing standards generally accepted in the United States of America. Those standards require that we plan and perform the audits to obtain reasonable assurance about whether the financial statements are free from material misstatement.
An audit involves performing procedures to obtain audit evidence about the amounts and disclosures in the financial statements. The procedures selected depend on the auditor's judgment, including the assessment of the risks of material misstatement of the financial statements, whether due to fraud or error. In making those risk assessments, the auditor considers internal control relevant to the Plan's preparation and fair presentation of the financial statements in order to design audit procedures that are appropriate in the circumstances, but not for the purpose of expressing an opinion on the effectiveness of the Plan's internal control. Accordingly, we express no such opinion. An audit also includes evaluating the appropriateness of accounting policies used and the reasonableness of significant accounting estimates made by management, as well as evaluating the overall presentation of the financial statements.
We believe that the audit evidence we have obtained is sufficient and appropriate to provide a basis for our audit opinion.
Opinion
In our opinion, the financial statements referred to above present fairly, in all material respects, the plan net position as of December 31, 2019 and 2018, and the respective changes in plan net position for the
Deloitte & Touche LLP 30 Rockefeller Plaza New York, NY 10112 USA Tel: +1-212-492-4000 Fax: +1-212-489-1687 www.deloitte.com
- 2 -
years then ended in accordance with accounting principles generally accepted in the United States of America.
Other Matters Required Supplementary Information Accounting principles generally accepted in the United States of America require that the Management’s Discussion and Analysis on pages 3 through 9 and the Schedule of Changes in the Employers' Net Pension Liability and Related Ratios-Schedule I on page 51; Schedule of Employer Contributions-Schedule II on page 52-53; and Schedule of Investment Returns-Schedule III on page 54 be presented to supplement the basic financial statements. Such information, although not a part of the basic financial statements is required by the Governmental Accounting Standards Board who considers it to be an essential part of financial reporting for placing the basic financial statements in an appropriate operational, economic, or historical context. We have applied certain limited procedures to the required supplementary information in accordance with auditing standards generally accepted in the United States of America, which consisted of inquiries of management about the methods of preparing the information and comparing the information for consistency with management’s responses to our inquiries, the basic financial statements, and other knowledge we obtained during our audit of the basic financial statements. We do not express an opinion or provide any assurance on the information because the limited procedures do not provide us with sufficient evidence to express an opinion or provide any assurance.
July 22, 2020

- 3 -
METROPOLITAN TRANSPORTATION AUTHORITY DEFINED BENEFIT PENSION PLAN MANAGEMENT’S DISCUSSION AND ANALYSIS DECEMBER 31, 2019 AND 2018 (UNAUDITED)
This management’s discussion and analysis of the Metropolitan Transportation Authority Defined Benefit Pension Plan (the “Plan”) financial performance provides an overview of the Plan’s financial activities for the years ended December 31, 2019 and 2018. It is meant to assist the reader in understanding the Plan’s financial statements by providing an overall review of the financial activities during the two years and the effects of significant changes, as well as a comparison with the prior year’s activity and results. This discussion and analysis may contain opinions, assumptions, or conclusions by the MTA’s management that should not be considered a replacement for, and is intended to be read in conjunction with the Plan’s financial statements which begin on page 10.
Overview of Basic Financial Statements
The following discussion and analysis is intended to serve as an introduction to the Plan’s financial statements. The basic financial statements are:
The Statements of Plan Net Position — presents the financial position of the Plan at fiscal year-end. It provides information about the nature and amounts of resources with present service capacity that the Plan presently controls (assets), consumption of net assets by the Plan that is applicable to a future reporting period (deferred outflow of resources), present obligations to sacrifice resources that the Plan has little or no discretion to avoid (liabilities), and acquisition of net assets by the Plan that is applicable to a future reporting period (deferred inflow of resources) with the difference between assets/deferred outflow of resources and liabilities/deferred inflow of resources being reported as net position. Investments are shown at fair value. All other assets and liabilities are determined on an accrual basis.
The Statements of Changes in Plan Net Position - present the results of activities during the year. All changes affecting the assets and liabilities of the Plan are reflected on an accrual basis when the activity occurred regardless of the timing of the related cash flows. In that regard, changes in the fair values of investments are included in the year’s activity as net appreciation (depreciation) in fair value of investments.
The Notes to Financial Statements - provides additional information that is essential to a full understanding of the data provided in the financial statements. The notes present information about the Plan’s accounting policies, significant account balances and activities, material risks, obligations, contingencies, and subsequent events, if any.
Required Supplementary Information - as required by the Government Accounting Standards Board (“GASB”) includes the Schedule of Changes in the Employer’s Net Pension Liability and Related Ratios, Schedule of Employer Contributions, and Schedule of Investment returns.
The accompanying financial statements of the Plan are presented in conformity with accounting principles generally accepted in the United States of America as prescribed by the GASB.
- 4 -
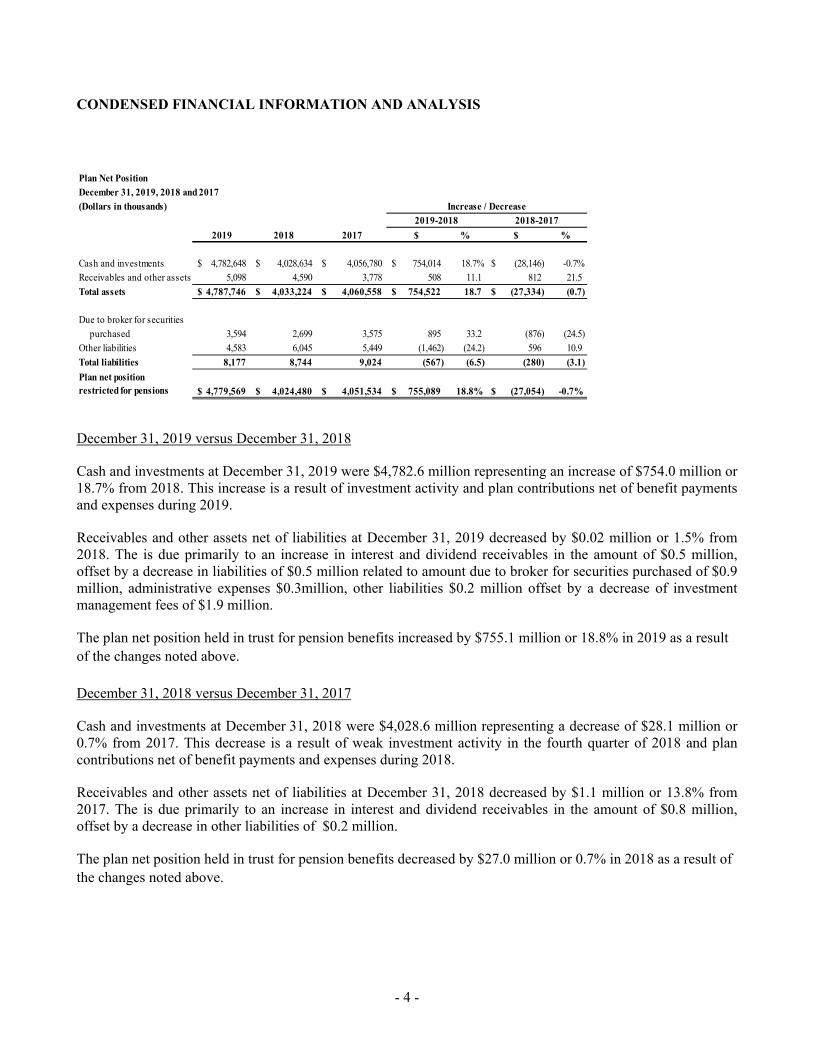
CONDENSED FINANCIAL INFORMATION AND ANALYSIS
Plan Net PositionDecember 31, 2019, 2018 and 2017
(Dollars in thousands)
2019 2018 2017 $ % $ %
Cash and investments 4,782,648$ 4,028,634$ 4,056,780$ 754,014$ 18.7% (28,146)$ -0.7%Receivables and other assets 5,098 4,590 3,778 508 11.1 812 21.5
Total assets 4,787,746$ 4,033,224$ 4,060,558$ 754,522$ 18.7 (27,334)$ (0.7)
Due to broker for securities
purchased 3,594 2,699 3,575 895 33.2 (876) (24.5)
Other liabilities 4,583 6,045 5,449 (1,462) (24.2) 596 10.9
Total liabilities 8,177 8,744 9,024 (567) (6.5) (280) (3.1)
4,779,569$ 4,024,480$ 4,051,534$ 755,089$ 18.8% (27,054)$ -0.7%
Increase / Decrease
2019-2018 2018-2017
Plan net position restricted for pensions
December 31, 2019 versus December 31, 2018
Cash and investments at December 31, 2019 were $4,782.6 million representing an increase of $754.0 million or 18.7% from 2018. This increase is a result of investment activity and plan contributions net of benefit payments and expenses during 2019.
Receivables and other assets net of liabilities at December 31, 2019 decreased by $0.02 million or 1.5% from 2018. The is due primarily to an increase in interest and dividend receivables in the amount of $0.5 million, offset by a decrease in liabilities of $0.5 million related to amount due to broker for securities purchased of $0.9 million, administrative expenses $0.3million, other liabilities $0.2 million offset by a decrease of investment management fees of $1.9 million.
The plan net position held in trust for pension benefits increased by $755.1 million or 18.8% in 2019 as a result of the changes noted above. December 31, 2018 versus December 31, 2017
Cash and investments at December 31, 2018 were $4,028.6 million representing a decrease of $28.1 million or 0.7% from 2017. This decrease is a result of weak investment activity in the fourth quarter of 2018 and plan contributions net of benefit payments and expenses during 2018.
Receivables and other assets net of liabilities at December 31, 2018 decreased by $1.1 million or 13.8% from 2017. The is due primarily to an increase in interest and dividend receivables in the amount of $0.8 million, offset by a decrease in other liabilities of $0.2 million.
The plan net position held in trust for pension benefits decreased by $27.0 million or 0.7% in 2018 as a result of the changes noted above.
- 5 -
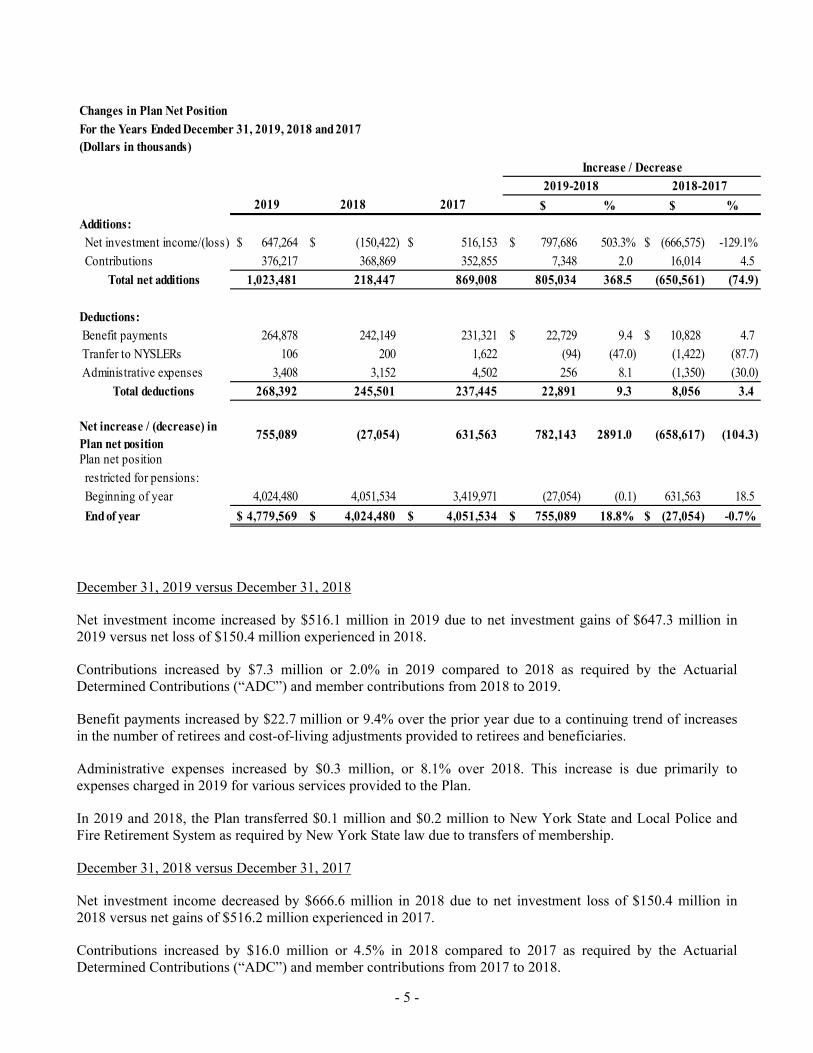
Changes in Plan Net PositionFor the Years Ended December 31, 2019, 2018 and 2017(Dollars in thousands)
2019 2018 2017 $ % $ %
Additions: Net investment income/(loss) 647,264$ (150,422)$ 516,153$ 797,686$ 503.3% (666,575)$ -129.1%
Contributions 376,217 368,869 352,855 7,348 2.0 16,014 4.5
Total net additions 1,023,481 218,447 869,008 805,034 368.5 (650,561) (74.9)
Deductions: Benefit payments 264,878 242,149 231,321 22,729$ 9.4 10,828$ 4.7
Tranfer to NYSLERs 106 200 1,622 (94) (47.0) (1,422) (87.7)
Administrative expenses 3,408 3,152 4,502 256 8.1 (1,350) (30.0)
Total deductions 268,392 245,501 237,445 22,891 9.3 8,056 3.4
Net increase / (decrease) in Plan net position
755,089 (27,054) 631,563 782,143 2891.0 (658,617) (104.3)
Plan net position restricted for pensions:
Beginning of year 4,024,480 4,051,534 3,419,971 (27,054) (0.1) 631,563 18.5
End of year 4,779,569$ 4,024,480$ 4,051,534$ 755,089$ 18.8% (27,054)$ -0.7%
Increase / Decrease2019-2018 2018-2017
December 31, 2019 versus December 31, 2018
Net investment income increased by $516.1 million in 2019 due to net investment gains of $647.3 million in 2019 versus net loss of $150.4 million experienced in 2018.
Contributions increased by $7.3 million or 2.0% in 2019 compared to 2018 as required by the Actuarial Determined Contributions (“ADC”) and member contributions from 2018 to 2019.
Benefit payments increased by $22.7 million or 9.4% over the prior year due to a continuing trend of increases in the number of retirees and cost-of-living adjustments provided to retirees and beneficiaries.
Administrative expenses increased by $0.3 million, or 8.1% over 2018. This increase is due primarily to expenses charged in 2019 for various services provided to the Plan.
In 2019 and 2018, the Plan transferred $0.1 million and $0.2 million to New York State and Local Police and Fire Retirement System as required by New York State law due to transfers of membership.
December 31, 2018 versus December 31, 2017
Net investment income decreased by $666.6 million in 2018 due to net investment loss of $150.4 million in 2018 versus net gains of $516.2 million experienced in 2017.
Contributions increased by $16.0 million or 4.5% in 2018 compared to 2017 as required by the Actuarial Determined Contributions (“ADC”) and member contributions from 2017 to 2018.
- 6 -
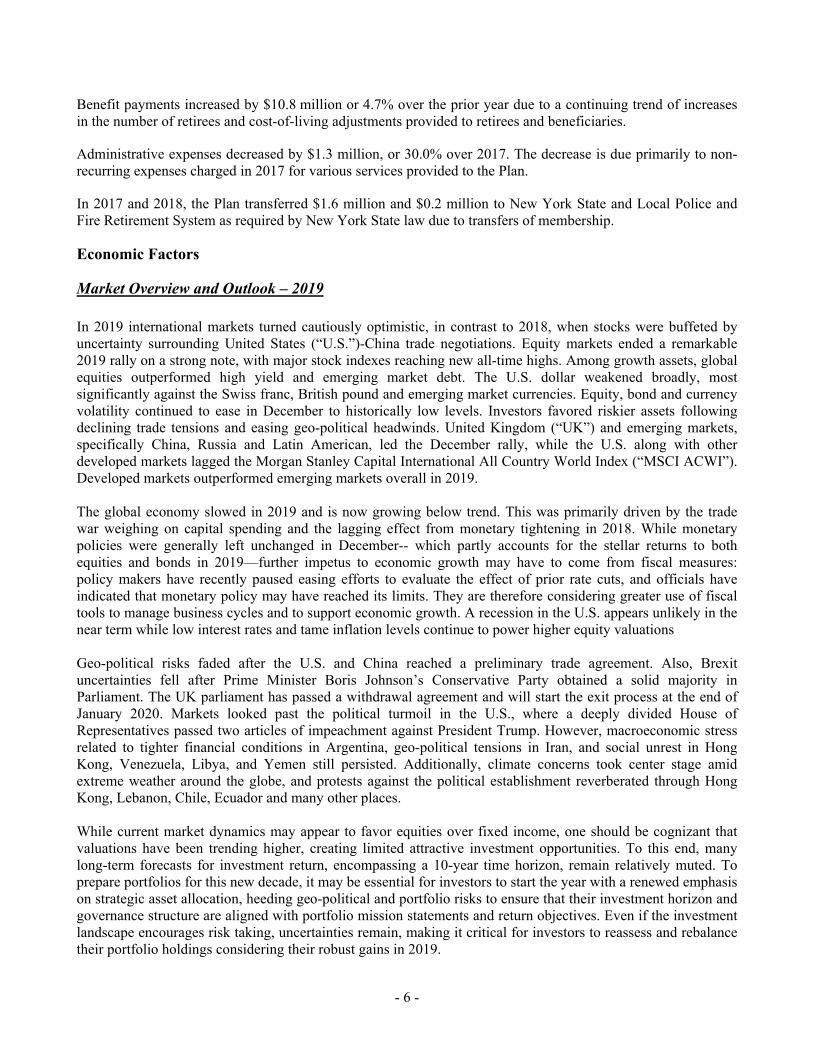
Benefit payments increased by $10.8 million or 4.7% over the prior year due to a continuing trend of increases in the number of retirees and cost-of-living adjustments provided to retirees and beneficiaries.
Administrative expenses decreased by $1.3 million, or 30.0% over 2017. The decrease is due primarily to non-recurring expenses charged in 2017 for various services provided to the Plan.
In 2017 and 2018, the Plan transferred $1.6 million and $0.2 million to New York State and Local Police and Fire Retirement System as required by New York State law due to transfers of membership.
Economic Factors
Market Overview and Outlook – 2019 In 2019 international markets turned cautiously optimistic, in contrast to 2018, when stocks were buffeted by uncertainty surrounding United States (“U.S.”)-China trade negotiations. Equity markets ended a remarkable 2019 rally on a strong note, with major stock indexes reaching new all-time highs. Among growth assets, global equities outperformed high yield and emerging market debt. The U.S. dollar weakened broadly, most significantly against the Swiss franc, British pound and emerging market currencies. Equity, bond and currency volatility continued to ease in December to historically low levels. Investors favored riskier assets following declining trade tensions and easing geo-political headwinds. United Kingdom (“UK”) and emerging markets, specifically China, Russia and Latin American, led the December rally, while the U.S. along with other developed markets lagged the Morgan Stanley Capital International All Country World Index (“MSCI ACWI”). Developed markets outperformed emerging markets overall in 2019. The global economy slowed in 2019 and is now growing below trend. This was primarily driven by the trade war weighing on capital spending and the lagging effect from monetary tightening in 2018. While monetary policies were generally left unchanged in December-- which partly accounts for the stellar returns to both equities and bonds in 2019—further impetus to economic growth may have to come from fiscal measures: policy makers have recently paused easing efforts to evaluate the effect of prior rate cuts, and officials have indicated that monetary policy may have reached its limits. They are therefore considering greater use of fiscal tools to manage business cycles and to support economic growth. A recession in the U.S. appears unlikely in the near term while low interest rates and tame inflation levels continue to power higher equity valuations Geo-political risks faded after the U.S. and China reached a preliminary trade agreement. Also, Brexit uncertainties fell after Prime Minister Boris Johnson’s Conservative Party obtained a solid majority in Parliament. The UK parliament has passed a withdrawal agreement and will start the exit process at the end of January 2020. Markets looked past the political turmoil in the U.S., where a deeply divided House of Representatives passed two articles of impeachment against President Trump. However, macroeconomic stress related to tighter financial conditions in Argentina, geo-political tensions in Iran, and social unrest in Hong Kong, Venezuela, Libya, and Yemen still persisted. Additionally, climate concerns took center stage amid extreme weather around the globe, and protests against the political establishment reverberated through Hong Kong, Lebanon, Chile, Ecuador and many other places. While current market dynamics may appear to favor equities over fixed income, one should be cognizant that valuations have been trending higher, creating limited attractive investment opportunities. To this end, many long-term forecasts for investment return, encompassing a 10-year time horizon, remain relatively muted. To prepare portfolios for this new decade, it may be essential for investors to start the year with a renewed emphasis on strategic asset allocation, heeding geo-political and portfolio risks to ensure that their investment horizon and governance structure are aligned with portfolio mission statements and return objectives. Even if the investment landscape encourages risk taking, uncertainties remain, making it critical for investors to reassess and rebalance their portfolio holdings considering their robust gains in 2019.
- 7 -
Macro Themes Asset allocation and portfolio implementation. Late stage of a market cycle. China’s complex transition into a service and consumption-oriented economy from the manufacturing
behemoth. The backlash against globalization—expressed through populism and trade wars—is here to stay. Central banks permanent interventions have created a new normal, where accommodative monetary
policies and fiscal debt growth appear to exist in perpetuity, supporting equities relative to fixed income. United States 2019 represented a triumphant year the U.S. capital markets compared to 2018 underperformance. Accommodative monetary policies, falling interest rates and subdued inflation helped investors not only to meet their return objectives, but, in many instances, to exceed them. Adding to this impressive string of wins: the U.S. economy completed a calendar decade without a recession—a historical first. While investors would love more of the same, it is unlikely this period of windfall gains and low market volatility will persist for the next decade. Large Cap stocks were strongly positive, with the S&P 500 and Russell 1000 indices posting returns of (+31.5%) and (+31.3%), respectively. Small Cap and Mid Cap indices underperformed large cap. Small Cap, as measured by the Russell 2500 Index, returned (+27.6%). The Russell Mid Cap Index measured by the Russell 2000 Index lagged the Small Cap and posted a return of (+25.4%). Of note, growth-oriented investments outperformed the value counterpart with the Russell 1000 Growth (+36.2%) outpacing the Russell 1000 Value (+26.4%). Fixed income securities markets ended 2019 in the black, reversing declines experienced in 2018. Treasuries returned (+14.8%) for the year, with the assets strongest quarter coming in the first and second quarters of 2019. Municipal credit posted a return of (+7.5%) while the Bloomberg Barclays High Yield Index gained (+14.3%) in 2019. Spreads on high-yield credit narrowed for most part of 2019, but segments in the high-yield and bank loan markets showed signs of stress towards the end of 2019. On the other hand, the S&P LSTA Leveraged Loan Index returned (+10.6%) during the same period.
International Developed
International equity markets posted very strong results in 2019 and lagged behind U.S. equity markets, returning (+26.5%) as measured by the MSCI. In U.S. dollars, both Europe and Japan equities posted positive performance in 2019 with MSCI Europe returning (+23.7%) and MSCI Japan returning (+19.5%). Very strong returns in Europe were driven by the global positive market performance during 2019 unlike 2018 when Europe returned (-14.9%). The Small Cap portion of international developed markets posted even stronger returns in 2019, (+24.9%) compared with 2018, (-17.9%). Fixed income markets in Europe and Japan are largely centered on government bonds, with corporate and asset-backed issuance making up a fraction of the overall markets. Global Treasuries were positive in 2019, following a negative year in 2018. Emerging Markets Emerging markets posted very strong returns in 2019, with performance lower than both U.S. and international developed markets across equity and debt. The broad MSCI emerging markets index returned (+18.3%) for the year. Emerging markets gained sharply in December, driven by hopes that the People’s Bank of China will continue to ease its monetary policy to support growth. The bond markets of emerging markets performed well in 2019 compared to its underperformance in 2018. Both hard currency and local currency bond posted a very strong year in performance. Hard currency bonds, which are predominately issued in U.S. dollars, returned (+12.6%) in 2019. Local currency bonds, which are issued in the local currency, returned (+13.5%) for the year.

- 8 -
Commodities The Bloomberg Commodity Index rose (+7.7%) for the year while the New York Mercantile Exchange West Texas Index Crude Spot rose (+35.3%) and Midstream energy ended the year up more than (+24.0%). Residential gas prices in the Midwest are forecast to be nearly (+8.0%) higher this winter than last, and prices in the South and West are seen about (+5.0%) and (+3.0%) higher, respectively, while Northeast prices are forecast to decline (6.0%), helped by relatively low global prices for Liquefied Natural Gas and lower household natural gas consumption. The overall slight decline in heating expenses is aided by generally declining commodity prices. Market Outlook Central banks and governments have demonstrated, to varying degrees, their willingness to administer monetary and fiscal stimulus. That accommodative stance should continue in 2020. The U.S. Federal Reserve has already signaled its intention to keep interest rates on hold, providing more certainty for businesses. The re-convergence of U.S. interest rates with other developed markets will reduce upward pressure on the dollar. In addition, the impact of looser monetary policy, combined with a better trade backdrop, could spur the necessary investment and reform to fuel increased labor force participation and renewed productivity improvements. Political risk, both at national and international levels, remains the great unknown. The long-term path of U.S.-China trade and cooperation is uncertain. A damaging “no-deal Brexit” is not entirely off the table. Tensions in the Middle East could risk sparking full-blown conflict. At the same time, 2020 primaries and Presidential elections in the U.S. will create uncertainty and could cause volatility as markets react to the policies and promises of the various candidates. Notwithstanding all of this, however, the current improvement in geo-political backdrop as compared with 2018, together with stimulus measures should support a modest acceleration in global growth in 2020. That growth, in turn, should lead to a moderate increase in demand for oil, putting a floor under the price, especially when global demand is met with sensible supply-side control from Organization of the Petroleum Exporting Countries. Many analysts continue to believe emerging markets offer the most investment value, especially following the recent truce in trade relations between the U.S. and China. Furthermore, the opportunities for active management and excess returns appear more abundant in emerging economies. As a result, investors may be encouraged to overweight emerging market equities relative to developed market stocks. They may also opt to reduce exposure to high-yield and return-seeking credit in 2020, since market returns do not offer adequate compensation for the risk they hold. Safe-haven fixed income for instance, Treasuries and core bonds, despite low yields—remain vital for balancing risks within a diversified portfolio. Impact of Covid-19 Covid-19 has continued to spread at a rapid pace around the world and has now been declared a global pandemic by the World Health Organization. This has caused a severe shock to the global economy pushing it into a deep and far reaching recession. Financial markets have responded with a huge drop in equities values, a rise in credit spreads and a flight to the safety of governments bonds. In anticipation of the economic growth fallout, Standards & Poor’s Global ratings lowered its forecast for global growth to just (+0.4%) this year and predicts a rebound to (+) in 2021. According to Bloomberg, the current second Quarter Gross Domestic Product average estimate of (-11.2%) annualized would be the worst post World War II quarter on record. However, worldwide central banks and governments announced fiscal and monetary rescue packages to soften the economic impact of the virus and the associated business disruptions. Geo-political tensions such as the trade war issues between the U.S. and China have moved into the background. The Covid-19 outbreak has resulted in a significant decline in ridership and vehicle crossings. The decline in ridership and vehicle crossings have caused a material impact on the Metropolitan Transportation Authority’s (“MTA”) results of operations, financial position, and cash flows in fiscal 2020. In response to the adverse conditions, the MTA has secured funding under the “Coronavirus Aid, Relief and Economic Security Act” or
- 9 -
“CARES Act”; received State of New York authorization to increase debt issuing capacity, including $10 billion in deficit bonds; received State of New York authorization to use the Central Business District Tolling lockbox monies to fund COVID-19 operating costs; and has been granted flexibility to apply existing FTA grant program proceeds to operating costs or other purposes to address COVID-19 impacts. In addition, the volatility and uncertainty of the financial market have negatively affected the investment earnings of retirement plans. Although the long-term impact of the Covid-19 outbreak on the financial market is still unpredictable, it could have a negative impact on the market value of the Plan in future years. Contact Information This financial report is designed to provide a general overview of the Metropolitan Transportation Authority Defined Benefit Pension Plan’s finances. Questions concerning any data provided in this report or requests for additional information should be directed to the Comptroller, Metropolitan Transportation Authority, 2 Broadway, 16th Floor, New York, NY 10004.
* * * * * *

- 10 -
METROPOLITAN TRANSPORTATION AUTHORITYDEFINED BENEFIT PENSION PLAN
STATEMENTS OF PLAN NET POSITIONAS OF DECEMBER 31, 2019 AND 2018(In tnousands)
2019 2018
ASSETS:Cash 6,892$ 13,224$ Investments at fair value (Notes 2 and 3): Investments measured at readily determined fair value 999,705 787,191 Investments measured at net asset value 3,776,051 3,228,219
Total investments 4,775,756 4,015,410
Receivables: Accrued interest and dividends 2,949 2,745 Other receivable 2,149 1,845
Total receivables 5,098 4,590
Total assets 4,787,746 4,033,224
LIABILITIES: Due to broker for securities purchased 3,594 2,699 Due to broker for investment fee 717 2,667 Due to broker for administrative expenses 220 267 Due to MTA for administrative expenses 3,130 2,818 Other liabilities 516 293
Total liabilities 8,177 8,744
PLAN NET POSITION RESTRICTED FOR PENSIONS 4,779,569$ 4,024,480$
See notes to financial statements.

- 11 -
METROPOLITAN TRANSPORTATION AUTHORITYDEFINED BENEFIT PENSION PLAN
STATEMENTS OF CHANGES IN PLAN NET POSITIONFOR THE YEARS ENDED DECEMBER 31, 2019 AND 2018(In thousands)
2019 2018
ADDITIONS: Investment (loss) / income: Net realized and unrealized gains / (losses) 608,991$ (169,255)$ Dividends 48,512 56,670 Interest 12,628 9,254
Total investment income / (loss) 670,131 (103,331) Less: Investment expenses (22,867) (47,091)
Net investment income / (loss) 647,264 (150,422)
Contributions: Employer: Metro-North Commuter Railroad Company 123,663 116,005 Long Island Rail Road Company 121,740 114,854 Metropolitan Transportation Authority Headquarters 32,299 42,967 MTA Bus Company 59,768 57,264 Staten Island Rapid Transit Operating Authority 7,244 7,877 Employee 31,503 29,902
Total contributions 376,217 368,869
Total additions 1,023,481 218,447
DEDUCTIONS: Benefits paid to participants 264,878 242,149 Transfer of MTA Police Employer & Employee Contributions to NYSLERS 106 200 Administrative expenses 3,408 3,152
Total deductions 268,392 245,501
NET INCREASE / (DECREASE) IN PLAN NET POSITION 755,089 (27,054)
PLAN NET POSITION RESTRICTED FOR PENSIONS Beginning of year 4,024,480 4,051,534 End of year 4,779,569$ 4,024,480$
See notes to financial statements.
- 12 -
METROPOLITAN TRANSPORTATION AUTHORITY DEFINED BENEFIT PENSION PLAN
NOTES TO FINANCIAL STATEMENTS AS OF AND FOR THE YEARS ENDED DECEMBER 31, 2019 AND 2018
1. PLAN DESCRIPTION
The following brief description of the Metropolitan Transportation Authority (the “Authority”) Defined Benefit Pension Plan (the “Plan”) is provided for general information purposes only. Participants should refer to the Plan document for more complete information.
General — The Plan represents a cost-sharing employer defined benefit pension plan sponsored by the Authority and administered by the Board of Managers of Pensions, covering:
(a) management employees of the Long Island Rail Road Company (“MTA Long Island Rail Road”) hired after January 1, 1988 not governed by collective bargaining agreements;
(b) management employees of the Metro-North Commuter Railroad Company (“MTA Metro-North Railroad”) not governed by collective bargaining agreements;
(c) represented MTA Long Island Rail Road employees hired after January 1, 1988, covered by collective bargaining agreements which provide for participation in the plan effective January 1, 2004;
(d) certain represented MTA Metro-North Railroad employees covered by collective bargaining agreements which provide for participation in the plan effective on or after January 1, 2004;
(e) represented and non-represented MTA Long Island Rail Road employees hired prior to January 1, 1988;
(f) Metropolitan Suburban Bus Authority (“MTA Long Island Bus”) provided public service in Nassau and Queens Counties. The Authority’s Lease and Operating Agreement with Nassau County, dated January 15, 1973, as amended, was terminated effective December 31, 2011. As of January 1, 2012, the MTA Long Island Bus is no longer a member of the MTA Group. Represented and management Metropolitan Suburban Bus Authority (“MTA Long Island Bus”) employees hired prior to January 24, 1983 and any MTA Long Island Bus person employed by the MSBA Employees’ Pension Trust prior to July 29, 1998 under the MSBA Employees’ Pension Plan remained vested employees in the plan;
(g) represented and management employees of the Staten Island Rapid Transit Operating Authority (“MTA Staten Island Railway”) effective January 1st, 2005;
(h) certain represented and management employees of MTA Bus Company (“MTA Bus”), including represented and non-represented employees who were formerly employed by Liberty Lines Express, Inc., New York Bus Tours, Inc., Command Bus Company, Green Bus Lines Inc., Jamaica Buses Inc., Triboro Coach Corporation and represented and most non-represented employees formerly employed by Queens Surface Corporation; and
(i) participants in the MTA Defined Benefit Pension Plan 20 Year Police Retirement program (“MTA Police”).
The Plan contains multiple and distinct benefit structures for MTA Metro-North Railroad and MTA Long Island Rail Road management employees, for MTA Metro-North Railroad and MTA Long Island
- 13 -
Rail Road represented employees, MTA Police, MTA Long Island Bus employees and MTA Staten Island Railway employees. In addition, there are multiple but distinct benefit structures for the employees of MTA Bus which are based on the plans covering those employees prior to their becoming MTA Bus employees. MTA Bus non-represented employees and employees represented by the UTLO are covered by separate programs. Assets and liabilities are pooled and a single cash contribution amount and annual pension cost is determined. The Plan is designed to satisfy the applicable requirements for governmental plans under Section 401(a) and 501(b) of the Internal Revenue Code. Accordingly, the Plan is tax-exempt and is not subject to the provisions of the Employee Retirement Income Security Act (“ERISA”) of 1974.
Membership of the Plan consisted of the following as of January 1, 2019 and 2018, respectively, the date of the latest actuarial valuations:
2019 2018
Active Plan Members 19,074 18,631 Retirees and beneficiaries receiving benefits 11,249 11,132 Vested formerly active members not yet receiving benefits 1,481 1,472
Total 31,804 31,235
Funding for the Plan is provided by the Authority, MTA Metro-North Railroad, MTA Long Island Rail Road, MTA Bus and MTA Staten Island Railway which are public benefit corporations that receive a significant portion of their operating and capital financing requirements from New York City, New York State, federal and regional governmental units and from the sale of bonds to the public. Certain funding is made on a discretionary basis. The continuance of funding for the Plan has been, and will continue to be, dependent upon the receipt of adequate funds.
Plan Administration – The Defined Benefit Plan is administered by the Board of Managers of Pensions which is comprised of:
(a) the persons holding the following positions: (j) the Chairman of the MTA; (ii) the MTA Chief Financial Officer; (iii) the MTA Director of Labor Relations; and (iv) the agency head of each participating Employer.
(b) Designation of Others – Any member of the Board of Managers, serving as such by virtue of
holding a position described in (a) of this section, may, by written authorization filed with the Secretary who shall notify the other members of the Board of Managers, designate another individual, not then a member of the Board of Managers, to serve in that member’s stead, in accordance with procedures established with the approval of the Executive Director. Any such authorization may be revoked by the designating member at any time in writing filed in the same manner.
(c) The Board of Managers shall be the agent for the service of legal process with respect to the Plan. No bond or other security is required in any jurisdiction of the Board of Managers or any member thereof except as required by law.
Pension Benefits — Retirement benefits are paid from the Plan to covered MTA Metro-North Railroad, MTA Staten Island Railway and post —1987 MTA Long Island Rail Road employees as service retirement allowances or early retirement allowances. A participant is eligible for a service retirement allowance upon termination if the participant satisfied both age and service requirement. A participant is eligible for an early retirement allowance upon termination if the participant has attained age 55 and completed at least 10 years of credited service. Terminated participants with 5 or more years of credited service who are eligible for a deferred vested benefit are not eligible to receive a service retirement
- 14 -
allowance or early retirement allowance. Deferred vested benefits are payable on an unreduced basis on the first day of the month following the participant sixty-second birthday. Effective in 2007, members and certain former members who become (or became) employed by another MTA agency which does not participate in the Plan continue to accrue service credit based on such other employment. Upon retirement, the member’s vested retirement benefit from the Plan will be calculated on the final average salary of the subsequent MTA agency, if higher. Moreover, the Plan benefit will be reduced by the benefit, if any, payable by the other plan based on such MTA agency employment. Such member’s disability and ordinary death benefit will be determined in the same way.
Retirement benefits are paid from the Plan under the MTA 20-Year Police Retirement Program. A participant is eligible for service retirement at the earlier of completing 20 years of credited Police service or attainment of age 62. Terminated participants with five years of credited police service, who are not eligible for retirement, are eligible for a deferred benefit. Deferred vested benefits are payable on the first of the month following the participant’s attainment of age 55.
Retirement benefits paid from the Plan to covered represented MTA Bus employees include service retirement allowances or early retirement allowances. Under the programs covering all represented employees at Baisley Park, Eastchester, La Guardia, Spring Creek, and Yonkers Depots and the represented employees at College Point Depot, JFK, Far Rockaway a participant is eligible for a service retirement allowance upon termination if the participant has attained age 65 and completed at least 5 years of credited service or if the participant has attained age 57 and completed at least 20 years of credited service. A participant hired prior to June 2009 from Baisley Park, College Point, and La Guardia Depots is eligible for an early retirement allowance if the participant has attained age 55 and completed 20 years of credited service. Terminated participants with 5 or more years of credited service who are not eligible to receive a service retirement allowance or early retirement allowance are eligible for a deferred vested benefit. Deferred vested benefits are payable on an unreduced basis on or after the participant attains age 65.
The MTA Bus retirement programs covering TWU, ATU and TSO represented employees are fixed dollar plans, i.e., the benefits are a product of credited service and a specific dollar amount.
The retirement benefits for certain former employees of the Alliance Companies are based on a participant’s service and final average salary. A normal retirement benefit is payable when the participant attains age 62 with 5 years of service. An early retirement benefit is payable when the participant attains age 55 with 15 years of service. The retirement benefit is payable as a single life annuity or, for married participants, as an unreduced 75% joint and survivor annuity.
MTA Bus non-represented employees and employees represented by the UTLO as of January 1, 2017 will earn benefits under a new set of programs. For service prior to 2017, a component calculated by a flat monthly dollar rate multiplied by years of credited service will be added to a final average salary (FAS) component, based on the platforms provided to similarly situated MaBSTOA Pension Plan members. For service on or after January 1, 2017, the final average salary component platform will be based on date of hire, years of credited service and whether the participant holds an operating or non-operating title. Certain former Liberty Lines employees assigned to the former Liberty Lines bus routes also are eligible for a supplemental plan benefit of 0.75% of final average salary per year of Plan service. TWU Local 100 has been certified as the collective bargaining representative for certain titles previously not represented at MTA Bus. Affected employees will participate in these programs, as set forth in the relevant collective bargaining agreement.
An MTA Bus non-represented or UTLO operating employee hired prior to April 1, 2012 participates in a Tier 4 25/55 operating retirement platform. A Tier 4 25/55 operating retirement platform participant with 25 years of Allowable Service receives upon retirement at age 55 a flat rate benefit equal to $1,380.00 ($115 x 12) for each year of service prior to January 1, 2017, plus a FAS benefit equal to 2% multiplied by FAS multiplied by service accrued after January 1, 2017, up to 30 years of total service,
- 15 -
plus 1.5% multiplied by FAS multiplied by service accrued after January 1, 2017 in excess of 30 years of total service. An MTA Bus non-represented non-operating employee hired prior to April 1, 2012 participates in a Tier 4 57/5 non-operating retirement platform. A Tier 4 57/5 non-operating retirement platform participant receives upon retirement at age 57 a flat rate benefit equal to $1,380.00 ($115 x 12) for each year of service prior to January 1, 2017, plus a FAS benefit equal to, for those with less than 20 years of total service, 1 2/3% multiplied by FAS multiplied by total service accrued after January 1, 2017, or, for those with 20 or more years of total service, 2% multiplied by FAS multiplied by total service accrued after January 1, 2017, up to 30 years of total service, plus 1.5% multiplied by FAS multiplied by total service accrued after January 1, 2017 in excess of 30 years of total service.
An MTA Bus non-represented or UTLO operating employee hired on or after April 1, 2012 participates in a Tier 6 25/55 operating retirement platform. A Tier 6 25/55 operating retirement platform participant with 25 years of Allowable Service receives upon retirement at age 55 a flat rate benefit equal to $1,380.00 ($115 x 12) for each year of service prior to January 1, 2017, plus a FAS benefit equal to 2% multiplied by FAS multiplied by service accrued after January 1, 2017 up to 30 years of total service, plus 1.5% multiplied by FAS multiplied by service accrued after January 1, 2017 in excess of 30 years of total service. The flat rate benefit is vested after the completion of five years of total service and the FAS benefit is vested after the completion of ten years of total service.
An MTA Bus non-represented non-operating employee hired on or after April 1, 2012 participates in a Tier 6 63/10 non-operating retirement platform. A Tier 6 63/10 non-operating retirement platform participant receives upon retirement at age 63 a flat rate benefit equal to $1,380.00 ($115 x 12) for each year of service prior January 1, 2017, plus a FAS benefit equal to, for those with less than 20 years of total service, 1.67% multiplied by FAS multiplied by total service accrued after January 1, 2017, or, for those with 20 or more years of total service, 1.75% multiplied by FAS multiplied by total service accrued after January 1, 2017, up to 20 years of such service, plus 2% multiplied by FAS multiplied by total service accrued after January 1, 2017 in excess of 20 years of total service. The flat rate benefit is vested after the completion of five years of total service and the FAS benefit is vested after the completion of ten years of total service.
Reduced early retirement benefits are payable under all platforms. The Tier 6 definition of wages includes an overtime ceiling which limits overtime compensation for pension purposes to no more than $16,406 for 2018 and $16,779 for 2019, indexed annually thereafter. Any overtime compensation earned in excess of the overtime ceiling is excluded from the final average salary calculation. The Tier 6 definition of wages also excludes wages in excess of the annual salary paid to the New York State Governor, lump-sum payments for deferred compensation, sick leave, accumulated vacation or other credits for time not worked. TWU, ATU and TSO members who retire after November 16, 2016, and UTLO members and non-represented employees who retire after January 1, 2017 will have their pension benefit increased by a Cost of Living Adjustment (COLA). The COLA is an annual adjustment to the retirement benefit based on the Consumer Price Index (CPI). The following retirees are eligible to receive a COLA: disability retirees, regardless of age, who have been retired for at least 5 years; retirees who are at least age 62 and have been retired for at least 5 years; and retirees who are at least age 55 and have been retired for at least 10 years. Surviving spouses receiving a joint-and-survivor option benefit are eligible to receive 50% of the monthly COLA that would have been paid to the retiree. For TWU, ATU and TSO members, the COLA calculation is based on the first $18,000 of the retiree’s normal retirement benefit. For UTLO members and non-represented employees, the COLA calculation is based on the first $18,000 of the retiree’s final average salary benefit component. The COLA amount may not be less than 1% nor more than 3% in any year. Once COLA payments begin, they continue automatically and increase each September.
- 16 -
Certain MTA Bus employees represented by TWU Local 100 were granted pension service credit for periods of employment at Liberty Lines Express, Inc. prior to January 3, 2005, with the increase in the Plan benefit offset by the benefit accrued under the TWU-Westchester Private Bus Lines Pension Plan.
Pre-1988 MTA Long Island Rail Road participants are eligible for a service retirement allowance upon termination if the participants have either: (a) attained age 65 and completed at least 5 years of credited service, or if an employee on January 1, 1988 completed at least 10 years of credited service, or (b) attained age 50 and has completed at least 20 years of credited service. Terminated participants who were not employees on January 1, 1988 with 5 or more years of credited service are eligible for a deferred vested benefit. Pension benefits payable to age 65, where eligible, are calculated as 2% of the employee’s applicable final average earnings for each year of qualifying service up to 25 years plus 1.5% of applicable final average earning of each year of qualifying service in excess of 25 years. For pension benefits payable at and after age 65 regardless of whether benefits commenced before or after the employee attained age 65, benefits are calculated in the same manner as pension benefits payable prior to age 65 except that the amount so determined is reduced by a percentage of the employee’s annuity (not including supplemental annuity) value at age 65 under the Federal Railroad Retirement Act.
The reduction of pension benefits for amounts payable under the Federal Railroad Retirement Act is 50%.
Death and Disability Benefits — In addition to service retirement benefits, participants of the Plan are eligible to receive disability retirement allowances and death benefits. Participants who become disabled may be eligible to receive disability retirement allowances after 10 years of covered MTA Bus service; 10 years of credited service for covered MTA Metro-North Railroad and MTA Long Island Rail Road management and represented employees, covered MTA Staten Island Railway employees and covered MTA police participants.
The disability retirement allowance for covered MTA Metro-North Railroad and MTA Long Island Rail Road management and represented covered MTA Staten Island Railway employees is calculated based on the participant’s credited service and final average salary (“FAS”) but not less than ⅓ of FAS. Under the MTA 20 Year Police Retirement Program, a disabled participant may be eligible for one of three forms of disability retirement: (a) ordinary disability which is payable if a participant has 10 years of credited Police service and is calculated based on the participant’s credited Police service and FAS but not less than ⅓ of FAS; (b) performance of duty, which is payable if a participant is disabled in the performance of duty and is ½ of FAS, and (c) accidental disability, which is payable if a participant is disabled as the result of an on-the-job accidental injury and is ¾ of FAS subject to an offset of Workers’ Compensation benefits. Pursuant to the MTA Bus programs, the disability benefit is the same as the service retirement benefit.
Pre-1988 MTA Long Island Rail Road participants who become disabled after accumulating 10 years of credited service and who meet the requirements as described in the Plan may be eligible to receive a disability benefit. Disability pension benefits are calculated based on the participant’s qualified service and a percentage of final average compensation reduced by the full amount of the disability benefit under the Federal Railroad Retirement Act.
Survivorship benefits for pre-1988 MTA Long Island Rail Road participants are paid to the spouse when a survivorship option is elected or when an active participant has not divested their spouse of benefits. The survivorship benefit is payable at the time of death or when the vested participant would have attained an eligible age. The amount payable is in the form of an annuity. A lump sum death benefit no greater than $5,000 is payable upon death on behalf of a non-vested participant or vested participant whose pension rights were waived.
Death benefits are paid to the participant’s beneficiary in the event of the death of a covered MTA Metro-North Railroad, post-1987 MTA Long Island Rail Road or MTA Staten Island Railway employee after completion of one year of credited service. The death benefit payable is calculated based on a multiple of a participant’s salary based on years of credited service up to three years and is reduced
- 17 -
beginning at age sixty-one. There is also a post-retirement death benefit which, in the 1st year of retirement, is equal to 50% of the pre-retirement death benefit amount, 25% the 2nd year and 10% of the death benefit payable at age 60 for the 3rd and later years. For the Police 20 Year Retirement Program, the death benefit is payable after ninety days of credited MTA Police service, and is equal to three times their salary. For non-Police groups, this death benefit is payable in a lump sum distribution while for Police, the member or the beneficiary can elect to have it paid as an annuity. The MTA Police do not have a post retirement benefit.
In the MSBA Employees’ Pension Plan, there are special spousal benefits payable upon the death of a participant who is eligible for an early retirement benefit, or a normal service retirement benefit, or who is a vested participant or vested former participant. To be eligible, the spouse and participant must have been married at least one year at the time of death. Where the participant was eligible for an early service retirement benefit or was a vested participant or former participant, the benefit is a pension equal to 40% of the benefit payable to the participant as if the participant retired on the date of death. Where the participant was eligible for a normal service retirement benefit, the eligible spouse can elect either the benefit payable as a pension, as described in the prior sentence, or a lump sum payment based on an actuarially determined pension reserve. If there is no eligible spouse for this pension reserve benefit, a benefit is payable to the participant’s beneficiary or estate.
Moreover, an accidental death benefit is payable for the death of a participant who is a covered MTA Metro-North Railroad or post-1987 MTA Long Island Rail Road employee, a covered MTA Staten Island Railway employee or a covered MTA Police member and dies as the result of an on-the-job accidental injury. This death benefit is paid as a pension equal to 50% of the participant’s salary and is payable to the spouse for life, or, if none, to children until age 18 (or 23, if a student), or if none, to a dependent parent.
For MTA Bus employees, there is varied death benefit coverage under the Plan. For all represented and non-represented MTA Bus employees at Eastchester and Yonkers Depots and represented MTA Bus employees at Baisley Park, College Point, Far Rockaway, JFK, La Guardia and Spring Creek Depots, if a participant dies prior to being eligible for a retirement benefit, the participant’s beneficiary may elect to receive a refund of the participant’s contributions plus interest.
Moreover, the spouses of the above employees who are vested are entitled to a presumed retirement survivor annuity which is based on a 50% Joint and Survivor annuity. The date as of which such annuity is determined and on which it commences varies among the different programs depending on whether the participants are eligible for retirement and for payment of retirement benefits.
In addition, the spouse of a non-represented MTA Bus employee at Spring Creek, JFK, La Guardia, Baisley Park and Far Rockaway, if such employee is age 55 and has 15 years of service and is a terminated member with a vested benefit which is not yet payable, may elect the presumed retirement survivor annuity or 1/2 the participant’s accrued benefit paid monthly and terminating on the 60th payment or the spouse’s death. The spouse of a non-represented MTA Bus employee at Yonkers Depot may also receive a pre-retirement survivor annuity from the supplemental plan. If there is no such spouse, the actuarial equivalent of such annuity is payable.
The dependent children of MTA Bus TWU employees of College Point, Baisley Park, and La Guardia hired prior to June 9, 2009 are also entitled to an annuity based on the spouse’s pre-retirement survivor annuity (1/2 of the spouse’s annuity is payable to each child, but no more than 100% of the spouse’s annuity is payable). In addition, the dependent children of retirees who were MTA Bus employees at these Depots are entitled to an annuity based on the presumed retirement survivor’s annuity (25% of the spouse’s annuity; but no more than 50% of the spouse’s annuity is payable).
Retirement benefits establishment and changes for represented employees are collectively bargained and must be ratified by the respective union and the MTA Board. For non-represented employees, retirement
- 18 -
benefit adopted and modifications thereto, are presented to the MTA Board and must be accepted and approved by the MTA Board.
2. SUMMARY OF SIGNIFICANT ACCOUNTING POLICIES
Basis of Accounting — The Plan’s financial statements are prepared on the accrual basis of accounting under which deductions are recorded when the liability is incurred and additions are recognized in the accounting period in which they are earned. Benefits and refunds are recognized when due and payable in accordance with the terms of the Plan. Contributions from members are recorded when the employer makes payroll deductions from plan members. Employer contributions are recognized when due in accordance with the terms of the Plan. Additions to the Plan consist of contributions (member and employer) and net investment income. Investment purchases and sales are recorded as of trade date.
The accounting and reporting policies of the Plan conform to accounting principles generally accepted in the United States of America (GAAP).
New Accounting Standards Adopted – The Plan adopted GASB Statement No. 84, Fiduciary Activities. This Statement establishes criteria for identifying fiduciary activities of all state and local governments. The focus of the criteria generally is on (1) whether a government is controlling the assets of the fiduciary activity and (2) the beneficiaries with whom a fiduciary relationship exists. Separate criteria are included to identify fiduciary component units and postemployment benefit arrangements that are fiduciary activities.
A fiduciary component unit, when reported in the fiduciary fund financial statements of a primary government, should combine its information with its component units that are fiduciary component units and aggregate that combined information with the primary government’s fiduciary funds. This Statement also provides for recognition of a liability to the beneficiaries in a fiduciary fund when an event has occurred that compels the government to disburse fiduciary resources. Events that compel a government to disburse fiduciary resources occur when a demand for the resources has been made or when no further action, approval, or condition is required to be taken or met by the beneficiary to release the assets. There was no material impact on the Program’s financial statements as a result of the implementation of GASB Statement No. 84. GASB Statement No. 95, Postponement of Effective Dates of Certain Authoritative Guidance, provides temporary relief to government and other stakeholders in light of the COVID-19 pandemic. This objective is accomplished by postponing the effective dates of certain accounting and financial reporting provisions in Statements and Implementation Guides that first became effective for periods beginning after June 15, 2018 and later. GASB Statement No. 95 is effective immediately. The adoption of this Statement had no impact on the Plan’s financial statements. However, the Plan did update the required year of adoption for GASB Statement No. 92. Refer to Accounting Standards Issued but Not Yet Adopted for further details.
Recent Accounting Pronouncements — Not yet adopted but currently being evaluated
GASB Statement No. GASB Accounting Standard
MTA Pension Plan Required Year of Adoption
92 Omnibus 2020 2022 Use of Estimates — The preparation of the Plan’s financial statements in conformity with accounting principles generally accepted in the United States of America requires management to make estimates and assumptions that affect the reported amounts of assets and liabilities and disclosure of contingent assets and the reported amounts of revenues and expenses during the reporting period. Actual results

- 19 -
could differ from those estimates. Estimates include fair market value of investments, the annual required contribution and the unfunded actuarial accrued liability.
Benefits — Benefits are recorded when paid.
Contributions - As a condition of participation in the MTA Defined Benefit Pension Plan (“MTADBPP” or the “Plan”), employers and employees are required to contribute to the Plan. The amount of the employer contributions is determined by the Plan actuaries. Employee contribution rates for represented employees are determined by collective bargaining. Employee contribution rates for non-represented employees are set forth in the Plan document as adopted by the MTA Board. If an employee terminates employment with less than 10 (ten) years of credited service in the Plan, the employee may request a refund of his employee contributions with interest. Upon receipt of this refund of contributions, the employee has no claim on any future benefit from the Plan. Employees with more than 10 years of credited service, except for a small group of MTA Bus participants, cannot withdraw their contributions. Members of the MTA Police Program who have transferred pursuant to Retirement and Social Security Law Section 343 and have not been employed in the MTA Police Program for 15 years may, upon termination of employment, withdraw member contributions. The withdrawal of such transferred police service member contributions shall not terminate membership and rights in the MTA Police Program attributable to Credited Police Service. Income - Dividend and interest income are recorded when earned.
Securities - Purchases and sales of securities are recorded on a trade-date basis.
Asset Transfers — No assets were transferred to the MTA Defined Benefit Pension Plan for the years 2019 and 2018 respectively.
Administrative Expenses — Administrative expenses of the Plan are paid for by the Plan.
3. CASH AND INVESTMENTS
Investment Policy – The Plan’s policy statement is issued for the guidance of fiduciaries, including the members of the Board and investment managers, in the course of investing the assets of the Trust. The investments of the Trust will be made for the exclusive benefit of the Plan participants and their beneficiaries. Policy guidelines may be amended by the Board upon consideration of the advice and recommendations of investment professionals.
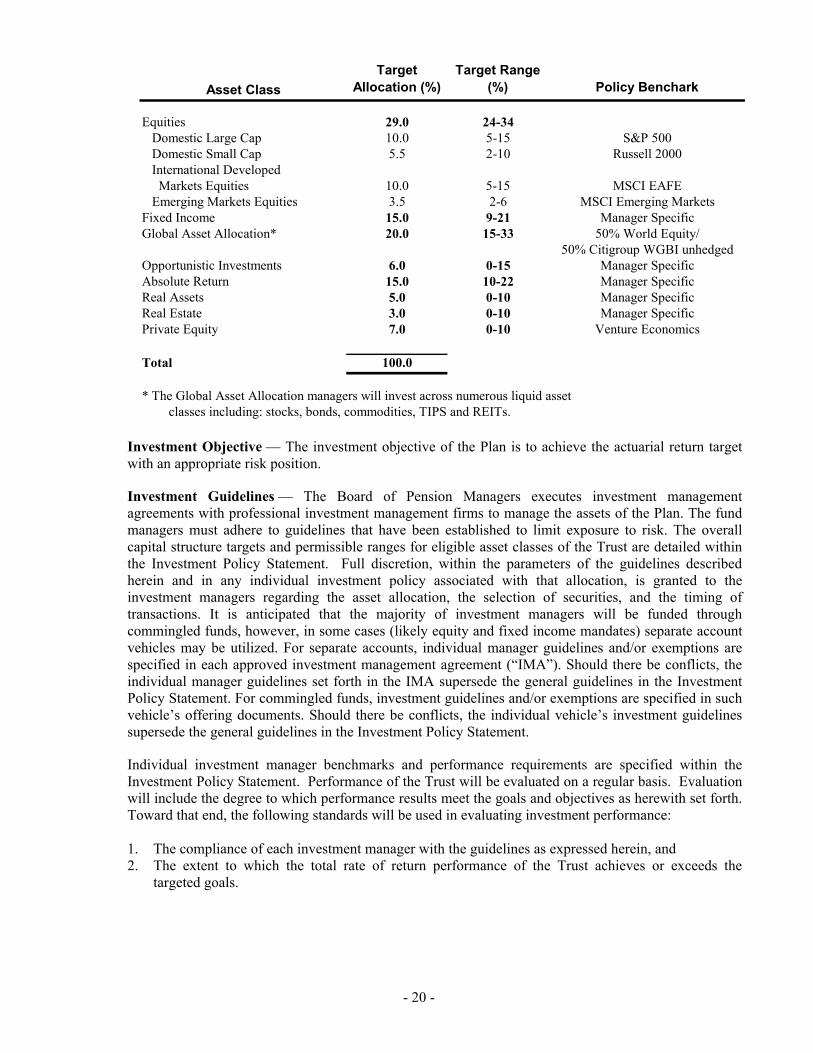
In order to have a reasonable probability of achieving the target return at an acceptable risk level, the Board has adopted the asset allocation policy outlined below. The actual asset allocation will be reviewed on, at least, a quarterly basis and will be readjusted when an asset class weighting is outside its target range. The following was the MTA Defined Benefit Pension Plan Board adopted asset allocation policy as at December 31, 2019.
- 20 -
Asset Class
Target Allocation (%)
Target Range (%) Policy Benchark
Equities 29.0 24-34Domestic Large Cap 10.0 5-15 S&P 500Domestic Small Cap 5.5 2-10 Russell 2000International Developed Markets Equities 10.0 5-15 MSCI EAFEEmerging Markets Equities 3.5 2-6 MSCI Emerging Markets
Fixed Income 15.0 9-21 Manager SpecificGlobal Asset Allocation* 20.0 15-33 50% World Equity/
50% Citigroup WGBI unhedgedOpportunistic Investments 6.0 0-15 Manager SpecificAbsolute Return 15.0 10-22 Manager SpecificReal Assets 5.0 0-10 Manager SpecificReal Estate 3.0 0-10 Manager SpecificPrivate Equity 7.0 0-10 Venture Economics
Total 100.0
* The Global Asset Allocation managers will invest across numerous liquid asset classes including: stocks, bonds, commodities, TIPS and REITs.
Investment Objective — The investment objective of the Plan is to achieve the actuarial return target with an appropriate risk position.
Investment Guidelines — The Board of Pension Managers executes investment management agreements with professional investment management firms to manage the assets of the Plan. The fund managers must adhere to guidelines that have been established to limit exposure to risk. The overall capital structure targets and permissible ranges for eligible asset classes of the Trust are detailed within the Investment Policy Statement. Full discretion, within the parameters of the guidelines described herein and in any individual investment policy associated with that allocation, is granted to the investment managers regarding the asset allocation, the selection of securities, and the timing of transactions. It is anticipated that the majority of investment managers will be funded through commingled funds, however, in some cases (likely equity and fixed income mandates) separate account vehicles may be utilized. For separate accounts, individual manager guidelines and/or exemptions are specified in each approved investment management agreement (“IMA”). Should there be conflicts, the individual manager guidelines set forth in the IMA supersede the general guidelines in the Investment Policy Statement. For commingled funds, investment guidelines and/or exemptions are specified in such vehicle’s offering documents. Should there be conflicts, the individual vehicle’s investment guidelines supersede the general guidelines in the Investment Policy Statement.
Individual investment manager benchmarks and performance requirements are specified within the Investment Policy Statement. Performance of the Trust will be evaluated on a regular basis. Evaluation will include the degree to which performance results meet the goals and objectives as herewith set forth. Toward that end, the following standards will be used in evaluating investment performance: 1. The compliance of each investment manager with the guidelines as expressed herein, and 2. The extent to which the total rate of return performance of the Trust achieves or exceeds the
targeted goals.

- 21 -
Fixed Income Investment Managers
Domestic fixed income investments are permitted, subject to the guidelines reflected in Investment Policy Statement. Yankee bonds, which are dollar denominated foreign securities, may be held by each domestic manager in proportions which each manager shall deem appropriate.
International fixed income securities are permitted, subject to the guidelines reflected in Investment Policy Statement. Generally defined, the Citigroup World Government Bond Index represents the opportunity set for international developed markets. The J.P. Morgan Emerging Markets Bond Index-Global represents the opportunity set for international emerging markets denominated in USD. The J.P. Morgan GBI-EM Global Diversified Index represents the opportunity set for international emerging markets denominated in local currency. These index references are guidelines and do not prohibit investment in securities outside those indexes.
Investment managers are responsible for making an independent analysis of the credit worthiness of
securities and their suitability as investments regardless of the classifications provided by rating agencies.
The average duration (interest rate sensitivity) of an actively managed fixed income portfolio shall range within two years of the benchmark’s duration.
For domestic fixed income portfolios, individual manager account for the securities of an individual issuer, excepting the U.S. government and U.S. government agencies, shall not constitute more than 5% at market at any time.
For international bond portfolios, individual manager account for the securities of any non-governmental issuer shall not constitute more than 5% at market at any time.
Equity Investment Managers
Domestic equity investments are permitted, subject to the guidelines. American Depository Receipts (ADRs), which are dollar denominated foreign securities traded on the domestic U.S. stock exchanges (e.g., Reuters, Nestle, Sony) may be held by each domestic stock manager in proportions which each manager shall deem appropriate.
International equities are permitted, subject to the guidelines. Generally defined, the Morgan Stanley EAFE (Europe, Australasia and the Far East) Index represents the opportunity set for international developed markets. The Morgan Stanley Emerging Markets Free Index represents the opportunity set for international emerging markets. These index references are guidelines and do not prohibit investment in securities outside those indexes.
The equity specialists may vary equity commitment from 90% to 100% of assets under management.
Individual manager account may hold no more than 8% at market or 1.5x the manager’s benchmark weight (whichever is greater) of any single company’s stock.
Overlay Manager(s).
For a variety of reasons, the investment program may carry large amounts of cash throughout the
year. In order to achieve the actuarial assumed returns on the total investment program, the Board may retain a futures overlay manager. The overlay manager shall use exchange traded futures contracts to expose the cash to the long-term target asset allocation.

- 22 -
n addition, the overlay manager may be utilized for the following: a) Expose un-invested assets of domestic and international equity investment managers to their
respective equity benchmarks through the use of futures contracts, b) Assist the Board in rebalancing, transitions, and/or gaining exposure to approved asset classes, c) Provide the market (or “beta”) exposures in a portable alpha program, d) The overlay manager shall ensure that all futures positions are fully collateralized and the
manager is prohibited from leveraging any portion of the portfolio.
Alternative Investments Managers Alternative investments are broadly categorized into the following categories: Opportunistic Real assets Real estate Absolute return Private equity
Common features of alternative investments are limited liquidity, the use of derivatives, leverage and shorting, lower regulatory oversight, limited transparency, and high fees. Compensating for these risks, these investments offer the potential of diversification and/or higher rates of return over time
Derivatives Policy
Where appropriate, investment managers may use derivative securities for the following reasons:
Hedging. To the extent that the portfolio is exposed to clearly defined risks and there are derivative contracts that can be used to reduce those risks, the investment managers are permitted to use such derivatives for hedging purposes, including cross-hedging of currency exposures.
Creation of Market Exposures. Investment managers are permitted to use derivatives to replicate the risk/return profile of an asset or asset class provided that the guidelines for the investment manager allow for such exposures to be created with the underlying assets themselves.
Management of Country and Asset Allocation Exposure. Investment managers charged with tactically changing the exposure of their portfolio to different countries and/or asset classes are permitted to use derivative contracts for these purposes.
Additional uses of derivatives shall be approved by the Board or set forth in the individual
investment guidelines or the offering documents prior to implementation and shall be restricted to those specific investment managers.
Ineligible Investments (Separately Managed Accounts)
Unless specifically approved by the Board or set forth in the individual investment guidelines, certain securities, strategies and investments are ineligible for inclusion within separately managed accounts. Among these are:
Privately-placed or other non-marketable debt, except securities issued under Rule 144a, Lettered, legend or other so-called restricted stock, Commodities Short sales, and, Direct investments in private placements, real estate, oil and gas and venture capital, or funds
comprised thereof.

- 23 -
Exceptions:
The Board of Managers, in recognition of the benefits of commingled funds as investment vehicles (i.e., the ability to diversify more extensively than in a small, direct investment account and the lower costs which can be associated with these funds) may, from time to time, allow investment in such funds. The Board recognizes that it cannot give specific policy directives to a fund; therefore, the Board, with the assistance of the investment advisor, will assess and monitor the investments of any funds used by the Plan to ascertain whether they are appropriate.
Investment Valuation and Income Recognition — Investments are presented at fair value based on information provided by JP Morgan Chase (the “trustee”), NEPC, and the investment managers. The fair value of investments is based on published market prices and quotations from major investment brokers at current exchange rates, as available, or net asset value, which is determined to be a practical expedient for measuring fair value. Many factors are considered in arriving at that value. All investments are registered, with securities held by the Plan’s trustee, in the name of the Plan. Gains and losses on investments that were sold during the year are included in in the statement of plan net position. Risks and Uncertainties — The Plan’s investments are exposed to various risks, such as interest rate, market, and credit risk. Due to the level of risk associated with certain investment securities and level of uncertainty related to changes in the value of investment securities, it is possible that changes in risks in the near term would materially affect the amounts reported in the Plan’s financial statements.
The financial markets, both domestically and internationally, have demonstrated significant volatility on a daily basis, which affects the valuation of investments. The Plan utilizes asset allocation strategies that are intended to optimize investment returns over time in accordance with investment objectives and with acceptable levels of risk.
- 24 -
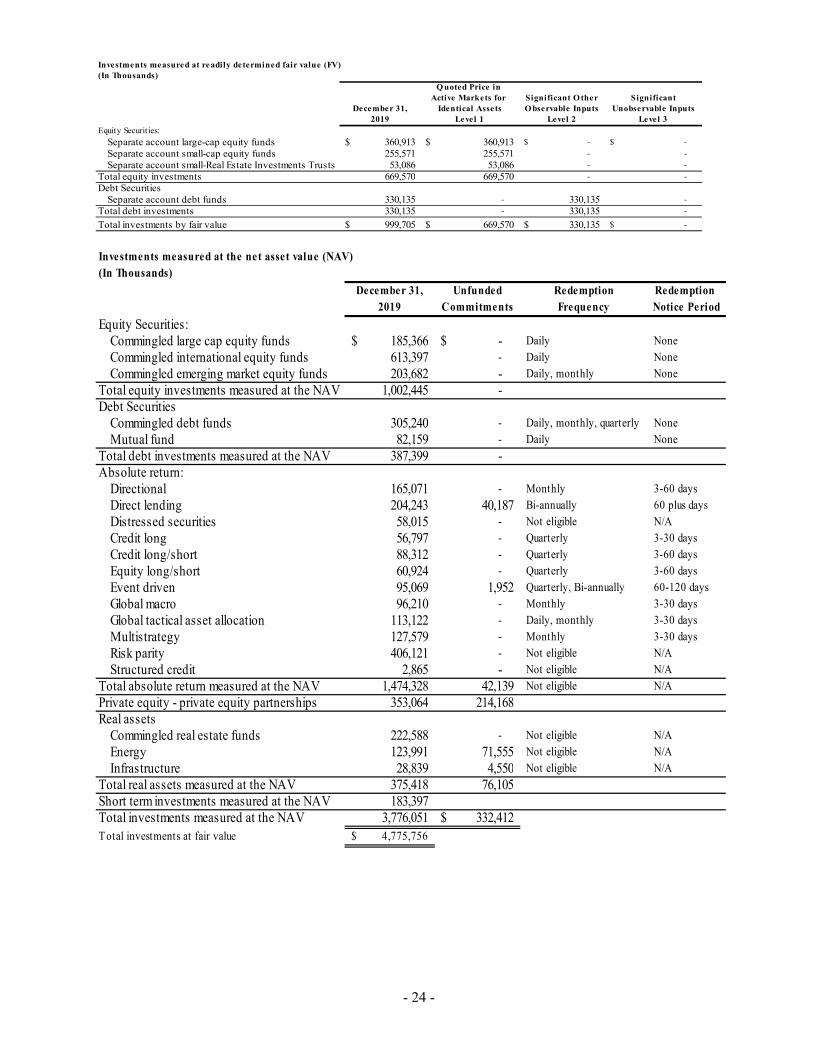
Investments measured at readily determined fair value (FV)(In Thousands)
Q uoted Price in Active Markets for Significant Other Significant
December 31, Identical Assets Observable Inputs Unobservable Inputs2019 Level 1 Level 2 Level 3
Equity Securities:
Separate account large-cap equity funds 360,913$ 360,913$ -$ -$
Separate account small-cap equity funds 255,571 255,571 - -
Separate account small-Real Estate Investments Trusts 53,086 53,086 - -
Total equity investments 669,570 669,570 - -
Debt Securities Separate account debt funds 330,135 - 330,135 -
Total debt investments 330,135 - 330,135 -
Total investments by fair value 999,705$ 669,570$ 330,135$ -$ Investments measured at the net asset value (NAV)(In Thousands)
December 31, Unfunded Redemption Redemption 2019 Commitments Frequency Notice Period
Equity Securities: Commingled large cap equity funds 185,366$ -$ Daily None
Commingled international equity funds 613,397 - Daily None
Commingled emerging market equity funds 203,682 - Daily, monthly None
Total equity investments measured at the NAV 1,002,445 - Debt Securities Commingled debt funds 305,240 - Daily, monthly, quarterly None
Mutual fund 82,159 - Daily None
Total debt investments measured at the NAV 387,399 - Absolute return: Directional 165,071 - Monthly 3-60 days
Direct lending 204,243 40,187 Bi-annually 60 plus days
Distressed securities 58,015 - Not eligible N/A
Credit long 56,797 - Quarterly 3-30 days
Credit long/short 88,312 - Quarterly 3-60 days
Equity long/short 60,924 - Quarterly 3-60 days
Event driven 95,069 1,952 Quarterly, Bi-annually 60-120 days
Global macro 96,210 - Monthly 3-30 days
Global tactical asset allocation 113,122 - Daily, monthly 3-30 days
Multistrategy 127,579 - Monthly 3-30 days
Risk parity 406,121 - Not eligible N/A
Structured credit 2,865 - Not eligible N/A
Total absolute return measured at the NAV 1,474,328 42,139 Not eligible N/A
Private equity - private equity partnerships 353,064 214,168 Real assets Commingled real estate funds 222,588 - Not eligible N/A
Energy 123,991 71,555 Not eligible N/A
Infrastructure 28,839 4,550 Not eligible N/A
Total real assets measured at the NAV 375,418 76,105 Short term investments measured at the NAV 183,397 Total investments measured at the NAV 3,776,051 332,412$ Total investments at fair value 4,775,756$
- 25 -
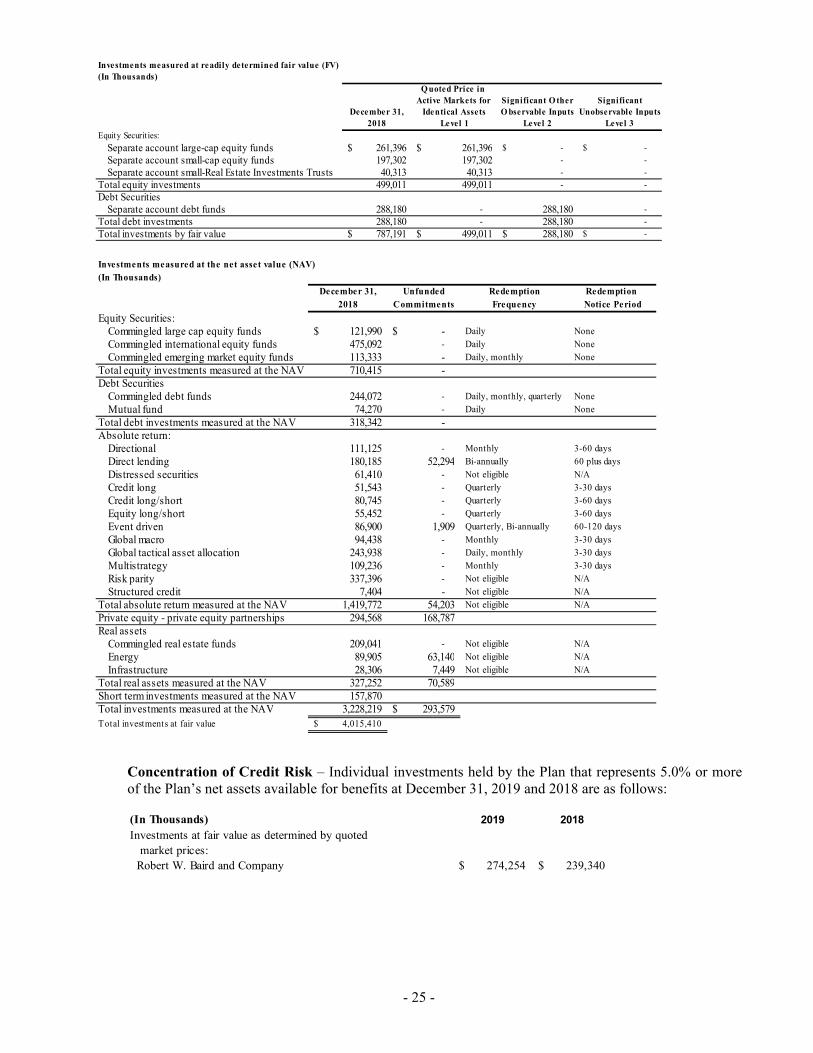
Investments measured at readily determined fair value (FV)(In Thousands)
Q uoted Price in Active Markets for Significant O ther Significant
December 31, Identical Assets O bservable Inputs Unobservable Inputs2018 Level 1 Level 2 Level 3
Equity Securities:
Separate account large-cap equity funds 261,396$ 261,396$ -$ -$
Separate account small-cap equity funds 197,302 197,302 - -
Separate account small-Real Estate Investments Trusts 40,313 40,313 - -
Total equity investments 499,011 499,011 - -
Debt Securities Separate account debt funds 288,180 - 288,180 -
Total debt investments 288,180 - 288,180 -
Total investments by fair value 787,191$ 499,011$ 288,180$ -$ Investments measured at the net asset value (NAV)(In Thousands)
December 31, Unfunded Redemption Redemption 2018 Commitments Frequency Notice Period
Equity Securities: Commingled large cap equity funds 121,990$ -$ Daily None
Commingled international equity funds 475,092 - Daily None
Commingled emerging market equity funds 113,333 - Daily, monthly None
Total equity investments measured at the NAV 710,415 - Debt Securities Commingled debt funds 244,072 - Daily, monthly, quarterly None
Mutual fund 74,270 - Daily None
Total debt investments measured at the NAV 318,342 - Absolute return: Directional 111,125 - Monthly 3-60 days
Direct lending 180,185 52,294 Bi-annually 60 plus days
Distressed securities 61,410 - Not eligible N/A
Credit long 51,543 - Quarterly 3-30 days
Credit long/short 80,745 - Quarterly 3-60 days
Equity long/short 55,452 - Quarterly 3-60 days
Event driven 86,900 1,909 Quarterly, Bi-annually 60-120 days
Global macro 94,438 - Monthly 3-30 days
Global tactical asset allocation 243,938 - Daily, monthly 3-30 days
Multistrategy 109,236 - Monthly 3-30 days
Risk parity 337,396 - Not eligible N/A
Structured credit 7,404 - Not eligible N/A
Total absolute return measured at the NAV 1,419,772 54,203 Not eligible N/A
Private equity - private equity partnerships 294,568 168,787 Real assets Commingled real estate funds 209,041 - Not eligible N/A
Energy 89,905 63,140 Not eligible N/A
Infrastructure 28,306 7,449 Not eligible N/A
Total real assets measured at the NAV 327,252 70,589 Short term investments measured at the NAV 157,870 Total investments measured at the NAV 3,228,219 293,579$ Total investments at fair value 4,015,410$
Concentration of Credit Risk – Individual investments held by the Plan that represents 5.0% or more of the Plan’s net assets available for benefits at December 31, 2019 and 2018 are as follows:
(In Thousands) 2019 2018
Investments at fair value as determined by quoted market prices: Robert W. Baird and Company 274,254$ 239,340$
- 26 -
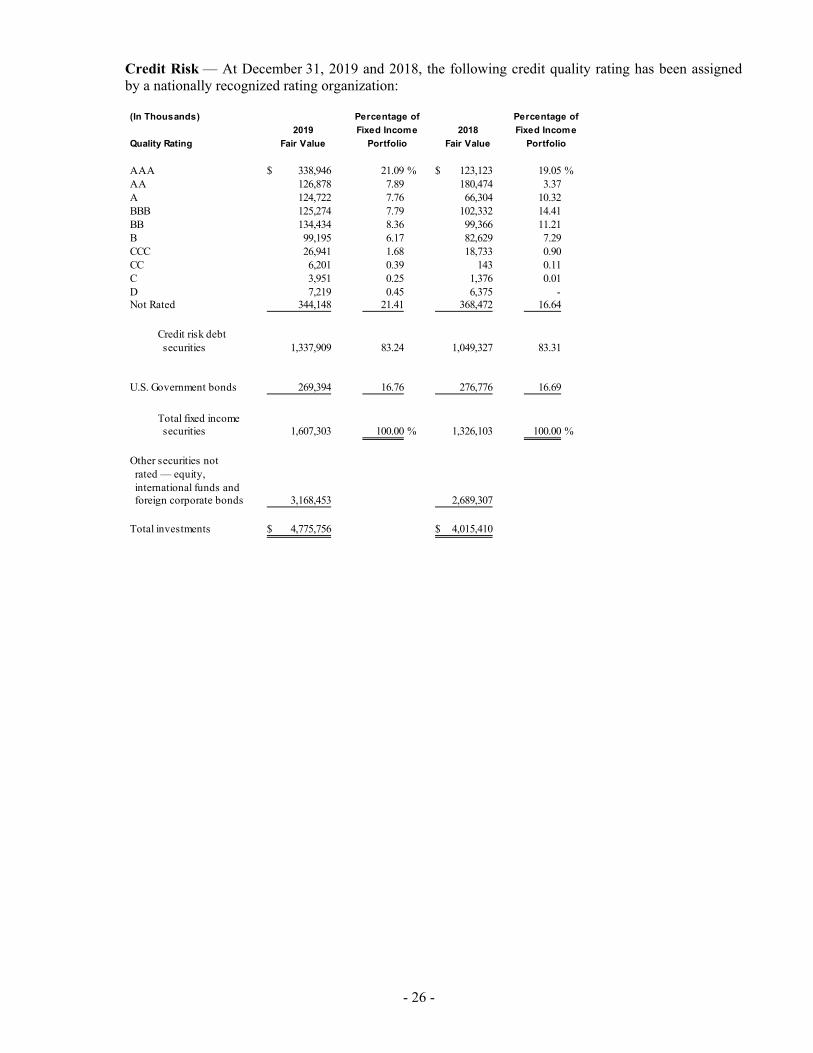
Credit Risk — At December 31, 2019 and 2018, the following credit quality rating has been assigned by a nationally recognized rating organization:
(In Thousands) Percentage of Percentage of
2019 Fixed Income 2018 Fixed Income
Quality Rating Fair Value Portfolio Fair Value Portfolio
AAA 338,946$ 21.09 % 123,123$ 19.05 % AA 126,878 7.89 180,474 3.37 A 124,722 7.76 66,304 10.32 BBB 125,274 7.79 102,332 14.41 BB 134,434 8.36 99,366 11.21 B 99,195 6.17 82,629 7.29 CCC 26,941 1.68 18,733 0.90 CC 6,201 0.39 143 0.11 C 3,951 0.25 1,376 0.01 D 7,219 0.45 6,375 - Not Rated 344,148 21.41 368,472 16.64
Credit risk debt securities 1,337,909 83.24 1,049,327 83.31
U.S. Government bonds 269,394 16.76 276,776 16.69
Total fixed income securities 1,607,303 100.00 % 1,326,103 100.00 %
Other securities not rated — equity, international funds and foreign corporate bonds 3,168,453 2,689,307
Total investments 4,775,756$ 4,015,410$
- 27 -
Interest Rate Risk Exceptions — Interest rate risk is the risk that changes in interest rates will adversely affect the fair value of an investment. Duration is a measure of sensitivity to interest rate risk. The greater the duration of a bond or portfolio of bonds, the greater its price volatility will be in response to a change in interest rate risk and vice versa. Modified duration is an indicator of bond price’s sensitivity to a parallel 100 basis point change in interest rates.
Investment Fund Fair Value Duration Fair Value Duration
(In Thousands)
Chase 330,135$ 6.35 288,180$ 12.90 Allianz Structured Alpha Fund 165,071 0.13 111,125 0.13 Wellington Blended Emerging Market Debt Fund 77,360 6.44 68,370 5.44 Bridgewater All Weather Fund 177,791 5.60 95,896 8.30 Wellington Opportunistic Fund - - 54,070 1.52 Wellington Fixed Income Fund 2,490 5.80 - - Bridgewater Pure Alpha Fund 35,698 1.30 142,098 (0.90) Bridgewater Pure Alpha Markets Fund (6,885) (2.90) (16,455) (7.10) GAM Unconstrained Bond Fund - - 34,810 0.10 Northern Trust William Capital Fund 9,073 - 8,651 - Park Square Capital Credit Opportunities Fund II 36,561 0.18 32,238 - Park Square Capital Credit Opportunities Fund III 30,088 0.13 14,156 - Libremax Partners Fund 136,293 2.82 80,745 2.63 Gramercy Distressed Opportunistic Fund 41,694 (0.07) 22,474 0.26 Makuria Credit Fund 19,559 5.38 17,666 5.38 Crescent Capital High Income Fund 40,188 2.92 51,516 2.56 Orchard Landmark Fund 106,272 1.18 95,495 1.44 PIMCO Distressed Credit Opportunities Fund 56,797 2.83 51,543 2.18 Wellington Global Managed Risk Fund 231,000 10.70 73,571 6.20 State Stree Real Asset Fund 27,962 4.67 24,062 5.84 State Stree Long US Treasury Index Fund 33,095 18.06 28,183 17.35 EIG Energy Fund XV 1,793 - 3,487 - EIG Energy Fund XVI 5,181 - 4,878 - Riverstone Credit Partners Fund 24,442 4.00 17,408 4.00 NEPC Syndication Partners Fund 5,282 4.00 1,723 4.00 Canyon Value Realization Fund 20,363 2.44 20,213 3.26
Total fixed income securities 1,607,303 1,326,103
Portfolio modified duration 4.95 5.20
Investments with no duration reported 3,168,453$ 2,689,307$
Total investments 4,775,756$ 4,015,410$
2019 2018
Foreign Currency Risk — Foreign currency risk is the risk that changes in exchange rates will adversely affect the fair value of an investment. Some of the Plan’s investment managers will have foreign currency exposure through holdings of foreign securities, currency derivatives or private investments whose revenue will be non-USD based. The Plan also holds investments in American Depository Receipts (“ADRs”) which are not included in the below schedule since they are denominated in U.S. dollars and accounted for at fair market value.
The Plan’s foreign currency exposures as of December 31, 2019 and 2018 are as follows (amounts in U.S. dollars, in thousands):
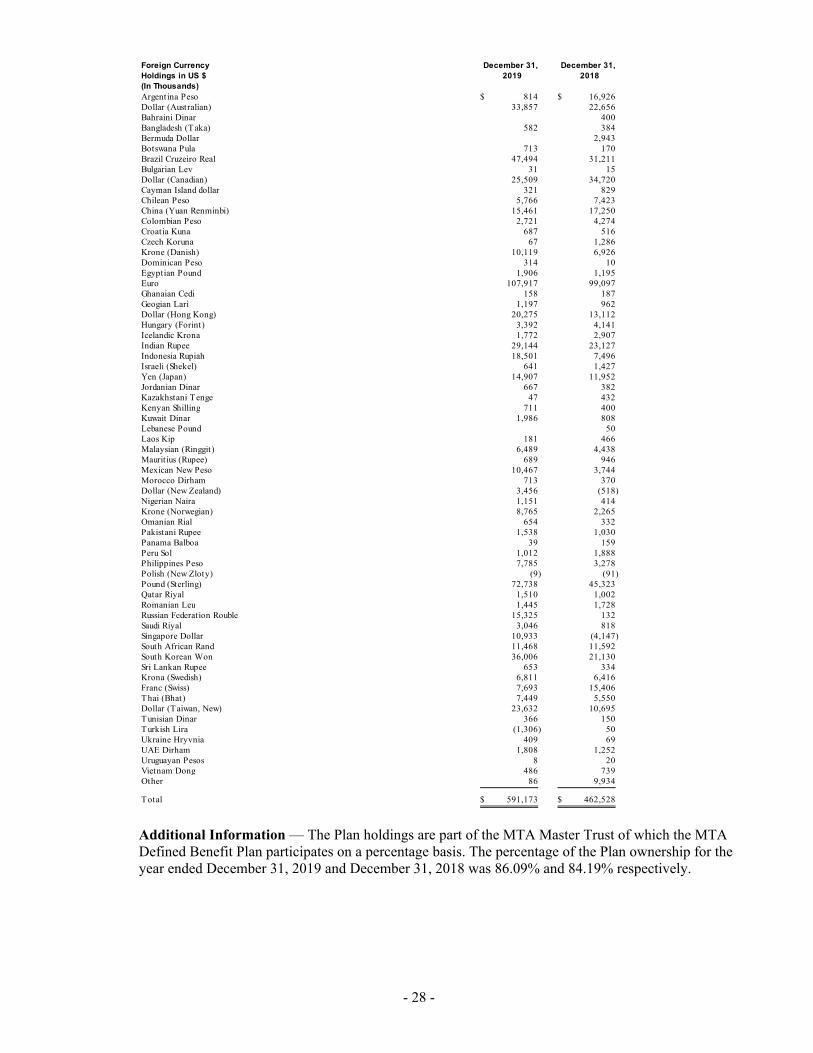
- 28 -
Foreign Currency December 31, December 31, Holdings in US $ 2019 2018(In Thousands)Argentina Peso 814$ 16,926$ Dollar (Australian) 33,857 22,656 Bahraini Dinar 400 Bangladesh (Taka) 582 384 Bermuda Dollar 2,943 Botswana Pula 713 170 Brazil Cruzeiro Real 47,494 31,211 Bulgarian Lev 31 15 Dollar (Canadian) 25,509 34,720 Cayman Island dollar 321 829 Chilean Peso 5,766 7,423 China (Yuan Renminbi) 15,461 17,250 Colombian Peso 2,721 4,274 Croatia Kuna 687 516 Czech Koruna 67 1,286 Krone (Danish) 10,119 6,926 Dominican Peso 314 10 Egyptian Pound 1,906 1,195 Euro 107,917 99,097 Ghanaian Cedi 158 187 Geogian Lari 1,197 962 Dollar (Hong Kong) 20,275 13,112 Hungary (Forint) 3,392 4,141 Icelandic Krona 1,772 2,907 Indian Rupee 29,144 23,127 Indonesia Rupiah 18,501 7,496 Israeli (Shekel) 641 1,427 Yen (Japan) 14,907 11,952 Jordanian Dinar 667 382 Kazakhstani Tenge 47 432 Kenyan Shilling 711 400 Kuwait Dinar 1,986 808 Lebanese Pound 50 Laos Kip 181 466 Malaysian (Ringgit) 6,489 4,438 Maurit ius (Rupee) 689 946 Mexican New Peso 10,467 3,744 Morocco Dirham 713 370 Dollar (New Zealand) 3,456 (518) Nigerian Naira 1,151 414 Krone (Norwegian) 8,765 2,265 Omanian Rial 654 332 Pakistani Rupee 1,538 1,030 Panama Balboa 39 159 Peru Sol 1,012 1,888 Philippines Peso 7,785 3,278 Polish (New Zloty) (9) (91) Pound (Sterling) 72,738 45,323 Qatar Riyal 1,510 1,002 Romanian Leu 1,445 1,728 Russian Federation Rouble 15,325 132 Saudi Riyal 3,046 818 Singapore Dollar 10,933 (4,147) South African Rand 11,468 11,592 South Korean Won 36,006 21,130 Sri Lankan Rupee 653 334 Krona (Swedish) 6,811 6,416 Franc (Swiss) 7,693 15,406 Thai (Bhat) 7,449 5,550 Dollar (Taiwan, New) 23,632 10,695 Tunisian Dinar 366 150 Turkish Lira (1,306) 50 Ukraine Hryvnia 409 69 UAE Dirham 1,808 1,252 Uruguayan Pesos 8 20 Vietnam Dong 486 739 Other 86 9,934
Total 591,173$ 462,528$ Additional Information — The Plan holdings are part of the MTA Master Trust of which the MTA Defined Benefit Plan participates on a percentage basis. The percentage of the Plan ownership for the year ended December 31, 2019 and December 31, 2018 was 86.09% and 84.19% respectively.
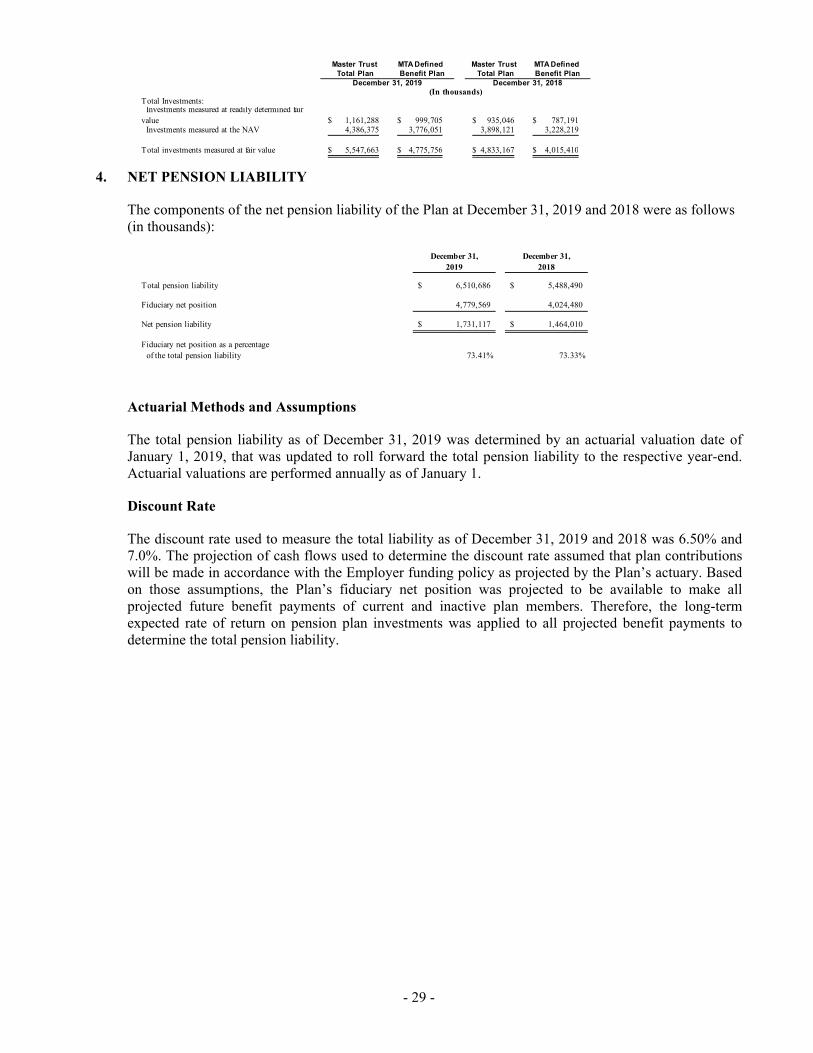
- 29 -
Master Trust MTA Defined Master Trust MTA Defined Total Plan Benefit Plan Total Plan Benefit Plan
Total Investments: Investments measured at readily determined fair value 1,161,288$ 999,705$ 935,046$ 787,191$ Investments measured at the NAV 4,386,375 3,776,051 3,898,121 3,228,219
Total investments measured at fair value 5,547,663$ 4,775,756$ 4,833,167$ 4,015,410$
December 31, 2019 December 31, 2018(In thousands)
4. NET PENSION LIABILITY
The components of the net pension liability of the Plan at December 31, 2019 and 2018 were as follows (in thousands):
December 31, December 31,2019 2018
Total pension liability 6,510,686$ 5,488,490$
Fiduciary net position 4,779,569 4,024,480
Net pension liability 1,731,117$ 1,464,010$
Fiduciary net position as a percentage of the total pension liability 73.41% 73.33%
Actuarial Methods and Assumptions
The total pension liability as of December 31, 2019 was determined by an actuarial valuation date of January 1, 2019, that was updated to roll forward the total pension liability to the respective year-end. Actuarial valuations are performed annually as of January 1.
Discount Rate
The discount rate used to measure the total liability as of December 31, 2019 and 2018 was 6.50% and 7.0%. The projection of cash flows used to determine the discount rate assumed that plan contributions will be made in accordance with the Employer funding policy as projected by the Plan’s actuary. Based on those assumptions, the Plan’s fiduciary net position was projected to be available to make all projected future benefit payments of current and inactive plan members. Therefore, the long-term expected rate of return on pension plan investments was applied to all projected benefit payments to determine the total pension liability.

- 30 -
Sensitivity of the Net Pension Liability to Changes in the Discount Rate
The following presents the 2019 net pension liability of the Plan, calculated using the discount rate of 6.50%; as well as what the Plan’s net pension would be if it were calculated using a discount rate that is 1-percentage point lower (5.50%) or 1-percentage point higher (7.50%) than the current rate:
2019(in thousands)
1% Current 1%Decrease Discount Rate Increase
5.50% 6.50% 7.50%
Net pension liability $2,556,206 $1,731,117 $1,036,341
The following presents the 2018 net pension liability of the Plan, calculated using the discount rate of 7.00%; as well as what the Plan’s net pension would be if it were calculated using a discount rate that is 1-percentage point lower (6.00%) or 1-percentage point higher (8.00%) than the current rate:
2018(in thousands)
1% Current 1%Decrease Discount Rate Increase
6.00% 7.00% 8.00%
Net pension liability $2,146,497 $1,464,010 $888,282
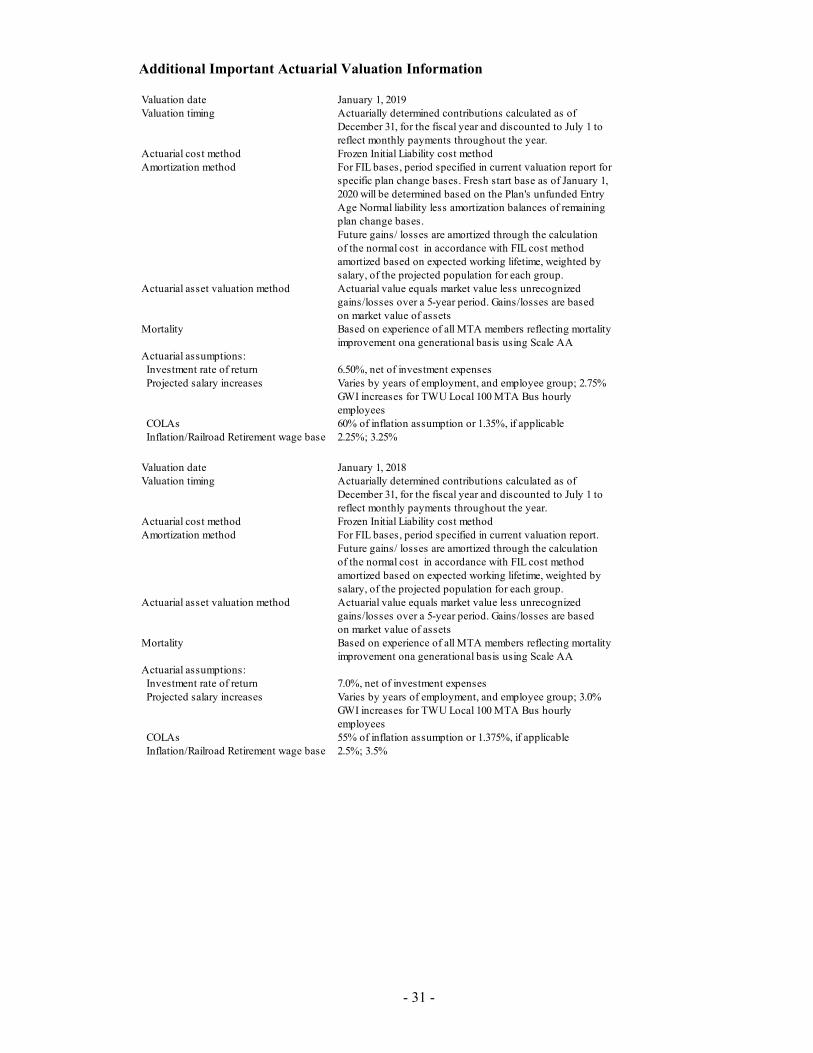
- 31 -
Additional Important Actuarial Valuation Information
Valuation date January 1, 2019Valuation timing Actuarially determined contributions calculated as of
December 31, for the fiscal year and discounted to July 1 toreflect monthly payments throughout the year.
Actuarial cost method Frozen Initial Liability cost methodAmortization method For FIL bases, period specified in current valuation report for
specific plan change bases. Fresh start base as of January 1,2020 will be determined based on the Plan's unfunded EntryAge Normal liability less amortization balances of remainingplan change bases.Future gains/ losses are amortized through the calculationof the normal cost in accordance with FIL cost methodamortized based on expected working lifetime, weighted bysalary, of the projected population for each group.
Actuarial asset valuation method Actuarial value equals market value less unrecognizedgains/losses over a 5-year period. Gains/losses are basedon market value of assets
Mortality Based on experience of all MTA members reflecting mortalityimprovement ona generational basis using Scale AA
Actuarial assumptions: Investment rate of return 6.50%, net of investment expenses Projected salary increases Varies by years of employment, and employee group; 2.75%
GWI increases for TWU Local 100 MTA Bus hourlyemployees
COLAs 60% of inflation assumption or 1.35%, if applicable Inflation/Railroad Retirement wage base 2.25%; 3.25%
Valuation date January 1, 2018Valuation timing Actuarially determined contributions calculated as of
December 31, for the fiscal year and discounted to July 1 toreflect monthly payments throughout the year.
Actuarial cost method Frozen Initial Liability cost methodAmortization method For FIL bases, period specified in current valuation report.
Future gains/ losses are amortized through the calculationof the normal cost in accordance with FIL cost methodamortized based on expected working lifetime, weighted bysalary, of the projected population for each group.
Actuarial asset valuation method Actuarial value equals market value less unrecognizedgains/losses over a 5-year period. Gains/losses are basedon market value of assets
Mortality Based on experience of all MTA members reflecting mortalityimprovement ona generational basis using Scale AA
Actuarial assumptions: Investment rate of return 7.0%, net of investment expenses Projected salary increases Varies by years of employment, and employee group; 3.0%
GWI increases for TWU Local 100 MTA Bus hourlyemployees
COLAs 55% of inflation assumption or 1.375%, if applicable Inflation/Railroad Retirement wage base 2.5%; 3.5%
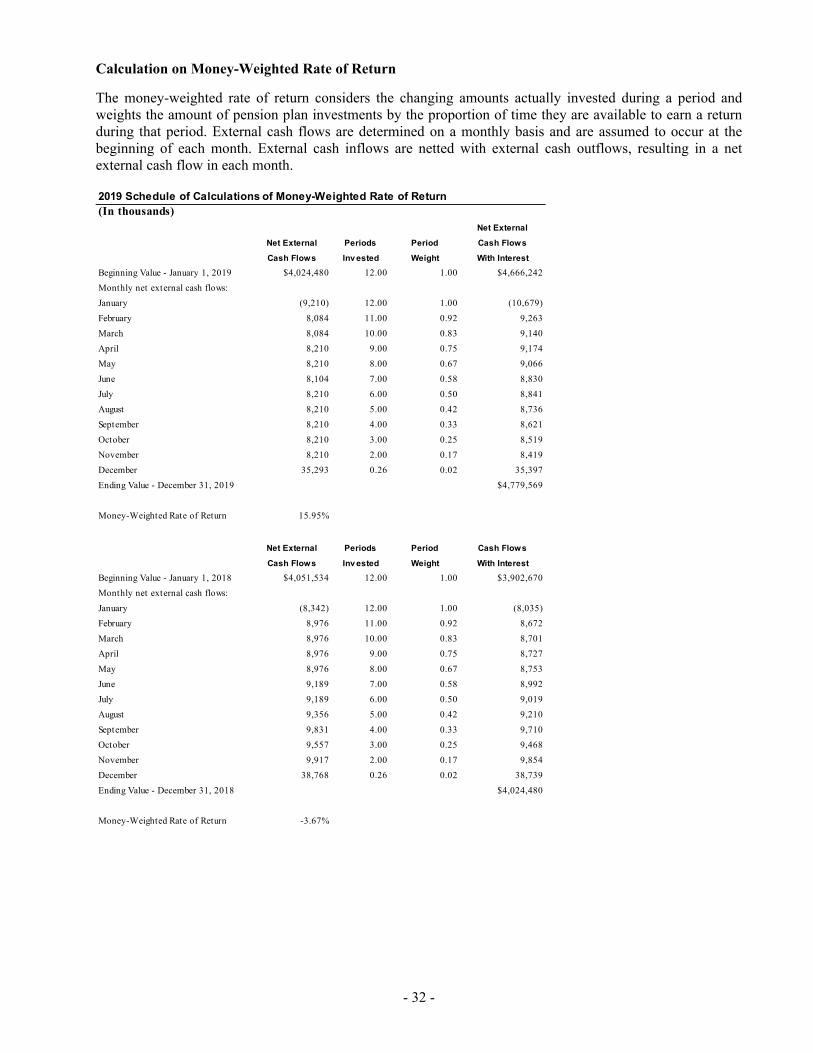
- 32 -
Calculation on Money-Weighted Rate of Return
The money-weighted rate of return considers the changing amounts actually invested during a period and weights the amount of pension plan investments by the proportion of time they are available to earn a return during that period. External cash flows are determined on a monthly basis and are assumed to occur at the beginning of each month. External cash inflows are netted with external cash outflows, resulting in a net external cash flow in each month.
2019 Schedule of Calculations of Money-Weighted Rate of Return(In thousands)
Net External
Net External Periods Period Cash Flows
Cash Flows Inv ested Weight With Interest
Beginning Value - January 1, 2019 $4,024,480 12.00 1.00 $4,666,242
Monthly net external cash flows:
January (9,210) 12.00 1.00 (10,679)
February 8,084 11.00 0.92 9,263
March 8,084 10.00 0.83 9,140
April 8,210 9.00 0.75 9,174
May 8,210 8.00 0.67 9,066
June 8,104 7.00 0.58 8,830
July 8,210 6.00 0.50 8,841
August 8,210 5.00 0.42 8,736
September 8,210 4.00 0.33 8,621
October 8,210 3.00 0.25 8,519
November 8,210 2.00 0.17 8,419
December 35,293 0.26 0.02 35,397
Ending Value - December 31, 2019 $4,779,569
Money-Weighted Rate of Return 15.95%
Net External Periods Period Cash Flows
Cash Flows Inv ested Weight With Interest
Beginning Value - January 1, 2018 $4,051,534 12.00 1.00 $3,902,670
Monthly net external cash flows:
January (8,342) 12.00 1.00 (8,035)
February 8,976 11.00 0.92 8,672
March 8,976 10.00 0.83 8,701
April 8,976 9.00 0.75 8,727
May 8,976 8.00 0.67 8,753
June 9,189 7.00 0.58 8,992
July 9,189 6.00 0.50 9,019
August 9,356 5.00 0.42 9,210
September 9,831 4.00 0.33 9,710
October 9,557 3.00 0.25 9,468
November 9,917 2.00 0.17 9,854
December 38,768 0.26 0.02 38,739
Ending Value - December 31, 2018 $4,024,480
Money-Weighted Rate of Return -3.67%

- 33 -
Calculation on Long-Term Expected Rate of Return
The best-estimate range for the long-term expected rate of return is determined by adding expected inflation to expected long-term real returns and reflecting expected volatility and correlation. The capital market assumptions are per Milliman's investment consulting practice as of December 31, 2019 and 2018.
SCHEDULE OF LONG TERM EXPECTED RATE OF RETURN FOR 2019
Target Real Rate
Asset Class Index Allocation* of Return
US Core Fixed Income Barclays Aggregate 9.00% 1.51%
US Long Bonds Barclays Long Term Government/Credit 1.00% 2.41%
US Bank/Leveraged Loans Credit Suisse Leveraged Loan 7.00% 2.74%
US Inflation-Indexed Bonds Barclays US TIPS 2.00% 0.71%
US High Yield Bonds BAML High Yield 4.00% 3.13%
Emerging Market Bonds JPM EMBI Plus 2.00% 3.36%
US Large Caps S&P 500 12.00% 4.33%
US Small Caps Russell 2000 6.00% 5.65%
Foreigh Developed Equity MSCI EAFE NR 12.00% 5.95%
Emerging Market Equity MSCI EM NR 5.00% 8.05%
Global REITS FTSE EPRA/NAREIT Developed 1.00% 5.50%
Private Real Estate Property NCREIF Property 4.00% 3.80%
Private Equity Cambridge Private Equity 9.00% 9.50%
Commodities Commodity 1.00% 2.79%
Hedge Funds - MultiStrategy HFRI: Fund Wtd Composite 16.00% 3.26%
Hedge Funds - Event Driven HFRI Event Driven 6.00% 3.41%
Hedge Funds - Equity Hedge HFRI Equity Driven 3.00% 3.82%
Assumed Inflation - Mean 2.25%
Assumed Inflation - Standard Deviation 1.65%
Portfolio Nominal Mean Return 6.73%
Portfolio Standard Deviation 10.94%
Long-Term Expected Rate of Return selected by MTA 6.50%
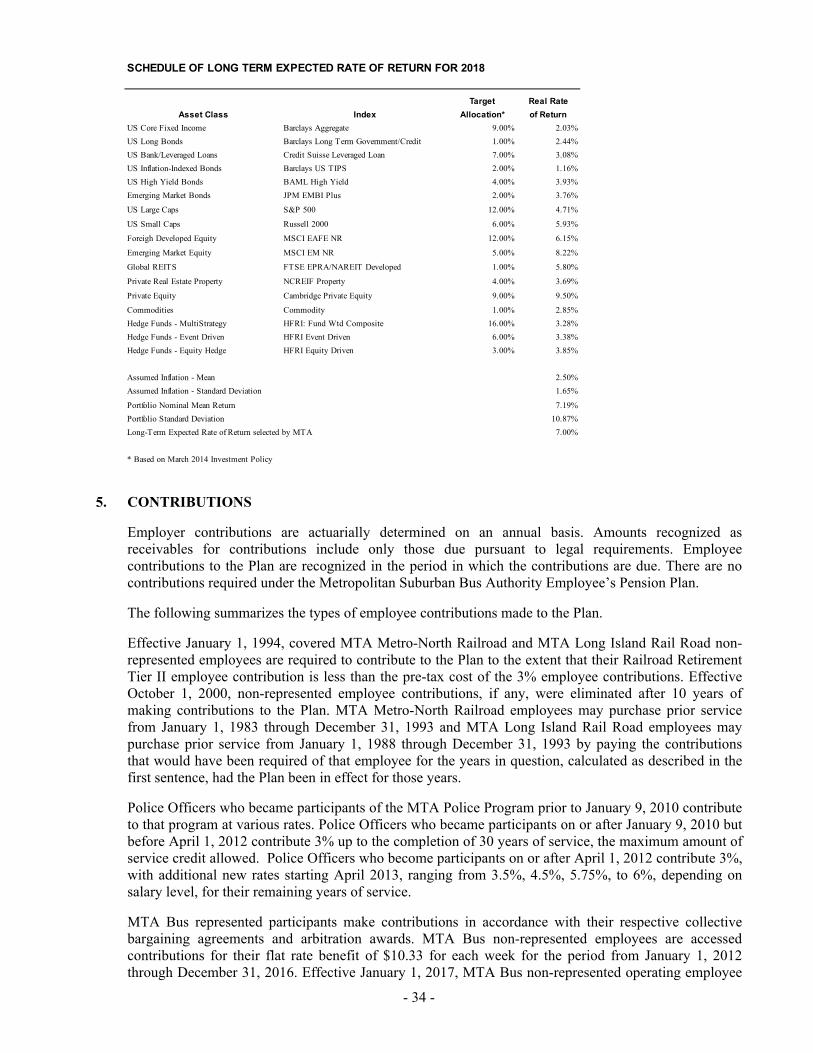
- 34 -
SCHEDULE OF LONG TERM EXPECTED RATE OF RETURN FOR 2018
Target Real Rate
Asset Class Index Allocation* of Return
US Core Fixed Income Barclays Aggregate 9.00% 2.03%
US Long Bonds Barclays Long Term Government/Credit 1.00% 2.44%
US Bank/Leveraged Loans Credit Suisse Leveraged Loan 7.00% 3.08%
US Inflation-Indexed Bonds Barclays US TIPS 2.00% 1.16%
US High Yield Bonds BAML High Yield 4.00% 3.93%
Emerging Market Bonds JPM EMBI Plus 2.00% 3.76%
US Large Caps S&P 500 12.00% 4.71%
US Small Caps Russell 2000 6.00% 5.93%
Foreigh Developed Equity MSCI EAFE NR 12.00% 6.15%
Emerging Market Equity MSCI EM NR 5.00% 8.22%
Global REITS FTSE EPRA/NAREIT Developed 1.00% 5.80%
Private Real Estate Property NCREIF Property 4.00% 3.69%
Private Equity Cambridge Private Equity 9.00% 9.50%
Commodities Commodity 1.00% 2.85%
Hedge Funds - MultiStrategy HFRI: Fund Wtd Composite 16.00% 3.28%
Hedge Funds - Event Driven HFRI Event Driven 6.00% 3.38%
Hedge Funds - Equity Hedge HFRI Equity Driven 3.00% 3.85%
Assumed Inflation - Mean 2.50%
Assumed Inflation - Standard Deviation 1.65%
Portfolio Nominal Mean Return 7.19%
Portfolio Standard Deviation 10.87%
Long-Term Expected Rate of Return selected by MTA 7.00%
* Based on March 2014 Investment Policy
5. CONTRIBUTIONS
Employer contributions are actuarially determined on an annual basis. Amounts recognized as receivables for contributions include only those due pursuant to legal requirements. Employee contributions to the Plan are recognized in the period in which the contributions are due. There are no contributions required under the Metropolitan Suburban Bus Authority Employee’s Pension Plan.
The following summarizes the types of employee contributions made to the Plan.
Effective January 1, 1994, covered MTA Metro-North Railroad and MTA Long Island Rail Road non-represented employees are required to contribute to the Plan to the extent that their Railroad Retirement Tier II employee contribution is less than the pre-tax cost of the 3% employee contributions. Effective October 1, 2000, non-represented employee contributions, if any, were eliminated after 10 years of making contributions to the Plan. MTA Metro-North Railroad employees may purchase prior service from January 1, 1983 through December 31, 1993 and MTA Long Island Rail Road employees may purchase prior service from January 1, 1988 through December 31, 1993 by paying the contributions that would have been required of that employee for the years in question, calculated as described in the first sentence, had the Plan been in effect for those years.
Police Officers who became participants of the MTA Police Program prior to January 9, 2010 contribute to that program at various rates. Police Officers who became participants on or after January 9, 2010 but before April 1, 2012 contribute 3% up to the completion of 30 years of service, the maximum amount of service credit allowed. Police Officers who become participants on or after April 1, 2012 contribute 3%, with additional new rates starting April 2013, ranging from 3.5%, 4.5%, 5.75%, to 6%, depending on salary level, for their remaining years of service.
MTA Bus represented participants make contributions in accordance with their respective collective bargaining agreements and arbitration awards. MTA Bus non-represented employees are accessed contributions for their flat rate benefit of $10.33 for each week for the period from January 1, 2012 through December 31, 2016. Effective January 1, 2017, MTA Bus non-represented operating employee
- 35 -
hired prior to April 1, 2012 contribute 2% of gross wages. MTA Bus non-represented non-operating employee hired prior to April 1, 2012 contribute 4.85% of gross wages for ten years of service after January 1, 2017, and then 1.85% gross salary thereafter until retirement. Contributions levels for MTA Bus non-represented employees hired on or after April 1, 2012, which are required until retirement, are determined every year at the beginning of the calendar year, and are based on annual wages during the prior year and the following schedule:
Annual Wages
Earned During the Prior Year
Contribution Rate
Up to $45,000 3.00% $45,001 to $55,000 3.50% $55,001 to $75,000 4.50%
$75,001 to $100,000 5.75% Greater than $100,000 6.00%
In 2017, a reserve was established for fifteen former MTA employees in accordance with Chapter 533 of the Laws of 2015. As of December 31, 2019, total transfer in the amount of $1.9 million, to the New York State and Local Police and Fire Retirement System allowed former MTA Police employees to transfer membership and contributions to the New York State and Local Police and Fire Retirement System from the MTA Defined Benefit Plan.
Covered MTA Metro-North Railroad represented employees and MTA Long Island Rail Road represented employees who first became eligible to be Plan participants prior to January 30, 2008 contribute 3% of salary. MTA Staten Island Railway employees contribute 3% of salary except for represented employees hired on or after June 1, 2010 who contribute 4%. MTA Long Island Rail Road represented employees who became participants after January 30, 2008 contribute 4% of salary. For the MTA Staten Island Railway employees, contributions are not required after the completion of 10 years of credited service. MTA Long Island Rail Road represented employees are required to make the employee contributions for 10 years, or 10 years if hired after certain dates in 2014 as per collective bargaining agreements. Certain Metro-North represented employees, depending on their collective bargaining agreements, are required to make the employee contributions until January 1, 2014, January 1, 2017, June 30, 2017, or the completion of required years of credited service as per the relevant collective bargaining agreements.
Covered MTA Bus represented employees and certain non-represented employees are required to contribute a fixed dollar amount, which varies, by Depot. MTA Bus is required to make significant annual contributions to the MTA Plan on a current basis. Pursuant to the January 1, 2019 and January 1, 2018 actuarial valuations for the MTA Plan, which included amounts for actuarial assets and liabilities relating to both active and retired members for most portions of the former private plans (excepting, for example, members of the Transport Workers Union — New York City Private Bus Lines Pension Trust who were working on school bus routes which did not become part of MTA Bus service), MTA Bus recorded pension expense equal to the valuation annual required contribution of $59.8 and $57.3 for the calendar years ended December 31, 2019 and 2018, respectively. Both of these employer contributions were paid to the MTA Plan in their respective years.
6. ACTUARIAL METHODS AND ASSUMPTIONS
A. Actuarial Valuation Method
The Frozen Initial Liability method was used for determining the actuarial determined contribution comprising the normal cost-plus amortization payments of the frozen unfunded actuarial accrued liability. The Normal Cost equals the present value of future employer normal contributions divided by the average future working lifetime factor. This factor equals the present value of future compensation or service divided
- 36 -
by current compensation or the member count (less certain retirements), depending if benefits are pay-related, and weighted by the present value of benefits. Service is used for MTA Bus members with hourly benefits and benefits indexed to general wage increases. The Entry Age Normal (EAN) method is used for determining changes in the frozen unfunded actuarial accrued liability due to plan provisions and assumption changes. For MTA Bus members with benefits indexed to general wage increases, the entry age normal cost uses assumed general wage increases rather than payroll, which conforms to a method compliant for GASB 67 purposes. For MTA Bus members with hourly benefits that are not indexed, the entry age normal cost is based on a level dollar method. If the benefit style changed from one type to another, the plan change base is based on the EAN method in effect prior to the change in benefit. For MTA Bus non-represented members where benefits are bifurcated into a past service level dollar component and a future service MaBSTOA benefit component, the EAN normal cost assumes that the MaBSTOA style benefits were in effect for the member’s entire career. For groups where service was reported as of the valuation date, Entry Age is based on an effective date of hire equal to the valuation date less provided service plus any purchased service, but not reflecting any military service purchased. B. Asset Valuation Method
The Asset Valuation method smooths gains and losses over a 5-year period. The formula for the asset valuation method is as follows:
Actuarial Value of Assets = MVt - .8UR1 - .6UR2 - .4UR3 - .2UR4
Where
MVt = Market Value of assets as of the valuation date.
URn = Unexpected return during the nth year preceding the valuation date. The unexpected return for a year equals the total investment return minus the total expected return. The total expected return equals the market value of assets at the beginning of the year plus the weighted net cash flow during the year multiplied by the expected rate of return.
The resulting value cannot be less than 80% or greater than 120% of the market value of assets.
The market value of assets is adjusted for any contributions made in the current year attributable to a prior year less any contributions made in a prior year and attributable to a future year, determined for each Agency independently.
C. Actuarial Assumptions Universal to all Groups
The assumptions described below were primarily determined based on an experience analysis covering the period from January 1, 2006 to December 31, 2011, with certain assumptions modified subsequently. The postretirement mortality assumption is based on an experience analysis covering the period from January 1, 2011 to December 31, 2015.
Interest — 6.50% per annum, compounded annually.
Railroad Retirement Wage Base — 3.25% per year.
Consumer Price Index — 2.25% per year.
Cost of Living Increases - 60% of inflation assumption or 1.35% per annum, compounded annually for Police and MTA Bus members eligible for a cost of living adjustment.
- 37 -
Provision for Expenses — Estimated administrative expenses are added to the normal cost. Administrative expenses are based on the average of the prior three year’s reported administrative expenses and are assumed payable in the middle of the plan year. Valuation Compensation: The valuation compensation is equal to the annualized base salary as of December 31, 2018 adjusted for wage increases granted after the valuation date but retroactive to earlier periods, multiplied by the overtime assumption and assumed salary increases for the year. Salary increases are assumed to occur on average at mid-year. Retroactive wage adjustments are as follows:
MTA Metro-North represented employees: 5.0625% for IBT and ACRE MTA Staten Island Railway represented employees: 5.0625% for UTU
Mortality — Preretirement and postretirement healthy annuitant rates are projected on a generational basis using Scale AA. As a generational table, it reflects mortality improvements both before and after the measurement date.
Preretirement — RP-2000 Employee Mortality Table for Males and Females with Blue collar adjustments.
Postretirement Healthy Lives — 95% of RP-2000 Healthy Annuitant mortality table for males with Blue Collar adjustments and 116% of the rates from the RP-2000 Healthy Annuitant mortality table for females.
Postretirement Disabled Lives — RP-2014 Disabled Annuitant mortality table for males and females.
Post-termination Death Benefits - For current inactive participants eligible for post-retirement death benefits, an amount of $25,000 ($10,000 for certain M.S.B.A. inactive participants) is assumed to be payable at death. For current terminated vested members, $100,000 is assumed to be payable at death prior to retirement, except for Police officers. A load of 8.75% is applied to the liability for Police officers.
Participant Data — Service for MTA Police, MTA Metro-North Railroad and MTA Long Island Rail Road represented and management members is based on the sum of credited service, purchased service and military service provided by MTA. Retirement status and benefits based on information provided in JP Morgan file as of the valuation date, except if reported as disability retirement previously, the member continued to be treated as a disability retirement. For inactive MTA Police, MTA Metro-North and MTA Long Island Rail Road represented and management participants, future offsets for Railroad Retirement benefits are estimated and assumed to occur at age 62 unless disabled or it appears the offset has occurred. For inactive MTA Long Island Rail Road Pension participants, offsets for Railroad Retirement benefits are estimated and assumed to occur at the member’s age 65. Benefits, net of any Railroad Retirement benefits, are estimated for vested members who terminated during the past year if not provided by the Authority. For inactive MTA Bus participants eligible for a COLA, including retroactive benefit increases that had not been reflected in the JP Morgan data, the increased benefits and basis for the COLA were estimated based on the terms of the Award.
D. Changes in Actuarial Assumptions Universal to all Groups
The provision for administrative expenses was changed from a 3-year average to a 2-year average of prior administrative expense charges.
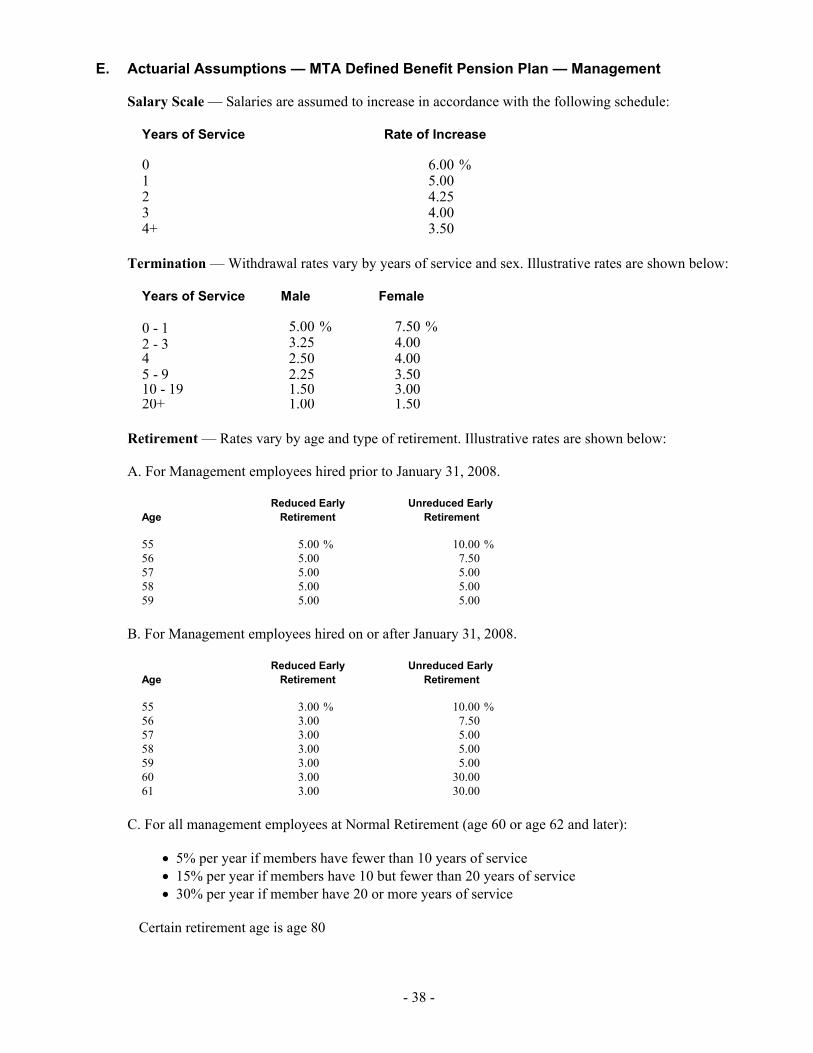
- 38 -
E. Actuarial Assumptions — MTA Defined Benefit Pension Plan — Management
Salary Scale — Salaries are assumed to increase in accordance with the following schedule:
Years of Service Rate of Increase
0 6.00 % 1 5.00 2 4.25 3 4.00 4+ 3.50
Termination — Withdrawal rates vary by years of service and sex. Illustrative rates are shown below:
Years of Service Male Female
0 - 1 5.00 % 7.50 % 2 - 3 3.25 4.00 4 2.50 4.00 5 - 9 2.25 3.50 10 - 19 1.50 3.00 20+ 1.00 1.50
Retirement — Rates vary by age and type of retirement. Illustrative rates are shown below:
A. For Management employees hired prior to January 31, 2008.
Reduced Early Unreduced Early Age Retirement Retirement
55 5.00 % 10.00 % 56 5.00 7.50 57 5.00 5.00 58 5.00 5.00 59 5.00 5.00
B. For Management employees hired on or after January 31, 2008.
Reduced Early Unreduced Early Age Retirement Retirement
55 3.00 % 10.00 % 56 3.00 7.50 57 3.00 5.00 58 3.00 5.00 59 3.00 5.00 60 3.00 30.00 61 3.00 30.00
C. For all management employees at Normal Retirement (age 60 or age 62 and later):
5% per year if members have fewer than 10 years of service 15% per year if members have 10 but fewer than 20 years of service 30% per year if member have 20 or more years of service
Certain retirement age is age 80
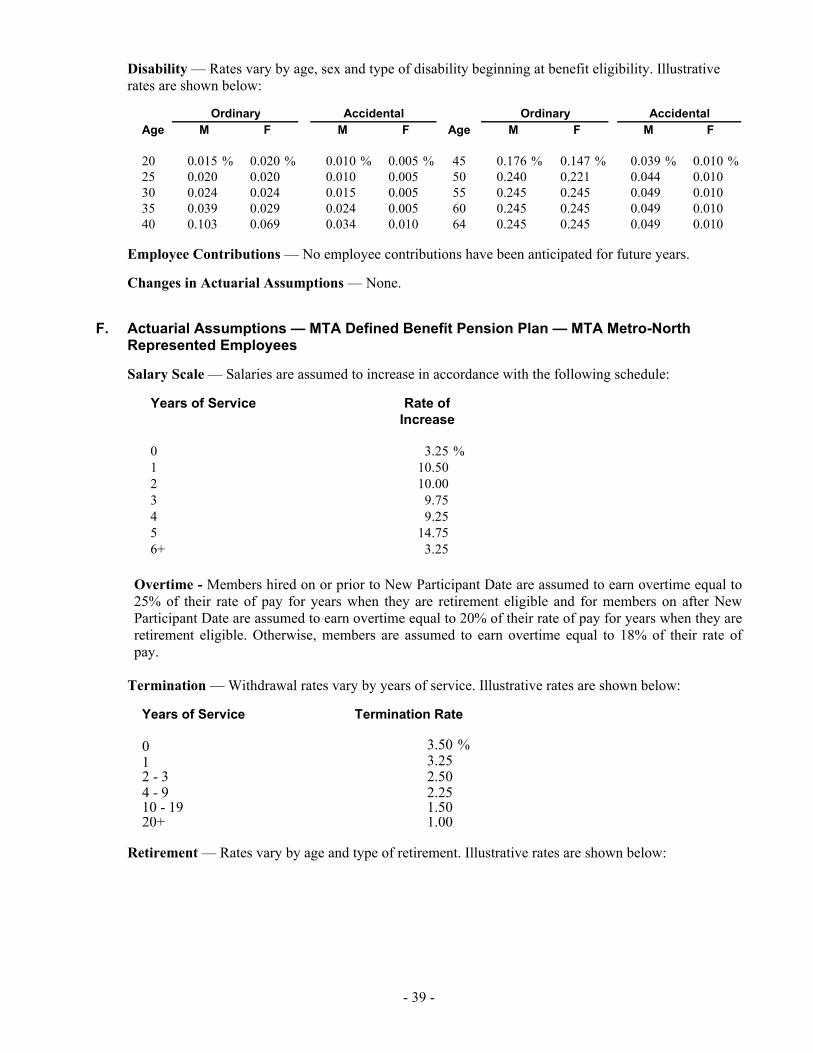
- 39 -
Disability — Rates vary by age, sex and type of disability beginning at benefit eligibility. Illustrative rates are shown below:
Age M F M F Age M F M F
20 0.015 % 0.020 % 0.010 % 0.005 % 45 0.176 % 0.147 % 0.039 % 0.010 %25 0.020 0.020 0.010 0.005 50 0.240 0.221 0.044 0.010 30 0.024 0.024 0.015 0.005 55 0.245 0.245 0.049 0.010 35 0.039 0.029 0.024 0.005 60 0.245 0.245 0.049 0.010 40 0.103 0.069 0.034 0.010 64 0.245 0.245 0.049 0.010
AccidentalOrdinaryAccidentalOrdinary
Employee Contributions — No employee contributions have been anticipated for future years.
Changes in Actuarial Assumptions — None.
F. Actuarial Assumptions — MTA Defined Benefit Pension Plan — MTA Metro-North Represented Employees
Salary Scale — Salaries are assumed to increase in accordance with the following schedule:
Years of Service Rate ofIncrease
0 3.25 % 1 10.50 2 10.00 3 9.75 4 9.25 5 14.75 6+ 3.25
Overtime - Members hired on or prior to New Participant Date are assumed to earn overtime equal to 25% of their rate of pay for years when they are retirement eligible and for members on after New Participant Date are assumed to earn overtime equal to 20% of their rate of pay for years when they are retirement eligible. Otherwise, members are assumed to earn overtime equal to 18% of their rate of pay.
Termination — Withdrawal rates vary by years of service. Illustrative rates are shown below:
Years of Service Termination Rate
0 3.50 % 1 3.25 2 - 3 2.50 4 - 9 2.25 10 - 19 1.50 20+ 1.00
Retirement — Rates vary by age and type of retirement. Illustrative rates are shown below:
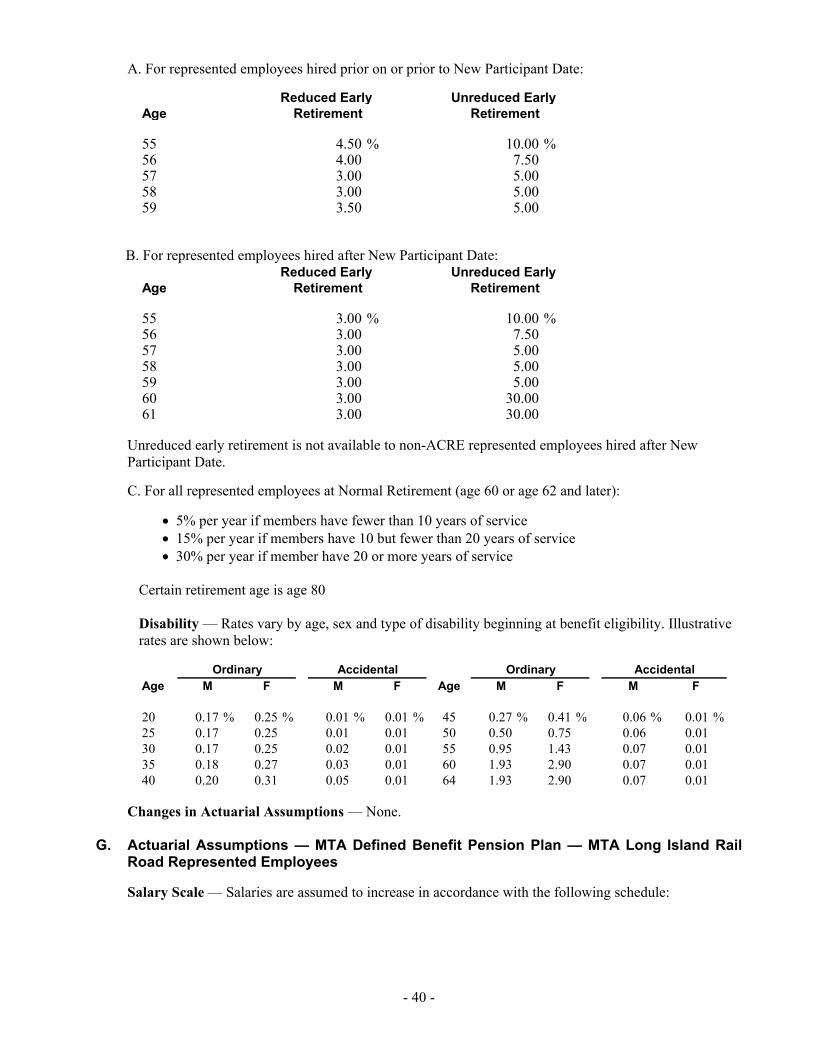
- 40 -
A. For represented employees hired prior on or prior to New Participant Date:
Reduced Early Unreduced Early Age Retirement Retirement
55 4.50 % 10.00 % 56 4.00 7.50 57 3.00 5.00 58 3.00 5.00 59 3.50 5.00
B. For represented employees hired after New Participant Date:
Reduced Early Unreduced Early Age Retirement Retirement
55 3.00 % 10.00 % 56 3.00 7.50 57 3.00 5.00 58 3.00 5.00 59 3.00 5.00 60 3.00 30.00 61 3.00 30.00
Unreduced early retirement is not available to non-ACRE represented employees hired after New Participant Date.
C. For all represented employees at Normal Retirement (age 60 or age 62 and later):
5% per year if members have fewer than 10 years of service 15% per year if members have 10 but fewer than 20 years of service 30% per year if member have 20 or more years of service
Certain retirement age is age 80
Disability — Rates vary by age, sex and type of disability beginning at benefit eligibility. Illustrative rates are shown below:
Age M F M F Age M F M F
20 0.17 % 0.25 % 0.01 % 0.01 % 45 0.27 % 0.41 % 0.06 % 0.01 % 25 0.17 0.25 0.01 0.01 50 0.50 0.75 0.06 0.01 30 0.17 0.25 0.02 0.01 55 0.95 1.43 0.07 0.01 35 0.18 0.27 0.03 0.01 60 1.93 2.90 0.07 0.01 40 0.20 0.31 0.05 0.01 64 1.93 2.90 0.07 0.01
Ordinary Accidental Ordinary Accidental
Changes in Actuarial Assumptions — None.
G. Actuarial Assumptions — MTA Defined Benefit Pension Plan — MTA Long Island Rail Road Represented Employees
Salary Scale — Salaries are assumed to increase in accordance with the following schedule:
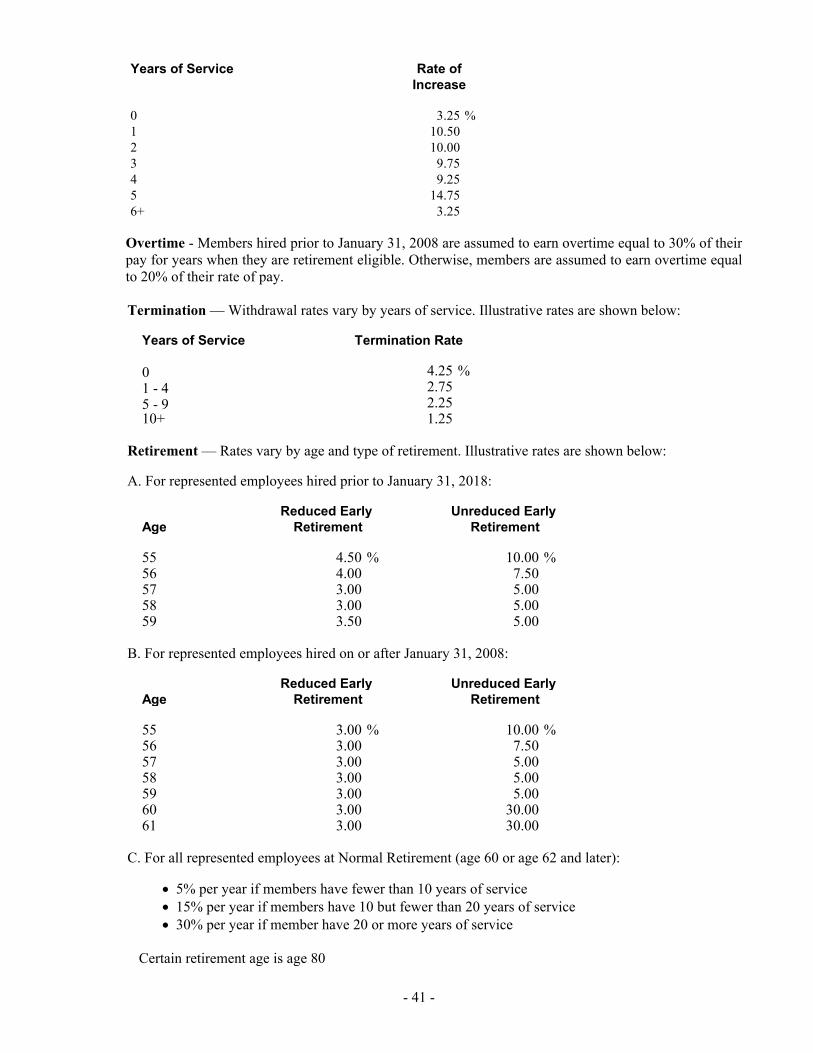
- 41 -
Years of Service Rate ofIncrease
0 3.25 % 1 10.50 2 10.00 3 9.75 4 9.25 5 14.75 6+ 3.25
Overtime - Members hired prior to January 31, 2008 are assumed to earn overtime equal to 30% of their pay for years when they are retirement eligible. Otherwise, members are assumed to earn overtime equal to 20% of their rate of pay. Termination — Withdrawal rates vary by years of service. Illustrative rates are shown below:
Years of Service Termination Rate
0 4.25 % 1 - 4 2.75 5 - 9 2.25 10+ 1.25
Retirement — Rates vary by age and type of retirement. Illustrative rates are shown below:
A. For represented employees hired prior to January 31, 2018:
Reduced Early Unreduced Early Age Retirement Retirement
55 4.50 % 10.00 % 56 4.00 7.50 57 3.00 5.00 58 3.00 5.00 59 3.50 5.00
B. For represented employees hired on or after January 31, 2008:
Reduced Early Unreduced Early Age Retirement Retirement
55 3.00 % 10.00 % 56 3.00 7.50 57 3.00 5.00 58 3.00 5.00 59 3.00 5.00 60 3.00 30.00 61 3.00 30.00
C. For all represented employees at Normal Retirement (age 60 or age 62 and later):
5% per year if members have fewer than 10 years of service 15% per year if members have 10 but fewer than 20 years of service 30% per year if member have 20 or more years of service
Certain retirement age is age 80
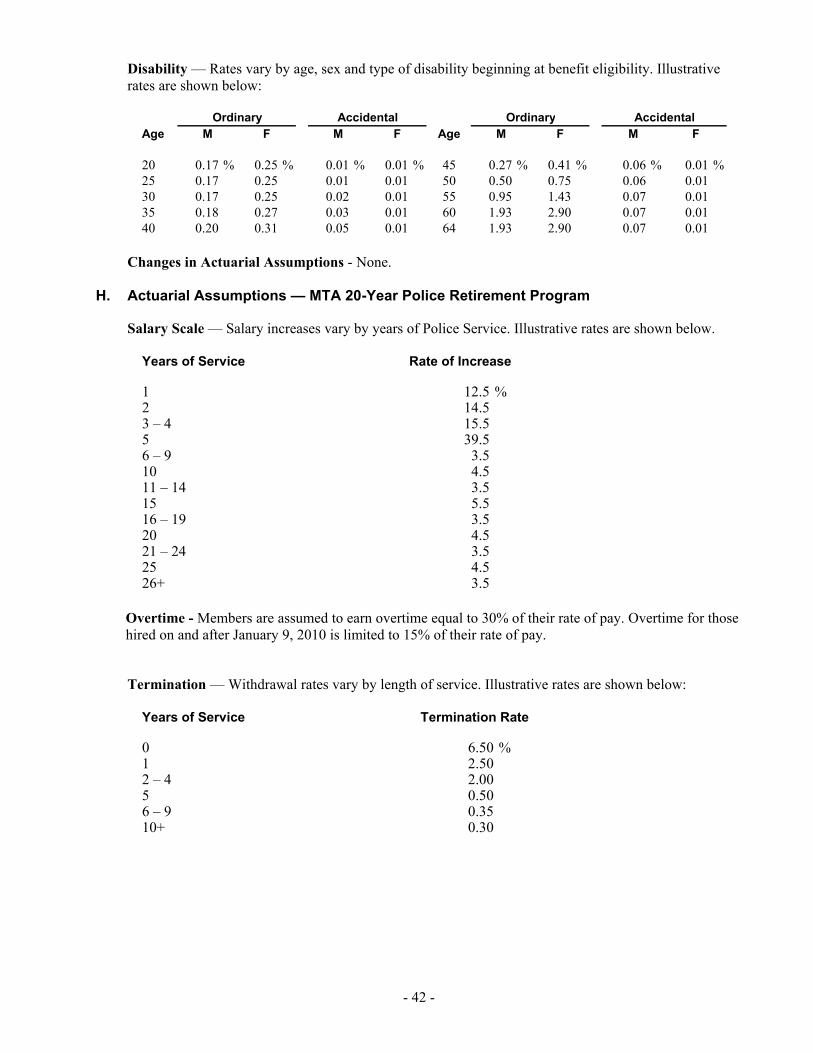
- 42 -
Disability — Rates vary by age, sex and type of disability beginning at benefit eligibility. Illustrative rates are shown below:
Age M F M F Age M F M F
20 0.17 % 0.25 % 0.01 % 0.01 % 45 0.27 % 0.41 % 0.06 % 0.01 % 25 0.17 0.25 0.01 0.01 50 0.50 0.75 0.06 0.01 30 0.17 0.25 0.02 0.01 55 0.95 1.43 0.07 0.01 35 0.18 0.27 0.03 0.01 60 1.93 2.90 0.07 0.01 40 0.20 0.31 0.05 0.01 64 1.93 2.90 0.07 0.01
Ordinary Accidental Ordinary Accidental
Changes in Actuarial Assumptions - None.
H. Actuarial Assumptions — MTA 20-Year Police Retirement Program
Salary Scale — Salary increases vary by years of Police Service. Illustrative rates are shown below.
Years of Service Rate of Increase
1 12.5 % 2 14.5 3 – 4 15.5 5 39.5 6 – 9 3.5 10 4.5 11 – 14 3.5 15 5.5 16 – 19 3.5 20 4.5 21 – 24 3.5 25 4.5 26+ 3.5
Overtime - Members are assumed to earn overtime equal to 30% of their rate of pay. Overtime for those hired on and after January 9, 2010 is limited to 15% of their rate of pay.
Termination — Withdrawal rates vary by length of service. Illustrative rates are shown below:
Years of Service Termination Rate
0 6.50 % 1 2.50 2 – 4 2.00 5 0.50 6 – 9 0.35 10+ 0.30
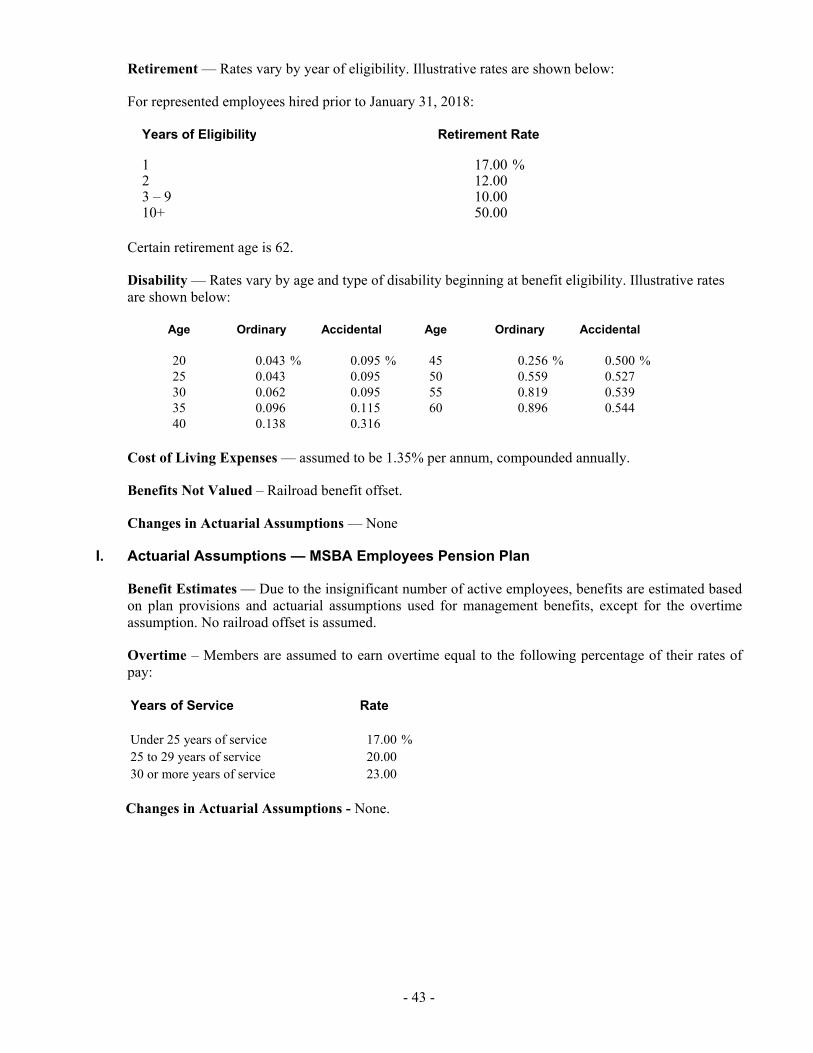
- 43 -
Retirement — Rates vary by year of eligibility. Illustrative rates are shown below:
For represented employees hired prior to January 31, 2018:
Years of Eligibility Retirement Rate
1 17.00 % 2 12.00 3 – 9 10.00 10+ 50.00
Certain retirement age is 62.
Disability — Rates vary by age and type of disability beginning at benefit eligibility. Illustrative rates are shown below:
Age Ordinary Accidental Age Ordinary Accidental
20 0.043 % 0.095 % 45 0.256 % 0.500 %25 0.043 0.095 50 0.559 0.527 30 0.062 0.095 55 0.819 0.539 35 0.096 0.115 60 0.896 0.544 40 0.138 0.316
Cost of Living Expenses — assumed to be 1.35% per annum, compounded annually.
Benefits Not Valued – Railroad benefit offset.
Changes in Actuarial Assumptions — None
I. Actuarial Assumptions — MSBA Employees Pension Plan
Benefit Estimates — Due to the insignificant number of active employees, benefits are estimated based on plan provisions and actuarial assumptions used for management benefits, except for the overtime assumption. No railroad offset is assumed.
Overtime – Members are assumed to earn overtime equal to the following percentage of their rates of pay:
Years of Service Rate
Under 25 years of service 17.00 % 25 to 29 years of service 20.00 30 or more years of service 23.00
Changes in Actuarial Assumptions - None.
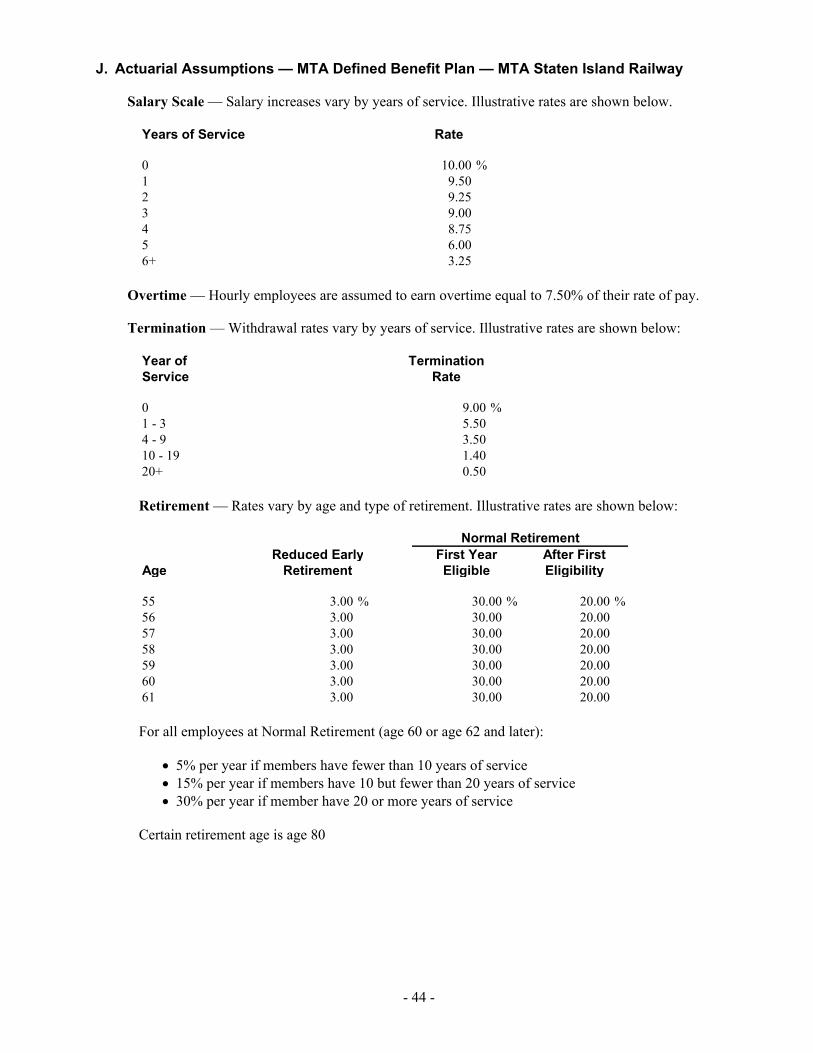
- 44 -
J. Actuarial Assumptions — MTA Defined Benefit Plan — MTA Staten Island Railway
Salary Scale — Salary increases vary by years of service. Illustrative rates are shown below.
Years of Service Rate
0 10.00 % 1 9.50 2 9.25 3 9.00 4 8.75 5 6.00 6+ 3.25
Overtime — Hourly employees are assumed to earn overtime equal to 7.50% of their rate of pay.
Termination — Withdrawal rates vary by years of service. Illustrative rates are shown below:
Year of TerminationService Rate
0 9.00 %1 - 3 5.50 4 - 9 3.50 10 - 19 1.40 20+ 0.50
Retirement — Rates vary by age and type of retirement. Illustrative rates are shown below:
Reduced Early First Year After FirstAge Retirement Eligible Eligibility
55 3.00 % 30.00 % 20.00 % 56 3.00 30.00 20.00 57 3.00 30.00 20.00 58 3.00 30.00 20.00 59 3.00 30.00 20.00 60 3.00 30.00 20.00 61 3.00 30.00 20.00
Normal Retirement
For all employees at Normal Retirement (age 60 or age 62 and later):
5% per year if members have fewer than 10 years of service 15% per year if members have 10 but fewer than 20 years of service 30% per year if member have 20 or more years of service
Certain retirement age is age 80
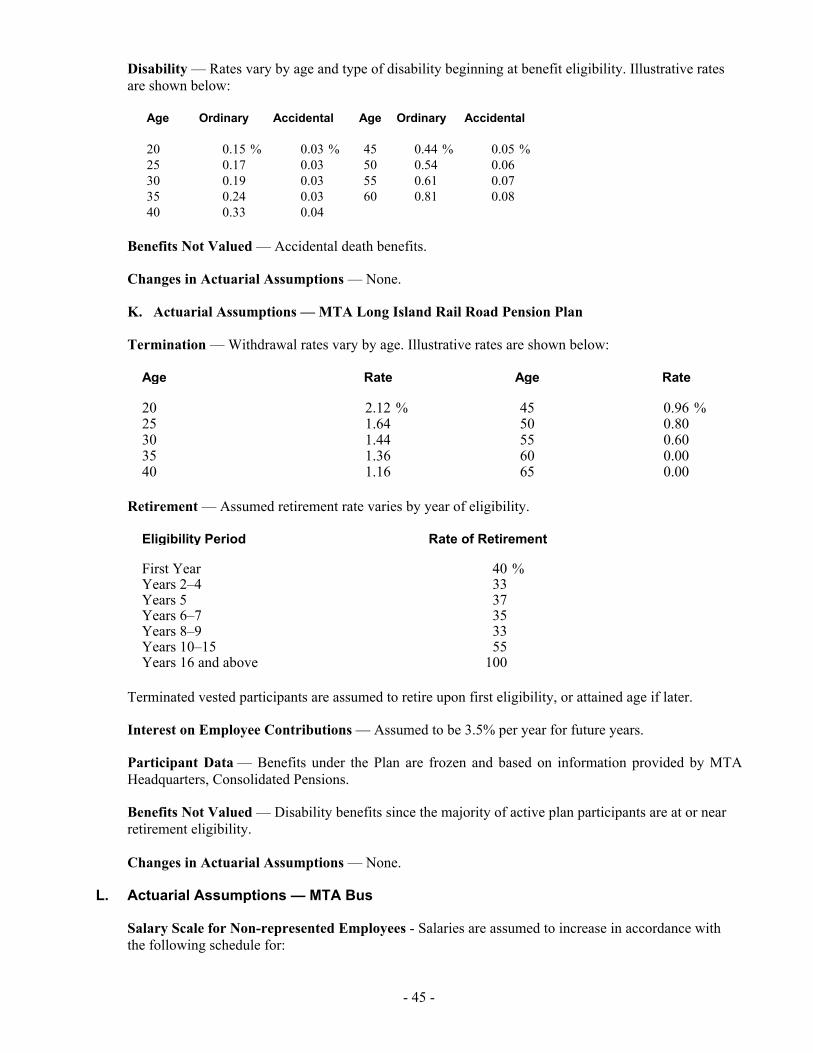
- 45 -
Disability — Rates vary by age and type of disability beginning at benefit eligibility. Illustrative rates are shown below:
Age Ordinary Accidental Age Ordinary Accidental
20 0.15 % 0.03 % 45 0.44 % 0.05 % 25 0.17 0.03 50 0.54 0.06 30 0.19 0.03 55 0.61 0.07 35 0.24 0.03 60 0.81 0.08 40 0.33 0.04
Benefits Not Valued — Accidental death benefits.
Changes in Actuarial Assumptions — None.
K. Actuarial Assumptions — MTA Long Island Rail Road Pension Plan
Termination — Withdrawal rates vary by age. Illustrative rates are shown below:
Age Rate Age Rate
20 2.12 % 45 0.96 % 25 1.64 50 0.80 30 1.44 55 0.60 35 1.36 60 0.00 40 1.16 65 0.00
Retirement — Assumed retirement rate varies by year of eligibility.
Eligibility Period Rate of Retirement
First Year 40 % Years 2–4 33 Years 5 37 Years 6–7 35 Years 8–9 33 Years 10–15 55 Years 16 and above 100
Terminated vested participants are assumed to retire upon first eligibility, or attained age if later.
Interest on Employee Contributions — Assumed to be 3.5% per year for future years.
Participant Data — Benefits under the Plan are frozen and based on information provided by MTA Headquarters, Consolidated Pensions.
Benefits Not Valued — Disability benefits since the majority of active plan participants are at or near retirement eligibility. Changes in Actuarial Assumptions — None.
L. Actuarial Assumptions — MTA Bus
Salary Scale for Non-represented Employees - Salaries are assumed to increase in accordance with the following schedule for:

- 46 -
Years of Service Rate
0 6.00 % 1 5.00 2 4.25 3 4.00 4+ 3.50
General Wage Increase (GWI) - The benefit level and contribution rate is assumed to increase 3% each year based on the anniversary of the last scheduled increase for TWU Local 100, ATU 1179, and ATU 1181 represented employees.
Termination — Withdrawal rates vary by years of service. Illustrative rates are shown below:
Year of TerminationService Rate
0 17.50 %1 4.75 2 - 9 2.75 10+ 2.75
Retirement — Rates vary by age, service, employee type, Tier, Operating/Non-operating distinction, and retirement eligibility. All members are assumed to retire by age 80. Terminated vested members are assumed to retire at first eligibility for an unreduced benefit. Illustrative rates are shown below:
For represented members:
Years of Service at RetirementAge <5 5-10 10+
57-64 N/A N/A 30 % 65-79 0 % 5 % 30 80 + 100 100 100
For certain former non-represented employees of Alliance Companies (Article 18):
Age Retirement Rate
55–56 6 % 57–58 8 59 9 60–61 13 62 25 63–64 15 65 100
For all other non-represented employees:
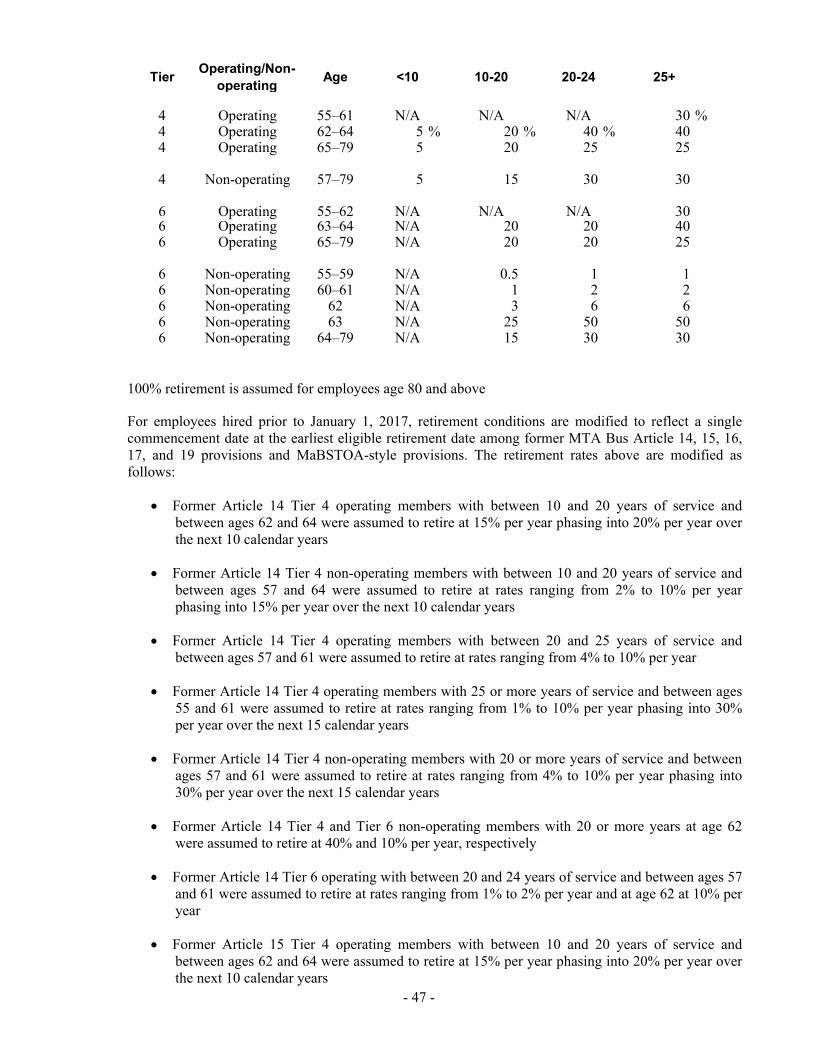
- 47 -
TierOperating/Non-
operatingAge <10 10-20 20-24 25+
4 Operating 55–61 N/A N/A N/A 30 % 4 Operating 62–64 5 % 20 % 40 % 40 4 Operating 65–79 5 20 25 25
4 Non-operating 57–79 5 15 30 30
6 Operating 55–62 N/A N/A N/A 30 6 Operating 63–64 N/A 20 20 40 6 Operating 65–79 N/A 20 20 25
6 Non-operating 55–59 N/A 0.5 1 1 6 Non-operating 60–61 N/A 1 2 2 6 Non-operating 62 N/A 3 6 6 6 Non-operating 63 N/A 25 50 50 6 Non-operating 64–79 N/A 15 30 30
100% retirement is assumed for employees age 80 and above
For employees hired prior to January 1, 2017, retirement conditions are modified to reflect a single commencement date at the earliest eligible retirement date among former MTA Bus Article 14, 15, 16, 17, and 19 provisions and MaBSTOA-style provisions. The retirement rates above are modified as follows:
Former Article 14 Tier 4 operating members with between 10 and 20 years of service and between ages 62 and 64 were assumed to retire at 15% per year phasing into 20% per year over the next 10 calendar years
Former Article 14 Tier 4 non-operating members with between 10 and 20 years of service and between ages 57 and 64 were assumed to retire at rates ranging from 2% to 10% per year phasing into 15% per year over the next 10 calendar years
Former Article 14 Tier 4 operating members with between 20 and 25 years of service and between ages 57 and 61 were assumed to retire at rates ranging from 4% to 10% per year
Former Article 14 Tier 4 operating members with 25 or more years of service and between ages 55 and 61 were assumed to retire at rates ranging from 1% to 10% per year phasing into 30% per year over the next 15 calendar years
Former Article 14 Tier 4 non-operating members with 20 or more years of service and between ages 57 and 61 were assumed to retire at rates ranging from 4% to 10% per year phasing into 30% per year over the next 15 calendar years
Former Article 14 Tier 4 and Tier 6 non-operating members with 20 or more years at age 62 were assumed to retire at 40% and 10% per year, respectively
Former Article 14 Tier 6 operating with between 20 and 24 years of service and between ages 57 and 61 were assumed to retire at rates ranging from 1% to 2% per year and at age 62 at 10% per year
Former Article 15 Tier 4 operating members with between 10 and 20 years of service and between ages 62 and 64 were assumed to retire at 15% per year phasing into 20% per year over the next 10 calendar years
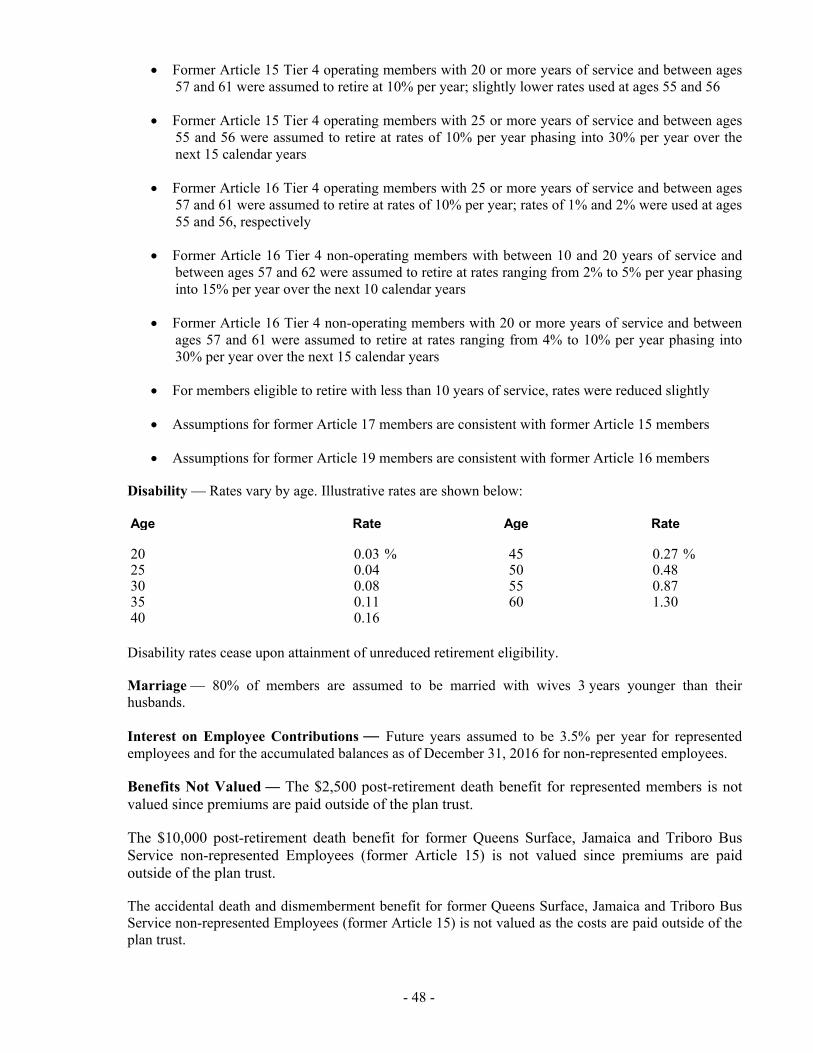
- 48 -
Former Article 15 Tier 4 operating members with 20 or more years of service and between ages 57 and 61 were assumed to retire at 10% per year; slightly lower rates used at ages 55 and 56
Former Article 15 Tier 4 operating members with 25 or more years of service and between ages 55 and 56 were assumed to retire at rates of 10% per year phasing into 30% per year over the next 15 calendar years
Former Article 16 Tier 4 operating members with 25 or more years of service and between ages 57 and 61 were assumed to retire at rates of 10% per year; rates of 1% and 2% were used at ages 55 and 56, respectively
Former Article 16 Tier 4 non-operating members with between 10 and 20 years of service and between ages 57 and 62 were assumed to retire at rates ranging from 2% to 5% per year phasing into 15% per year over the next 10 calendar years
Former Article 16 Tier 4 non-operating members with 20 or more years of service and between ages 57 and 61 were assumed to retire at rates ranging from 4% to 10% per year phasing into 30% per year over the next 15 calendar years
For members eligible to retire with less than 10 years of service, rates were reduced slightly
Assumptions for former Article 17 members are consistent with former Article 15 members
Assumptions for former Article 19 members are consistent with former Article 16 members
Disability — Rates vary by age. Illustrative rates are shown below:
Age Rate Age Rate
20 0.03 % 45 0.27 % 25 0.04 50 0.48 30 0.08 55 0.87 35 0.11 60 1.30 40 0.16
Disability rates cease upon attainment of unreduced retirement eligibility.
Marriage — 80% of members are assumed to be married with wives 3 years younger than their husbands.
Interest on Employee Contributions — Future years assumed to be 3.5% per year for represented employees and for the accumulated balances as of December 31, 2016 for non-represented employees.
Benefits Not Valued — The $2,500 post-retirement death benefit for represented members is not valued since premiums are paid outside of the plan trust.
The $10,000 post-retirement death benefit for former Queens Surface, Jamaica and Triboro Bus Service non-represented Employees (former Article 15) is not valued since premiums are paid outside of the plan trust.
The accidental death and dismemberment benefit for former Queens Surface, Jamaica and Triboro Bus Service non-represented Employees (former Article 15) is not valued as the costs are paid outside of the plan trust.
- 49 -
Form of payment - Normal Form, except that all former Liberty Lines Bus non-represented employees (former Article 13) members are assumed to elect the lump sum payment option. Lump sums valued using the current (2019) lump sum mortality table published by the IRS and a 4.5% assumed interest rate. Changes in Actuarial Assumptions — None.
7. CUSTODIAL AND OTHER PROFESSIONAL SERVICES
JP Morgan Chase Bank is the custodian and trustee of plan assets with the exception of Mellon asset management investments in which Mellon Bank N.A. is the custodian. JP Morgan Chase also provides cash receipt and cash disbursement services to the Plan. NEPC reviews the Plan’s portfolio, the investment policies as stipulated by the Investment Committee and the performance of the Investment Managers. NEPC also provides audit services for the Plan’s equity portfolios. Actuarial services were provided to the Plan by Milliman Inc.
8. SUBSEQUENT EVENTS
On March 25, 2020, Allianz Global Investors U.S. LLC (“AllianzGI), managing member of AllianzGI Structured Alpha 1000 LLC (the “Fund”), informed the Plan that it was in the best interest of its investors to terminate the Fund and pursue an orderly liquidation program. AllianzGI stated that the Fund suffered significant losses due to the severe and tumultuous market volatility as a result, in part, of the coronavirus pandemic. No redemptions were permitted after the announcement of the Fund closure. The Plan lost nearly all of its investment. Fund investors will receive a pro-rata distribution of the remaining assets after accounting for Fund expenses and liabilities. So far, the Fund has returned $5.2 million. The Plan is exploring all options to recover its losses.
MTA Capital Construction Company has been renamed MTA Construction and Development Company, was pursuant to an amendment to Public Authorities Law Section 1266(5).and will be reported as such in the future.
The COVID-19 pandemic during 2020 has significantly disrupted financial markets, economies and other events subsequent to December 31, 2019. As noted in the risk and uncertainties note, investment securities are exposed to various risks, such as interest rate, market and credit risks. Due to the level of risk associated with certain investment securities and the level of uncertainty related to changes in the value of investment securities, it is at least reasonably possible that changes in risks in the near term would materially affect the amounts reported in the statements of net assets available for benefits and the statement of changes in net assets available for benefits. The actuarial present value of plan benefits is reported based on certain assumptions pertaining to interest rates and employee demographics. Due to the changing nature of these assumptions, it is at least reasonably possible that changes in these assumptions will occur in the near term and, due to the uncertainties inherent in setting assumptions, that the effect of such changes could be material to the value of plan benefits. Subsequent to December 31, 2019, the impact to the Plan of the COVID-19 pandemic during 2020 has resulted in significant reductions in values to many investments of the Plan. It has also significantly decreased interest rates and could impact employee demographics which could change assumption utilized in the future for the actuarial present value of plan benefits. While management of the Plan currently expects to be able to continue to meet immediate contribution requirements, the long-term impact of the effects of the COVID-19 pandemic to the Plan and Plan sponsor as well as any relief from regulatory authorities are currently not known. The extent of the adverse impact of the COVID-19 pandemic on the Plan’s net assets available for benefits and actuarial present value of plan benefits cannot be reasonably estimated at this time.

- 50 -
The Covid-19 outbreak has resulted in a significant decline in ridership and vehicle crossings. The decline in ridership and vehicle crossings have caused a material impact on the MTA’s results of operations, financial position, and cash flows in fiscal 2020. In response to the adverse conditions, the MTA has secured funding under the “Coronavirus Aid, Relief and Economic Security Act” or “CARES Act”; received State of New York authorization to increase debt issuing capacity, including $10 billion in deficit bonds; received State of New York authorization to use the Central Business District Tolling lockbox monies to fund COVID-19 operating costs; and has been granted flexibility to apply existing FTA grant program proceeds to operating costs or other purposes to address COVID-19 impacts. In addition, the volatility and uncertainty of the financial market have negatively affected the investment earnings of retirement plans. Although the long-term impact of the Covid-19 outbreak on the financial market is still unpredictable, it could have a negative impact on the market value of the Plan in future years.
* * * * * *
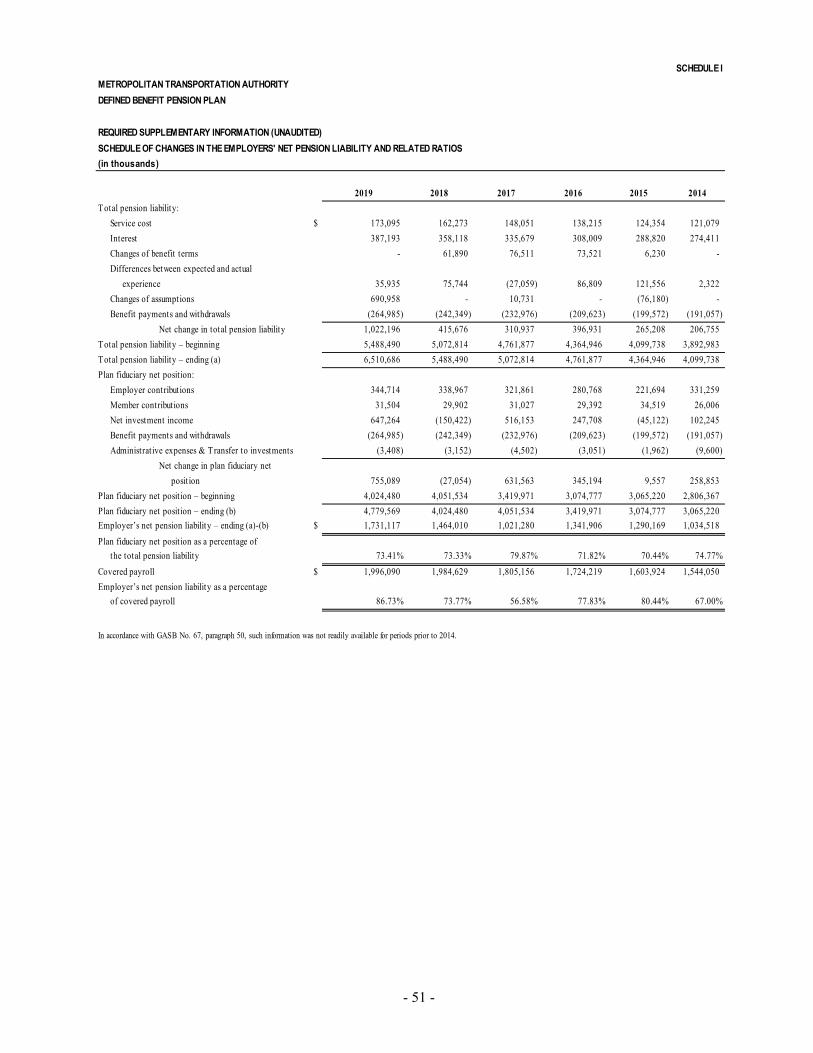
- 51 -
SCHEDULE I
METROPOLITAN TRANSPORTATION AUTHORITY
DEFINED BENEFIT PENSION PLAN
REQUIRED SUPPLEMENTARY INFORMATION (UNAUDITED)
SCHEDULE OF CHANGES IN THE EMPLOYERS' NET PENSION LIABILITY AND RELATED RATIOS
(in thousands)
2019 2018 2017 2016 2015 2014
Total pension liability:
Service cost $ 173,095 162,273 148,051 138,215 124,354 121,079
Interest 387,193 358,118 335,679 308,009 288,820 274,411
Changes of benefit terms - 61,890 76,511 73,521 6,230 -
Differences between expected and actual
experience 35,935 75,744 (27,059) 86,809 121,556 2,322
Changes of assumptions 690,958 - 10,731 - (76,180) -
Benefit payments and withdrawals (264,985) (242,349) (232,976) (209,623) (199,572) (191,057)
Net change in total pension liability 1,022,196 415,676 310,937 396,931 265,208 206,755
Total pension liability – beginning 5,488,490 5,072,814 4,761,877 4,364,946 4,099,738 3,892,983
Total pension liability – ending (a) 6,510,686 5,488,490 5,072,814 4,761,877 4,364,946 4,099,738
Plan fiduciary net posit ion:
Employer contributions 344,714 338,967 321,861 280,768 221,694 331,259
Member contributions 31,504 29,902 31,027 29,392 34,519 26,006
Net investment income 647,264 (150,422) 516,153 247,708 (45,122) 102,245
Benefit payments and withdrawals (264,985) (242,349) (232,976) (209,623) (199,572) (191,057)
Administrative expenses & Transfer to investments (3,408) (3,152) (4,502) (3,051) (1,962) (9,600)
Net change in plan fiduciary net
posit ion 755,089 (27,054) 631,563 345,194 9,557 258,853
Plan fiduciary net posit ion – beginning 4,024,480 4,051,534 3,419,971 3,074,777 3,065,220 2,806,367
Plan fiduciary net posit ion – ending (b) 4,779,569 4,024,480 4,051,534 3,419,971 3,074,777 3,065,220
Employer’s net pension liability – ending (a)-(b) $ 1,731,117 1,464,010 1,021,280 1,341,906 1,290,169 1,034,518
Plan fiduciary net posit ion as a percentage of
the total pension liability 73.41% 73.33% 79.87% 71.82% 70.44% 74.77%
Covered payroll $ 1,996,090 1,984,629 1,805,156 1,724,219 1,603,924 1,544,050
Employer’s net pension liability as a percentage
of covered payroll 86.73% 73.77% 56.58% 77.83% 80.44% 67.00%
In accordance with GASB No. 67, paragraph 50, such information was not readily available for periods prior to 2014.
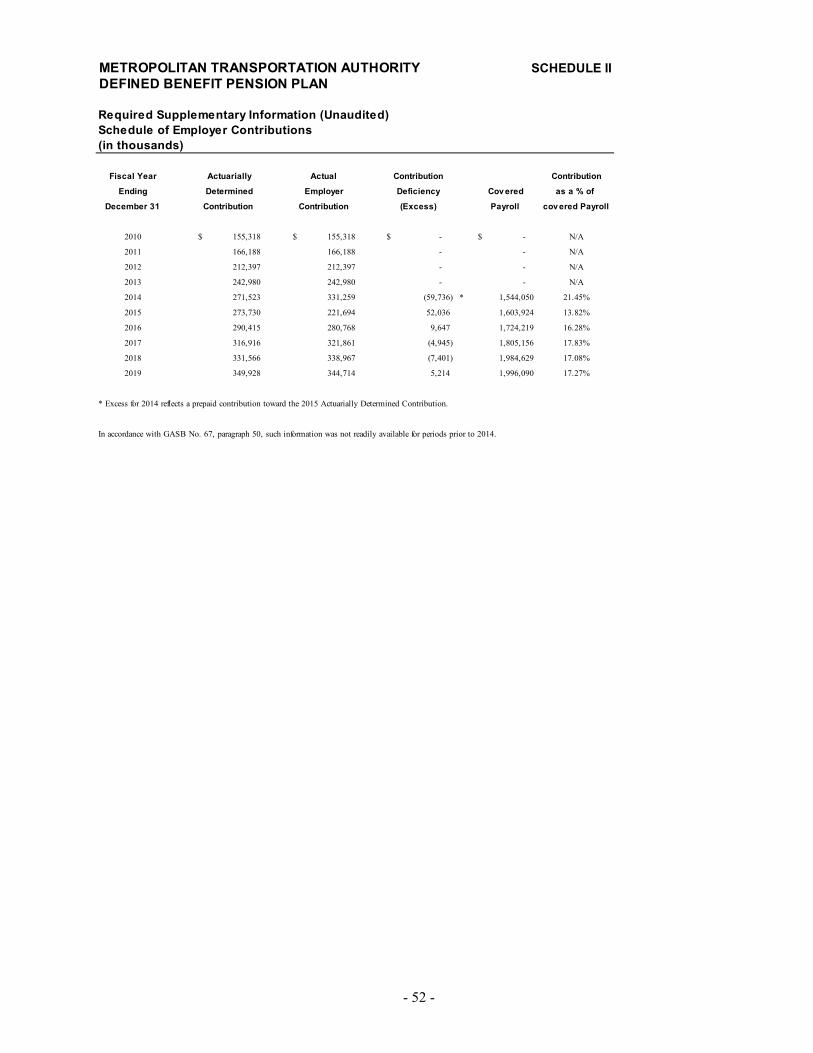
- 52 -
METROPOLITAN TRANSPORTATION AUTHORITY SCHEDULE IIDEFINED BENEFIT PENSION PLAN
Required Supplementary Information (Unaudited)Schedule of Employer Contributions (in thousands)
Fiscal Year Actuarially Actual Contribution Contribution
Ending Determined Employer Deficiency Cov ered as a % of
December 31 Contribution Contribution (Excess) Payroll cov ered Payroll
2010 155,318$ 155,318$ -$ -$ N/A
2011 166,188 166,188 - - N/A
2012 212,397 212,397 - - N/A
2013 242,980 242,980 - - N/A
2014 271,523 331,259 (59,736) * 1,544,050 21.45%
2015 273,730 221,694 52,036 1,603,924 13.82%
2016 290,415 280,768 9,647 1,724,219 16.28%
2017 316,916 321,861 (4,945) 1,805,156 17.83%
2018 331,566 338,967 (7,401) 1,984,629 17.08%
2019 349,928 344,714 5,214 1,996,090 17.27%
* Excess for 2014 reflects a prepaid contribution toward the 2015 Actuarially Determined Contribution.
In accordance with GASB No. 67, paragraph 50, such information was not readily available for periods prior to 2014.

- 53 -
SCHEDULE II (concluded)
METROPOLITAN TRANSPORTATION AUTHORITYDEFINED BENEFIT PENSION PLAN
REQUIRED SUPPLEMENTARY INFORMATION (UNAUDITED)SCHEDULE OF EMPLOYER CONTRIBUTIONS
Note to Schedule II:The more significant actuarial assumptions and methods used in the calculation of employer contributions to the Plan for are as follows:
Valuation Dates January 1, 2019 January 1, 2018 January 1, 2017 January 1, 2016 January 1, 2015 January 1, 2014
Actuarial cost method Frozen initial liability (FIL) (1) Frozen initial liability (FIL) (1) Frozen initial liability (FIL) (1) Frozen initial liability (FIL) (1) Frozen initial liability (FIL) (1) Frozen initial liability (FIL) (1)
Amortization method For FIL bases, period specified in current valuation For FIL bases, period specified in current valuation For FIL bases, period specified in current valuation For FIL bases, period specified in current valuation For FIL bases, period specified in current valuation For FIL bases, period specified in current valuationreport for specific plan change bases. Fresh start report. Future gains/losses are amortized through report. Future gains/losses are amortized through report. Future gains/losses are amortized through report. Future gains/losses are amortized through report. Future gains/losses are amortized through base as of January 1, 2020 will be determined based the calculation of the normal cost in accordance the calculation of the normal cost in accordance the calculation of the normal cost in accordance the calculation of the normal cost in accordance the calculation of the normal cost in accordanceon the Plan's unfunded Entry Age Normal liability with the FIL cost method amortized based on with the FIL cost method amortized based on with the FIL cost method amortized based on with the FIL cost method amortized based on with the FIL cost method amortized based on less amortization balances remaining plan change expected working lifetime, weighted by salary, of expected working lifetime, weighted by salary, of expected working lifetime, weighted by salary, of expected working lifetime, weighted by salary, of expected working lifetime, weighted by salary, of bases. Future gains/losses are amortized through the projected population for each group the projected population for each group the projected population for each group the projected population for each group the projected population for each groupthe calculation of the normal cost in accordancewith the FIL cost method amortized based on expected working lifetime, weighted by salary, of the projected population for each group
Actuarial asset valuation method Actuarial value equals market value less unrecognized Actuarial value equals market value less unrecognized Actuarial value equals market value less unrecognized Actuarial value equals market value less unrecognized Actuarial value equals market value less unrecognizedActuarial value equals market value less unrecognizedgains/losses over a 5-year period. Gains/losses are gains/losses over a 5-year period. Gains/losses are gains/losses over a 5-year period. Gains/losses are gains/losses over a 5-year period. Gains/losses are gains/losses over a 5-year period. Gains/losses are gains/losses over a 5-year period. Gains/losses are based on market value of assets. based on market value of assets. based on market value of assets. based on market value of assets. based on market value of assets. based on market value of assets.
Interest rate Net rate of 6.50% for 2019, per annum, Net rate of 7.0% for 2018, per annum, Net rate of 7.0% for 2017, per annum, Net rate of 7.0% for 2016, per annum, Net rate of 7.0% for 2015, per annum, Net rate of 7.0% for 2015, per annum,net of investment expenses net of investment expenses net of investment expenses net of investment expenses net of investment expenses net of investment expenses
Inflation 2.25% per annum 2.5% per annum 2.5% per annum 2.5% per annum 2.5% per annum 2.5% per annum
Railroad retirenment wage base 3.25% per year 3.5% per year 3.5% per year 3.5% per year 3.0% per year 3.0% per year
Mortality Based on experience of all MTA members reflecting Based on experience of all MTA members reflecting Based on experience of all MTA members reflecting Based on experience of all MTA members reflecting Based on experience of all MTA members reflecting Based on experience of all MTA members reflecting mortality improvement ona generational basis mortality improvement ona generational basis mortality improvement ona generational basis mortality improvement ona generational basis mortality improvement ona generational basis mortality improvement ona generational basis using Scale AA using Scale AA using Scale AA using Scale AA using Scale AA using Scale AA
Separations other than for normal retirement Tables based on recent experience Tables based on recent experience Tables based on recent experience Tables based on recent experience Tables based on recent experience Tables based on recent experience
Rates of normal retirement Tables based on recent experience. Rates vary Tables based on recent experience. Rates vary Tables based on recent experience. Rates vary Tables based on recent experience. Rates vary Tables based on recent experience. Rates vary Tables based on recent experience. Rates vary by age, years of service at retirement and Tier/Plan. by age, years of service at retirement and Tier/Plan. by age, years of service at retirement and Tier/Plan. by age, years of service at retirement and Tier/Plan. by age, years of service at retirement and Tier/Plan. by age, years of service at retirement and Tier/Plan.
Salary increases Varies by years of employment, and employee group; Varies by years of employment, and employee group; Varies by years of employment, and employee group; Varies by years of employment, and employee group; Varies by years of employment, and employee group; Varies by years of employment, and employee group;2.75% General Wage Increases ("GWI") for TWU 3.0% General Wage Increases ("GWI") for TWU 3.0% General Wage Increases ("GWI") for TWU 3.0% General Wage Increases ("GWI") for TWU 3.5% for MTA Bus hourly employees 3.5% for MTA Bus hourly employeesMTA Bus hourly employees MTA Bus hourly employees MTA Bus hourly employees MTA Bus hourly employees
Overtime Tables based on recent experience Tables based on recent experience Tables based on recent experience Tables based on recent experience Tables based on recent experience Tables based on recent experience
Cost-of-living adjustments 1.35% per annum (2) 1.375% per annum (2) 1.375% per annum (2) 1.375% per annum (2) 1.375% per annum (2) 1.375% per annum (2)
Provision for expenses An average of the prior three years’ administrative An average of the prior three years’ administrative An average of the prior three years’ administrative An average of the prior three years’ administrative An average of the prior three years’ administrative An average of the prior three years’ administrativecharges added to the normal cost charges added to the normal cost charges added to the normal cost charges added to the normal cost charges added to the normal cost charges added to the normal cost
(1) Under this actuarial method, the initial liability has been established by the Entry Age Actuarial Cost Method for determining changes in the Unfunded Actuarial Accrued Liability (UAAL) due to plan provision and assumption changes.(2) Assumes a long-term consumer price inflation assumption of 2.5% per annum, compounded annually.
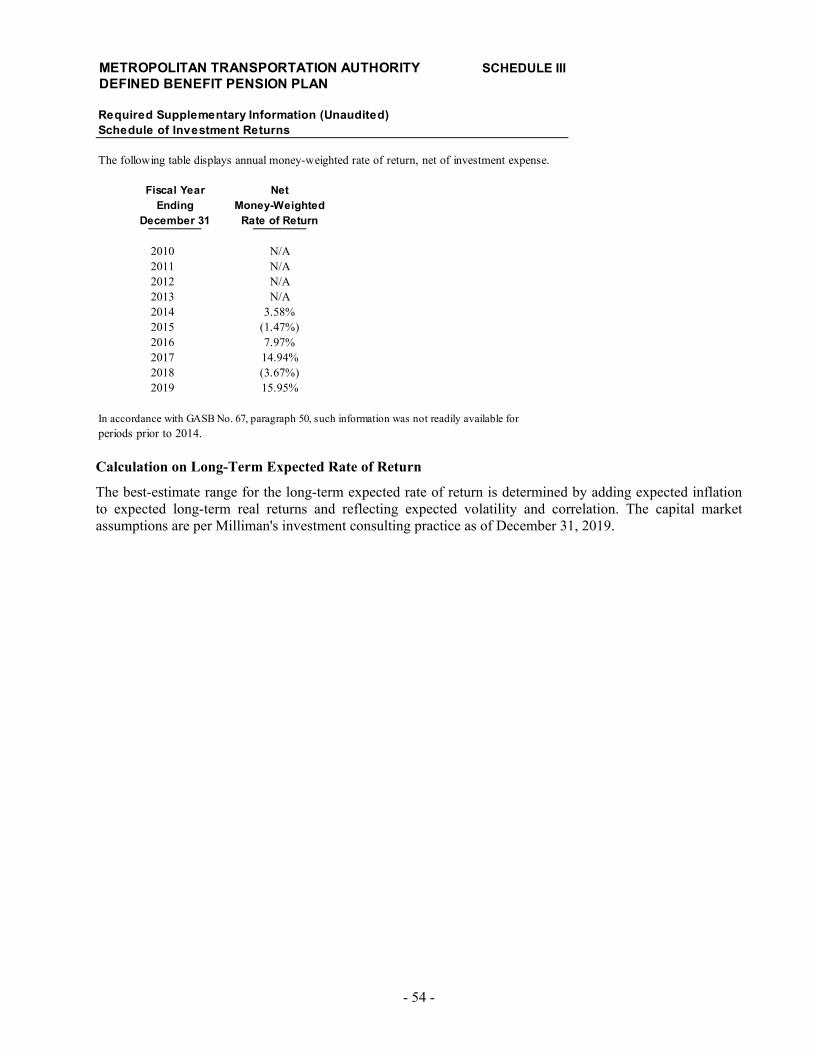
- 54 -
METROPOLITAN TRANSPORTATION AUTHORITY SCHEDULE IIIDEFINED BENEFIT PENSION PLAN
Required Supplementary Information (Unaudited)Schedule of Investment Returns
The following table displays annual money-weighted rate of return, net of investment expense.
Fiscal Year NetEnding Money-Weighted
December 31 Rate of Return
2010 N/A2011 N/A2012 N/A2013 N/A2014 3.58%2015 (1.47%)2016 7.97%2017 14.94%2018 (3.67%)2019 15.95%
In accordance with GASB No. 67, paragraph 50, such information was not readily available for periods prior to 2014.
Calculation on Long-Term Expected Rate of Return
The best-estimate range for the long-term expected rate of return is determined by adding expected inflation to expected long-term real returns and reflecting expected volatility and correlation. The capital market assumptions are per Milliman's investment consulting practice as of December 31, 2019.