METROPOLITAN TRADING COMPANY (MTC)mtc.joburg.org.za/wp-content/uploads/2020/01/MTC... · (B2B2C...
33
METROPOLITAN TRADING COMPANY (MTC) NETWORK COMMERCIALISATION STRATEGY AND ENHANCED BUSINESS MODEL PUBLIC PARTICIPATION VERSION 0.01 AUGUST 2019
Transcript of METROPOLITAN TRADING COMPANY (MTC)mtc.joburg.org.za/wp-content/uploads/2020/01/MTC... · (B2B2C...

METROPOLITAN TRADING COMPANY (MTC)NETWORK COMMERCIALISATION STRATEGY AND ENHANCED BUSINESS MODELPUBLIC PARTICIPATION
VERSION 0.01
AUGUST 2019

2
CONTEXT AND OVERVIEWTO BECOME A KEY DIGITAL ENABLER FOR A SMART CITY OF JOHANNESBURG (COJ), WHILE STILL ACHIEVING GROWTH, MTC MUST UNLOCK THE COMMERCIAL POTENTIAL OF THE NETWORK ASSET
In 2015, the City of Johannesburg transferred its
acquisition of the broadband network to
MTC
In order to meet its government mandate and ICT requirements from CoJ, MTC must
maximise the revenue generated from its
network asset
What is the Commercialisation
Strategy?
What is the required
Commercialisation Business Model?
What are the services and
products to be offered?
What is the appropriate Go-To-
Market Strategy?
What is the enabling SMME
Strategy?
In addressing these questions, MTC will be well positioned to unlock the commercial potential
of the Network Asset

3
MTC CONSTRAINTS

4
MTC TODAY – VS – MTC IN THE FUTURE
CUSTOMER
MTC has direct access to the Market
MTC provides Services to the Customer
Customer pays MTC for Services provided
CUSTOMER
MTC has direct & indirect (SMMEs) access to the Market
MTC provides Services to the Customer
Customer pays MTC for Services provided
Service Provider provides services to MTC as per MTC’s service catalogue
MTC pays the Service Provider service fees for leveraging the Service Provider’s Network
TO
DA
YFU
TU
RE
SERVICE PROVIDER
• MTC owns the Network
• MTC maintains the Network
• MTC uses the Network
• SP owns the Network
• SP maintains the Network
• MTC uses the Network
MTC is transitioning; from owning the Network Asset, to becoming an agent transacting organisation that continues to provide services, leveraging the Service Provider’s Network Asset

HOW DID WE GET HERE

6
EXPERIENCE IN BOT

7
ASSET SALE VS BUSINESS SALE
CoJ bought the Joburg Broadband Network Business with the network assets and other things through a BOT model. The total business was procured for
R1,2b
Network Asset was
worth R700m+
Business Database was
worth R200m+
Early contract Termination as
per contract terms was worth balance of R1,2b
The Enhanced Business Model is only selling the tangible and
intangible network asset not the MTC business

8
INTERNAL ENGAGEMENT PROCESS FOLLOWED
The business plan was presented to EXCO in January 2018 as part of the adjustment budget which
consisted of the 2017/2018 and the 2018/2019 business plan and associated KPIs.
The business plan and the associated budget adjustment were approved by council in May 2018.
Business case to change the operating model was discussed at strategy session by the MTC
management.
The proposed options were presented to the board, at the strategy session, as a business case and
the board approved the approach sighting the need to review the details of the BOT option
proposed.
The business case was then presented to the Economic Development Section 79 Strategic
Workshop and was well received by the chairman and the committee members.
The business case was also presented to the Executive Mayor who then requested the City
Manager, Group CTO, Group Legal to engage MTC and come up with the way forward report.
The City Manager established the task team that deliberated on the matter.
The task team reviewed the business case and assessed the available options whereby they
eliminated the options that were not practical. During the deliberations, the team came up with the
recommendation to implement a BOT

9
INTERNAL ENGAGEMENT PROCESS FOLLOWED
The business model referred to as the BOT business model was presented and
approved before the Mayoral Committee on the 23rd of January 2019, consisted of
the following strategic objectives:-
- Transfer of asset to private entity;
- Procurement of network services from the private entity through SLA;
- Entering into a commercialization arrangement with the private entity;
- MTC having the option of first right of refusal to procure the asset at the end of the services contract.
MTC was requested to engage the services of Transactional Advisor (TA) in order
to determine:
- The legal ramifications of the new business model (BOT); The financial projections and if they are realistic; The risks associated with the proposed transaction; The mitigations and the implementation of new business model

10
FROM TRANSACTIONAL ADVISOR TO COUNCIL APPROVAL
• BOT transactional advisors appointed;
MTC appointed TA for Strategy, Technical and Commercialisation
(business profitability) from its panel of suppliers
MTC appointed Group Legal to assist with the legal aspect of the
transaction. Group Legal appointed a team of legal advisors to assist in
this regard.
• All advisors found no alignment with the concept of a BOT
in relation to what the City to execute.
• The legal advisors provided legal opinion on taking this
forward as the enhanced business model.
• The strategy and commercialization team supported the
legal opinion.
• MTC Exco and Board were engaged and they supported
the Enhanced Business Model
CHALLENGES
• The strategic objectives
of the business model
are not aligned with a
BOT model
• Labelling the model a
BOT causes confusion on
what compliance process
to follow
• The Treasury has in
many cases considered
BOTs as PPP

TRANSACTIONAL ADVISORY SERVICES

12
ENHANCED BUSINESS MODEL
• TWO STAGED Approach
- Contract of sale between MTC and the Service Provider with a first right of refusal option:
- Ensure that the first right of refusal that provides the City the option to revert the asset back to MTC as per contract terms
- Must ensure that the asset is valued and priced correctly and that appropriate approvals are obtained in order to sell.
- Service level agreement for services to be procured by the municipality and government entities:
- Must ensure that appropriate approvals are obtained in order to get into an SLA of more than 3 years.
• Open tender process to be followed.

13
MTC ENHANCED BUSINESS MODEL BUSINESS CASE
• SALE OF ASSET
The total proceeds ranges between R853 million and R1.008 billion.
The carrying value of the Network assets and Intangible assets amounted to R538million as at 28 February 2019
Therefore, the total gain from the sale of the asset ranges between R315 million and R470 million.
• SERVICE LEVEL AGREEMENT
Consolidate all Telecommunications, Smart City and IoT services of CoJdepartments and entities
Reduce the cost of service with more than 20% over the contract period
Increase revenue using virtual telecoms model

14
MTC ENHANCED BUSINESS MODEL BENEFITS
• What is the MTC Enhanced Business Model and what does it mean to:
Citizen & Resident – reduction of cost of data, bridging digital
divide (T&Cs apply)
Johannesburg Business – reduction in cost of data with up to
50% on current cost (T&Cs apply)
Shareholder – get cash from sale of asset, have ability to increase
revenue collection through incentives of reduced data services;
reduction of internal data costs; increase in external revenue
sources; increase in Economic Growth
MTC – viable & sustainable business with direct public impact and
service delivery implementation; smart way of doing business;
making more with less

THE ENHANCED BUSINESS MODEL
16
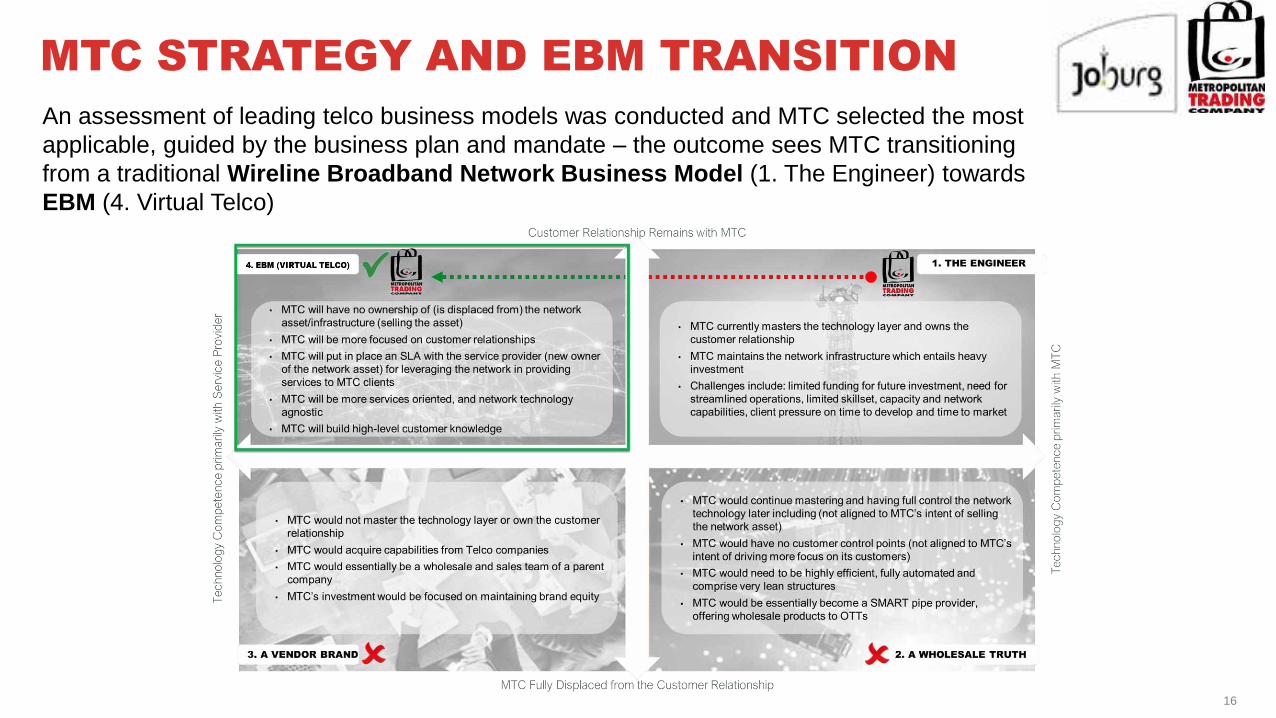
MTC STRATEGY AND EBM TRANSITION
An assessment of leading telco business models was conducted and MTC selected the most
applicable, guided by the business plan and mandate – the outcome sees MTC transitioning
from a traditional Wireline Broadband Network Business Model (1. The Engineer) towards
EBM (4. Virtual Telco)

17
CURRENT BUSINESS MODELCurrent Business Model: Does not enable MTC to take advantage of opportunities provided by industry trends and evolving digital technology capabilities – including limitations in providing a platform that enables the CoJ’s digital agenda (SMART City)
1 Legal 2 Risk & Compliance 3 Mgt. Support Exec. 4 Internal Audit 5 CEO 6 CFO 7 CTO
BU
SIN
ES
S
SU
PP
OR
T
FU
NC
TIO
NS
OP
ER
AT
ION
S
SU
PP
OR
T
FU
NC
TIO
NS
EN
TE
RP
RS
IE
FU
NC
TIO
NS
SERVICE &
PRODUCT
CATALOG
SALES &
ORDERING
BILLING, INVOICE,
PAYMENTS
REVENUE
ASSURANCE
INVENTORY,
ACTIVATION,
ASSURANCE
SERVICE MGT.
SECURITY
SUPPLY CHAIN
MGT.
HUMAN
RESOURCESFINANCE MGT.
NE
TW
OR
K
FU
NC
TIO
NS PHYSICAL NETWORK
ENTERPRISE DATA
MGT.
LEGAL SHEQ
Advisory
Contracting
Quality Assurance
1
1
2
SHE2
HR Mgt. & Admin.
Performance Mgt.
3
3
Knowledge Mgt.3
AUDIT
Internal Audit4
CEO OFFICE
Exec. Assistance
Committee Office
5
5
Asset Mgt.
Facilities Mgt.
6
6
Financial Mgt.6Account Mgt.7
Customer Relationshipp Mgt. / OM7
SCM Mgt.6
Service Mgt. (Internal)
Service Mgt. (External)
7
7
ARCHITECTURE
Solution Architecture
Cyber Security Archit
7
7
PROJECT MGT.
Project Mgt.7
IT (Support) Mgt.6
Cyber Security7
CH
AN
NE
LS
DIRECT SALES
PUBLIC LARGE BUSINESS /
ENTERPRISES
RETAIL WHOLESALE
CITY GOVERNMENT
DEPTS
MEDIUM BUSINESS /
ENTERPRISES
GOVERNMENT
MOEsCoJ
Served by MTC DirectlyServed by MTC Directly Served by MTC Directly
Contact Centre
Filed Operations
NOC Support (2ndLine)7
System/DB Admin.
Network Performance
Monitoring & Control
Data Centre Hosting 7
77
7
7
7
CITY OF JOHANNESBURG’S DIGITAL AGENDA:
limited capabilities required for emerging citizen-centric
experience areas
DIGITAL CUSTOMER EXPERIENCE: manual
processes with no / low digital experience
FLEXIBILITY AND CONTROL: slow response to service
change and short term needs
VELOCITY TO MARKET: long lead times due to manual
processes
COST REDUCTION: High CAPEX & OPEX to install /
maintain MPLS, costly CPEs and service
INDUSTRY X.0: cannot meet Internet of Everything (IoE)
business market demands
Cannot address significant shifts in the ever changing
REVENUE MIX
Deeply tied to declining core business, limitations in
focusing on FUTURE VALUE CREATION
Cannot enable MOBILE, EMBEDDED CONNECTIVITY
– as the world gets connected with augmented data
knowledge
KEY CHALLENGES

18
CAPABILITY ASSESSMENTProposed EBM Capabilities: the organisational review should be conducted in the context of the EBM; specifically Tasks, Skills, Roles, Talent and Organisation that will be required
2•
•
•
•
•
•
•
•
•
•
•
•
•
•
•
•
•
•
•
•
•6 1 •
•
•
•
•
•
•
•
•
•
•
•
•
3•
•
•
•
••
•
•
•
•
•
•
•
•
••
•
•
•
•
•
•
•
•
•
•
•
•
••
•
•
•
•
•
•
•
•
•
•
•
•
•
4ACCENTURE’S
JOB LIBRARY
5

19
ENHANCED BUSINESS MODELProposed EBM Capabilities: *Based on MTC’s strategy as well as an assessment of industry trends and opportunities, this Enhanced Business Model (EBM) enables MTC to expand its ecosystem and become a Digital Network Service Provider
*See Appendix for Supporting Analysis Data
Legacy stack Digital stack Ecosystem servicesDecoupling layers
ENTERPRISE EXPERIENCE ENABLEMENT: through
integrated sales and marketing capabilities decoupled
from the underlying complexity of the legacy system of
records, SD WAN chain and extending B2B2x value
chain
REAL TIME SERVICE MANAGEMENT: for all
Communication Services enabling an OTT-like service
introduction, Intelligent operations and E2E Service and
Network Topology view
NETWORK AND INFRASTRUCTURE ABSTRACTION:
decoupling Network and Infrastructure from Service
layer, exposing APIs for resource configuration, usage
and performance management and implementing policy
rules for dynamic resource allocation enabling dedicated
QoS and network assets monetization
SYSTEM OF INSIGHTS: as the engine of the multi-
speed architecture, supporting Business, Service and
Network layers through A.I. and machine learning
ECOSYSTEM ENABLEMENT: NaaS Platform
Enablement APIs, exposing network services to the
partners ecosystem
CONNECTED INDUSTRY ORCHESTRATION:
Connected Industry service orchestration enabling
Industry X.0 (e.g. connected health, connected car)
VALUE PROPOSITION
PHYSICAL DOMAIN
ACCESS
REAL TIME SERVICE MANAGEMENT
NETWORK SERVICE PLATFORMS
NETWORK AND INFRASTRUCTURE EXPOSURE
EN
TE
RP
RIS
E F
UN
CT
ION
S
SYSTEM OF RECORDS ABSTRACTION
SY
ST
EM
S O
F IN
SIG
HT
S
X.0
TE
CH
NO
LO
GIE
S
(AR
/VR
, D
igit
al T
win
, B
lockC
hain
, etc
.)
DIGITAL
ECOSYSTEM
SERVICE
PLATFORM
DIGITAL BUSINESS PLATFORM
Enterprise Experience Marketing Intelligence Partner Enablement
TRADITIONAL BSS/OSS
SERVICEORCHESTRATION
INTELLIGENTOPERATIONS
SP TELCO
PLATFORM
E2E TOPOLOGY
Creation
Fulfilment
Assurance (Fault, Perf., TTM)
Billing
CONNECTED INDUSTRY
ORCHESTRATOR
PARTNERSCHANNELS
B2B2X Partners
(M2M, IoT)Self-Service &
SMME Portal
Dedicated
Support
Direct
Sales TeamApps Employees
(B2B2C Model)
CONNECTED INDUSTRY
Auto
motive
Health
Care... Govern
ment
X.0 Connected Industry Platform
PUBLIC RESIDENTIAL LARGE BUSINESS /
ENTERPRISES
RETAIL WHOLESALE
CITY GOVERNMENT
DEPTS
SMALL BUSINESS /
ENTERPRISES
GOVERNMENT
MOEsCoJ MEDIUM BUSINESS /
ENTERPRISES
Served through SMMEsServed through MTC Directly and through SMMEs Served through MTC Directly
* NEW * NEW
CONNECTIVITY & CLOUD VIRTUAL
INFRASTRUCTURE
CY
BE
R S
EC
UR
ITY

THE EBM BUSINESS CASE

21
High Speed InternetFTTx- Residential & Business
Ethernet Link Dark Fibre Leasing
Total projected revenue over 5 year
period
R622m
Total projected revenue over 5
year period
R1.3bn
Total projected revenue over 5 year
period
R220m
Key Value Metrics (Based on Market and MTC)
Increased New Customers
Increased Customer Retention
Decreased Bad Debts
Increased SMME Onboarding
Increased SMME Tiering
Reduction in SMME Attrition
Reduction in OPEX Expenditure
Reduction in Costs Per Sale
Reduction in Sales Lead Time
Target Stakeholder (Based on MTC)
Residential Business Government
Key Products (Based on Market)
Total projected revenue over 5 year
period
R2bn
Total projected revenue over 5
year period
R1.8bn
Total projected revenue over 5 year
period ( at a 75% growth rate)
R6bn
SMMEs account for 75% of costs of
revenue totaling = R1.35bn
SMMEs account for 75% of costs of
revenue totaling = R1.5bn
TransparencyMeasure service usage in a
clear and fair manner to drive
the right consumption
behaviors
InnovationDeploy differentiated
service offerings in the
market
AgilityDecrease time to business
outcome and capture
opportunities
ProductivityDrive process efficiency of
services and SMMEs
FlexibilityLeverage highly extensible
platform in a responsive
manner
1
2
3
4
5
REVENUE SUMMARYBusiness Case Summary: While OPEX costs is expected to significantly reduce as a result of the Asset Sale, MTC’s revenue projection is very aggressive compared to the Market, which could impact the organisation’s target of being fully self-funded

22
R306.71 R370.36
R456.55 R544.79 R591.12
R2,082.29
R2,441.97
R2,859.49 R2,883.99 R2,909.60
FY19/20 FY20/21 FY21/22 FY22/23 FY23/24
Projected Revenue Analysis MTC vs Market
Projected Market Revenue (Rm) Projected MTC Revenue (Rm)
R84.55
R211.16
R143.67
R226.86 R249.74 R256.60 R270.49
-R36.91
-R138.08
R47.68
-R6.80
R3.32
R34.42
R64.19
R384.74
R442.61
FY15/16 FY16/17 FY17/18 FY18/19 FY19/20 FY20/21 FY21/22 FY22/23 FY23/24
Government Subsidy Vs Net Services Revenue
Total Subsidy (Rm) Net Revenue (based on services rendered) (Rm)
• Whilst the projected CAGR for MTC is 7% over the 5 year period with figures reaching in to R2 billion, the market forecasts a CAGR of 14% of the same 5 year period with significantly lower revenue figures potentially reaching a max of R1billion – MTC’s projections are way above the Market projections
• Based on MTC’s revenue projections, the organisation is targeting to be fully self-funded (no reliance on CoJ’s subsidy) by FY23/24 at the latest (confirmed after discussions with MTC’s Financial Manager)
• To realise this, some of the key areas of improvement include MTC’s net revenue earnings and collections
Actual Projected
Zero reliance on subsidy
REVENUE SPLITThe projected market revenue for the target state is significantly lower than the MTC projected revenue and could impact on MTC’s target of being fully self-funded (i.e. moving from subsidy-dependency from the CoJ)
23
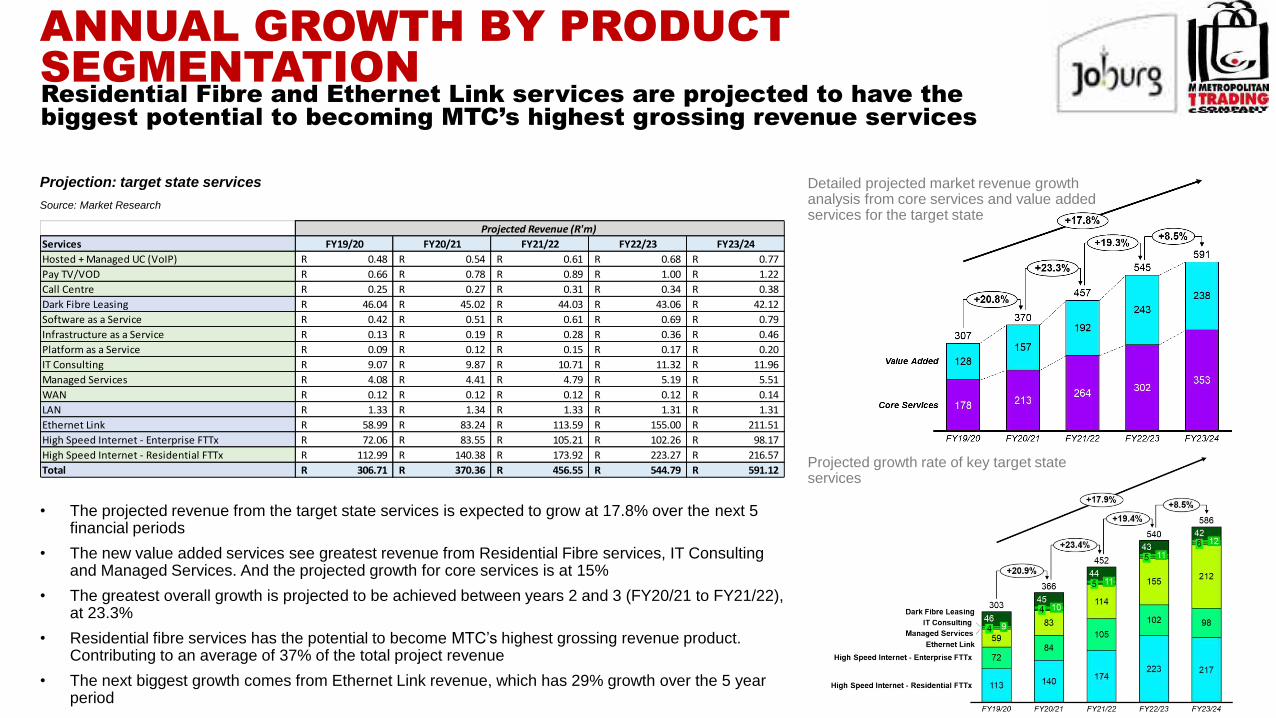
Projection: target state services
Services FY19/20 FY20/21 FY21/22 FY22/23 FY23/24
Hosted + Managed UC (VoIP) 0.48R 0.54R 0.61R 0.68R 0.77R
Pay TV/VOD 0.66R 0.78R 0.89R 1.00R 1.22R
Call Centre 0.25R 0.27R 0.31R 0.34R 0.38R
Dark Fibre Leasing 46.04R 45.02R 44.03R 43.06R 42.12R
Software as a Service 0.42R 0.51R 0.61R 0.69R 0.79R
Infrastructure as a Service 0.13R 0.19R 0.28R 0.36R 0.46R
Platform as a Service 0.09R 0.12R 0.15R 0.17R 0.20R
IT Consulting 9.07R 9.87R 10.71R 11.32R 11.96R
Managed Services 4.08R 4.41R 4.79R 5.19R 5.51R
WAN 0.12R 0.12R 0.12R 0.12R 0.14R
LAN 1.33R 1.34R 1.33R 1.31R 1.31R
Ethernet Link 58.99R 83.24R 113.59R 155.00R 211.51R
High Speed Internet - Enterprise FTTx 72.06R 83.55R 105.21R 102.26R 98.17R
High Speed Internet - Residential FTTx 112.99R 140.38R 173.92R 223.27R 216.57R
Total 306.71R 370.36R 456.55R 544.79R 591.12R
Projected Revenue (R'm)
Source: Market Research
Detailed projected market revenue growth analysis from core services and value added services for the target state
Projected growth rate of key target state services
• The projected revenue from the target state services is expected to grow at 17.8% over the next 5 financial periods
• The new value added services see greatest revenue from Residential Fibre services, IT Consulting and Managed Services. And the projected growth for core services is at 15%
• The greatest overall growth is projected to be achieved between years 2 and 3 (FY20/21 to FY21/22), at 23.3%
• Residential fibre services has the potential to become MTC’s highest grossing revenue product. Contributing to an average of 37% of the total project revenue
• The next biggest growth comes from Ethernet Link revenue, which has 29% growth over the 5 year period
ANNUAL GROWTH BY PRODUCT SEGMENTATION Residential Fibre and Ethernet Link services are projected to have the biggest potential to becoming MTC’s highest grossing revenue services

24
Annual Organisation Cost
for FY18/19
R283m
Organisational Headcount
38FTEs
Projected 5 Year CAGR with
Network Asset
58%
Projected Market 3 Year CAGR
without Network Asset
14%
*Source: Annexure C - Draft OPEX Allocation 2019/20 - 2021/22
Obtained 3 May 2019
Cu
rre
nt
Sta
te –
Be
fore
th
e S
ale
of
the
Ne
two
rk A
ss
et
Target State – Post the Sale of the Network Asset
R120,803.00
R151,624.00 R160,248.00
R169,118.00
R179,123.12
R12,516.00
R150,028.00
FY18/19 FY19/20 FY20/21 FY22/23 FY23/24
Distribution of OPEX costs before and after the sale of the asset (R’m)
Non-Asset Expenses Contracted Services Asset Expenses Employee Costs
COST SAVINGSCurrently, 70% of the OPEX budget is allocated to Network Asset related expenditure. Post the sale of asset, these funds could be re-directed towards other strategic initiatives
70%

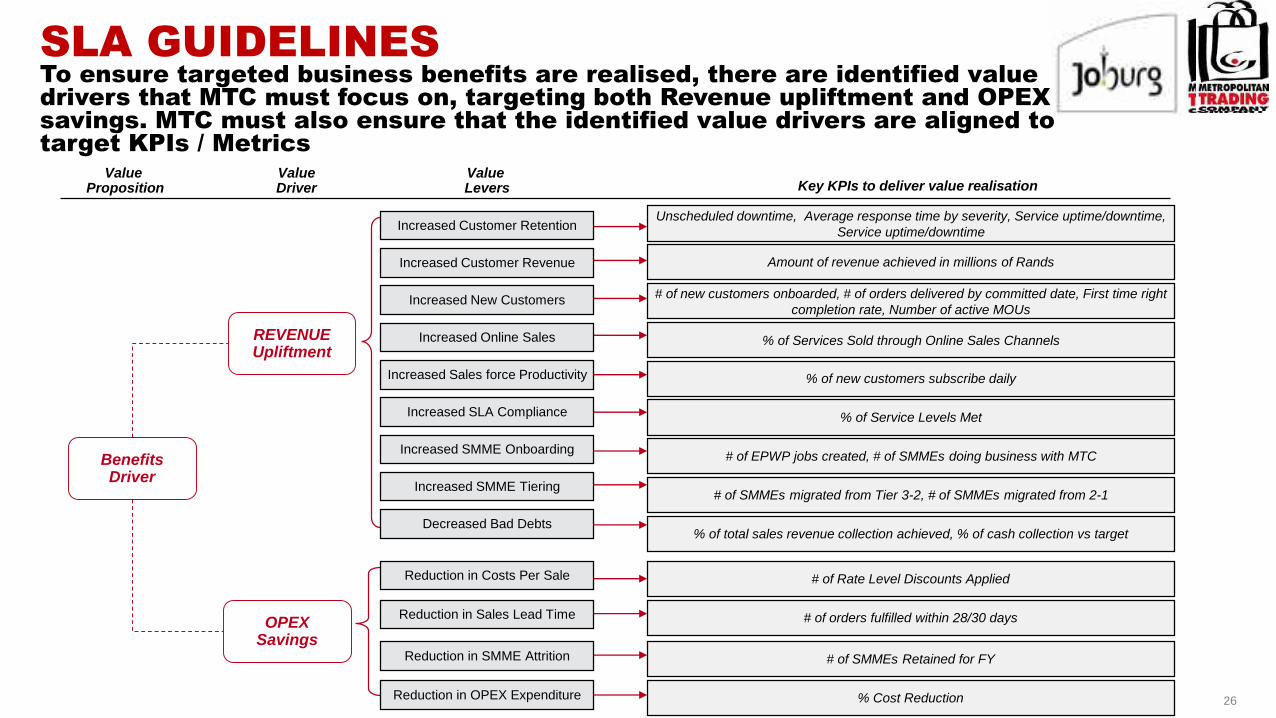
THE SERVICE LEVEL AGREEMENT (SLA)
26
Benefits Driver
REVENUE Upliftment
OPEX Savings
Value Proposition Key KPIs to deliver value realisation
Value Driver
Value Levers
Unscheduled downtime, Average response time by severity, Service uptime/downtime,
Service uptime/downtime
Amount of revenue achieved in millions of Rands
# of new customers onboarded, # of orders delivered by committed date, First time right
completion rate, Number of active MOUs
% of Services Sold through Online Sales Channels
% of new customers subscribe daily
% of Service Levels Met
# of EPWP jobs created, # of SMMEs doing business with MTC
# of SMMEs migrated from Tier 3-2, # of SMMEs migrated from 2-1
% of total sales revenue collection achieved, % of cash collection vs target
# of Rate Level Discounts Applied
# of orders fulfilled within 28/30 days
# of SMMEs Retained for FY
% Cost Reduction
Increased Customer Retention
Increased Customer Revenue
Increased New Customers
Increased Online Sales
Increased Sales force Productivity
Increased SLA Compliance
Increased SMME Onboarding
Increased SMME Tiering
Decreased Bad Debts
Reduction in Costs Per Sale
Reduction in Sales Lead Time
Reduction in SMME Attrition
Reduction in OPEX Expenditure
SLA GUIDELINESTo ensure targeted business benefits are realised, there are identified value drivers that MTC must focus on, targeting both Revenue upliftment and OPEX savings. MTC must also ensure that the identified value drivers are aligned to target KPIs / Metrics
ECONOMIC CONTRIBUTION

28
SMME TAPPING INTO COJ CUSTOMER BASE

29
SMME TAPPING INTO COJ CUSTOMER BASE

30
SMME RESELLER LOCALISATION

31
BREAKING BARRIERS TO ENTRY

THANK YOU

QUESTIONS AND ANSWERS