Metropolitan Pier and Exposition Authority ELECTRICAL SUPPLIES

Metropolitan Pier and Exposition Authority Basic Financial Statements as of and for the Years Ended June 30, 2019 and 2018, Required Supplementary Information, and Independent Auditors’ Reports

METROPOLITAN PIER AND EXPOSITION AUTHORITY
TABLE OF CONTENTS
Page
INDEPENDENT AUDITORS’ REPORT 1–2
MANAGEMENT’S DISCUSSION AND ANALYSIS 3–9
BASIC FINANCIAL STATEMENTS AS OF AND FOR THE YEARS ENDED JUNE 30, 2019 AND 2018: Business-Type Activities: Statements of Net Position 10–11 Statements of Revenues, Expenses, and Changes in Net Position 12 Statements of Cash Flows 13–14 Fiduciary Activities: Statements of Fiduciary Net Position 15 Statements of Changes in Fiduciary Net Position 16 Notes to Basic Financial Statements 17–49
REQUIRED SUPPLEMENTARY INFORMATION AS OF AND FOR THE YEARS ENDED JUNE 30, 2019, 2018, 2017, 2016 AND 2015: Schedules of Changes in Net Pension Liability and Related Ratios 50 Schedules of Contributions 51
INDEPENDENT AUDITORS’ REPORT ON INTERNAL CONTROL OVER FINANCIAL REPORTING AND ON COMPLIANCE AND OTHER MATTERS BASED ON AN AUDIT OF FINANCIAL STATEMENTS PERFORMED IN ACCORDANCE WITH GOVERNMENT AUDITING STANDARDS 52–53
- 1 -
INDEPENDENT AUDITORS’ REPORT
To the Board of Directors of Metropolitan Pier and Exposition Authority:
Report on the Basic Financial Statements
We have audited the accompanying basic financial statements of the business-type activities and fiduciary activities of the Metropolitan Pier and Exposition Authority (the “Authority”) as of and for the years ended June 30, 2019 and 2018, and the related notes to the financial statements, which collectively comprise the Authority’s basic financial statements, as listed in the table of contents.
Management’s Responsibility for the Basic Financial Statements
Management is responsible for the preparation and fair presentation of these basic financial statements in accordance with accounting principles generally accepted in the United States of America; this includes the design, implementation, and maintenance of internal control relevant to the preparation and fair presentation of basic financial statements that are free from material misstatement, whether due to fraud or error.
Auditors’ Responsibility
Our responsibility is to express opinions on these basic financial statements based on our audits. We did not audit the financial statements of the Metropolitan Pier and Exposition Authority Retirement Plan (the “Plan”), which represent 100% of the assets, additions, and deductions of the fiduciary activities. Those statements were audited by other auditors whose report has been furnished to us, and our opinion, insofar as it relates to the amounts included for the Plan, is based solely on the report of the other auditors. We conducted our audits in accordance with auditing standards generally accepted in the United States of America and the standards applicable to financial audits contained in Government Auditing Standards, issued by the Comptroller General of the United States. Those standards require that we plan and perform the audits to obtain reasonable assurance about whether the basic financial statements are free from material misstatement. The financial statements of the Plan were not audited in accordance with Government Auditing Standards.
An audit involves performing procedures to obtain audit evidence about the amounts and disclosures in the basic financial statements. The procedures selected depend on the auditors’ judgment, including the assessment of the risks of material misstatement of the basic financial statements, whether due to fraud or error. In making those risk assessments, the auditor considers internal control relevant to the entity’s preparation and fair presentation of the basic financial statements in order to design audit procedures that are appropriate in the circumstances, but not for the purpose of expressing an opinion on the effectiveness of the entity’s internal control. Accordingly, we express no such opinion. An audit also includes evaluating the appropriateness of accounting policies used and the reasonableness of significant accounting estimates made by management, as well as evaluating the overall presentation of the basic financial statements.

- 2 -
We believe that the audit evidence we have obtained is sufficient and appropriate to provide a basis for our audit opinion.
Opinion
In our opinion, based on our audits and the report of the other auditors, the basic financial statements referred to above present fairly, in all material respects, the financial position of the business-type activities and fiduciary activities of the Authority as of June 30, 2019 and 2018, and the changes in financial position and, where applicable, cash flows for the years then ended, in accordance with accounting principles generally accepted in the United States of America.
Other Matters
Required Supplementary Information
Accounting principles generally accepted in the United States of America require that the information in the management’s discussion and analysis on pages 3–9, schedules of changes in net pension liability and related ratios on page 51, and schedules of contributions on page 52 be presented to supplement the basic financial statements. Such information, although not a part of the basic financial statements, is required by the Government Accounting Standards Board, which considers it an essential part of financial reporting for placing the basic financial statements in an appropriate operational, economic, or historical context. We and other auditors have applied certain limited procedures to the required supplementary information in accordance with auditing standards generally accepted in the United States of America, which consisted of inquiries of management about the methods of preparing the information and comparing the information for consistency with management’s responses to our inquiries, the basic financial statements, and other knowledge we obtained during our audits of the basic financial statements. We do not express an opinion or provide any assurance on the information because the limited procedures do not provide us with sufficient evidence to express an opinion or provide any assurance.
Other Reporting Required by Government Auditing Standards
In accordance with Government Auditing Standards, we have also issued our report-dated November 5, 2019, on our consideration of the Authority’s internal control over financial reporting and on our tests of its compliance with certain provisions of laws, regulations, contracts, and grant agreements and other matters. The purpose of that report is to describe the scope of our testing of internal control over financial reporting and compliance and the results of that testing, and not to provide an opinion on internal control over financial reporting or on compliance. That report is an integral part of an audit performed in accordance with Government Auditing Standards in considering the Authority’s internal control over financial reporting and compliance.
November 5, 2019

- 3 -
METROPOLITAN PIER AND EXPOSITION AUTHORITY
MANAGEMENT’S DISCUSSION AND ANALYSIS AS OF AND FOR THE YEARS ENDED JUNE 30, 2019 AND 2018
Management’s Discussion and Analysis
As management of the Metropolitan Pier and Exposition Authority (the “Authority” or “MPEA”), we offer readers of the basic financial statements this narrative overview and analysis of the Authority’s financial performance during the fiscal years ended June 30, 2019 and 2018. Please read it in conjunction with the Authority’s basic financial statements that follow this section.
Financial Highlights
Total operating revenues of $314 million in fiscal year 2019 surpassed fiscal year 2018 revenues by $80 million. The increased revenue is primarily attributable to the additional operating revenue generated by the Marriott Marquis Chicago hotel and management’s decision to present McCormick Place food service activity on a gross basis beginning in fiscal year 2019. The Marriott Marquis Chicago hotel opened in October 2017, as a result, fiscal year 2018 results reflect approximately nine months of activity while fiscal year 2019 results reflect a full year of activity. Relative to McCormick Place food service, prior to fiscal year 2019, the Authority presented food service activity on a net basis in response to its 2010 statutory mandate that pricing for primary food service operations be established at a break-even level. Since this mandate, MPEA operating results only reflected net food service results in addition to MPEA’s portion of commissions earned by sub-contracted food vendors at McCormick Place.
Fiscal Year 2019 Compared to Fiscal Year 2018
Total assets and deferred outflows at June 30, 2019, of $2.7 billion were less than total liabilities and deferred inflows of $4.7 billion for a deficit net position of $2.0 billion.
Total assets and deferred outflows decreased from June 30, 2018 to June 30, 2019, by $113.9 million. Investments increased by $26.9 million, which primarily reflects the proceeds generated by the 2019 bond issue. Total construction in progress decreased $12.9 million. Accumulated depreciation on capital assets increased approximately $111.2 million. Authority taxes receivable decreased by $50.3 million. Cash and cash equivalents increased by $53.2 million and accounts receivable decreased by $40.0 million. Net position decreased by $145.5 million, which included an operating loss of $94.0 million and net non-operating expenses of $51.5 million.
The Authority’s deficit net position of $2.0 billion primarily reflects $1.2 billion of accreted interest on outstanding capital appreciation bonds and its net investment in capital assets (land, buildings, etc., less the related debt used to acquire those assets) of $0.8 billion. The Authority uses its capital assets to fulfill its mission of promoting conventions and tourism in the City of Chicago and the State of Illinois (the “State”). The resources to repay the debt are derived from tax collections and other grants from the State, and not the operating revenue of the Authority.
A portion of the Authority’s current assets ($41.1 million in the Authority’s taxes receivable) represents resources that are subject to restrictions on how they may be used. Such assets are required to be used for debt service.
- 4 -
An allocated portion of the State sales tax is available to service the Authority’s Expansion Project Bonds in the event of shortfalls in the Authority’s taxes. Prior to the debt restructuring in October 2010, collections of Authority taxes were inadequate to fund annual debt service transfers as required, thus requiring additional deposits by the State funded with State sales tax revenues. The balance due to the State for nonreimbursed draws on the State sales tax was $0.0 million and $39.3 million at June 30, 2019, and June 30, 2018, respectively. The Authority repaid the balance of $39.3 million of the amount due to the State in fiscal year 2019.
The Authority completed restructurings of its outstanding debt in October 2010, July 2012, September 2015, and December 2017, and as a result, expects that it will not be necessary to draw on the State sales taxes to cover debt service in future years.
Operating revenues in fiscal year 2019 of $313.9 million are $79.9 million higher than fiscal year 2018. $35 million of this increase is attributable to a change in the presentation of the McCormick Place food service activity, which is included in guest services activity. The remaining $44.9 million is attributable to higher hotel revenues of $18.7 million, higher hotel guest service revenues of $13.9 million, higher parking revenues of $2.0 million, higher other revenues of $12.4 million and higher heating and cooling revenues of $0.9 million, offset by lower exposition facilities revenues of $3.0 million in 2019 resulting from the addition of the Marriott Marquis Chicago and Wintrust Arena to the MPEA campus. The cyclical event schedule of the convention center also contributed to the increased revenues.
Operating expenses in fiscal year 2019 of $407.9 million increased by $73.3 million as compared to fiscal year 2018. $37.7 million of this increase is attributable to a change in the presentation of outsourced operations. The remaining $35.6 million is due to higher outsourced operations of $25.1 million, higher depreciation of $4.7 million, higher salaries, wages, and benefits of $5.2 million, lower supplies, repairs, and maintenance of $2.0 million, higher utilities of $3.0 million, and lower general and administrative of $0.4 million. Operating expenses also increased compared to fiscal year 2018 due to an additional three months of activity in 2019 since the opening of the Marriott Marquis.
Outsourced operations consisting of certain expenses incurred under outsourced hotel and parking management contracts, and guest services, which includes McCormick Place food service activity, increased by $62.8 million in fiscal year 2019 as compared to fiscal year 2018. The increase in guest services expenses is primarily due to a change in the presentation of McCormick Place food service activity from a gross basis to a net basis. The increased outsourced expenses also reflects an additional three months of activity in fiscal year 2019 as compared to fiscal year 2018 for the new Marriott Marquis Chicago hotel as well as, higher hotel and parking expenses related to revenues in the same categories.
The operating loss in fiscal year 2019 of $94.0 million decreased by $6.6 million as compared to an operating loss of $100.6 million in fiscal year 2018.
Nonoperating revenues in fiscal year 2019 of $199.2 million decreased by $11.4 million as compared to fiscal year 2018 due to a gain on disposal of fixed assets of approximately $18.5 million in prior year, decrease in other income of $2.4 million, increase in the Authority’s tax revenue of $4.7 million, increase in investment income of $2.5 million and increase in state and local government grants by $2.2 million. The gain on sale of fixed assets, which is considered a special item on the statement of revenues, expenses and net position, was due to the sale of a Kerry James Marshall painting sold at auction during fiscal year 2018.
Nonoperating expenses in fiscal year 2019 of $250.7 million increased by $13.4 million as compared to 2018 due to an increase in interest and amortization expense.

- 5 -
Fiscal Year 2018 Compared to Fiscal Year 2017
Total assets and deferred outflows at June 30, 2018, of $2.8 billion were less than total liabilities and deferred inflows of $4.7 billion for a deficit net position of $1.8 billion.
Total assets and deferred outflows increased from June 30, 2017 to June 30, 2018, by $73.9 million. Investments increased by $10.2 million, which primarily reflects the revenue generated by the new hotel. Total construction in progress decreased $518.0 million as a result of placing the new hotel and event center into service. Accumulated depreciation on capital assets increased approximately $106.9 million. Authority tax receivable increased by $38.7 million. Cash and cash equivalents decreased by $19.0 million and accounts receivable increased by $31.0 million. Net position increased by $127.3 million, which included an operating loss of $100.6 million and net non-operating expenses of $26.8 million.
The Authority’s deficit net position of $1.8 billion includes its net investment in capital assets (land, buildings, etc., less the related debt used to acquire those assets) of $0.7 billion. The Authority uses its capital assets to fulfill its mission of promoting conventions and tourism in the City of Chicago and the State of Illinois (the “State”). The resources to repay the debt are derived from tax collections and other grants from the State, and not the operating revenue of the Authority.
A portion of the Authority’s current assets ($91.3 million in the Authority’s taxes receivable) represents resources that are subject to restrictions on how they may be used. Such assets are required to be used for debt service.
An allocated portion of the State sales tax is available to service the Authority’s Expansion Project Bonds in the event of shortfalls in the Authority’s taxes. Prior to the debt restructuring in October 2010, collections of Authority taxes were inadequate to fund annual debt service transfers as required, thus requiring additional deposits by the State funded with State sales tax revenues. Due to this shortfall, the Authority had a nonreimbursed draw on the State sales tax at June 30, 2010, of $57.2 million, net of year-end cash balances in the Authority Tax Fund.
The balance due to the State for nonreimbursed draws on the State sales tax was $39.3 million and $42.0 million at June 30, 2018, and June 30, 2017, respectively. The Authority repaid $2.7 million of the amount due to the State in fiscal year 2018 and plans to repay the $39.3 million outstanding balance due to the State in fiscal year 2019.
The Authority completed restructurings of its outstanding debt in October 2010, July 2012, September 2015, and December 2017, and, as a result, expects that it will not be necessary to draw on the State sales taxes to cover debt service in future years.
Operating revenues in fiscal year 2018 of $234.0 million increased by $60.2 million as compared to fiscal year 2017. This increase is attributable to higher hotel revenues of $38.2 million, higher guest services revenues of $28.2 million, higher parking revenue of $0.5 million, higher other revenue of $0.2 million, offset by lower exposition facilities revenues of $6.6 million and heating and cooling revenues of $0.3 million in 2018 resulting from the addition of the Marriott Marquis Chicago and Wintrust Arena to the MPEA campus and the cyclical event schedule of the convention center.
Operating expenses in fiscal year 2018 of $334.6 million increased by $78.8 million as compared to fiscal year 2017 due to higher outsourced operations of $45.5 million, higher depreciation of $18.0 million, higher salaries, wages, and benefits of $8.5 million, higher supplies, repairs, and maintenance of $4.3 million, higher utilities of $2.4 million, and higher
- 6 -
general and administrative of $0.1 million. Operating expenses also increased compared to fiscal year 2017 due to the opening of the Marriott Marquis as well as the Wintrust Arena.
Outsourced operations consisting of certain expenses incurred under outsourced hotel and parking management contracts increased by $45.5 million in fiscal year 2018 as compared to fiscal year 2017 primarily due to the opening of the new Marriott Marquis Chicago hotel in October of fiscal year 2018 as well as, higher hotel, parking expenses, and guest services expenses related to revenues in the same categories.
The operating loss in fiscal year 2018 of $100.6 million increased by $18.6 million as compared to an operating loss of $82.0 million in fiscal year 2017.
Nonoperating revenues in fiscal year 2018 of $210.6 million increased by $26.1 million as compared to fiscal year 2017 due to a gain on disposal of fixed assets of approximately $18.5 million, increase in other income of $4.0 million, increase in the Authority’s tax revenue of $2.7 million and increase in investment income of $0.9 million. The gain on sale of fixed assets, which is considered a special item on the statement of revenues, expenses and net position, was due to the sale of a Kerry James Marshall painting sold at auction during fiscal year 2018.
Nonoperating expenses in fiscal year 2018 of $237.3 million increased by $18.1 million as compared to 2017 due to an increase in interest and amortization expense.
Basic Financial Statements
The Authority’s basic financial statements for the business type activities are prepared using proprietary fund (enterprise fund) accounting. The Authority is operated under one enterprise fund. Under this method of accounting, an economic resources measurement focus and the accrual basis of accounting is used. Revenue is recorded when earned, and expenses are recorded when incurred. The basic financial statements also include the Authority’s pension plan reported as fiduciary activity. The basic financial statements include statements of net position; statements of revenues, expenses, and changes in net position; statements of cash flows; statements of fiduciary net position; and statements of changes in fiduciary net position. Notes to the basic financial statements are also included.
The statements of net position presents information on the assets, deferred outflows and inflows, and liabilities of the Authority. The excess of liabilities and deferred inflows over assets and deferred outflows is reported as the Authority’s total net position.
The statements of revenues, expenses, and changes in net position reports revenues and expenses of the Authority for the fiscal year. The difference between revenues and expenses (net income or loss) is reported as the change in net position for the fiscal year. The change in net position is added to the beginning-of-year net position to arrive at the net position at the end of the current fiscal year.
The statements of cash flows reports activities in cash and cash equivalents for the fiscal year resulting from operating activities, capital and related financing activities, and investing activities. Net cash flows from these activities account for the change in the Authority’s cash and cash equivalents balance during the year.
The notes to the basic financial statements provide required disclosures and other information that are essential to a full understanding of material data provided in the basic financial statements. The notes present information concerning the Authority’s accounting policies,

- 7 -
significant account balances and activities, material risks, obligations, commitments, contingencies, and subsequent events.
The Authority’s staff prepared the basic financial statements from the detailed books and records of the Authority. These basic financial statements were audited as part of the Authority’s annual independent external audit process.
Included in the Authority’s reporting entity is the Metropolitan Pier and Exposition Authority Retirement Plan (the “Plan”), a single-employer defined benefit plan established under the authority of the board of directors of the Authority. The Plan is reported as a Pension Trust Fund in these basic financial statements. Separate financial statements and management’s discussion and analysis for the Plan can be obtained from the administrative office located at 330 East Cermak Road, Chicago, Illinois 60616.
Financial Information (Amounts in Thousands)
The following schedule presents a summary of business-type activities assets, deferred outflows, liabilities, deferred inflows, and net position as of and for the fiscal years ended June 30, 2019, 2018, and 2017:
2019 2018 2017
Current and other assets 319,687$ 328,658$ 256,700$ Capital assets 2,264,023 2,363,440 2,369,526 Deferred outflows 131,657 137,119 129,074
Total assets and deferred outflows 2,715,367$ 2,829,217$ 2,755,300$
Current liabilities 185,016$ 226,827$ 434,158$ Noncurrent liabilities 4,504,260 4,429,807 4,019,789 Deferred inflows 2,237 3,273 4,715
Total liabilities and deferred inflows 4,691,513 4,659,907 4,458,662
Net position: Net investment in capital assets (827,449) (763,773) (441,252) Restricted for debt service 47,493 64,155 69,839 Unrestricted (1,196,190) (1,131,072) (1,331,949)
Total net position (1,976,146) (1,830,690) (1,703,362)
Total liabilities, deferred inflows, and net position 2,715,367$ 2,829,217$ 2,755,300$

- 8 -
The following schedule presents a summary of business-type activities revenues for the fiscal years ended June 30, 2019, 2018, and 2017:
2019 2018 2017
Operating revenues 313,911$ 234,027$ 173,820$
Nonoperating revenues: State and local government grants 33,917 31,700 31,700 Other income 2,087 4,455 Contributions 479 Investment income 4,290 1,718 806 Authority taxes 158,915 154,217 151,526 Special item 18,475
Total nonoperating revenues before capital grant 199,209 210,565 184,511
Capital grant
Total revenues after capital grant 513,120$ 444,592$ 358,331$
The following schedule presents a summary of business-type activities expenses for the fiscal years ended June 30, 2019, 2018, and 2017:
2019 2018 2017
Operating expenses: Salaries, wages, and benefits 62,553$ 57,325$ 48,796$ Supplies, repairs, and maintenance 25,988 28,012 23,735 Outsourced operations 176,161 113,313 67,861 Depreciation 111,655 107,004 89,024 Utilities 19,486 16,482 14,049 General and administrative 12,043 12,462 12,321
Total operating expenses 407,886 334,598 255,786
Nonoperating expenses—interest and amortization expense and miscellaneous 250,690 237,322 223,994
Total expenses 658,576$ 571,920$ 479,780$
Capital Acquisitions
During fiscal years 2019 and 2018, the Authority spent $31.4 million and $141.3 million, respectively, for capital expenditures. The expenditures for fiscal years 2019 and 2018 primarily related to the construction for the Marriott Marquis Chicago hotel, the event center, and various projects across the campus.
A summary of changes in fixed assets is included in Note 3 to the basic financial statements.
- 9 -
Debt
In order to allow the Authority to expand and maintain its facilities, the Authority was granted taxing authority to fund annual debt service payments on its bonds (the “MPEA Tax”). The four components of the MPEA Tax are a 1% tax on restaurant sales in a downtown Chicago district, a 2.5% tax on hotel and motel rooms in Chicago, a 6% tax on auto rentals in Cook County, and an airport departure tax at O’Hare and Midway airports. Outstanding expansion debt totaled $4.2 billion and $4.1 billion as of June 30, 2019 and June 30, 2018, respectively. Outstanding original issue yields on the Authority’s expansion bonds ranged from 0.44% to 6.75% during fiscal years 2019 and 2018.
The credit rating from S&P Global Ratings on the Authority’s outstanding Expansion Project Bonds was BBB/Stable and BB+/Stable as of June 30, 2019 and June 30, 2018 respectively. The credit rating from Fitch Ratings on the Authority’s Expansion Project Bonds was BBB-/Negative Outlook and BBB-/Negative Outlook as of June 30, 2019 and June 30, 2018 respectively. The credit rating from Moody’s Investor Services on the Authority’s Expansion Project Bonds was Ba1/Stable and Ba1/Outlook Negative as of June 30, 2019 and June 30, 2018 respectively.
Request for Information
This financial report is designed to provide a general overview of the Authority’s finances. Questions concerning any of the information provided in this report or requests for additional financial information should be addressed to the chief executive officer at 330 East Cermak Road, Chicago, Illinois 60616.

- 10 -
METROPOLITAN PIER AND EXPOSITION AUTHORITY
BUSINESS-TYPE ACTIVITIESSTATEMENTS OF NET POSITIONAS OF JUNE 30, 2019 AND 2018(Dollars in thousands)
2019 2018ASSETS AND DEFERRED OUTFLOWS
CURRENT ASSETS: Cash and cash equivalents—unrestricted 100,120$ 46,890$ Cash and cash equivalents—restricted 483 482 Investments—unrestricted 15,146 30,771 Investments—restricted 5,496 11,235 Accounts receivable—net of allowance for doubtful accounts of $116 and $64 at June 30, 2019 and 2018, respectively 23,103 63,099 Prepaid expenses 5,847 4,072 Authority taxes receivable—restricted 41,058 91,333
Total current assets 191,253 247,882
NONCURRENT ASSETS: Investments—restricted 111,598 63,313 Prepaid bond insurance 16,836 17,463 Capital assets: Land 253,602 253,573 Buildings and improvements 3,447,112 3,429,302 Furniture and fixtures 73,724 72,283 Machinery and equipment 112,386 107,011 Construction in progress 27,669 40,494 Accumulated depreciation (1,650,470) (1,539,223)
Capital assets—net 2,264,023 2,363,440
Total noncurrent assets 2,392,457 2,444,216
Total assets 2,583,710 2,692,098
DEFERRED OUTFLOWS 131,657 137,119
TOTAL ASSETS AND DEFERRED OUTFLOWS 2,715,367$ 2,829,217$
(Continued)
- 11 -
METROPOLITAN PIER AND EXPOSITION AUTHORITY
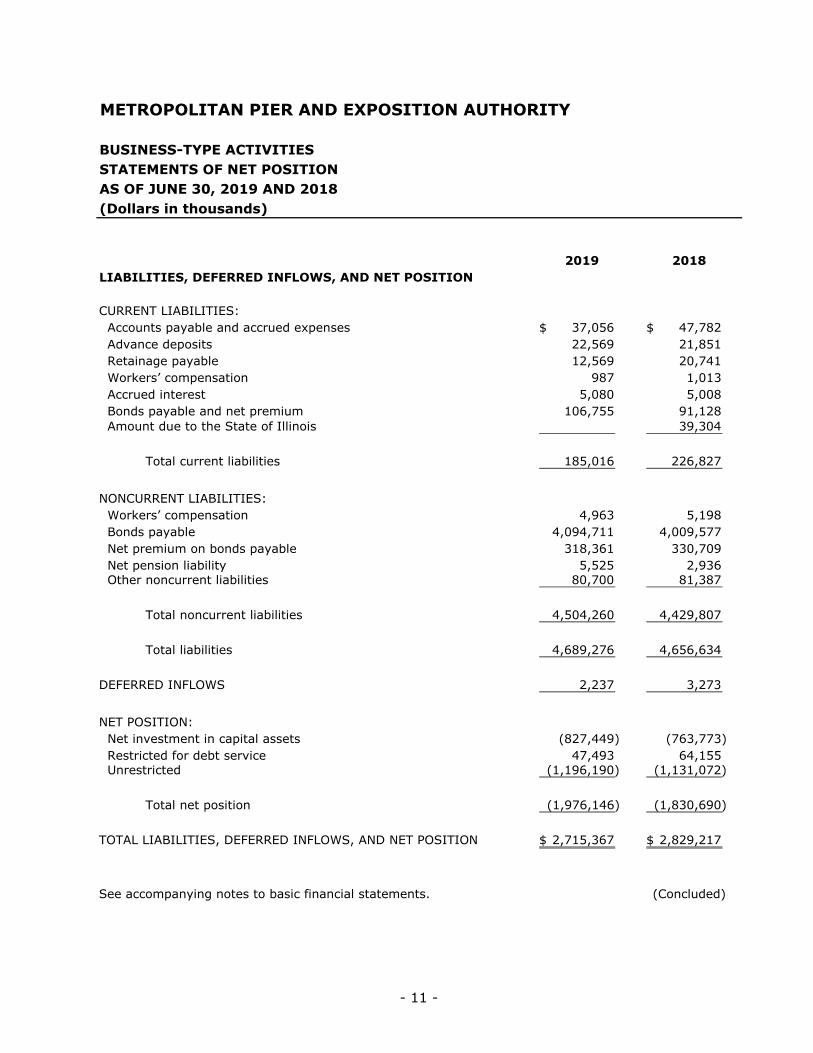
BUSINESS-TYPE ACTIVITIESSTATEMENTS OF NET POSITIONAS OF JUNE 30, 2019 AND 2018(Dollars in thousands)
2019 2018LIABILITIES, DEFERRED INFLOWS, AND NET POSITION
CURRENT LIABILITIES: Accounts payable and accrued expenses 37,056$ 47,782$ Advance deposits 22,569 21,851 Retainage payable 12,569 20,741 Workers’ compensation 987 1,013 Accrued interest 5,080 5,008 Bonds payable and net premium 106,755 91,128 Amount due to the State of Illinois 39,304
Total current liabilities 185,016 226,827
NONCURRENT LIABILITIES: Workers’ compensation 4,963 5,198 Bonds payable 4,094,711 4,009,577 Net premium on bonds payable 318,361 330,709 Net pension liability 5,525 2,936 Other noncurrent liabilities 80,700 81,387
Total noncurrent liabilities 4,504,260 4,429,807
Total liabilities 4,689,276 4,656,634
DEFERRED INFLOWS 2,237 3,273
NET POSITION: Net investment in capital assets (827,449) (763,773) Restricted for debt service 47,493 64,155 Unrestricted (1,196,190) (1,131,072)
Total net position (1,976,146) (1,830,690)
TOTAL LIABILITIES, DEFERRED INFLOWS, AND NET POSITION 2,715,367$ 2,829,217$
See accompanying notes to basic financial statements. (Concluded)

- 12 -
METROPOLITAN PIER AND EXPOSITION AUTHORITY
BUSINESS-TYPE ACTIVITIESSTATEMENTS OF REVENUES, EXPENSES, AND CHANGES IN NET POSITIONFOR THE YEARS ENDED JUNE 30, 2019 AND 2018(Dollars in thousands)
2019 2018
OPERATING REVENUES: Use of exhibition facilities 45,100$ 48,097$ Hospitality revenues 122,821 104,116 Guest services 105,892 56,984 Parking 15,050 13,043 Heating and cooling revenues 9,108 8,253 Other 15,940 3,534
Total operating revenues 313,911 234,027
OPERATING EXPENSES: Salaries, wages, and benefits 62,553 57,325 Supplies, repairs, and maintenance 25,988 28,012 Outsourced operations: Hotel and other 82,156 69,452 Parking 8,814 7,869 Guest service 85,191 35,992
Subtotal—outsourced operations 176,161 113,313
Depreciation 111,655 107,004 Utilities 19,486 16,482 General and administrative 12,043 12,462
Total operating expenses 407,886 334,598
OPERATING LOSS (93,975) (100,571)
NONOPERATING REVENUES (EXPENSES): State grants 33,917 31,700 Investment income 4,290 1,718 Authority taxes 158,915 154,217 Other income 2,087 4,455 Interest and amortization expense (250,690) (237,322)
Total nonoperating revenues (expenses)—net (51,481) (45,232)
SPECIAL ITEM—Sale of artwork 18,475
CHANGE IN NET POSITION (145,456) (127,328)
NET POSITION—Beginning of year (1,830,690) (1,703,362)
NET POSITION—End of year (1,976,146)$ (1,830,690)$
See accompanying notes to basic financial statements.

- 13 -
METROPOLITAN PIER AND EXPOSITION AUTHORITY
BUSINESS TYPE ACTIVITIESSTATEMENTS OF CASH FLOWSFOR THE YEARS ENDED JUNE 30, 2019 AND 2018(Dollars in thousands)
2019 2018
CASH FLOWS FROM OPERATING ACTIVITIES: Cash received from customers 354,625$ 237,745$ Cash payments for goods and services (237,489) (160,549) Cash payments to or for employees (60,551) (56,367)
Net cash flows provided by operating activities 56,585 20,829
CASH FLOWS FROM CAPITAL AND RELATED FINANCING ACTIVITIES: Authority tax receipts and draw on sales tax 169,886 112,775 Grant receipts 33,917 31,700 Bond proceeds and proceeds from notes 40,250 356,404 Payments for bond refundings (218,068) Payment for bond issuance costs (184) (3,694) Payment for bond insurance (11,439) Bond principal repayments (76,515) (30,640) Interest paid (120,377) (116,796) Payments for capital acquisitions (29,100) (154,909) Other income 1,400 3,342
Net cash (used in) capital and related financing activities 19,277 (31,325)
CASH FLOWS FROM INVESTING ACTIVITIES: Investment purchases (162,383) (312,180) Investment sales, maturities, and other receipts 135,462 301,994 Receipt of interest and dividends 4,290 1,718
Net cash provided by (used in) investing activities (22,631) (8,468)
NET INCREASE (DECREASE) IN CASH AND CASH EQUIVALENTS 53,231 (18,964)
CASH AND CASH EQUIVALENTS—Beginning of year 47,372 66,336
CASH AND CASH EQUIVALENTS—End of year 100,603$ 47,372$
NONCASH CAPITAL AND RELATED FINANCING ACTIVITIES: Accounts payable and accrued expenses for capital acquisitions 489$ 8,979$
Capitalized interest - $ 4,647$
Accreted interest on bonds 139,314$ 126,121$
(Continued)

- 14 -
METROPOLITAN PIER AND EXPOSITION AUTHORITY
BUSINESS TYPE ACTIVITIESSTATEMENTS OF CASH FLOWSFOR THE YEARS ENDED JUNE 30, 2019 AND 2018(Dollars in thousands)
2019 2018
RECONCILIATION OF OPERATING INCOME TO NET CASH FROM OPERATING ACTIVITIES: Operating loss (93,975)$ (100,571)$
Adjustments to reconcile operating loss to net cash provided by: Depreciation 111,655 107,004 Gain on sale of artwork (Special Item) 18,475 Changes in operating assets and liabilities: Accounts receivable—increase 39,996 (31,039) Advance deposits—(increase) 718 16,282 Prepaid expenses—increase (1,775) (455) Accounts payable, accrued expenses, and other current liabilities (2,036) 10,175 Workers compensation liability increase (261) 955 Net pension liability increase (decrease) 2,263 3
Total adjustments 150,560 121,400
NET CASH PROVIDED BY OPERATING ACTIVITIES 56,585$ 20,829$
See accompanying notes to basic financial statements. (Concluded)

- 15 -
METROPOLITAN PIER AND EXPOSITION AUTHORITY
FIDUCIARY ACTIVITIES—PENSION TRUST FUND—STATEMENTS OF FIDUCIARY NET POSITION—METROPOLITAN PIER AND EXPOSITION AUTHORITY RETIREMENT PLANAS OF JUNE 30, 2019 AND 2018(Dollars in thousands)
2019 2018
ASSETS: Investments—at fair value: Equity mutual funds 20,010$ 21,499$ Common/collective trusts-equity 31,340 32,725 Common/collective trusts-fixed income 16,842 15,698 Fixed income securities—separate account 16,032 14,588 Money market mutual fund—separate account 197 450 Money market mutual funds 1,075 1,002
Total investments—at fair value 85,496 85,962
Deposit with paying agent 363 350
NET POSITION RESTRICTED FOR PENSION BENEFITS 85,859$ 86,312$
See accompanying notes to basic financial statements.

- 16 -
METROPOLITAN PIER AND EXPOSITION AUTHORITY
FIDUCIARY ACTIVITIES—PENSION TRUST FUND—STATEMENTS OF CHANGES IN FIDUCIARY NET POSITION—METROPOLITAN PIER AND EXPOSITION AUTHORITY RETIREMENT PLANAS OF JUNE 30, 2019 AND 2018(Dollars in thousands)
2019 2018
ADDITIONS: Investment income: Net (decrease) increase in fair value of Plan’s interest in: Equity mutual funds (311)$ 1,685$ Common/collective trusts-equity 1,793 4,665 Common/collective trusts-fixed income 1,183 216 Fixed income separate account 693 (533) Interest income 528 499 Dividend income 537 237 Other income 3 Less investment expense (179) (206)
Net investment income 4,244 6,566
Employer contributions 323 365
Total additions 4,567 6,931
DEDUCTIONS: Deductions from net position attributed to: Benefits paid to participants 4,971 4,798 Administrative expenses 49 51
Total deductions 5,020 4,849
(DECREASE) INCREASE IN NET POSITION RESTRICTED FOR PENSION BENEFITS (453) 2,082
NET POSITION RESTRICTED FOR PENSION BENEFITS: Beginning of year 86,312 84,230
End of year 85,859$ 86,312$
See accompanying notes to basic financial statements.

- 17 -
METROPOLITAN PIER AND EXPOSITION AUTHORITY
NOTES TO BASIC FINANCIAL STATEMENTS AS OF AND FOR THE YEARS ENDED JUNE 30, 2019 AND 2018
1. SUMMARY OF SIGNIFICANT ACCOUNTING POLICIES
The Illinois General Assembly created the Metropolitan Fair and Exposition Authority in 1955 and renamed it as the Metropolitan Pier and Exposition Authority (the “Authority”) in 1989 when it was established as a municipal corporation pursuant to the Metropolitan Pier and Exposition Authority Act. The purpose of the Authority is to promote, operate, and maintain fairs, expositions, meetings, and conventions in the Chicago metropolitan area and, in connection therewith, to construct, equip, and maintain buildings for such purposes.
To facilitate the understanding of data included in the basic financial statements, summarized below are the more significant accounting policies.
Reporting Entity—As defined by accounting principles generally accepted in the United States of America, the financial reporting entity consists of a primary government, as well as its component units, which are legally separate organizations for which the elected officials of the primary government are financially accountable. Financial accountability is defined as:
1) Appointment of a voting majority of the component unit’s board and either (a) the ability to impose will by the primary government or (b) the possibility that the component unit will provide a financial benefit to or impose a financial burden on the primary government
2) Fiscal dependency on the primary government
Based upon the application of these criteria, the Authority has no component units and is not a component unit of any other entity.
The Authority’s reporting entity includes the Metropolitan Pier and Exposition Authority Retirement Plan (the “Plan”), a single employer defined benefit plan established under the authority of the Board of Directors of the Authority. The Plan is reported as a Pension Trust Fund in these basic financial statements. Separate financial statements for the Plan can be obtained from the administrative offices located at 330 East Cermak Road, Chicago, Illinois 60616.
Basis of Accounting and Financial Statement Presentation—The basic financial statements provide information about the Authority’s business-type and fiduciary (the Plan) activities. Separate statements for each category—business-type and fiduciary—are presented.
Business-Type Activities—The basic financial statements for the Authority’s business-type activities are used to account for the Authority’s activities that are financed and operated in a manner similar to a private business enterprise. Accordingly, the basic financial statements are reported using the economic resources measurement focus and the accrual basis of accounting. Revenues from operations, investments, and other sources

- 18 -
are recorded when earned, and expenses (including depreciation and amortization) are recorded when incurred, regardless of the timing of the related cash flows.
Nonexchange transactions, in which the Authority receives value without directly giving equal value in return, include grants from federal, state, and local governments. On an accrual basis, revenue from state grants is recognized in the fiscal year in which all eligibility requirements have been satisfied. Eligibility requirements include timing requirements, which specify the year when the resources are required to be used or the fiscal year when use is first permitted, and expenditure requirements, in which the resources are provided to the Authority on a reimbursement basis. Revenue from Authority taxes is recognized during the period when the exchange transaction on which the tax is imposed occurs.
Fiduciary Activities—The financial statements for the fiduciary activities are used to account for the assets held by the Authority in trust for the payment of future retirement benefits under the Plan. The assets of the Plan cannot be used to support Authority operations. The basic financial statements are reported using the economic resources measurement focus and the accrual basis of accounting. Employer contributions to the Plan are recognized when due and the employer has made a formal commitment to provide the contributions. Benefits and refunds are recognized when due and payable in accordance with the Plan.
Cash and Cash Equivalents—Cash and cash equivalents consist of cash on hand, demand deposits, and short-term investments with maturities when purchased of three months or less. Restricted cash consists of amounts held for the Authority’s food service reserve funds pursuant to its agreements with two food service providers, whereby the Authority is required to set aside funds for food service equipment and supplies.
Investments—Investments, including short-term money market investments, are reported at fair value.
Capital Assets—Capital assets are reported at cost. Capital assets are defined as assets that have a useful life of more than one year and a unit cost of more than $10,000. Group asset purchases (such as construction or renovation projects) are capitalized when the cost exceeds $50,000 regardless of the cost of individual items. Cost includes major expenditures for improvements and replacements that extend useful lives or increase capacity and interest cost associated with significant capital additions. Interest is capitalized on constructed assets. The amount of interest to be capitalized is calculated by multiplying the amount of capital expenditures by the interest rate of the bonds used to fund the capital projects. The amount of interest capitalized for the years ended June 30, 2019 and 2018 was $0 and $4.6 million, respectively.
Depreciation of capital assets is computed using the straight-line method assuming the following useful lives:
Years
Buildings 25–40Building improvements 3–25Furniture and fixtures 7Machinery and equipment 3–15

- 19 -
Amount Due to the State of Illinois—The amount due to the State of Illinois (the “State”) consists of sales taxes borrowed from the State for debt service payments made on the Expansion Project Bonds due to shortages in the collection of the Authority’s taxes.
Compensated Absences—Vested or accumulated vacation and compensatory time is recorded as an accrued expense. The Authority’s sick leave policy provides for an accumulation of earned sick leave. Sick leave does not vest and the Authority has no obligation for the accumulated sick leave until it is actually taken. Thus, no accrual for sick leave has been made.
Pensions—For the purpose of measuring the net pension liability, deferred outflows of resources and deferred inflows of resources related to pensions, and pension expense, information about the fiduciary net position of the Plan and additions to/deductions from the Plan’s fiduciary net position have been determined on the same basis as they are reported by the Plan. For this purpose, benefit payments are recognized when due and payable in accordance with the benefit terms. Investments are reported at fair value.
Bond Insurance Costs, Bond Premiums, and Deferred Loss on Refunding—Prepaid bond insurance costs, bond premiums, and losses on refunding transactions are deferred and amortized using the effective interest method over the life of the related debt, except in the case of refunding transactions where the amortization period is over the term of the new debt or refunded debt, whichever is shorter. Deferred loss on refunding of $129.1 million and $133.9 million as of June 30, 2019 and 2018, respectively, are recorded as deferred outflows on the statements of net position.
Capital Grants—The Authority reports capital grants as capital contributions on the statements of revenues, expenses, and changes in net position. Capital grants are received on a reimbursement basis and revenues are recognized to the extent of the allowable expenditures incurred.
Net Position—Net position is categorized as follows:
Net Invested in Capital Assets—This consists of capital assets, net of accumulated depreciation, less the outstanding debt that is attributable to the acquisition, construction, or improvement of those assets.
Restricted—This consists of net position that is legally restricted by outside parties or by law through constitutional provisions or enabling legislation. When both restricted and unrestricted resources are available for use, generally it is the Authority’s policy to use restricted resources first, and then unrestricted resources when they are needed.
Unrestricted—This consists of net position that does not meet the definition of “restricted” or “net invested in capital assets.”
Authority Tax Revenue—Authority tax revenue consists of Authority taxes collected (restaurant, hotel, car rental, and airport departure) by the City of Chicago, Illinois (the “City”) and the State and held by the State in the Authority Tax Fund as funds available to pay future debt service for the 1992A, 1994, 1996A, 1998, 2002, 2010, 2012, 2015, and 2017 Expansion Project Bonds. Amounts recognized but not received are reported as restricted, as amounts are to be used to fund debt service for the above noted bonds, subject to annual appropriation by the State. The taxes receivable balance is classified as current as it is expected to be received within one year. If the Authority taxes are not sufficient to pay the debt service payments for the Expansion Project Bonds and cash is not

- 20 -
available in the reserve balance, the Authority is authorized to draw on state sales tax from the State, which is repaid when the Authority taxes begin to generate a surplus again.
The Authority considers the Authority taxes to be derived tax revenues as defined by Governmental Accounting Standards Board (GASB) Statement No. 33, Accounting and Financial Reporting for Nonexchange Transactions. Accordingly, the Authority recognizes the Authority tax revenue in the period when the exchange transaction on which the tax is imposed occurred.
State Grant Revenue—State grant revenue consists of revenues received from the State used for the payment of debt service. The funds are derived from sales taxes as specified in State statute.
Classification of Revenue and Expenses—Revenues from space rental, utility services, food and beverage, parking, and other recurring activities are reported as operating revenues in the basic financial statements. During the current year, the Authority reclassified the food services revenues and expenses related to Savor to a gross basis within the Guest Services line item. In the prior year, the food services revenues and expenses were shown net. Salaries, wages, and benefits; supplies, repairs, and maintenance; outsourced operations; depreciation; utilities; and other general and administrative expenses related to the Authority’s operations are reported as operating expenses. Transactions that are related to financing, investing, intergovernmental agreements, taxes, and other nonoperating events are reported as nonoperating revenues and/or expenses.
Management’s Use of Estimates—The preparation of basic financial statements in conformity with accounting principles generally accepted in the United States of America (GAAP) requires management to make estimates and assumptions that affect the reported amounts of assets and liabilities and disclosure of contingent assets and liabilities at the date of the basic financial statements, and the reported amounts of revenues and expenses during the reporting period. Actual results may differ from those estimates.
New Accounting Pronouncements—
Effective this year
In November 2016, the GASB issued Statement No. 83, Certain Asset Retirement Obligations. This Statement establishes criteria for determining the timing and pattern of recognition of a liability and a corresponding deferred outflow of resources for asset retirement obligations. This Statement also requires that recognition occur when the liability is both incurred and reasonably estimable and requires disclosure of information about the nature of a government’s asset retirement obligations, the methods and assumptions used for the estimates of the liabilities, and the estimated remaining useful life of the associated tangible capital assets. This Statement was adopted by the Authority during the year ended June 30, 2019. The implementation of this statement did not have an impact on the Authority’s basic financial statements.
In April 2018, the GASB issued Statement No. 88, Certain Disclosures Related to Debt, Including Direct Borrowings and Direct Placements. This Statement improves the information that is disclosed in notes to government financial statements related to debt, including direct borrowings and direct placements. It also clarifies which liabilities governments should include when disclosing information related to debt. GASB 88 is
- 21 -
effective for the Authority July 1, 2018. The implementation of this statement impacted the presentation of the footnote, but had no financial impact on the basic financial statements.
Effective next year
In January 2017, the GASB issued Statement No. 84, Fiduciary Activities. The objective of this Statement is to improve guidance regarding the identification of fiduciary activities for accounting and financial reporting purposes and how those activities should be reported. This Statement is effective for the Authority beginning with its year ending June 30, 2020. The Authority has not yet determined the impact, if any, on its basic financial statements or disclosures.
In August 2018, the GASB issued Statement No. 90, Majority Equity Interests—an amendment of GASB Statements No. 14 and No. 61. The primary objectives of this Statement are to improve the consistency and comparability of reporting a government’s majority equity interest in a legally separate organization and to improve the relevance of financial statement information for certain component units. It defines a majority equity interest and specifies that a majority equity interest in a legally separate organization should be reported as an investment if a government’s holding of the equity interest meets the definition of an investment. This Statement establishes that ownership of a majority equity interest in a legally separate organization results in the government being financially accountable for the legally separate organization and, therefore, the government should report that organization as a component unit. This Statement also requires that a component unit in which a government has a 100 percent equity interest account for its assets, deferred outflows of resources, liabilities, and deferred inflows of resources at acquisition value at the date the government acquired a 100 percent equity interest in the component unit. GASB 90 will be effective for the Authority beginning with its year ending June 30, 2020. The Authority has not yet determined the impact, if any, on its basic financial statements or disclosures.
Effective in multiple years
In June 2017, the GASB issued Statement No. 87, Leases. This Statement requires recognition of certain lease assets and liabilities for leases that previously were classified as operating leases and recognized as inflows of resources or outflows of resources based on the payment provisions of the contract. It establishes a single model for lease accounting based on the foundational principle that leases are financings of the right to use an underlying asset. Under this Statement, a lessee is required to recognize a lease liability and an intangible right-to-use lease asset, and a lessor is required to recognize a lease receivable and a deferred inflow of resources, thereby enhancing the relevance and consistency of information about governments’ leasing activities. This Statement is effective for the Authority beginning with its year ending June 30, 2021. The Authority has not yet determined the impact, if any, on its basic financial statements or disclosures.
In June 2018, the GASB issued Statement No. 89, Accounting for Interest Cost Incurred before the End of a Construction Period. This Statement establishes accounting requirements for interest cost incurred before the end of a construction period. This Statement requires that interest cost incurred before the end of a construction period be recognized as an expense in the period in which the cost is incurred for financial statements prepared using the economic resources measurement focus. As a result, interest cost incurred before the end of a construction period will not be included in the historical cost of a capital asset reported in a business-type activity or enterprise fund. GASB 89 will be effective for the Authority beginning with its year ending June 30,

- 22 -
2021. The Authority has not yet determined the impact, if any, on its basic financial statements or disclosures.
In May 2019, the GASB issued Statement No. 91, Conduit Debt Obligations. The primary objectives of this Statement are to provide a single method of reporting conduit debt obligations by issuers and eliminate diversity in practice associated with (1) commitments extended by issuers, (2) arrangements associated with conduit debt obligations, and (3) related note disclosures. This Statement achieves those objectives by clarifying the existing definition of a conduit debt obligation, establishing that a conduit debt obligation is not a liability of the issuer, establishing standards for accounting and financial reporting of additional commitments and voluntary commitments extended by issuers and arrangements associated with conduit debt obligations, and improving required note disclosures. GASB 91 will be effective for the Authority beginning with its year ending June 30, 2021. The Authority has not yet determined the impact, if any, on its basic financial statements or disclosures.
2. CASH, CASH EQUIVALENTS, AND INVESTMENTS
A summary of cash, cash equivalents, and investments as of June 30, 2019 and 2018 is as follows (amounts are in thousands):
2019 2018
Business-type activities: Cash and demand deposits 100,603$ 47,372$ Certificate of deposit 15,146 Government money market funds 117,094 60,110 US treasury securities 45,208
Total business-type activities 232,843$ 152,690$
Fiduciary activities: Equity mutual funds 20,010$ 21,499$ Common/collective trusts-equity 31,340 32,725 Common/collective trusts-fixed income 16,842 15,698 Fixed income securities—separate account 16,032 14,588 Money market mutual fund—separate account 197 450 Money market mutual funds 1,075 1,002
Total 85,496 85,962
Deposit with paying agent 363 350
Total fiduciary activities 85,859$ 86,312$

- 23 -
Business-Type Activities
Investment Policy—Authority investments are made in accordance with the Public Funds Investment Act (30 ILCS 235/1) (the “Act”) and, as required under the Act, the Authority’s Investment Policy (the “Investment Policy”). The Investment Policy does not apply to the Plan, which is directed by the Investment Policy of the Retirement Plan as established by the plan trustees.
In accordance with the Act and the Investment Policy, the Authority may invest in the following types of securities:
1. United States Treasury Securities (Bonds, Notes, Certificates of Indebtedness, and Bills). The Authority may invest in obligations of the United States government, which are guaranteed by the full faith and credit of the United States of America as to principal and interest.
2. United States Agencies. The Authority may invest in bonds, notes, debentures, or other similar obligations of the United States or its agencies. Agencies include: (a) federal land banks, federal intermediate credit banks, banks for cooperative, federal farm credit bank, or other entities authorized to issue debt obligations under the Farm Credit Act of 1971, as amended; (b) federal home loan banks and the federal home loan mortgage corporation; and (c) any other agency created by an act of Congress.
3. Bank Deposits. The Authority may invest in interest-bearing savings accounts, interest-bearing certificates of deposit, or interest-bearing time deposits or other investments constituting direct obligations of any bank as defined by the Illinois Banking Act (205 ILCS 5/1 et seq.), provided that any such bank must be insured by the Federal Deposit Insurance Corporation (the FDIC).
4. Commercial Paper. The Authority may invest in short-term obligations (commercial paper) of corporations organized in the United States with assets exceeding $500 million, provided that: (a) such obligations are at the time of purchase at the highest classification established by at least two standard rating services and which mature not later than 180 days from the date of purchase; and (b) such purchases do not exceed 10% of the corporation’s outstanding obligations.
5. Mutual Funds. The Authority may invest in mutual funds, which invest exclusively in United States government obligations and agencies.
6. Discount Obligations. The Authority may invest in short-term discount obligations of the Federal National Mortgage Association.
7. Investment Pool. The Authority may invest in a Public Treasurers’ Investment Pool created under Section 17 of the State Treasurer Act (15 ILCS 505/17).
8. Investment Certificates. The Authority may invest in investment certificates issued by FDIC-insured savings banks or FDIC-insured savings and loan associations.
Custodial Credit Risk—Deposits—Custodial credit risk for deposits is the risk that, in the event of a financial institution failure, the Authority’s deposits may not be returned. The Authority’s investment policy requires that deposits, which exceed the amount insured by the FDIC, be collateralized, at the rate of 102% of such deposits, by bonds, notes,

- 24 -
certificates of indebtedness, treasury bills, or other securities, which are guaranteed by the full faith and credit of the U.S. government.
Interest Rate Risk—Interest rate risk is the risk that the fair value of the Authority’s investments will decrease as a result of an increase in interest rates. The Authority’s investment policy does not limit investment maturities as a means of managing its exposure to fair value losses arising from increasing interest rates. The Authority manages interest rate exposure by matching the maturities of investments with its expected cash flow needs. For investments intended to be used for operations and capital maintenance, the Authority purchases investments so that the maturity dates are in line with anticipated cash flow needs. For investments restricted for capital projects, the Authority invests in maturities that meet the projected draw schedule for the related project.
The maturities for the Authority’s fixed-income investments as of June 30, 2019 are as follows (in thousands of dollars):
Fair Less MoreValue than 1 1–5 6–10 than 10
Government money market funds 117,094$ 117,094$ - $ - $ - $
117,094$ 117,094$ - $ - $ - $
Investment Maturities (Years)
The maturities for the Authority’s fixed-income investments as of June 30, 2018 are as follows (in thousands of dollars):
Fair Less MoreValue than 1 1–5 6–10 than 10
Government money market funds 60,110$ 60,110$ - $ - $ - $ US treasury securities 45,209 45,209
105,319$ 105,319$ - $ - $ - $
Investment Maturities (Years)
Concentration of Credit Risk—Concentration of credit risk is the risk of loss attributed to the magnitude of investment in any one single issuer. The Authority’s policy does not limit the amounts that it may invest in any one issuer. The Authority is considered to have a concentration of credit risk if its investment in any one single issuer is greater than 5% of the total fixed-income investments. As of June 30, 2019 and 2018, the Authority did not have any investments subject to concentration of credit risk.
Credit Risk—Credit risk is the risk that the Authority will not recover its investments due to the failure of the counterparty to fulfill its obligation. State law limits investments in commercial paper and corporate bonds to the top three ratings issued by nationally recognized statistical rating organizations (NRSROs). It is the Authority’s policy to limit its investments in these investment types to the top two ratings issued by NRSROs. As of June 30, 2019 and 2018, the Authority held no commercial paper. The Authority’s

- 25 -
investments in money market funds were rated AAA by S&P Global Ratings and the U.S. treasuries were rated AA+ by S&P Global Ratings.
Custodial Credit Risk—Investments—Custodial credit risk is the risk that, in the event of the failure of the counterparty, the Authority will not be able to recover the value of its investments or collateral securities that are in the possession of a third party. The Investment Policy requires that investment securities be held by an authorized custodial bank pursuant to a written custodial agreement.
Fair Value of Investments — The Authority measures and records its investments using the fair value measurement guidelines established by the Generally Accepted Accounting Principles (GAAP). These guidelines recognize a three-tiered fair value hierarchy, as follows:
Level 1—Quoted prices for identical investments in active markets;
Level 2—Observable inputs other than quoted market prices; and
Level 3—Unobservable inputs.
Money market mutual fund securities classified in Level 1 of the fair value hierarchy are valued using the net asset value (NAV) per share quoted in active markets for those securities. U.S. Treasury securities classified in Level 2 of the fair value hierarchy are valued using quoted prices for identical and similar securities in active markets.
As of June 30, 2019, $117.1 million of the Authority’s investments consist of money market mutual funds, classified in Level 1 of the fair value hierarchy. As of June 30, 2018, $60.1 million of the Authority’s investments consist of money market mutual funds, classified in Level 1 of the fair value hierarchy and $45.2 million consists of U.S. treasury securities, classified in Level 2 of the fair value hierarchy.
Fiduciary Activities
Investment Policy—The Plan’s investments are made in accordance with the Investment Policy of the Plan as established by the Plan Trustees. The Pension Trust Fund investments are invested according to the targeted investment mix in the investment policy of the Plan. These long-term targets seek to achieve the Plan’s assumed rate of return in conjunction with the overall asset/liability structure of the Plan.
Interest Rate Risk—Interest rate risk is the risk that the fair value of the Plan’s investments will decrease as a result of an increase in interest rates. The Plan’s investment policy does not limit investment maturities as a means of managing its exposure to fair value losses arising from increasing interest rates. The fixed-income portfolio has an effective duration of 5.93 years and 5.79 years at June 30, 2019 and 2018, respectively.
Concentration of Credit Risk—Concentration of credit risk is the risk of loss attributed to the magnitude of investment in any one single issuer. The Plan’s policy limits investments of any single issuer (except for U.S. government and agency securities) to 5% of the Plan’s fixed-income market value. Securities in any one industry may not exceed 25% of the fixed-income portfolio. The Plan is considered to have a concentration of credit risk if its investment in any one single issuer is greater than 5% of the total fixed-income investments. The Plan does not have any concentration of credit risk as of June 30, 2019 and 2018.
- 26 -
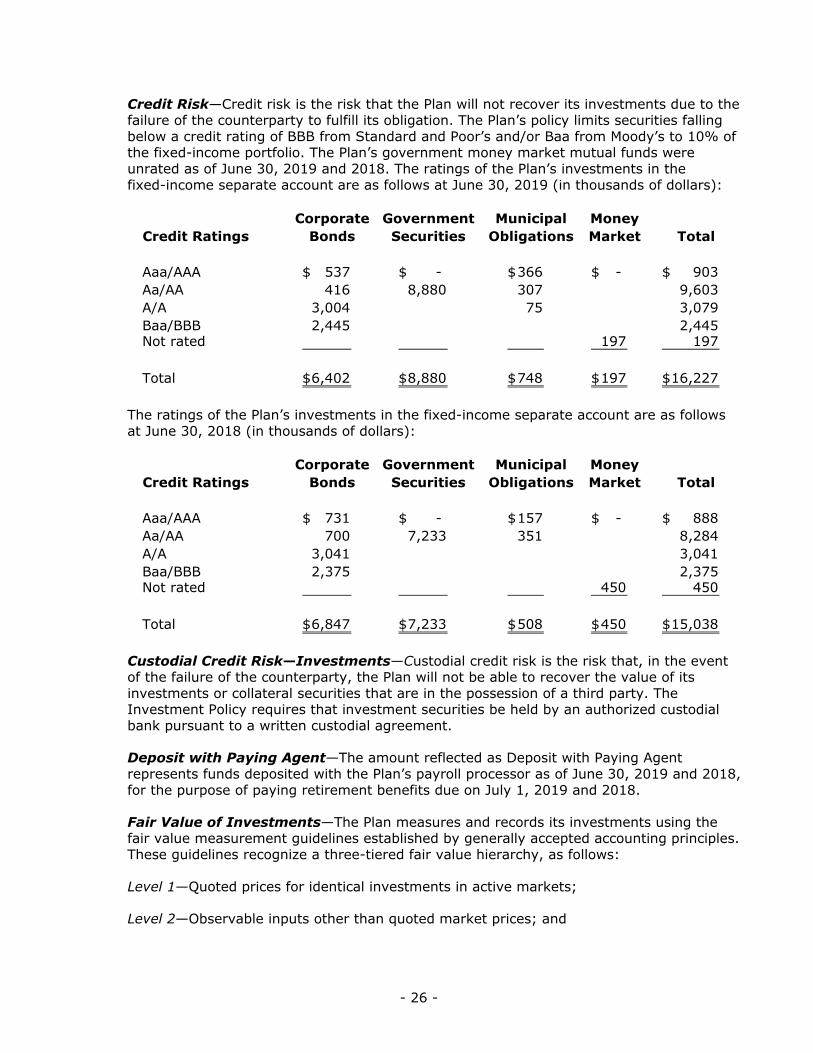
Credit Risk—Credit risk is the risk that the Plan will not recover its investments due to the failure of the counterparty to fulfill its obligation. The Plan’s policy limits securities falling below a credit rating of BBB from Standard and Poor’s and/or Baa from Moody’s to 10% of the fixed-income portfolio. The Plan’s government money market mutual funds were unrated as of June 30, 2019 and 2018. The ratings of the Plan’s investments in the fixed-income separate account are as follows at June 30, 2019 (in thousands of dollars):
Corporate Government Municipal MoneyCredit Ratings Bonds Securities Obligations Market Total
Aaa/AAA 537$ - $ 366$ - $ 903$ Aa/AA 416 8,880 307 9,603 A/A 3,004 75 3,079 Baa/BBB 2,445 2,445 Not rated 197 197
Total 6,402$ 8,880$ 748$ 197$ 16,227$
The ratings of the Plan’s investments in the fixed-income separate account are as follows at June 30, 2018 (in thousands of dollars):
Corporate Government Municipal MoneyCredit Ratings Bonds Securities Obligations Market Total
Aaa/AAA 731$ - $ 157$ - $ 888$ Aa/AA 700 7,233 351 8,284 A/A 3,041 3,041 Baa/BBB 2,375 2,375 Not rated 450 450
Total 6,847$ 7,233$ 508$ 450$ 15,038$
Custodial Credit Risk—Investments—Custodial credit risk is the risk that, in the event of the failure of the counterparty, the Plan will not be able to recover the value of its investments or collateral securities that are in the possession of a third party. The Investment Policy requires that investment securities be held by an authorized custodial bank pursuant to a written custodial agreement.
Deposit with Paying Agent—The amount reflected as Deposit with Paying Agent represents funds deposited with the Plan’s payroll processor as of June 30, 2019 and 2018, for the purpose of paying retirement benefits due on July 1, 2019 and 2018.
Fair Value of Investments—The Plan measures and records its investments using the fair value measurement guidelines established by generally accepted accounting principles. These guidelines recognize a three-tiered fair value hierarchy, as follows:
Level 1—Quoted prices for identical investments in active markets;
Level 2—Observable inputs other than quoted market prices; and

- 27 -
Level 3—Unobservable inputs.
Money market mutual fund securities classified in Level 1 of the fair value hierarchy are valued using the net asset value (NAV) per share quoted in active markets for those securities. U.S. Treasury securities classified in Level 2 of the fair value hierarchy are valued using quoted prices for identical and similar securities in active markets.
As of June 30, 2018, the Authority invested a portion of its cash in U.S. Treasury securities. When these securities matured during 2019, the Authority decided to reinvest the matured proceeds into government money market mutual funds.
The Authority has the following recurring fair value measurements as of June 30, 2019:
Investments Measured at Fair Value($ thousands)June 30, 2019
June 30, 2019 Level 1 Level 2 Level 3Investments by fair value level
Government money market mutual funds 117,094$ 117,094$ - $ - $
Total money market mutual funds 117,094$ 117,094$ - $ - $
Debt securities— US treasury securities - $ - $ - $ - $
Total debt securities - - - -
Total investments by fair value level 117,094$ 117,094$ - $ - $
Fair Value Measurements Using
The Authority has the following recurring fair value measurements as of June 30, 2018:
Investments Measured at Fair Value($ thousands)June 30, 2018
June 30, 2018 Level 1 Level 2 Level 3Investments by fair value level
Government money market mutual funds 60,110$ 60,110$ - $ - $
Total money market mutual funds 60,110$ 60,110$ - $ - $
Debt securities— US treasury securities 45,209$ - $ 45,209$ - $
Total debt securities 45,209 - 45,209 -
Total investments by fair value level 105,319$ 60,110$ 45,209$ - $
Fair Value Measurements Using
- 28 -
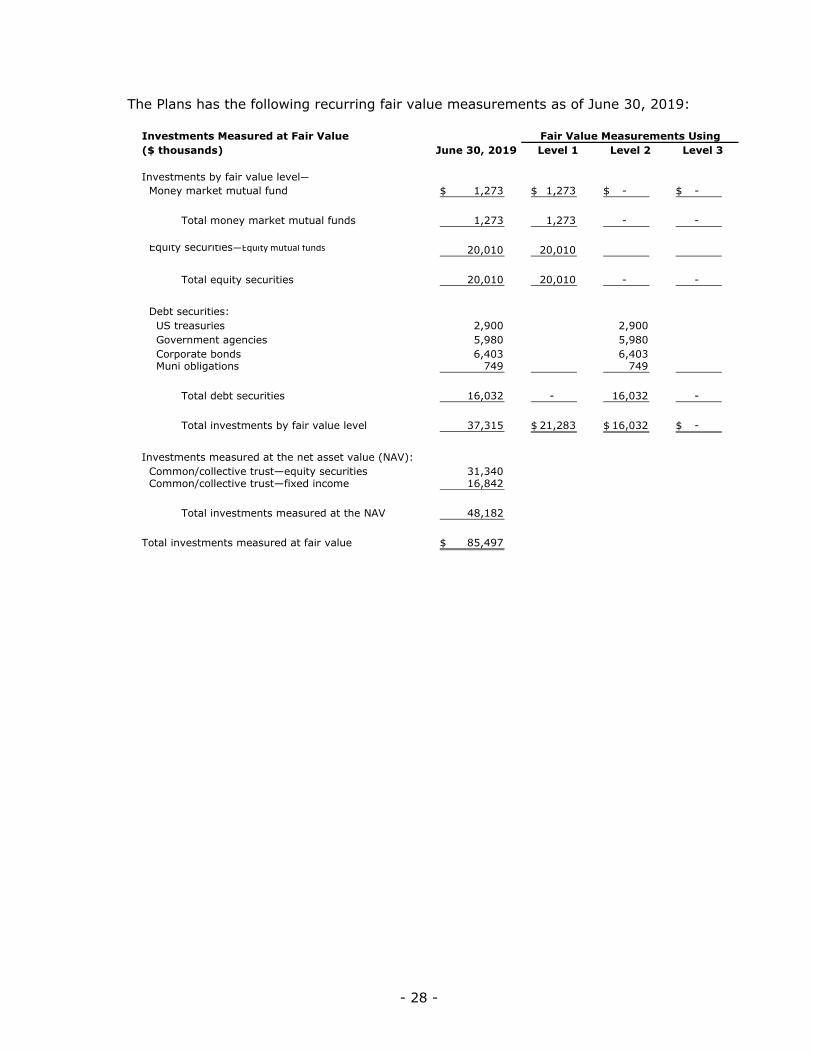
The Plans has the following recurring fair value measurements as of June 30, 2019:
Investments Measured at Fair Value($ thousands) June 30, 2019 Level 1 Level 2 Level 3
Investments by fair value level— Money market mutual fund 1,273$ 1,273$ - $ - $
Total money market mutual funds 1,273 1,273 - -
Equity securities—Equity mutual funds 20,010 20,010
Total equity securities 20,010 20,010 - -
Debt securities: US treasuries 2,900 2,900 Government agencies 5,980 5,980 Corporate bonds 6,403 6,403 Muni obligations 749 749
Total debt securities 16,032 - 16,032 -
Total investments by fair value level 37,315 21,283$ 16,032$ - $
Investments measured at the net asset value (NAV): Common/collective trust—equity securities 31,340 Common/collective trust—fixed income 16,842
Total investments measured at the NAV 48,182
Total investments measured at fair value 85,497$
Fair Value Measurements Using

- 29 -
The Plan has the following recurring fair value measurements as of June 30, 2018:
Investments Measured at Fair Value($ thousands) June 30, 2018 Level 1 Level 2 Level 3
Investments by fair value level— Money market mutual fund 1,452$ 1,452$ - $ - $
Total money market mutual funds 1,452 1,452 - -
Equity securities—Equity mutual funds 21,499 21,499
Total equity securities 21,499 21,499 - -
Debt securities: US treasuries 2,258 2,258 Government agencies 4,975 4,975 Corporate bonds 6,847 6,847 Muni obligations 508 508
Total debt securities 14,588 - 14,588 -
Total investments by fair value level 37,539$ 22,951$ 14,588$ - $
Investments measured at the net asset value (NAV): Common/collective trust—equity securities 32,725$ Common/collective trust—fixed income 15,698
Total investments measured at the NAV 48,423
Total investments measured at fair value 85,962$
Fair Value Measurements Using
Debt and equity securities classified in Level 2 of the fair value hierarchy are valued using the following approaches:
• U.S. Treasuries: Quoted prices for identical and similar securities in active markets;
• Government agencies and Corporate bonds: Pricing is determined using a matrix pricing technique from a third party pricing service. Matrix pricing creates a bullet, non-call spread scale for each issuer for maturities up to 40 years based on a number of factors including the new issue market, secondary trading, dealer quotes, and option adjusted spreads. Final spreads are then added to the closing U.S. Treasury curve to calculate prices; and
• Municipal bonds: Pricing is determined using a matrix pricing technique from a third party pricing service. Municipal bonds with similar characteristics are grouped together in market sectors and each day, yield curves are adjusted based on trades, other pertinent market information, and a number of other factors including pricing levels on bellwether issues, established trading spreads between similar issuers, historical trading spreads over market benchmarks, and new issue scales.

- 30 -
Investments measured at the net asset value (NAV) as of June 30, 2019 are presented in the following table.
RedemptionFrequency
Fair Unfunded (if Currently Redemption NoticeInvestments Measured at the NAV ($ thousands) Value Commitments Eligible) Period
Investments measured at the NAV: Common/collective trust—equity securities (1) 31,340$ - $ Daily None to 15 business days Common/collective trust—fixed income (2) 16,842 Daily None
Total investments measured at the NAV 48,182$
(1) Common/Collective Trust—Equity Securities. This type includes investments in four common/collective trusts that seek to maximize long-term capital growth by investing in equity securities across a broad capitalization range. Eighty-four percent (84%) of the value of the investments of this type invest in US equity securities while 16% of the value of the investments of this type invest in non-US equity securities. The fair values of the investments of this type have been determined using the NAV per unit. The NAV per unit of the trusts is calculated on each business day by dividing the total value of assets, less liabilities, by the number of units outstanding. The trust declarations for two of the funds, representing 49% of the value of the investments of this type, require the trustee to pay the proceeds of a withdrawal in no case more than 10 business days after such trade date for any of the funds. The trustee for one fund, representing 35% of the value of the investments of this type, in its discretion, may require the participating plan to send a withdrawal notice up to 5 business days before the withdrawal date. The trustee for two of the funds, representing 49% of the value of the investments of this type, in its discretion, may require the participating plan to send a withdrawal notice up to 15 business days before the withdrawal date. There are currently no redemption restrictions.
(2) Common/Collective Trust—Fixed Income. This type includes an investment in a common/collective trust with an objective of seeking high total investment return through a combination of current income and capital appreciation by investing in public or private debt obligations issued or guaranteed by US or foreign issuers. At least 80% of the market value of the fund will be invested in investment grade fixed income securities as determined at the time of purchase, counting cash and cash equivalents toward such percentage. The fair values of the investments of this type have been determined using the NAV per unit. The NAV per unit of the trust is calculated on each business day by dividing the total value of assets, less liabilities, by the number of units outstanding. The declaration of trust states that for a withdrawal of all or substantially all of the assets of a participating trust in the fund, payment of the withdrawal may be made up to four business days after the date of withdrawal.
Investments measured at the net asset value (NAV) as of June 30, 2018 are presented in the following table.
RedemptionFrequency
Fair Unfunded (if Currently Redemption NoticeInvestments Measured at the NAV ($ Actual) Value Commitments Eligible) Period
Investments measured at the NAV: Common/collective trust—equity securities (1) 32,725,064$ - $ Daily None to 15 business days Common/collective trust—fixed income (2) 15,698,171 Daily None
Total investments measured at the NAV 48,423,235$
(1) Common/Collective Trust—Equity Securities. This type includes investments in four common/collective trusts that seek to maximize long-term capital growth by investing in equity securities across a broad capitalization range. Eighty-four percent (84%) of the value of the investments of this type invest in US equity securities while 16% of the value of the investments of this type invest in non-US equity securities. The fair values of the investments of this type have been determined using the NAV per unit. The NAV per unit of the trusts is calculated on each business day by dividing the total value of assets, less liabilities, by the number of units outstanding. The trust declarations for two of the funds, representing 49% of the value of the investments of this type, require the trustee to pay the proceeds of a withdrawal in no case more than 10 business days after such trade date for any of the funds. The trustee for one fund, representing 35% of the value of the investments of this type, in its discretion, may require the participating plan to send a withdrawal notice up to 5 business days before the withdrawal date. The trustee for two of the funds, representing 49% of the value

- 31 -
of the investments of this type, in its discretion, may require the participating plan to send a withdrawal notice up to 15 business days before the withdrawal date. There are currently no redemption restrictions.
(2) Common/Collective Trust—Fixed Income. This type includes an investment in a common/collective trust with an objective of seeking high total investment return through a combination of current income and capital appreciation by investing in public or private debt obligations issued or guaranteed by U.S. or foreign issuers. At least 80% of the market value of the fund will be invested in investment grade fixed income securities as determined at the time of purchase, counting cash and cash equivalents toward such percentage. The fair values of the investments of this type have been determined using the NAV per unit. The NAV per unit of the trust is calculated on each business day by dividing the total value of assets, less liabilities, by the number of units outstanding. The declaration of trust states that for a withdrawal of all or substantially all of the assets of a participating trust in the fund, payment of the withdrawal may be made up to four business days after the date of withdrawal.
3. CAPITAL ASSETS
Changes in capital assets for the year ended June 30, 2019 are as follows (in thousands of dollars):
Balance BalanceJune 30, Additions/ June 30,
2018 Accruals Deletions 2019
Capital assets not being depreciated: Land 253,573$ 29$ - $ 253,602$ Construction in progress 40,494 2,160 (14,985) 27,669
Total capital assets not being depreciated 294,067 2,189 (14,985) 281,271
Capital assets being depreciated: Buildings and improvements 3,429,302 17,810 3,447,112 Furniture and fixtures 72,283 1,441 73,724 Machinery and equipment 107,011 5,784 (409) 112,386
Total capital assets being depreciated 3,608,596 25,035 (409) 3,633,222
Less accumulated depreciation: Buildings and improvements (1,418,959) (99,132) (1,518,091) Furniture and fixtures (28,855) (8,616) (37,471) Machinery and equipment (91,409) (3,908) 409 (94,908)
Total accumulated depreciation (1,539,223) (111,656) 409 (1,650,470)
Total capital assets being depreciated—net 2,069,373 (86,621) - 1,982,752
Total capital assets—net 2,363,440$ (84,432)$ (14,985)$ 2,264,023$
- 32 -
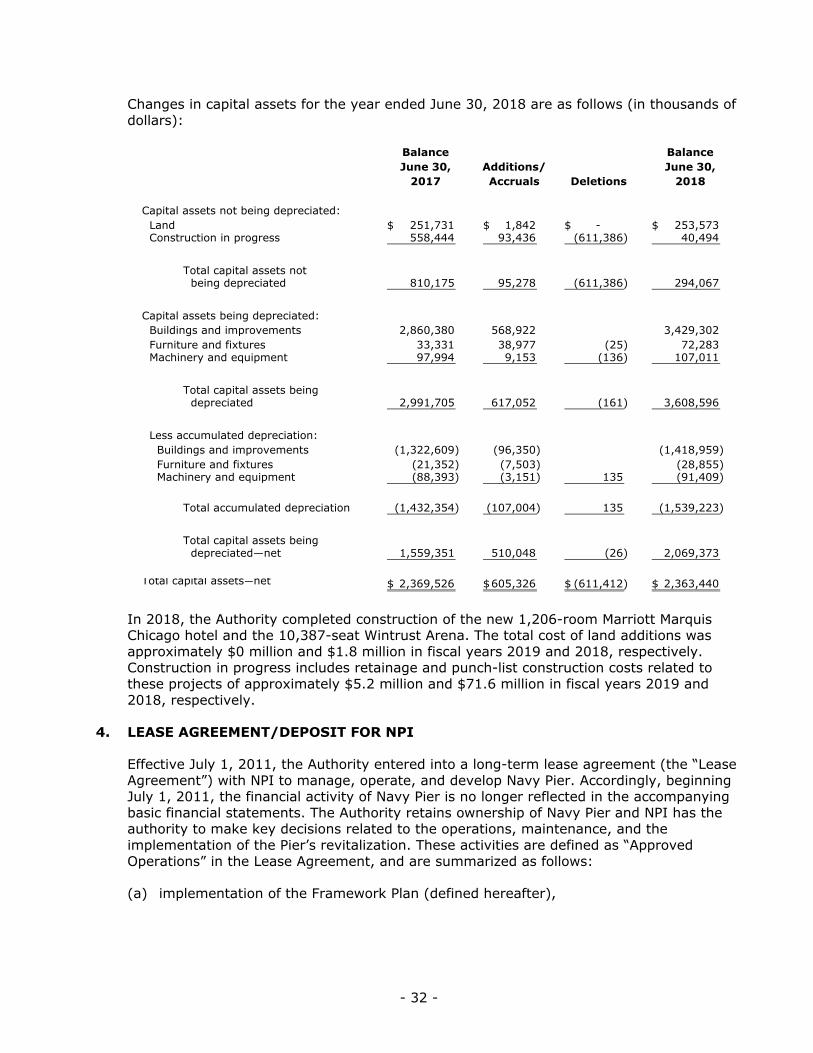
Changes in capital assets for the year ended June 30, 2018 are as follows (in thousands of dollars):
Balance BalanceJune 30, Additions/ June 30,
2017 Accruals Deletions 2018
Capital assets not being depreciated: Land 251,731$ 1,842$ - $ 253,573$ Construction in progress 558,444 93,436 (611,386) 40,494
Total capital assets not being depreciated 810,175 95,278 (611,386) 294,067
Capital assets being depreciated: Buildings and improvements 2,860,380 568,922 3,429,302 Furniture and fixtures 33,331 38,977 (25) 72,283 Machinery and equipment 97,994 9,153 (136) 107,011
Total capital assets being depreciated 2,991,705 617,052 (161) 3,608,596
Less accumulated depreciation: Buildings and improvements (1,322,609) (96,350) (1,418,959) Furniture and fixtures (21,352) (7,503) (28,855) Machinery and equipment (88,393) (3,151) 135 (91,409)
Total accumulated depreciation (1,432,354) (107,004) 135 (1,539,223)
Total capital assets being depreciated—net 1,559,351 510,048 (26) 2,069,373
Total capital assets—net 2,369,526$ 605,326$ (611,412)$ 2,363,440$
In 2018, the Authority completed construction of the new 1,206-room Marriott Marquis Chicago hotel and the 10,387-seat Wintrust Arena. The total cost of land additions was approximately $0 million and $1.8 million in fiscal years 2019 and 2018, respectively. Construction in progress includes retainage and punch-list construction costs related to these projects of approximately $5.2 million and $71.6 million in fiscal years 2019 and 2018, respectively.
4. LEASE AGREEMENT/DEPOSIT FOR NPI
Effective July 1, 2011, the Authority entered into a long-term lease agreement (the “Lease Agreement”) with NPI to manage, operate, and develop Navy Pier. Accordingly, beginning July 1, 2011, the financial activity of Navy Pier is no longer reflected in the accompanying basic financial statements. The Authority retains ownership of Navy Pier and NPI has the authority to make key decisions related to the operations, maintenance, and the implementation of the Pier’s revitalization. These activities are defined as “Approved Operations” in the Lease Agreement, and are summarized as follows:
(a) implementation of the Framework Plan (defined hereafter),

- 33 -
(b) maintaining, repairing, operating, designing, financing, subleasing, licensing, developing, redeveloping, and/or demolishing the grounds, buildings and facilities consistent with the Framework Plan, and
(c) supporting and benefiting the Authority through developing and operating Navy Pier for the achievement of the Authority’s governmental purposes.
The “Framework Plan” is a comprehensive long-term plan to maintain Navy Pier as a high-profile public attraction and to guide the redevelopment of Navy Pier. The Framework Plan sets forth business objectives (including the intent to maintain the public nature of Navy Pier), a master land use plan, investment priorities, development costs and potential sources of private and public funding along with the conditions to be satisfied by NPI in order to maintain public funding. The Framework Plan was developed during the transition period (from approximately February 2011 until the effective date of the lease of July 1, 2011) and can be amended by the parties throughout the lease term in accordance with the provisions of the Lease Agreement.
Significant terms of the Lease Agreement are as follows:
• The Lease Agreement term is from July 1, 2011 through June 30, 2036, with four renewal options of 20 years each, for a total possible term of 105 years. The Lease Agreement requires NPI to pay the Authority rent of $1 per year and to operate Navy Pier in accordance with the Framework Plan.
• The Authority shall deposit a mutually agreed-upon amount into an account established by NPI for the sole and exclusive benefit, and under the sole and exclusive control of NPI to be used for the implementation of the Approved Operations as defined in the Lease Agreement. The mutually agreed-upon amount shall not be more than $75 million and not less than $60 million dependent upon the amount of the Authority’s available funds after determining the costs of certain Authority improvements and other expenses. The Authority may also make its bonding capacity available to NPI or to consent to financing the Approved Operations with debt obligations that extend beyond the term of the Lease Agreement.
• The Authority will loan NPI $5,000,000 to help fund the initial operating costs.
• NPI can terminate the Lease Agreement at any time. The Authority can terminate the agreement only upon default by NPI. Events of default include (a) failure by NPI to comply in any material respect with the Framework Plan, or with the terms of the Lease Agreement (if failure is not remedied within 90 days after written notice); (b) failure by NPI to pay the Promissory Note when due, and such failure continues for more than 60 days; (c) NPI abandons the premises; or (d) NPI is bankrupt or insolvent.
• At termination, all assets, including the premises and revenues from all sources, must be returned to the Authority. If donations cannot be legally transferred due to the intention of the donor, NPI and the Authority must mutually agree to the disposition.
The Authority has accounted for the Lease Agreement with NPI as an operating lease. Since the implementation of the agreement, the Authority has deposited a total of $110 million into the capital improvement account established by NPI; no amounts have been spent during the fiscal years ended June 30, 2018 and June 30, 2019, respectively. The capital improvement account does not have a balance as of June 30, 2018.

- 34 -
5. DEBT
Long-term debt outstanding at June 30, 2019 and 2018 is as follows (in thousands of dollars):
2019 2018
Expansion project bonds: Series 1992A McCormick Place Expansion Project Bonds, maturing June 2027, some subject to prior redemption, bearing stated interest at 4.35% to 50.00% (yielding 4.35% to 6.75%); bonds with 50% stated rate were issued at a premium of approximately four times face value. 80,509$ 117,618$
Series 1994A and B McCormick Place Expansion Project Bonds, maturing June 2029, some subject to prior redemption, bearing stated interest at 4.25% to 50.00% (yielding 4.25% to 6.70%); bonds with 50% stated interest rate were issued at a premium of approximately four times face value. 132,257 134,398
Series 1996A McCormick Place Expansion Refunding Bonds, maturing June 2027, some subject to prior redemption, bearing stated interest at 4.05% to 6.25% 248,702 250,180
Series 1998A and B McCormick Place Expansion Refunding Bonds, maturing June 2029, some subject to prior redemption, bearing stated interest at 4.50% to 50.00% (yielding 4.325% to 5.040%), payable semiannually; bonds with 50% stated interest rate were issued at a premium of approximately five times face value. 96,240 99,450
Series 2002 A, B, and C McCormick Place Expansion Project Bonds, maturing June 2042, some subject to prior redemption, bearing stated interest at 4.375% to 5.75% (yielding 3.68% to 6.08%). 794,348 726,485
Series 2010 McCormick Place Expansion Project Bonds, maturing June 2050, some subject to prior redemption, bearing stated interest at 5.00% to 5.50% (yielding 4.98% to 6.25%), payable semiannually. 1,208,460 1,188,606
Series 2012 McCormick Place Expansion Project Bonds, maturing June 2052, some subject to prior redemption, bearing stated interest at 0.44% to 5.00% (yielding 0.44% to 5.73%), payable semiannually. 872,809 867,115
Series 2015 McCormick Place Expansion Project Bonds, maturing June 2053, some subject to prior redemption, bearing stated interest at 5.00% to 5.50% (yielding 4.47% to 6.00%), payable semiannually. 224,928 223,333
Series 2017 McCormick Place Expansion Project Bonds, maturing June 2057, some subject to prior redemption, bearing stated interest at 4.70% to 5.00% (yielding 3.35% to 5.25%), payable semiannually. 490,637 478,906
Total expansion project bonds 4,148,890 4,086,092

- 35 -
2019 2018Project revenue bonds: Series 2019A Metropolitan Pier and Exposition Authority Project Revenue Bonds, maturing June 2041, some subject to prior redemption, bearing stated interest at 5.00% to 5.25% (yielding 3.15% to 4.32%), payable semiannually. 36,865$ - $
Total project revenue bonds 36,865 -
Total expansion project and project revenue bonds 4,185,755 4,086,092
Less current portion (91,045) (76,515)
Bonds payable – noncurrent 4,094,710$ 4,009,577$
Changes in long-term obligations for the year ended June 30, 2019 are as follows (in thousands of dollars):
Balance (Amortization)/ Balance DueJune 30, Accretion— Principal June 30, within
2018 Additions Deletions Net Payments 2019 One Year
Bonds payable 4,086,092$ - $ - $ 139,314$ (76,515)$ 4,148,891$ 91,045$ Direct Placement Bonds 36,865 36,865 Net premium on bonds payable 345,322 (14,613) 330,709 15,495 Net premium on direct placement bonds 3,385 (23) 3,362 215 Amount due to state 39,304 (39,304)
Total long-term obligations 4,470,718$ 40,250$ - $ 124,678$ (115,819)$ 4,519,827$ 106,755$
RefundingNew Issuance/
Changes in long-term obligations for the year ended June 30, 2018 are as follows (in thousands of dollars):
Balance (Amortization)/ Balance DueJune 30, Accretion— Principal June 30, within
2017 Additions Deletions Net Payments 2018 One Year
Bonds payable 3,715,484$ 472,506$ (197,379)$ 126,121$ (30,640)$ 4,086,092$ 76,515$ Net premium on bonds payable 346,903 14,795 (2,637) (13,740) 345,322 14,613 Amount due to State 42,001 (2,697) 39,304 39,304
Total long-term obligations 4,104,388$ 487,301$ (200,016)$ 112,381$ (33,337)$ 4,470,718$ 130,432$
RefundingNew Issuance/
The Authority’s Metropolitan Pier and Exposition Authority Project Revenue Bonds, Series 2019A, currently outstanding in the amount of $36,865,000, were issued in May 2019 as a direct placement. The debt service for the 2019A Project Revenue Bonds are supported by limited revenue obligations of the Authority including the annual energy savings amount from projects financed with the Series 2019A Project Revenue Bonds, net revenues of certain Authority parking facilities, and net revenues of the Authority’s energy center. Aside from the pledged revenues, no assets are pledged as collateral for the bonds. The Authority has covenanted that it will charge and collect service charges as may be necessary or proper in order that the pledged revenues will be at least sufficient (a) to provide in each fiscal year a sum equal to the debt service for such fiscal year, and (b) at all times to provide for any deficits resulting from failure to receive any service charges or from any other cause and comply in all respects with the terms and provisions of the

- 36 -
indenture and pay and discharge all charges or liens payable out of the pledged revenues when due and enforceable. There are no events of default with finance-related consequences, there are no termination events with finance-related consequences, and there are no events that would cause an acceleration on the bonds. The Authority has published voluntary disclosure information for the bonds, including the trust indenture, on the Municipal Securities Rulemaking Board’s Electronic Municipal Market Access (EMMA) website.
A summary of interest and amortization expense for the years ended June 30, 2019 and 2018 is as follows (in thousands of dollars):
2019 2018
Interest incurred 120,450$ 116,231$ Bond accretion—capital appreciation bonds 139,314 126,121 Bond issuance cost 184 3,694 Amortization of deferred loss on bond refunding 4,752 4,516 Amortization of bond issuance costs 626 500 Amortization of bond premium (discount)—net (14,636) (13,740)
Total interest and amortization expense 250,690$ 237,322$
Annual Requirements—Total debt principal of $4.2 billion (and unamortized accretion on capital appreciation bonds of $5.5 billion) and $2.8 billion interest due on bonds during the next five years and in subsequent five-year periods at June 30, 2019 are as follows (in thousands of dollars):
Year(s) EndingJune 30: Principal Interest Principal Interest
2020 91,045$ 119,987$ - $ 1,917$ 2021 127,700 118,173 1,917 2022 143,790 116,084 530 1,917 2023 164,180 110,689 630 1,890 2024 167,450 107,427 735 1,859 2025–2029 977,030 486,525 5,570 8,621 2030–2034 1,303,155 421,056 9,645 6,806 2035–2039 1,315,885 420,332 15,355 3,713 2040–2044 1,346,465 389,741 4,400 255 2045–2049 1,411,564 324,646 2050–2054 1,628,081 108,122 2055–2057 1,019,765 21,969
9,696,110$ 2,744,752$ 36,865$ 28,895$
Direct Placements BondsBonds Payable
The 1992A, 1994, 1996A, 1998, 1999, 2002, 2004A, 2010, 2012, 2015 and 2017 Expansion Project Bonds (the Expansion Project Bonds) are serviced with the proceeds of four taxes (collectively, Authority taxes). Components of Authority taxes include restaurant tax, car rental tax, hotel tax, and airport departure tax. The Authority is also authorized to receive certain surplus funds, if any, generated by the Illinois Sports Facilities Authority.

- 37 -
In addition, the State of Illinois established and holds an Authority Tax Fund with balances of $21.4 million and $74.3 million at June 30, 2019 and 2018, respectively, which consist of cash collected for Authority taxes not yet remitted to the Authority. These balances in the Authority Tax Fund are included in the Authority taxes receivable line items in the statements of net position as of June 30, 2019 and 2018, respectively.
An allocated portion of the State of Illinois sales tax is also available to service the Expansion Project Bonds in the event of shortfalls in Authority taxes. Beginning in fiscal year 2008, collections of Authority taxes were inadequate to fund annual debt service requirements for the Expansion Project Bonds, and the Authority began to draw funding from the state sales tax. The amount due to the State of Illinois for the years ended June 30, 2019 and 2018 was $0.0 million and $39.3 million, respectively, net of year-end cash balances in the Authority Tax Fund. The Authority repaid the remaining $39.3 million due to the State of Illinois during fiscal 2019.
The debt service for the 2019A Project Revenue Bonds are supported by limited revenue obligations of the Authority including the annual energy savings amount from projects financed with the Series 2019A Project Revenue Bonds, net revenues of certain Authority parking facilities, and net revenues of the Authority’s energy center.
In accordance with the Third Supplemental Indenture of Trust (the Indenture) applicable to the McCormick Place Expansion Project Bonds and the McCormick Place Expansion Project Refunding Bonds, the Authority, during fiscal year 1995, entered into two Debt Service Deposit Agreements.
The Indenture also called for the establishment of an “Excess Revenue Reserve Subaccount” to meet applicable debt service requirements in the event that adequate funds to meet such requirements are not otherwise available. The “Excess Revenue Reserve Subaccount” was established from the proceeds of the Debt Service Deposit Agreements. The remaining proceeds were used to finance the Authority’s ongoing construction activities.
The Authority has refunded all or a portion of various bond issues by depositing U.S. government securities in irrevocable trusts to provide for future debt service payments on the refunded bonds. As a result, such bonds are considered defeased and the liability for these bonds has been removed from the statements of net position. The original balances and the related escrow funds for refunded outstanding bonds as of June 30, 2019 are as follows (in thousands of dollars):
OriginalSeries Issue Outstanding Escrow
Description: 1999 refunding of McCormick Place Hospitality Facilities Revenue Bonds 1996A 127,420$ 63,755$ 66,468$ 2002 refunding of McCormick 1992A, 1994 Place Expansion Project Bonds 1996, 1998, 1999 196,228 24,933 48,465 2015 refunding of McCormick 1992A, 1994, Place Expansion Project Bonds 1998, 2002, 2012 31,506 10,995 18,859 2017 refunding of McCormick 1992A, 1994, Place Expansion Project Bonds 2002, 2010 110,972 66,249 100,467
466,126$ 165,932$ 234,259$

- 38 -
The original balances and the related escrow funds for refunded outstanding bonds as of June 30, 2018 are as follows (in thousands of dollars):
OriginalSeries Issue Outstanding Escrow
Description: 1999 refunding of McCormick Place Hospitality Facilities Revenue Bonds 1996A 127,420$ 69,560$ 72,830$ 2002 refunding of McCormick 1992A, 1994 Place Expansion Project Bonds 1996, 1998, 1999 196,228 28,968 51,656 2015 refunding of McCormick 1992A, 1994, Place Expansion Project Bonds 1998, 2002, 2012 31,506 10,995 18,562 2017 refunding of McCormick 1992A, 1994, Place Expansion Project Bonds 2002, 2010 110,972 67,811 110,165
466,126$ 177,334$ 253,213$
On May 8, 2019, the Authority issued its Series 2019A Metropolitan Pier and Exposition Authority Project Revenue Bonds for an original par amount of $36.9 million. The bonds are secured by limited revenue obligations of the Authority including the annual energy savings amount from projects financed with the Series 2019A Project Revenue Bonds, net revenues of certain Authority parking facilities, and net revenues of the Authority’s energy center. The bonds were sold with an all-in interest rate of 4.46% and a final maturity date of June 15, 2041. Proceeds of the Series 2019A Bonds will be used to pay the costs of energy conservation measures and related capital improvements to buildings and facilities of the Authority.
Short-Term Debt—In May 2015, the Authority issued a Hotel Construction Loan Note, Series 2015A, (the “Note”) for the purpose of financing a portion of the construction of the Marriott Marquis Chicago. The Note was issued for an amount not to exceed $250 million and the stated maturity date of the Note is February 1, 2018. In fiscal year 2018, the Authority repaid the Note, prior to its stated maturity date, with the issuance of Expansion Project Bonds.
6. PENSION PLAN
Pension Plan—The following description of the Plan is provided for general information purposes only. Participants should refer to the Plan document for more complete information.
(a) Plan Description
The Authority adopted and established the Plan effective July 1, 1985. The Plan is a single-employer, defined benefit pension plan, which provides benefits for all full-time, non-represented employees, and certain union-represented employees. The Plan was established under the authority of the Board of Directors of the Authority. During fiscal year 2012, the Authority restructured its organization and dramatically reduced the number of Authority employees. As a result, the Authority elected to freeze participation in the Plan and transition participants to the 401(a) Plan. Effective February 29, 2012, the Plan stopped accruing new benefits and remaining Authority employees began participating in the 401(a) Plan on March 1, 2012.

- 39 -
The Authority may amend and restate the Plan pursuant to the Plan’s trust agreement Section 7.1 subject to authorization by the Authority’s Board of Directors. The Plan was restated and adopted on January 28, 2014. The amended Plan incorporates all prior amendments. The Internal Revenue Service has determined and informed the Plan by a letter dated December 2, 2014, that the Plan and related trust are designed in accordance with applicable sections of the Internal Revenue Code.
On January 27, 2015, the Plan was amended to change the Plan name to the “Metropolitan Pier and Exposition Authority Retirement Plan and Trust.” Other amendments included clarification of the type of plan, additional references to Internal Revenue Code sections, and expanded definitions. On January 26, 2016, the Plan was amended to state that Special Retirees, as defined per the Plan document, would continue to accrue benefits for earnings after February 12, 2012. The Plan issues a publicly available financial report that can be obtained at the Authority’s corporate offices at 330 East Cermak Road, Chicago, IL 60616.
(b) Benefits Provided
Employees hired before July 1, 2009, were eligible for the Plan on the first day of the month after attaining age 21 and completing one year of service. Employees are 100% vested after five years of service or after attaining age 55. Effective February 29, 2012, the Authority amended the Plan to cease all further benefit accruals under the Plan, except that Special Retirees will continue to accrue benefits for Earnings after February 29, 2012, per the January 26, 2016 amendment.
Employees earn a basic annual pension benefit equal to 1.5% of earnings for each year of service after July 1, 1978, and any pension benefits accrued prior to July 1, 1978. After completing 10 years of service, employees are eligible for a minimum pension benefit equal to 3.33% of their highest average earnings times years of service, up to a maximum of 15 years. Employees eligible for the minimum pension always receive the greater of their basic pension or their minimum pension. Normal retirement under the plan is age 65, but employees are eligible for an early retirement pension upon attaining age 55. Early retirement pensions are reduced to reflect a longer expected payment period.
If the amount of base retirement benefit payable to the retired employee or his beneficiary is less than $75 per month ($20 prior to June 2, 1986) a single sum payment of the employee’s entire nonforfeitable benefit will be made in lieu of monthly benefit payments, provided the present value of such benefit is not in excess of $5,000; a single sum payment will be made only with the consent or acceptance of the payee. Otherwise, the employee shall receive their benefits as a life annuity payable monthly upon retirement.
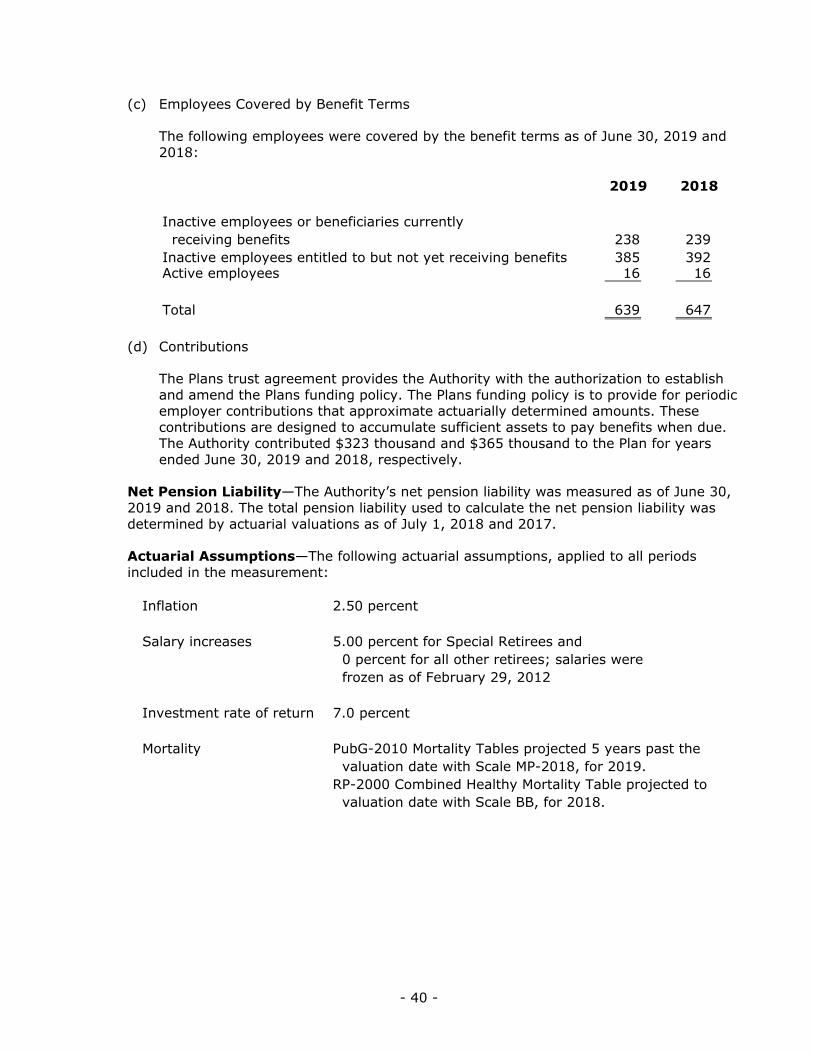
- 40 -
(c) Employees Covered by Benefit Terms
The following employees were covered by the benefit terms as of June 30, 2019 and 2018:
2019 2018
Inactive employees or beneficiaries currently receiving benefits 238 239 Inactive employees entitled to but not yet receiving benefits 385 392 Active employees 16 16
Total 639 647
(d) Contributions
The Plans trust agreement provides the Authority with the authorization to establish and amend the Plans funding policy. The Plans funding policy is to provide for periodic employer contributions that approximate actuarially determined amounts. These contributions are designed to accumulate sufficient assets to pay benefits when due. The Authority contributed $323 thousand and $365 thousand to the Plan for years ended June 30, 2019 and 2018, respectively.
Net Pension Liability—The Authority’s net pension liability was measured as of June 30, 2019 and 2018. The total pension liability used to calculate the net pension liability was determined by actuarial valuations as of July 1, 2018 and 2017.
Actuarial Assumptions—The following actuarial assumptions, applied to all periods included in the measurement:
Inflation 2.50 percent
Salary increases 5.00 percent for Special Retirees and 0 percent for all other retirees; salaries were frozen as of February 29, 2012
Investment rate of return 7.0 percent
Mortality PubG-2010 Mortality Tables projected 5 years past the valuation date with Scale MP-2018, for 2019.RP-2000 Combined Healthy Mortality Table projected to valuation date with Scale BB, for 2018.

- 41 -
The long-term expected rate of return on pension plan investments was determined using a building-block method in which best-estimate ranges of expected future real rates of return are developed for each major asset class. These ranges are combined to produce the long-term expected rate of return by weighting the expected future real rates of return by the target asset allocation percentage and adding expected inflation. The target allocation and best estimates of arithmetic real rates of return for each major asset class included in the pension plan’s target asset allocation as of June 30, 2019 and 2018 are summarized in the following tables:
As of June 30, 2019 Target Long-Term ExpectedAsset Class Allocation Real Rate of Return
Large cap domestic equity 38 % 5.7 % Small cap domestic equity 10 6.3 International equity 12 5.6 Fixed income securities 38 1.0 Cash 2 0.4
100 %
As of June 30, 2018 Target Long-Term ExpectedAsset Class Allocation Real Rate of Return
Large cap domestic equity 38 % 5.6 % Small cap domestic equity 10 6.4 International equity 12 5.6 Fixed income securities 38 1.8 Cash 2 0.7
100 %

- 42 -
Discount Rate—The discount rate used to measure the total pension liability was 7% for the years ended June 30, 2019 and 2018. The ratio of the actuarial value of assets to the total actuarial liability is 94.0% and 96.7% as of June 30, 2019 and 2018, respectively. The projection of cash flows used to determine the discount rate assumed that sponsor contributions will be made at rates equal to the actuarially determined contribution rates. Based on these assumptions, the Plan’s projected fiduciary net position was projected to be available to make all projected future benefit payments of current plan members. Therefore, the long-term expected rate of return on pension plan investments was applied to all periods of projected benefits payments to determine the total pension liability. The changes in net pension liability for the year ended June 30, 2019, are as follows (in thousands of dollars):
Total Pension Plan Fiduciary Net PensionLiability Net Position Liability
(a) (b) (a)–(b)
Balances at June 30, 2018 89,248$ 86,312$ 2,936$
Changes for the year: Interest 6,073 6,073 Differences between expected and actual experience (493) (493) Contributions—employer 323 (323) Net investment income 4,244 (4,244) Change in assumptions 1,527 1,527 Benefit payments, including refunds of employee contributions (4,971) (4,971) Administrative expense (49) 49
Net changes 2,136 (453) 2,589
Balances at June 30, 2019 91,384$ 85,859$ 5,525$
Increase (Decrease)
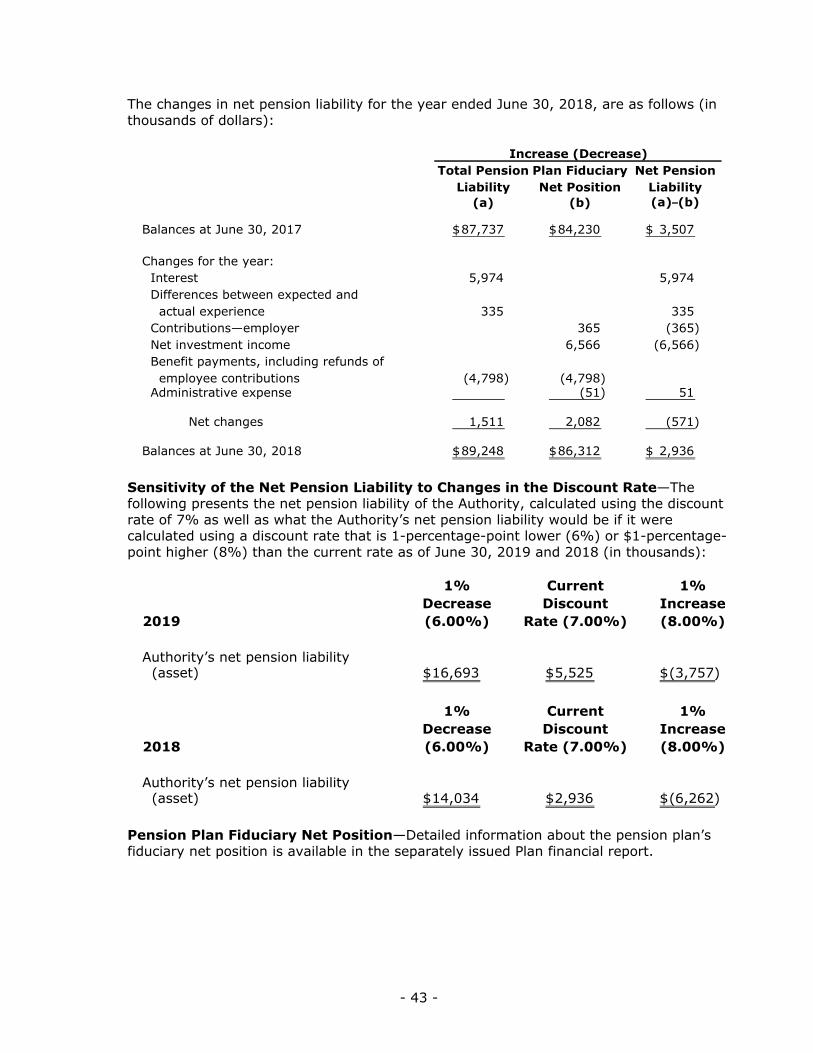
- 43 -
The changes in net pension liability for the year ended June 30, 2018, are as follows (in thousands of dollars):
Total Pension Plan Fiduciary Net PensionLiability Net Position Liability
(a) (b) (a)–(b)
Balances at June 30, 2017 87,737$ 84,230$ 3,507$
Changes for the year: Interest 5,974 5,974 Differences between expected and actual experience 335 335 Contributions—employer 365 (365) Net investment income 6,566 (6,566) Benefit payments, including refunds of employee contributions (4,798) (4,798) Administrative expense (51) 51
Net changes 1,511 2,082 (571)
Balances at June 30, 2018 89,248$ 86,312$ 2,936$
Increase (Decrease)
Sensitivity of the Net Pension Liability to Changes in the Discount Rate—The following presents the net pension liability of the Authority, calculated using the discount rate of 7% as well as what the Authority’s net pension liability would be if it were calculated using a discount rate that is 1-percentage-point lower (6%) or $1-percentage-point higher (8%) than the current rate as of June 30, 2019 and 2018 (in thousands):
1% Current 1%Decrease Discount Increase
2019 (6.00%) Rate (7.00%) (8.00%)
Authority’s net pension liability (asset) 16,693$ 5,525$ (3,757)$
1% Current 1%Decrease Discount Increase
2018 (6.00%) Rate (7.00%) (8.00%)
Authority’s net pension liability (asset) 14,034$ 2,936$ (6,262)$
Pension Plan Fiduciary Net Position—Detailed information about the pension plan’s fiduciary net position is available in the separately issued Plan financial report.
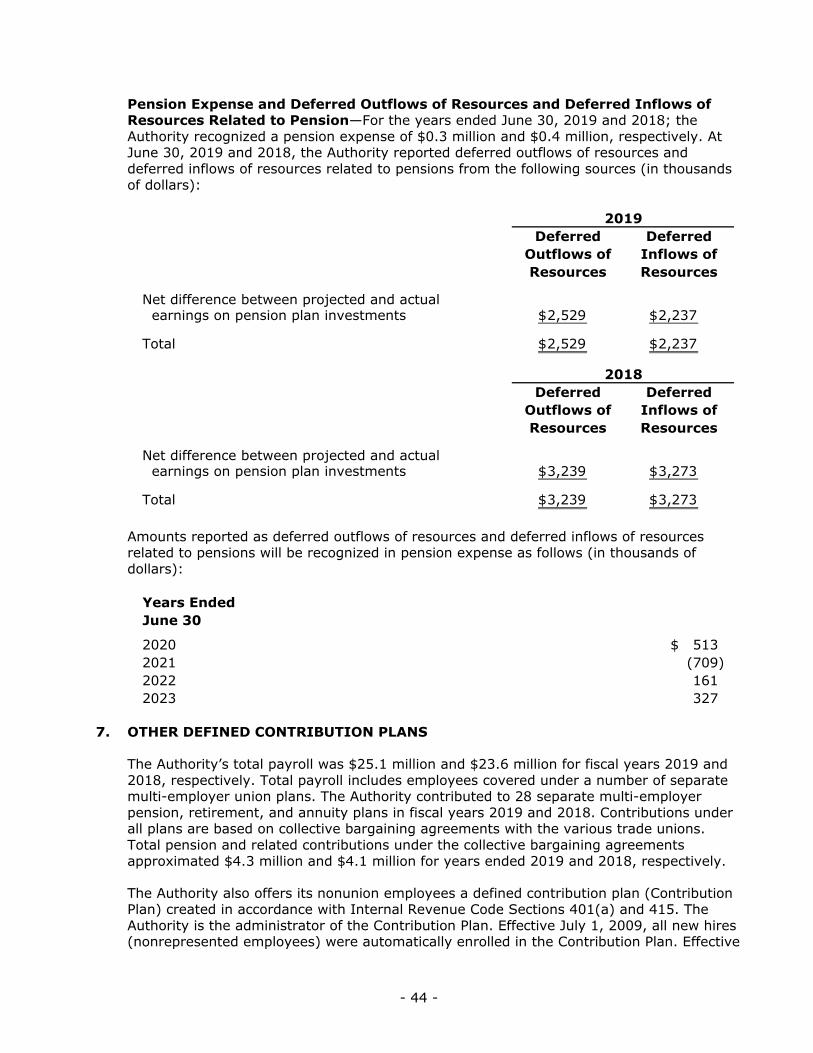
- 44 -
Pension Expense and Deferred Outflows of Resources and Deferred Inflows of Resources Related to Pension—For the years ended June 30, 2019 and 2018; the Authority recognized a pension expense of $0.3 million and $0.4 million, respectively. At June 30, 2019 and 2018, the Authority reported deferred outflows of resources and deferred inflows of resources related to pensions from the following sources (in thousands of dollars):
Deferred DeferredOutflows of Inflows ofResources Resources
Net difference between projected and actual earnings on pension plan investments 2,529$ 2,237$
Total 2,529$ 2,237$
Deferred DeferredOutflows of Inflows ofResources Resources
Net difference between projected and actual earnings on pension plan investments 3,239$ 3,273$
Total 3,239$ 3,273$
2018
2019
Amounts reported as deferred outflows of resources and deferred inflows of resources related to pensions will be recognized in pension expense as follows (in thousands of dollars):
Years EndedJune 30
2020 513$ 2021 (709) 2022 161 2023 327
7. OTHER DEFINED CONTRIBUTION PLANS
The Authority’s total payroll was $25.1 million and $23.6 million for fiscal years 2019 and 2018, respectively. Total payroll includes employees covered under a number of separate multi-employer union plans. The Authority contributed to 28 separate multi-employer pension, retirement, and annuity plans in fiscal years 2019 and 2018. Contributions under all plans are based on collective bargaining agreements with the various trade unions. Total pension and related contributions under the collective bargaining agreements approximated $4.3 million and $4.1 million for years ended 2019 and 2018, respectively.
The Authority also offers its nonunion employees a defined contribution plan (Contribution Plan) created in accordance with Internal Revenue Code Sections 401(a) and 415. The Authority is the administrator of the Contribution Plan. Effective July 1, 2009, all new hires (nonrepresented employees) were automatically enrolled in the Contribution Plan. Effective

- 45 -
February 29, 2012, the Authority stopped accruing new benefits in the Plan and made the Contribution Plan available to all nonrepresented employees (effective March 1, 2012). The Authority established a discretionary employer contribution consisting of an automatic 3% of employee compensation and a 50% match of up to 8% of compensation on contributions made by the employee to the deferred compensation plan (described more fully in Note 8). The contributions are not available to employees until termination, retirement, death, or unforeseeable emergency. All assets of the Contribution Plan are held in a trust in the name of the Contribution Plan and are used exclusively to pay benefits to the participants and their beneficiaries. As such, the Authority does not report plan assets and liabilities in the basic financial statements. The assets of the Contribution Plan, consisting primarily of open-ended mutual funds, approximated $1.6 million and $1.4 million as of June 30, 2019 and 2018, respectively. The Authority contributed $308 thousand and $302 thousand to the Contribution Plan during fiscal years 2019 and 2018, respectively.
8. DEFERRED COMPENSATION PLAN
The Authority offers its employees a deferred compensation plan created in accordance with Internal Revenue Code Section 457. The deferred compensation plan (457 plan), available to all Authority employees, permits them to defer a portion of their salaries until future years. The deferred compensation is not available to employees until termination, retirement, death, or unforeseeable emergency. All assets of the deferred compensation plan are held in a trust in the name of the Plan and are used exclusively to pay benefits to the participants and their beneficiaries. As such, the Authority does not report plan assets and liabilities in the basic financial statements.
9. LEASE COMMITMENTS
The Authority’s East Exposition Building (Lakeside Center) and the adjoining underground parking facility are constructed on land leased from the Chicago Park District. Total expenses recorded under this operating lease were $1,008,000 and $951,000 for the years ended June 30, 2019 and 2018, respectively. The future minimum lease payments for operating noncancelable leases through December 31, 2043 are as follows (in thousands of dollars):
Years EndingJune 30 Amount
2020 1,069$ 2021 1,133 2022 1,201 2023 1,272 2024–2028 7,564 2029–2033 9,107 2034–2038 11,682 2039–2042 11,708
44,736$

- 46 -
10. RISK MANAGEMENT
The Authority is exposed to various risks of loss related to torts; theft of, damage to, and destruction of assets; business interruption; errors and omissions; injuries to customers, employees, contractors, or vendors; and natural disasters. The Authority utilizes a comprehensive insurance program for its property and casualty coverage provided by commercial insurance carriers. Insurance settlements have not exceeded coverage in any of the last three years.
Effective July 1, 2018, the Authority qualified for the option to participate in a Guaranteed Risk program for workers compensation coverage. This program differs from the most recent program, an Incurred Retrospective program, by providing the Authority budget certainty and reduced financial risk. The Authority’s guaranteed annual premium was $870 thousand for fiscal year 2019. The guaranteed premium will only increase in the event actual payroll amounts exceed the estimates provided to the insurance carrier. The amount of losses for the year will not impact the current year premium.
On January 1, 2014, the Authority began participating in an Incurred Retrospective program for workers compensation coverage. This program offered the Authority a maximum exposure for any one loss of $300 thousand and the Authority’s maximum annual premium was $1.8 million for fiscal year 2018. The Authority participated in a Loss Sensitive Rating Program through the Illinois Assigned Risk Pool from January 1, 2012 through December 31, 2013. Under both programs, individual claims are processed by an insurance carrier. The Authority is required to pay a premium based on estimated payroll amounts multiplied by the rates per classification code, as established in the contract between the Authority and the insurance carrier, adjusted for estimated losses. The insurance carrier is required to perform a one-time audit of the actual payroll amounts for each calendar year of coverage. The audited payroll amounts are used as the basis for determining the final premium amount. Additionally, the insurance carrier must provide an annual valuation of losses for four consecutive years. The results of the fourth valuation determine the final total incurred loss amount for each calendar year of coverage. The combination of the audited payroll amounts and the estimated value of losses represent the total estimated premium amount, up to the maximum premium amount.
Based on the actual payroll amounts through June 30, 2018 and the estimated payroll amounts for fiscal year 2019, plus estimated losses, the Authority established a reserve amount of $3.6 million as of June 30, 2019. Based on the actual payroll amounts through June 30, 2017 and the estimated payroll amounts for fiscal year 2018, plus estimated losses, the Authority established a reserve amount of $3.7 million as of June 30, 2018.
Prior to January 1, 2012, the Authority had a self-insurance program for workers’ compensation for individual claims up to $750 thousand and was fully insured for claims in excess of $750 thousand up to the State of Illinois statutory limit.
Currently, the Authority’s third-party administrator calculates the claims liabilities amount required for workers’ compensation claims outstanding prior to January 1, 2012. The liability and expenses are recognized when it is probable that a loss has occurred and the amount of the loss can be reasonably estimated.

- 47 -
Changes in the total claims liabilities related to individual workers’ compensation claims in the amount of $750 thousand or less during the past two years are as follows (in thousands of dollars):
2019 2018
Balance—beginning of year 2,457$ 2,678$ Claims and changes in estimates during year 144 797 Claims paid during year (268) (1,018)
Balance—end of year 2,333$ 2,457$
The combined workers’ compensation reserves are $5.9 million and $6.2 million as of June 30, 2019 and June 30, 2018, respectively.
11. RISKS AND UNCERTAINTIES
Investment securities, in general, are exposed to various risks, such as interest rate, credit, and overall market volatility. Due to the level of risk associated with certain investment securities, it is reasonably possible that changes in the values of investment securities will occur in the near term and such changes could affect the amounts reported in the basic financial statements.
12. COMMITMENTS AND CONTINGENCIES
In 1998, the Authority began operations at its 800-room convention center hotel, the Hyatt Regency McCormick Place hotel and entered into a management agreement with Hyatt Hotels Corporation to manage the daily operations of the hotel. This agreement was amended and restated effective July 1, 1999. The management agreement was for a period commencing with the opening of the Hotel and expired on June 30, 2009. On July 1, 2009, the Authority entered into a new agreement for 15 years expiring on June 30, 2024. This agreement was revised, June 4, 2013, to incorporate the additional 458-room tower. The Authority is required to reserve 4% of gross receipts of the Hyatt hotel, as defined by the management agreement, for replacement of and additions to furnishings and equipment. The balance in the reserve as of June 30, 2019 and 2018 was approximately $3.3 million and $1.0 million, respectively. During 2019, approximately $3.7 million was funded to this account based on Hotel gross receipts and approximately $1.4 million was expended for furnishings and equipment for the Hotel.
In April 2011, the Authority entered into a management agreement with SMG to promote, operate, manage, and maintain the McCormick Place complex. The management term began August 1, 2011, and ended June 30, 2016, with a five-year extension granted through June 30, 2021. Effective November 1, 2017, the Authority and SMG amended and restated the management agreement to allow SMG to focus its priorities on the management of events at McCormick Place and Wintrust Arena. In addition, effective November 1, 2017, the Authority assumed control of facility operations and all capital projects.
In April 2011, the Authority entered into a lease agreement with NPI. The lease agreement required NPI to establish a capital improvement account on or before the lease commencement date. The lease agreement also required the Authority to deposit a mutually agreed-upon amount into the account established by NPI for the sole and

- 48 -
exclusive benefit, and under the sole and exclusive control of NPI. Funds from this account may be used for the implementation of Approved Operations, including deferred maintenance and capital improvements, and for other rights of NPI as set forth in the lease agreement.
In October 2011, the Authority entered into an agreement with SAVOR to manage the McCormick Place Food Service operations. The Authority established a reserve of 10% of gross food service receipts primarily for the replacement of smallwares and equipment used in the food service operation. Under the previous agreement, the required reserve percentage was 7% through September 30, 2011. The funds can also be used for funding certain other foodservice related activities. The balance in the reserve account as of June 30, 2019 and 2018, was approximately $7.9 million and $7.4 million, respectively, and is included in restricted investments. Effective December 29, 2017, this agreement was amended and restated to revise the scope to include the new Wintrust Arena, with an expiration date of June 30, 2021.
On June 11, 2014, the Authority entered into a management agreement with Marriott International to manage the daily operations of the 1,205-room hotel branded Marriott Marquis Chicago Hotel, which officially opened September 10, 2017. The management agreement is for a period commencing with the opening of the hotel and will expire June 30, 2028. The Authority established a reserve of 4% of gross receipts to cover the cost of replacement of and additions to Furnishings and Equipment and Other Capital Expenditures. The balance in the reserve account as of June 30, 2019 and 2018 was approximately $6 million and $2 million, respectively. During 2019, approximately $4 million was funded to this account based upon Hotel gross receipts and approximately $31 thousand was expended for furnishings and equipment for the hotel. During the first year of the agreement, the Authority did not exercise its right to select a reduced Basic Fee in accordance with the Hotel Agreement; as a result, Marriott International paid the Authority $14 million. If for any reason the agreement terminates before the 10th anniversary of the opening date, the Authority will repay Marriott International the $14 million less $1.4 million for each full fiscal year that the agreement is in effect before termination. In accordance with GASB No. 33, Accounting and Financial Reporting for Nonexchange Transactions the Authority recognized $1.4 million in revenue related to the key money for the years ended June 30, 2019 and 2018 respectively. The remaining balance is held within other liabilities as deferred revenue, on the statements of net position.
On April 17, 2015, the Authority entered into an Anchor Tenant Agreement with DePaul University to acquire, develop, design, construct, own and operate a multi-purpose 10,387-seat events center for a term of 50 years. The agreement provides DePaul University, the anchor tenant, preferential scheduling rights, naming rights, and a right to participate in the future value of the property at the conclusion of the agreement. The Authority received $82.5 million from the anchor tenant for these rights in fiscal year 2016. The Authority deferred recognition of revenue associated with the granting of these rights initially and the amount was recorded to Other Liabilities in the statements of financial position. The Event Center was opened in October 2017. Beginning in fiscal year 2018, the Authority began recognition of the portion of the participation rights associated with naming rights, as those were estimable and partially earned. The Authority will continue recognition of these naming rights over a 50-year period, which is the term of the agreement. The term of the agreement shall end at the conclusion of the 50th contract year following the date of substantial completion of the project at which time the Authority will have a liability to the anchor tenant for 50% of the Event Center and the land.
- 49 -
In connection with the purchase of the Energy Center in September 2005, the Authority assumed certain long-term contracts from the Energy Center. In addition to supplying chilled water and steam for cooling and heating, respectively, for the McCormick Place campus, the Energy Center has six contracts to provide services to outside customers at the Lakeside Technology Center located adjacent to the Energy Center. Under five of the contracts, the Energy Center has commitments to provide chilled water services. Under two of the contracts, the Energy Center has commitments to provide hot water services. The rates for these services are based on actual usage and are defined in the contracts. Under one of these agreements, the Authority is obligated to pay a facilities space fee of approximately $124 thousand per year with a 3% annual increase.
The Authority has bond funds that are committed to be spent primarily for capital improvements in accordance with the underlying indentures. As of June 30, 2019, bond proceeds of $89.5 million remain to be spent.
The Authority has certain contingent liabilities resulting from litigation, claims, and commitments incident to the ordinary course of business. In addition, state grant programs are subject to audit and the potential disallowance of costs. Management expects that final resolution of any such contingencies will not have a material effect on the financial position of the Authority.
13. SUBSEQUENT EVENTS
Management has evaluated all subsequent events through November 5, 2019, which is the date the basic financial statements were available to be issued and concluded no additional subsequent events have occurred that would require recognition that have not already been recognized or that require disclosure that have not already been disclosed.
On August 13, 2019, Fitch Ratings revised the rating outlook on the Authority’s Expansion Project Bonds from negative to stable. As of August 13, 2019, the credit rating from Fitch Ratings on the Authority’s Expansion Project Bonds is BBB-/Stable.
* * * * * *

- 50 -
METROPOLITAN PIER AND EXPOSITION AUTHORITYRETIREMENT PLAN AND TRUST
SCHEDULE OF CHANGES IN NET PENSION LIABILITY AND RELATED RATIOSREQUIRED SUPPLEMENTARY INFORMATIONAS OF JUNE 30, 2019, 2018, 2017, 2016, AND 2015(Unaudited)
2019 2018 2017 2016 2015
Total pension liability: Service cost - $ - $ - $ - $ - $ Interest 6,073,360 5,973,660 5,896,144 5,798,514 5,763,944 Changes of benefit terms 845,366 Differences between expected and actual experience (492,777) 335,057 (77,914) (679,191) (570,338) Changes of assumptions 1,526,953 (264,626) Benefit payments (4,971,065) (4,797,820) (4,623,874) (4,516,085) (4,354,152)
Net change in total pension liability 2,136,471 1,510,897 1,194,356 1,448,604 574,828
Total pension liability—beginning 89,247,812 87,736,915 86,542,559 85,093,955 84,519,127
Total pension liability—ending (a) 91,384,283 89,247,812 87,736,915 86,542,559 85,093,955
Plan fiduciary net position: Contributions—employer 323,592 364,818 795,515 242,139 139,281 Net investment income 4,243,814 6,566,362 9,704,261 (441,044) 1,872,152 Benefit payments (4,971,065) (4,797,820) (4,623,874) (4,516,085) (4,354,152) Administrative expense (49,238) (51,247) (51,906) (82,569) (75,227) Other
Net change in plan fiduciary net position (452,897) 2,082,113 5,823,996 (4,797,559) (2,417,946)
Plan fiduciary net position—beginning 86,311,851 84,229,738 78,405,742 83,203,301 85,621,247
Plan fiduciary net position—ending (b) 85,858,954 86,311,851 84,229,738 78,405,742 83,203,301
Net pension liability (asset)—ending (a) - (b) 5,525,329$ 2,935,961$ 3,507,177$ 8,136,817$ 1,890,654$
Plan fiduciary net position as a percentage of the total pension liability 94.0 % 96.7 % 96.0 % 90.6 % 97.8 %
Covered-employee payroll 1,906,170$ 1,906,484$ 1,816,738$ 2,122,537$ 2,219,248$
Net pension liability as a percentage of covered-employees payroll 290.0 % 154.0 % 193.1 % 383.4 % 85.2 %
Changes of assumptions: In 2019, the mortality assumption was updated from the RP2000 Combined Healthy MortalityTable projected to 2014 with Scale BB to PubG-2010 Mortality Tables with Scale MP-2018.
Changes of benefit terms: In 2016, the Plan was amended to include salary increases in the accrued benefits of the SpecialSpecial Retirees. A salary scale of 5.00% was added to value the future salary increases for Special Retirees.
Changes of assumptions: In 2015, amounts reported as changes of assumptions resulted primarily from the following: 1. Retirement rates were updated to better reflect anticipated experience; 2. The mortality assumption was updated from the RP2000 Combined Healthy Mortality Table, projected to 2014 with Scale AA to the RP-2000 Combined Healthy Mortality Table, projected to 2015, 2016, 2017, 2018 and 2019 using Scale BB; 3. An explicit administrative assumption was added to more accurately reflect expenses being paid from the trust; 4. An explicit measurement of death benefits available for current active and terminated vested members was added to the liabilities.
* Note - 10 years will be presented when available.

- 51 -
METROPOLITAN PIER AND EXPOSITION AUTHORITYRETIREMENT PLAN AND TRUST
SCHEDULE OF CONTRIBUTIONSREQUIRED SUPPLEMENTARY INFORMATIONFOR THE YEARS ENDED JUNE 30, 2019, 2018, 2017, 2016, AND 2015(Unaudited)
2019 2018 2017 2016 2015
Actuarially determined contributions 315,914$ 360,517$ 784,142$ 238,112$ - $ Employer contribution in relation to actuarially determined contributions 323,592 364,818 795,515 242,139 139,281
Contribution deficiency (excess) (7,678) (4,301) (11,373) (4,027) (139,281)
Covered-employer payroll 1,906,170 1,906,484 1,816,738 2,122,537 2,219,248
Employer contribution as a percentage of covered-employee payroll 16.98 % 19.14 % 43.79 % 11.41 % (6.28)%
Notes to Schedule
Valuation date: July 1, 2018 July 1, 2017 July 1, 2016 July 1, 2015 July 1, 2014
Actuarially determined contribution rates are calculated as of July 1, of the year in which the contributions are reported.
Methods and assumptions used to determine contribution rates:
Funding method Entry age normalAmortization method Level dollarRemaining amortization period 20 years (as of 7/1/2019)Asset valuation method Fair market valueInflation 2.50% per yearCost of living increase 2.25% per yearSalary increases 5% salary scale assumption for Special Retirees in fiscal years 2018 and 2019, and 0% for all other
Active employees; assumed to cease their participation in the Plan as of February 12, 2012.Payroll growth NoneInterest rate 7.00% per year computed annually, net of investment
related expensesRetirement age 100% at age 65Termination rates NoneDisability rates NoneMortality Assumed life expectancies for 2019 are based on the PubG-2010 Mortality Tables with Scale MP-2018.
Assumed life expectancies for 2018 are based on the RP-2000 Combined Healthy Mortality Table projected to the valuation date based on Scale BB.
*Note - 10 Years will be presented when available.

INDEPENDENT AUDITORS’ REPORT ON INTERNAL CONTROL OVER FINANCIAL REPORTING AND ON COMPLIANCE AND OTHER MATTERS BASED ON AN AUDIT OF FINANCIAL STATEMENTS PERFORMED IN ACCORDANCE WITH GOVERNMENT AUDITING STANDARDS
To the Board of Directors of Metropolitan Pier and Exposition Authority:
We have audited, in accordance with the auditing standards generally accepted in the United States of America and the standards applicable to financial audits contained in Government Auditing Standards, issued by the Comptroller General of the United States, the financial statements of the business-type activities and fiduciary activities of the Metropolitan Pier and Exposition Authority (the “Authority”) as of and for the year ended June 30, 2018, and the related notes to the financial statements, which collectively comprise the Authority’s basic financial statements, and have issued our report thereon dated November 5, 2019. Our report includes a reference to other auditors who audited the financial statements of the Metropolitan Pier and Exposition Authority Retirement Plan (the “Plan”), as described in our report on the Authority’s financial statements. The financial statements of the Plan were not audited in accordance with Government Auditing Standards.
Internal Control over Financial Reporting
In planning and performing our audit of the financial statements, we considered the Authority’s internal control over financial reporting (internal control) to determine the audit procedures that are appropriate in the circumstances for the purpose of expressing our opinions on the financial statements, but not for the purpose of expressing an opinion on the effectiveness of the Authority’s internal control. Accordingly, we do not express an opinion on the effectiveness of the Authority’s internal control.
A deficiency in internal control exists when the design or operation of a control does not allow management or employees, in the normal course of performing their assigned functions, to prevent, or detect and correct, misstatements on a timely basis. A material weakness is a deficiency, or combination of deficiencies, in internal control, such that there is a reasonable possibility that a material misstatement of the entity’s financial statements will not be prevented, or detected and corrected, on a timely basis. A significant deficiency is a deficiency, or a combination of deficiencies, in internal control that is less severe than a material weakness, yet important enough to merit attention by those charged with governance.
Our consideration of internal control was for the limited purpose described in the first paragraph of this section and was not designed to identify all deficiencies in internal control that might be material weaknesses or significant deficiencies. Given these limitations, during our audit we did not identify any deficiencies in internal control that we consider to be material weaknesses. However, material weaknesses may exist that have not been identified.
- 53 -
Compliance and Other Matters
As part of obtaining reasonable assurance about whether the Authority’s financial statements are free from material misstatement, we performed tests of its compliance with certain provisions of laws, regulations, contracts, and grant agreements, noncompliance with which could have a direct and material effect on the determination of financial statement amounts. However, providing an opinion on compliance with those provisions was not an objective of our audit, and accordingly, we do not express such an opinion. The results of our tests disclosed no instances of noncompliance or other matters that are required to be reported under Government Auditing Standards.
Purpose of this Report
The purpose of this report is solely to describe the scope of our testing of internal control and compliance and the results of that testing, and not to provide an opinion on the effectiveness of the Authority’s internal control or on compliance. This report is an integral part of an audit performed in accordance with Government Auditing Standards in considering the Authority’s internal control and compliance. Accordingly, this communication is not suitable for any other purpose.
November 5, 2019