Metropolitan Airport Authority of Rock Island County...
86
Metropolitan Airport Authority of Rock Island County, Illinois and Combined Affiliate Comprehensive Annual Financial Report For the Fiscal Year Ended June 30, 2012 Prepared by: Finance Department
Transcript of Metropolitan Airport Authority of Rock Island County...

Metropolitan Airport Authority ofRock Island County, Illinois andCombined Affiliate
Comprehensive AnnualFinancial Report
For the Fiscal Year Ended June 30, 2012
Prepared by:Finance Department


Contents
Introductory Section (unaudited)
Table of contentsLetter of transmittalOrganizational chartList of appointed officialsGFOA certificate
iii-v
vivii
viii
Financial Section
Independent auditor's reportManagement's discussion and analysisFinancial statements:
Combined statements of net assetsCombined statements of revenues, expenses and changes in net assetsCombined statements of cash flowsNotes to basic combined financial statements
Required supplementary information:Illinois Municipal Retirement PlanMetropolitan Airport Authority Health Benefit Plan
Supplementary information:Combining schedule of net assetsCombining schedule of revenues, expenses and changes in net assetsSchedule of other expenses
1-23 - 11
12 - 1314
15 - 1617 - 36
3738
39 -404142
Statistical Section (unaudited)
Statistical section contentsNet assets and changes in net assetsPrincipal revenue sources and revenues per enplaned passengerChanges in cash and cash equivalentsRevenue ratesRatios of outstanding debt, debt service and debt limitsPledged revenue coveragePopulation in the air trade areaPrincipal employersAuthority and combined affiliate employeesEnplaned passengersTakeoff and landing operations summaryTakeoff and landing operations by airline or cargo carrierAirline landed weightsPrimary origin and destination passenger marketsCapital asset information
4344 -4546 -4748 -4950 - 5152 - 5354 - 5556 - 57
5859 -6061 - 62
6364 -6566 -67
6869


METROPOLITAN AIRPORT AUTHORITY
OF ROCK ISLAND COUNTY, ILLINOISQUAD CITY INT'L AIRPORTP.O. BOX 9009MOLINE, IL 61265-9009309-764-9621(309) 757-1515 FAX
December 4, 2012
Commissioners, Citizens of Rock Island County and Other Interested Parties:
State law requires that every general purpose local government publish within six months of the close ofeach fiscal year a complete set of audited financial statements. This report is published to fulfill thatrequirement for the fiscal year ended June 30, 2012.
Management assumes full responsibility for the completeness and reliability of the information containedin this report, based upon a comprehensive framework of internal control that it has established for thispurpose. Because the cost of internal control should not exceed anticipated benefits, the objective is toprovide reasonable, rather than absolute, assurance that the financial statements are free of any materialmisstatements.
McGladrey LLP, Certified Public Accountants, have issued an unqualified ("clean") opinion on theMetropolitan Airport Authority of Rock Island County, Illinois' (Authority) financial statements for the yearended June 30, 2012. The independent auditor's report is located at the front of the financial section ofthis report.
Management's discussion and analysis (MD&A) immediately follows the independent auditor's report andprovides a narrative introduction, overview and analysis of the basic financial statements. MD&Acomplements this letter of transmittal and should be read in conjunction with it.
Profile of Government
In 1910, a Rock River valley pasture, known as Franing Field, was selected for the first coast-to-coastflight by army planes. Three men leased 30 acres in this pasture and it officially became an airport. One-year later real estate had increased to 200 acres. In 1926, regular airmail service began. Operations wereexpanded in 1927 when Boeing Air Transport began flying between Chicago and San Francisco. Laterthat year, Boeing Air Transport, Valley Air Transport, Pacific Air Transport, and National merged to formUnited Airlines which provided passenger and mail service to the east and west coasts as well as to thesouthwestern United States.
In 1935, the City of Moline, Illinois, took over the Airport as a municipal, tax supported airport. The secondlargest Work Projects Administration project in Illinois was underway at a cost to Moline of $165,000 and$365,000 to the federal government. A new terminal and hangar were built in 1939 with five scheduled aircarrier flights per day and 24 private aircraft based on airport property. Rock Island County citizens votedin 1947 to buy the Airport creating the Metropolitan Airport Authority of Rock Island County, Illinois, as itsowner and under the jurisdiction of the state of Illinois. Currently, seven townships in Rock Island Countyprovide financial support to the Airport. They include Hampton, Moline, South Moline, Rock Island, SouthRock Island, Blackhawk and Coal Valley. The mayors of Moline, Milan, East Moline, Rock Island, andSilvis each appoint one commissioner to the Authority's board, and the Chair of the Rock Island CountyBoard aoooints three more with the consent of the Board.
ii

Ozark Air Lines began service at the Airport in 1950. In 1954, a terminal building was built to providespace for United and Ozark Airlines, as well as limousine service, car rentals, the Civil AeronauticsAdministration, and the U. S. Weather Bureau. In March 1985, a new terminal, parking lot and roadwaysystem were completed. Major improvements have been made since that time to the terminal and otherpublic space, most notably a capital project expanding the terminal and concourses to nearly 160,000square feet in 2001 and redesign of the public parking lot to accommodate over 2,000 vehicles in both1999 and 2009 in anticipation of increased utilization of the state-of-the-art facility.
Many customer service elements have continued to be added in recent years, providing furtherconveniences for today's traveler. The Authority has contracted for customer care services and curbside(skycap) assistance. Wheelchair and electric golf cart services, as well as skycap services assist travelersof all ages as needed for arriving and departing flights. Technological advances with the airport's websiteand complimentary wi-fi connectivity in the terminal add to the conveniences for the business traveler.
The Metropolitan Airport Authority owns and operates over $100 million in assets on the more than 2,000-acre campus. Some of those assets include a four-bay public safety building, impressive airfieldmaintenance facility, and other structures that serve a variety of needs on Airport property. An air freightcomplex opened in 1992. Additionally, various hangars for private and corporate aircraft along with anindustrial park complement the landscape on the south side of the property. The longest runway extendsjust over 10,000 feet, and improvement projects are continuously underway to further enhance safety andefficiency for aircraft at the Quad City International Airport. Federal and state dollars are used to supportmost projects that are related to the airfield.
Local Economy
The Quad Cities metropolitan area is located along the Mississippi River in eastern Iowa and westernIllinois, approximately 165 miles west of Chicago and midway between Minneapolis to the north and St.Louis to the south. The Quad City region has a population of approximately 422,000. The following arethe top 10 employers in the area:
Company Employees Type of Business
Rock Island Arsenal
Deere & Company
Genesis Health System
Trinity Regional Health System
Tyson Fresh MeatsAlcoa, Inc.
Hy-Vee Food Stores
Kraft Foods/Oscar Mayer
XPACWal-Marl Super Centers
8,500
7,300
4,900
2,9002,400
2,250
1,622
1,500
1,195
1,066
Defense Manufacturing
Agiculture OEM
Health Care System
Health Care System
Food ProcesssingAerospace & Defense Aluminum
Supermarket and Other Grocery
Food Processsing
Supply Chain Management Logistics
Warehouse Clubs and Supercenters
The area boasts a healthy variety of tourism and recreational opportunities including hiking & biking trails,dozens of area golf and disc golf courses, ice skating and sporting facilities, arts and cultural festivals andevents and much more-all along the banks of the Mighty Mississippi River.
Long- Term Financial Planning
Federal and state funding for capital improvements is extremely important to the Authority. Airfield work islargely paid for by federal funds. Historically for the Airport, 95 percent of the costs of these projects hascome from federal sources. Due to budget cuts by Congress, the federal percentage of AirportImprovement Project costs for the Airport dropped to 90 percent for grants awarded in 2012. Passengerfacility charge (PFC) dollars also playa large role in funding airfield construction and purchasingequipment essential to the airfield and terminal.
iii
The Authority issued over $24 million in bonds, mostly secured by PFC revenue, on July 1, 2010. Thismoney refinanced existing PFC debt and was used to purchase snow removal equipment in 2011 andround out the funding of the airfield rehabilitation project of Runway 9/27 in 2011 and 2012. The proceedswill also be used to purchase five new loading bridges in fiscal year 2013.
For an Airport Authority, passengers drive discretionary revenue. Dollars spent by passengers on parking,eating and shopping is money available to the Authority for special projects and building cash reserves.Those reserves are earmarked for debt service and special projects outlined in the Major Initiativessection. Fiscal year 2012 brought in 409,795 passengers to the Quad City International Airport. This wasabout an 11 percent decrease over fiscal year 2011.
Passengers cannot patronize an airport without air service, so the Authority Board has included in itsstrategic plan a commitment to control costs that it passes on to its tenants. The Board has opted tosubsidize airline landing fees to remain price competitive with other airports in the area. In addition, it is agoal of the Authority to provide services to its airlines such as fueling and ground handling, at a moreaffordable rate than they can do it themselves or purchase from a third party vendor. The Board hasestablished certain levels of cash reserves for this purpose.
Relevant Financial Policies
The Federal Aviation Administration (FAA) disallows certain revenue generated by the Airport to be usedfor certain marketing incentives for airlines. This topic has gained the spotlight as many airlines needfinancial assistance. The Metropolitan Airport Authority is committed to the FAA regulations and their owninternal policy of not discriminating in the incentives offered to airlines, offering only incentives that helpdefray costs of the airlines and not issuing any type of revenue guarantees, and also financing thoseincentive packages with the appropriate revenue stream.
Major Initiatives
The Airport is currently working on a number of large capital projects. The runway 9/27 rehabilitationproject was completed mid-October 2011 , which improved the existing runways and reconstructed themidfield. A temporary runway -10/28 had been constructed and completed to be used during thereconstruction of runway 9/27. With runway 9/27 being complete, conversion of runway 10/28 into ataxiway began in fiscal year 2012. All associated lighting and painting on the temporary runway is beingaltered accordingly. This new taxiway (P for Papa) will allow aircraft from the General Aviation side of theairport to taxi to a main runway without having to cross an active runway. This is a major safetyenhancement.
Construction for the replacement of the Authority's aged fuel farm was completed in January 2012. Theend result of the fuel farm replacement included three 50,000-galion tanks for jet fuel, as well as threetanks for de-icing fluid for the airlines to use for storage and to fill their de-icing trucks. Also associatedwith the fuel farm project was the complete remodeling of a historic building called the "pump house" tobecome a support facility for the fuel farm. Lastly, the fuel farm access road was repaved with asphalt inJune of 2012.
The first phase of improving the rental car facilities was substantially completed in January 2011 byexpanding and repaving the rental car ready return lot. Phase two of the expansion includes theconstruction of a quick turn-around facility for fueling, washing and servicing rental cars. This work will bepaid for with Customer Facility Charge revenue. Construction on phase two is anticipated to begin in thespring/summer of 2013.
The Authority plans to expand its airfield maintenance building for storing snow removal equipment. Theaddition to the 32,000-square foot building will allow the airport to house all of its snow removalequipment under one roof and operate more efficiently. In Phase 1, an additional 14,000 square feet willbe added, and in Phase 2, another 10,000 square feet will be added. The Authority was awarded a $2.88million grant in September 2012 that will pay for 90 percent of the cost of expanding the building for bothphases 1 and 2. Site work is expected to cost around $1.3 million, bringing the total cost of the project to$5 to $5.2 million. The Authority expects to receive an additional grant that will pay for 90 percent of thesite work. The expansion is expected to begin in the fall of 2012, with the project lasting about a year.
iv

The Authority also started plans to convert a vacant airport-owned cargo building into a new FederalInspection Services Facility, which is needed to meet demand for the clearance of international cargo,passengers and flight crews. The estimated $2.8 million project will relocate the U.S. Customs and BorderProtection into the airport's Cargo Building No.3. It now operates out of the Civil Air Patrol building eastof the main terminal building on the airport. New federal requirements are forcing the Airport to relocatethe existing customs facility to accommodate more passengers and new technology. Construction on thisproject will begin in the fall of 2012 and will be completed in 2013. The Authority was awarded a $1.8million dollar grant in September of 2012 for this project.
An updated airport master plan is currently underway. The master plan is a comprehensive study of anairport that documents the short, medium, and long-term development plans needed to meet futureaviation demand. The overall goal of a master plan is to provide the framework needed to guide futureairport development that will cost-effectively satisfy aviation demand, while considering potentialenvironmental and socioeconomic impacts.
Economic development on airport land continues to be a focus for the Authority to increase non-aeronautical revenue through ground and building rents.
Economic development on airport land continues to be a focus for the Authority to increasenonaeronautical revenue through ground and building rents. Subsequent to year-end, the Authorityentered into a ground lease for a new hotel to be built on Airport land pending satisfaction of certaincontingencies, which would generate additional revenue through rents for the Authority. More informationcan be found in Note 13 to the basic financial statements.
Awards and Acknowledgements
The Government Finance Officers Association (GFOA) last awarded a Certificate of Achievement forExcellence in Financial Reporting to the Metropolitan Airport Authority for its comprehensive annualfinancial report (CAFR) for its fiscal year ended June 30, 2011. In order to be awarded a Certificate ofAchievement, the government had to publish an easily readable and efficiently organized CAFR thatsatisfied both accounting principles generally accepted in the United States of America and applicablelegal requirements.
A Certificate of Achievement is valid for a period of one year only. We believe that our current CAFRagain meets the Certificate of Achievement Program's requirements and we are submitting it to the GFOAto determine its eligibility for another certificate.
The preparation of this report would not have been possible without the efficient and dedicated service ofthe entire staff of the finance and administration department. We wish to express our appreciation to allmembers of the department who assisted and contributed to the preparation of this report. Credit alsomust be given to the Chair and Commissioners of the Authority Board for their unfailing support formaintaining the highest standards of professionalism in the management of the Authority's finances.
Respectfully submitted,
Bruce E.Carter, AAE.Director of Aviation
Angela M. Burch, CPAFinance Manager
v
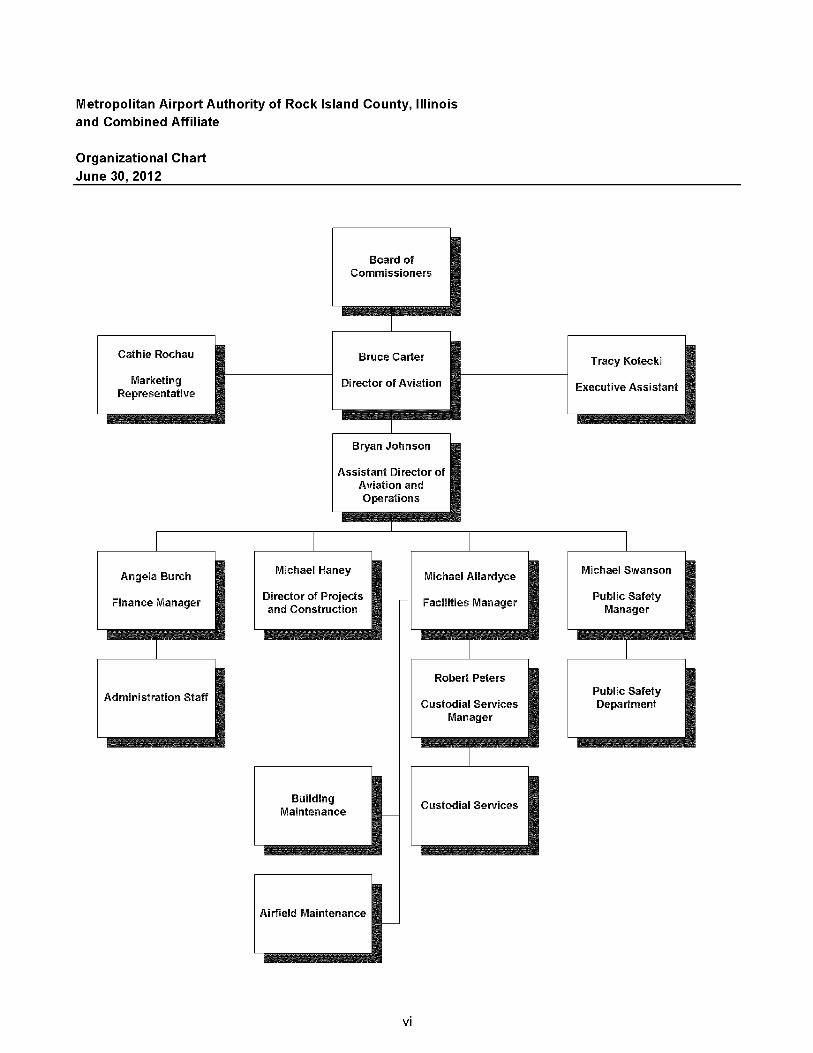
Metropolitan Airport Authority of Rock Island County, Illinoisand Combined Affiliate
Organizational ChartJune 30, 2012
Board ofCommissioners
I
Cathie Roehau Bruce Carter Tracy Kotecki
Marketing Director of Aviation Executive AssistantRepresentative
IBryan Johnson
Assistant Director ofAviation andOperations
I I I I
Angela Burch Michael Haney Michael Allardyce Michael Swanson
Finance Manager Director of Projects - Facilities Manager Public Safetyand Construction Manager
I I I
Robert Peters
Administration Staff Public SafetyCustodial Services Department
Manager
I
Building Custodial ServicesMaintenance -
Airfield Maintenance-
vi

Metropolitan Airport Authority of Rock Island County, Illinoisand Combined Affiliate
List of Appointed OfficialsJune 30, 2012
Board of Commissioners
Carl Robinson, Chairman
James Jannes, Vice Chairman
Molly Foley, Secretary
Andrew Gianulis, Treasurer
James Davies, Commissioner
Robert Leibovitz, Commissioner
Donald Margenthaler, Commissioner
Richard Work, Commissioner
vii

Certificate ofAchievementfor Excellencein FinancialReporting
Presented to
Metropolitan Airport Authorityof Rock Island County
IllinoisFor its Comprehensive Annual
Financial Reportfor the Fiscal Year Ended
June 30, 2011
A Certificate of Achievement for Excellence in FinancialReporting is presented by the Government Finance Officers
Association of the United States and Canada togovernment units and public employee retirementsystems whose comprehensive annual financial
reports (CAFRs) achieve the higheststandards in government accounting
and financial reporting.
_e.President
Executive Director
viii

McGladrey LLP
II McGladreyIndependent Auditor's Report
To the Board of CommissionersMetropolitan Airport Authorityof Rock Island County, Illinoisand Combined AffiliateMoline, Illinois
We have audited the accompanying basic financial statements of the Metropolitan Airport Authority ofRock Island County, Illinois and Combined Affiliate (Authority), as of and for the years ended June 30,2012 and 2011, as listed in the table of contents. These financial statements are the responsibility of theAuthority's management. Our responsibility is to express an opinion on these financial statements basedon our audits.
We conducted our audits in accordance with auditing standards generally accepted in the United Statesof America and the standards applicable to financial audits contained in Government Auditing Standards,issued by the Comptroller General of the United States. Those standards require that we plan andperform the audit to obtain reasonable assurance about whether the financial statements are free ofmaterial misstatement. An audit includes consideration of internal control over financial reporting as abasis for designing audit procedures that are appropriate in the circumstances, but not for the purpose ofexpressing an opinion on the effectiveness of the Authority's internal control over financial reporting.Accordingly, we express no such opinion. An audit includes examining, on a test basis, evidencesupporting the amounts and disclosures in the financial statements. An audit also includes assessing theaccounting principles used and significant estimates made by management, as well as evaluating theoverall financial statement presentation. We believe that our audits provide a reasonable basis for ouropinions.
In our opinion, the basic financial statements referred to above present fairly, in all material respects, thefinancial position of the Metropolitan Airport Authority of Rock Island County, Illinois and CombinedAffiliate, as of June 30, 2012 and 2011, and the respective changes in financial position and its cash flowsfor the years then ended in conformity with accounting principles generally accepted in the United Statesof America.
In accordance with Government Auditing Standards for the years ended June 30, 2012 and 2011, wehave also issued our report dated December 4, 2012 and November 11, 2011, respectively, on ourconsideration of the Authority's internal control over financial reporting and our tests of its compliance withcertain provisions of laws, regulations, contracts and grant agreements, and other matters. The purposeof those reports is to describe the scope of our testing of internal control over financial reporting andcompliance and the results of that testing, and not to provide an opinion on the internal control overfinancial reporting or on compliance. Those reports are an integral part of an audit performed inaccordance with Government Auditing Standards and should be considered in assessing the results ofour audits.
Accounting principles generally accepted in the United States of America require that the Management'sDiscussion and Analysis, Illinois Municipal Retirement Plan and Metropolitan Airport Authority HealthBenefit Plan on pages 3 through 11, 37 and 38, respectively, be presented to supplement the basicfinancial statements. Such information, although not a part of the basic financial statements, is requiredby Governmental Accounting Standards Board who considers it to be an essential part of financialreporting for placing the basic financial statements in an appropriate operational, economic, or historicalcontext. We have applied certain limited procedures to the required supplementary information inaccordance with auditing standards generally accepted in the United States of America, which consistedof inquiries of management about the methods of preparing the information and comparing theinformation for consistency with management's responses to our inquiries, the basic financial statements,and other knowledge we obtained during our audit of the basic financial statements. We do not expressan opinion or provide any assurance on the information because the limited procedures do not provide uswith sufficient evidence to express an opinion or provide any assurance.
Our audit was conducted for the purpose of forming opinions on the financial statements that collectivelycomprise the District's basic financial statements. The combining statements and schedule of otherexpenses, listed in the table of contents as supplementary information, are presented for purposes ofadditional analysis and are not a required part of the basic financial statements. Such information is theresponsibility of management and was derived from and relates directly to the underlying accounting andother records used to prepare the financial statements. The information has been subjected to theauditing procedures applied in the audit of the basic financial statements and certain additionalprocedures, including comparing and reconciling such information directly to the underlying accountingand other records used to prepare the financial statements or to the financial statements themselves, andother additional procedures in accordance with auditing standards generally accepted in the UnitedStates of America. In our opinion, the information is fairly stated in all material respects in relation to thefinancial statements as a whole.
Our audit was conducted for the purpose of forming opinions on the financial statements that collectivelycomprise the District's basic financial statements. The accompanying introductory and statistical sections,as listed in the table of contents, are presented for purposes of additional analysis and are not a requiredpart of the basic financial statements. Such information has not been subjected to the auditing proceduresapplied in the audit of the basic financial statements, and accordingly, we do not express an opinion on orprovide assurance on it.
Davenport, IowaDecember 4, 2012
2

Metropolitan Airport Authority of Rock Island County, Illinoisand Combined Affiliate
Management's Discussion and AnalysisYear Ended June 30, 2012
This Management's Discussion and Analysis (MD&A) of the Metropolitan Airport Authority of Rock IslandCounty, Illinois and Combined Affiliate (Authority) provides the reader with a narrative overview of theAuthority's financial statements and activities for the fiscal year ended June 30, 2012. Metropolitan AirportAuthority operates the Quad City International Airport in Moline, Illinois and QCIA Airport Services, LLC.
Overview of the Financial Statements
The basic combined financial statements are designed to provide readers with a broad overview of theAuthority's finances in a manner similar to a private-sector business. The basic combined financialstatements are prepared using proprietary fund (enterprise fund) accounting that uses the same basis ofaccounting as private-sector business enterprises. Under this method of accounting, an economicresources measurement focus and an accrual basis of accounting are used. Revenues are recordedwhen earned; expenses are recorded when incurred. For comparable purposes, each statementsummary in the MD&A includes fiscal year ended June 30, 2010, amounts also. The basic combinedfinancial statements include the accounts of the following entities:
• Metropolitan Airport Authority, which provides an airline terminal, runways and other aeronauticalfacilities in Moline, Illinois, for passenger and freight airlines and private aircraft.
• QCIA Airport Services, LLC, which provides fueling and ground handling services to commercialand charter airlines. The Authority is the sole member of this entity.
The basic financial statements include a combined statement of net assets, a combined statement ofrevenues, expenses and changes in net assets, and a combined statement of cash flows. These arefollowed by notes to basic financial statements. In addition to the basic combined financial statements,this report also contains supplementary information.
The combined statement of net assets presents information on all of the Authority's assets and liabilities,with the difference between the two reported as net assets. Over time, increases or decreases in netassets may serve as a useful indicator of whether the financial position of the Authority is improving ordeteriorating. The combined statement of revenues, expenses and changes in net assets reports theoperating revenues and expenses and nonoperating revenues and expenses of the Authority for the fiscalyear with the difference being the change in net assets for the fiscal year. The combined statement ofcash flows reports cash and cash equivalents for the fiscal year resulting from operating activities,noncapital financing activities, capital and related financing activities, and investing activities.
The basic financial statements include only the Metropolitan Airport Authority of Rock Island County,Illinois, and the QCIA Airport Services, LLC. There are no other organizations or agencies whose financialstatements should be combined and presented with the financial statements.
Financial Highlights
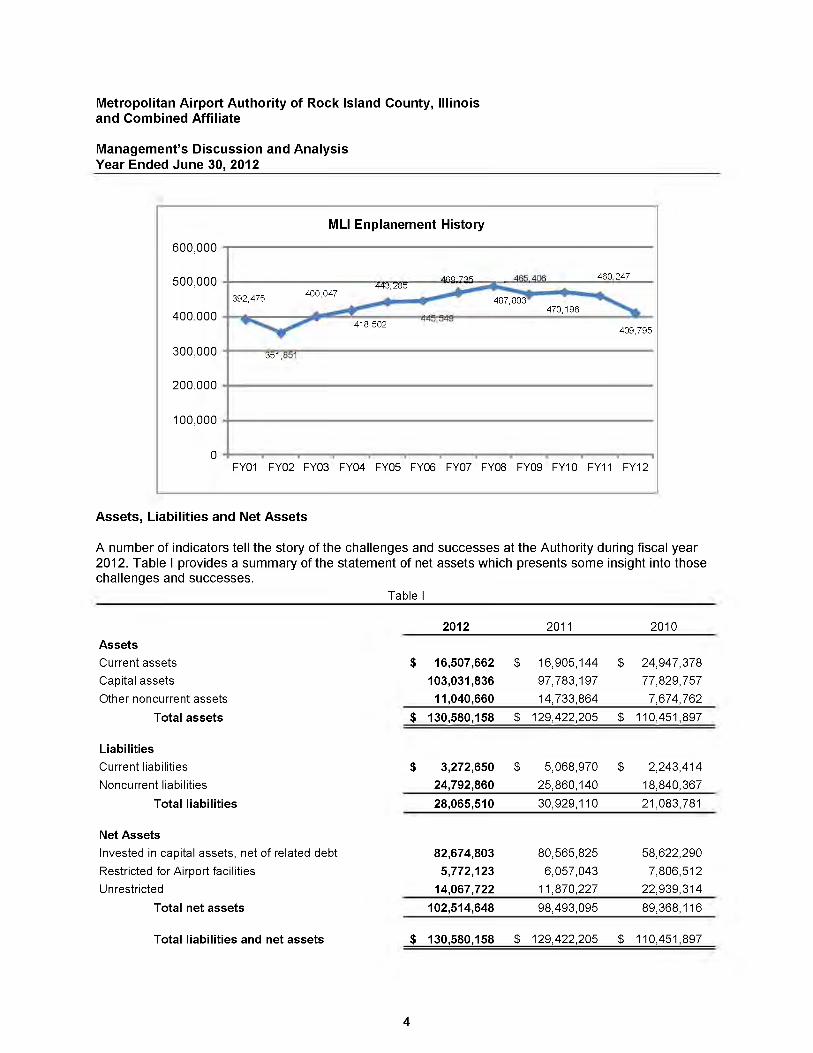
• In fiscal year 2012, total enplanements (see following chart) were 409,795 compared to 460,247 inthe prior year and 470,196 in fiscal year 201 O. QCIA enplanements decreased by approximately11 percent in the current year.
• Net assets increased $4,021,553 in fiscal year 2012, $9,124,979 in fiscal year 2011 and$3,611,945 in fiscal year 2010.
3
Metropolitan Airport Authority of Rock Island County, Illinoisand Combined Affiliate
Management's Discussion and AnalysisYear Ended June 30, 2012
MLI Enplanement History
600,000
500,000 A"n 7~" .oR".oM 460,2474'13';'"LlK,
392,475 400,047 ~487,803""-
~400,000 .-.- 470,196
~418,502 409,795
300,000 jc.1,i:!c.1
200,000
100,000
0 .FY01 FY02 FY03 FY04 FY05 FY06 FY07 FY08 FY09 FY10 FY11 FY12
Assets, Liabilities and Net Assets
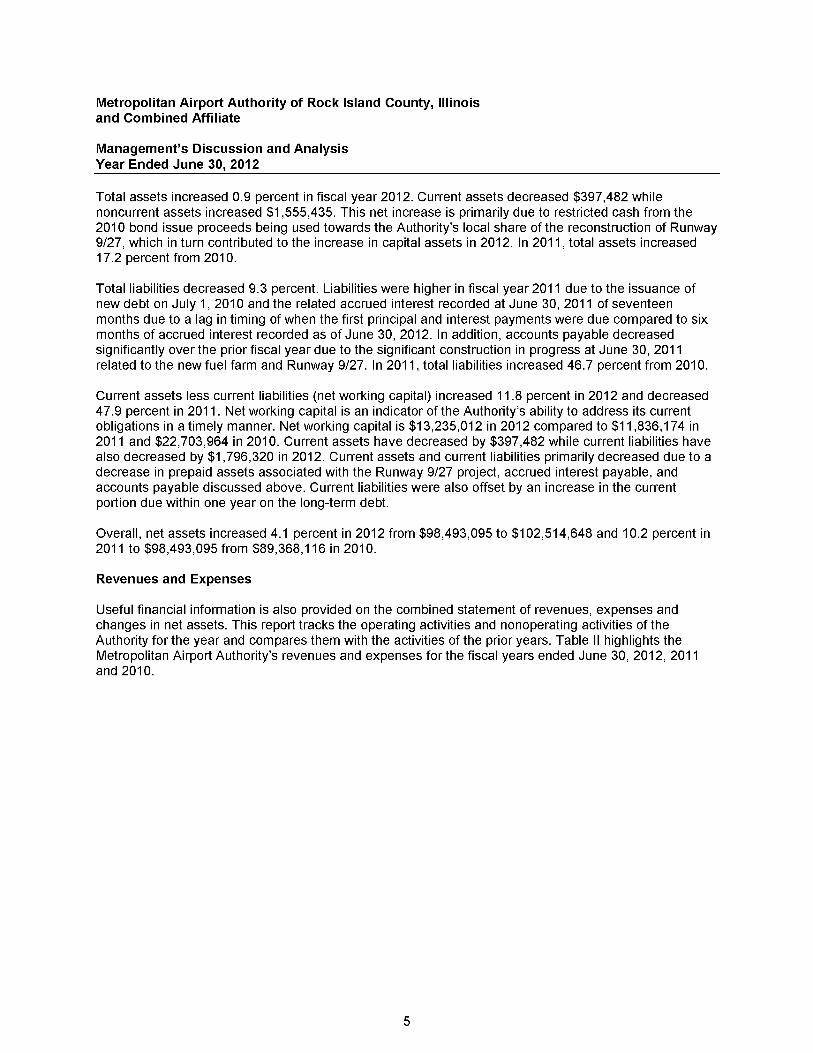
A number of indicators tell the story of the challenges and successes at the Authority during fiscal year2012. Table I provides a summary of the statement of net assets which presents some insight into thosechallenges and successes.
Table I
2012 2011 2010
Assets
Current assets $ 16,507,662 $ 16,905,144 $ 24,947,378
Capital assets 103,031,836 97,783,197 77,829,757
Other noncurrent assets 11,040,660 14,733,864 7,674,762
Total assets $ 130,580,158 $ 129,422,205 $ 110,451,897
Liabilities
Current liabilities $ 3,272,650 $ 5,068,970 $ 2,243,414
Noncurrent liabilities 24,792,860 25,860,140 18,840,367
Total liabilities 28,065,510 30,929,110 21,083,781
Net Assets
Invested in capital assets, net of related debt 82,674,803 80,565,825 58,622,290
Restricted for Airport facilities 5,772,123 6,057,043 7,806,512Unrestricted 14,067,722 11,870,227 22,939,314
Total net assets 102,514,648 98,493,095 89,368,116
Total liabilities and net assets $ 130,580,158 $ 129,422,205 $ 110,451,897
4
Metropolitan Airport Authority of Rock Island County, Illinoisand Combined Affiliate
Management's Discussion and AnalysisYear Ended June 30, 2012
Total assets increased 0.9 percent in fiscal year 2012. Current assets decreased $397,482 whilenoncurrent assets increased $1,555,435. This net increase is primarily due to restricted cash from the2010 bond issue proceeds being used towards the Authority's local share of the reconstruction of Runway9/27, which in turn contributed to the increase in capital assets in 2012. In 2011, total assets increased17.2 percent from 2010.
Total liabilities decreased 9.3 percent. Liabilities were higher in fiscal year 2011 due to the issuance ofnew debt on July 1, 2010 and the related accrued interest recorded at June 30, 2011 of seventeenmonths due to a lag in timing of when the first principal and interest payments were due compared to sixmonths of accrued interest recorded as of June 30, 2012. In addition, accounts payable decreasedsignificantly over the prior fiscal year due to the significant construction in progress at June 30, 2011related to the new fuel farm and Runway 9/27. In 2011, total liabilities increased 46.7 percent from 2010.
Current assets less current liabilities (net working capital) increased 11.8 percent in 2012 and decreased47.9 percent in 2011. Net working capital is an indicator of the Authority's ability to address its currentobligations in a timely manner. Net working capital is $13,235,012 in 2012 compared to $11,836,174 in2011 and $22,703,964 in 2010. Current assets have decreased by $397,482 while current liabilities havealso decreased by $1,796,320 in 2012. Current assets and current liabilities primarily decreased due to adecrease in prepaid assets associated with the Runway 9/27 project, accrued interest payable, andaccounts payable discussed above. Current liabilities were also offset by an increase in the currentportion due within one year on the long-term debt.
Overall, net assets increased 4.1 percent in 2012 from $98,493,095 to $102,514,648 and 10.2 percent in2011 to $98,493,095 from $89,368,116 in 2010.
Revenues and Expenses
Useful financial information is also provided on the combined statement of revenues, expenses andchanges in net assets. This report tracks the operating activities and nonoperating activities of theAuthority for the year and compares them with the activities of the prior years. Table II highlights theMetropolitan Airport Authority's revenues and expenses for the fiscal years ended June 30, 2012, 2011and 2010.
5

Metropolitan Airport Authority of Rock Island County, Illinoisand Combined Affiliate
Management's Discussion and AnalysisYear Ended June 30, 2012
Table II
2012 2011 2010
Operating revenues:
Airline terminal complex $ 3,478,811 $ 3,393,842 $ 3,174,951
Parking Lot 3,069,292 3,448,567 3,510,087
Aeronautical facilities 2,353,753 2,376,218 2,205,800
Other operating, including general aviation and
commercial/i ndustrial 1,347,993 1,329,759 1,275,814
Fueling and groundhandling services 1,074,718 1,063,757 1,069,646
Total operating revenues 11,324,567 11,612,143 11,236,298
Operating expenses:
Salaries and benefits 4,089,233 4,171,749 4,042,384
Depreciation 7,664,169 6,156,054 5,699,578
Other operating expenses 6,074,098 6,450,444 6,049,846
Total operating expenses 17,827,500 16,778,247 15,791,808
Nonoperating revenues (expenses):
Passenger and Customer facility charges 2,382,782 2,542,103 2,591,043
Taxes 1,760,839 1,737,126 1,641,403
Other nonoperating income, including gain on
disposal of assets 59,253 184,462 292,235
Loss on disposal of capital assets (333,018)Interest expense (988,227) (836,598) (862,315)
Other nonoperating expenses (6,843) (198,897) (29,487)
Total nonoperating revenues 2,874,786 3,428,196 3,632,879
(Loss) before capital contributions (3,628,147) (1,737,908) (922,631)
Capital contributions 7,649,700 10,862,887 4,534,576
Change in net assets 4,021,553 9,124,979 3,611,945
Net assets, beginning 98,493,095 89,368,116 85,756,171
Net assets, ending $ 102,514,648 $ 98,493,095 $ 89,368,116
Airline terminal complex revenue includes reimbursements from airlines for their common and exclusivespace in the facility. The airline use agreements specify which Airport expenses are reimbursable andthose reimbursements are recorded as revenue. Changes in terminal expenses affect the airline terminalcomplex revenue. Total revenues in 2012 are $23,177,141 compared to $26,938,721 and $20,295,555 in2011 and 2010, respectively.
6

Metropolitan Airport Authority of Rock Island County, Illinoisand Combined Affiliate
Management's Discussion and AnalysisYear Ended June 30, 2012
Eighty-seven percent of the terminal space (136,161 out of 157,652 square feet) is known as rentablespace. A portion of rentable space known as common space (54,958 square feet) is composed of thebaggage claim area, connector area between the terminal and security screening checkpoint, andConcourses A and B and is charged to the airlines for reimbursement of costs.
500,000
• Other Sources
Terminal Rate Base Costs to be Reimbursed
3,500,000
3,000,000
2,500,000
2,000,000
1,500,000 _Airline Portion
1,000,000
2003 2004 2005 2006 2007 2008 2009 2010 2011 2012
This cost breaks down to $23.26 per square foot 10 years ago when the airline portion of common spacereimbursable costs totaled $1,287,353 to $23.10 in 2012 when the airline portion amounted to$1,269,530, a decrease of 1.4 percent in airline liability since 2003. The cost per square foot was $22.17in fiscal year 2011. In fiscal year 2012 and 2011, the Authority had actually billed $24.98 and $25.00,respectively, per square foot to the airlines compared to the $23.10 and $22.17, respectively calculated atthe end of each year. The amount owed back to the airlines in each year was used to offset theAuthority's subsidy in landing fees for 2012 and 2011.
The QCIA Airport Services, LLC had fiscal year 2012 operating revenues of $1 ,401 ,794 compared tooperating expenses of $1,584,956. The operating loss of $183,162 combined with nonoperating incomeof $31 resulted in a loss of $183,131 on an unconsolidated basis prior to a capital contribution subsidyfrom the Metropolitan Airport Authority of $400,000. This compares to $1,384,505 of operating revenuesand $1,780,628 of operating expenses in fiscal year 2011. The losses can be attributed to the ground-handling department.
Airport revenues decreased 14 percent or $3,761,580 from 2011 to 2012 and increased 32.7 percent or$6,643,166 from 2010 to 2011. These changes are primarily due to the fluctuation in capital contributionseach year. Capital contributions are federal and state revenues for construction or acquisition of capitalassets. Increases and decreases correspond to the changes in construction-in-progress.
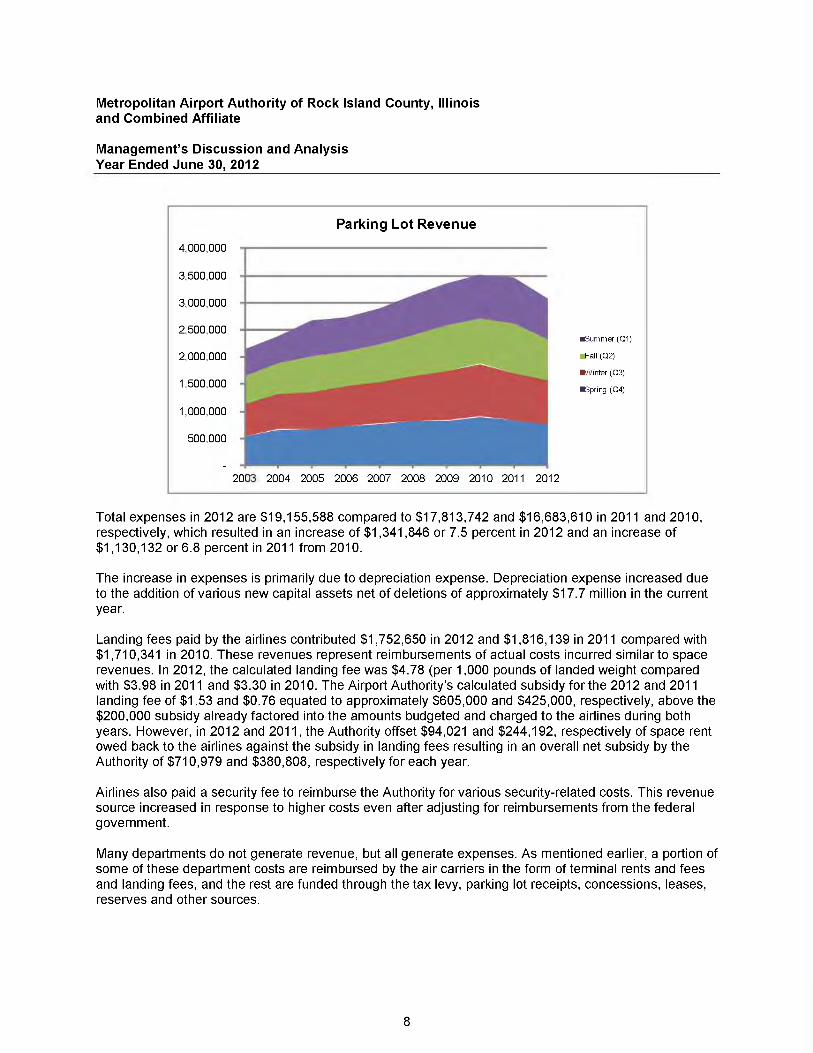
Parking lot revenue decreased 11 percent in 2012 and decreased 1.8 and increased 4.9 percent, over2011 and 2010, respectively. The number of enplanements at QCIA is a large factor in the fluctuation ofparking lot revenues. In 2012, enplanements decreased 11 percent. Overall, this significant revenuesource helped the Authority abate the taxes tied to the debt and provided needed funding for programsnot covered by other sources. As the following chart notes, use of the public parking facility has beensteady year-round for many years.
7
Metropolitan Airport Authority of Rock Island County, Illinoisand Combined Affiliate
Management's Discussion and AnalysisYear Ended June 30, 2012
500,000
.summer (01)
Parking Lot Revenue
4,000,000
3,500,000
3,000,000
2,500,000
2,000,000
1,500,000
Fall (02)
-.;vinter (03)-Spring (04)
1,000,000
2003 2004 2005 2006 2007 2008 2009 2010 2011 2012
Total expenses in 2012 are $19,155,588 compared to $17,813,742 and $16,683,610 in 2011 and 2010,respectively, which resulted in an increase of $1 ,341 ,846 or 7.5 percent in 2012 and an increase of$1,130,132 or 6.8 percent in 2011 from 2010.
The increase in expenses is primarily due to depreciation expense. Depreciation expense increased dueto the addition of various new capital assets net of deletions of approximately $17.7 million in the currentyear.
Landing fees paid by the airlines contributed $1,752,650 in 2012 and $1,816,139 in 2011 compared with$1,710,341 in 2010. These revenues represent reimbursements of actual costs incurred similar to spacerevenues. In 2012, the calculated landing fee was $4.78 (per 1,000 pounds of landed weight comparedwith $3.98 in 2011 and $3.30 in 2010. The Airport Authority's calculated subsidy for the 2012 and 2011landing fee of $1.53 and $0.76 equated to approximately $605,000 and $425,000, respectively, above the$200,000 subsidy already factored into the amounts budgeted and charged to the airlines during bothyears. However, in 2012 and 2011, the Authority offset $94,021 and $244,192, respectively of space rentowed back to the airlines against the subsidy in landing fees resulting in an overall net subsidy by theAuthority of $710,979 and $380,808, respectively for each year.
Airlines also paid a security fee to reimburse the Authority for various security-related costs. This revenuesource increased in response to higher costs even after adjusting for reimbursements from the federalgovernment.
Many departments do not generate revenue, but all generate expenses. As mentioned earlier, a portion ofsome of these department costs are reimbursed by the air carriers in the form of terminal rents and feesand landing fees, and the rest are funded through the tax levy, parking lot receipts, concessions, leases,reserves and other sources.
8
Metropolitan Airport Authority of Rock Island County, Illinoisand Combined Affiliate
Management's Discussion and AnalysisYear Ended June 30, 2012
In 2012 and 2011, salaries and wages were increased 2.0 percent and 4.0 percent, respectively for eachyear and compensated 81 (2012) and 83 (2011) full and part-time employees, eight commissioners and anumber of seasonal workers.
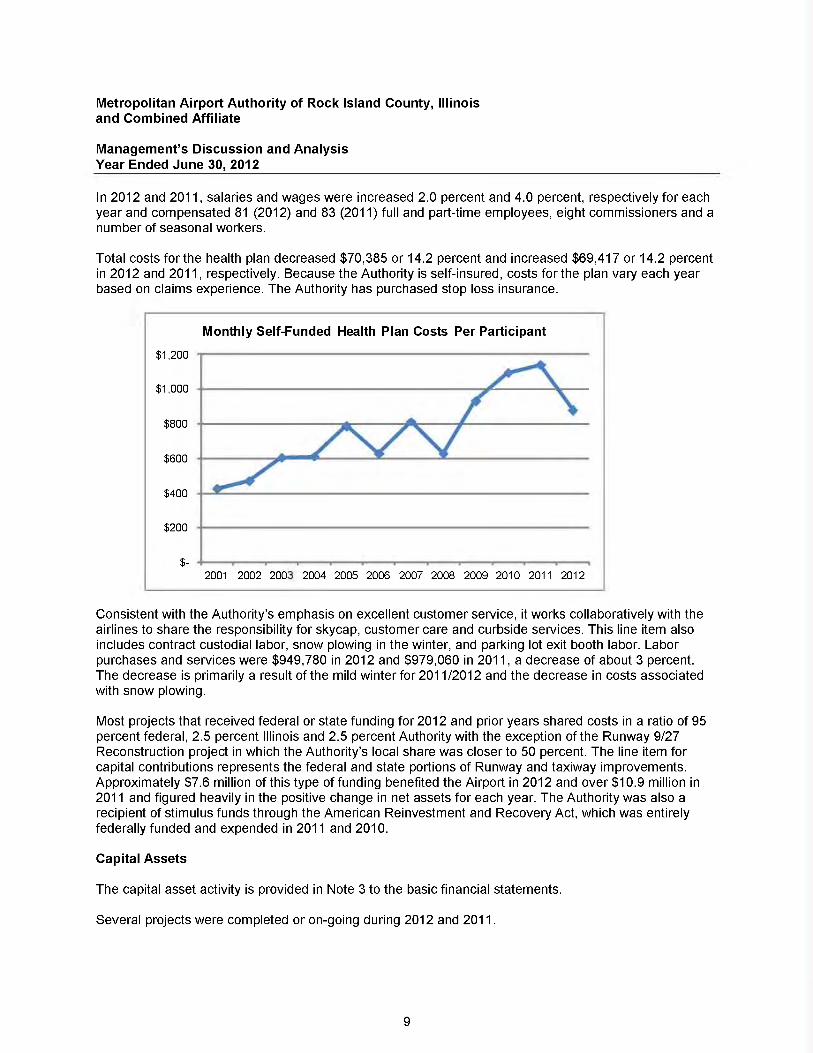
Total costs for the health plan decreased $70,385 or 14.2 percent and increased $69,417 or 14.2 percentin 2012 and 2011, respectively. Because the Authority is self-insured, costs for the plan vary each yearbased on claims experience. The Authority has purchased stop loss insurance.
Monthly Self-Funded Health Plan Costs Per Participant
$1,200
$1,000
$800
$600
$400
$200
$-2001 2002 2003 2004 2005 2006 2007 2008 2009 2010 2011 2012
Consistent with the Authority's emphasis on excellent customer service, it works collaboratively with theairlines to share the responsibility for skycap, customer care and curbside services. This line item alsoincludes contract custodial labor, snow plowing in the winter, and parking lot exit booth labor. Laborpurchases and services were $949,780 in 2012 and $979,060 in 2011, a decrease of about 3 percent.The decrease is primarily a result of the mild winter for 2011/2012 and the decrease in costs associatedwith snow plowing.
Most projects that received federal or state funding for 2012 and prior years shared costs in a ratio of 95percent federal, 2.5 percent Illinois and 2.5 percent Authority with the exception of the Runway 9/27Reconstruction project in which the Authority's local share was closer to 50 percent. The line item forcapital contributions represents the federal and state portions of Runway and taxiway improvements.Approximately $7.6 million of this type of funding benefited the Airport in 2012 and over $10.9 million in2011 and figured heavily in the positive change in net assets for each year. The Authority was also arecipient of stimulus funds through the American Reinvestment and Recovery Act, which was entirelyfederally funded and expended in 2011 and 2010.
Capital Assets
The capital asset activity is provided in Note 3 to the basic financial statements.
Several projects were completed or on-going during 2012 and 2011.
9

Metropolitan Airport Authority of Rock Island County, Illinoisand Combined Affiliate
Management's Discussion and AnalysisYear Ended June 30, 2012
In 2012, significant projects included:
• Completion of the Runway 9/27 reconstruction project which reworked our current Runwaysystem.
• Construction began on converting Runway 10/28 to a new Taxiway (Taxiway P). This Runwaywas completed in 2011 and was used as a temporary Runway during the reconstruction ofRunway 9/27.
• Completion of the new fuel farm which replaced the aging fuel farm with new tanks.
In 2011, significant projects included:
• Construction engineering and construction work began on the Rehabilitation of the Runway 9/27project.
• Completion of various Taxiway P paving projects which is being used as a temporary Runway(Runway 10/28) during the reconstruction of Runway 9/27.
• Completion of new parking associated with the employee lot as well as the rental car ready returnlot.
• Completion of new administrative office space.
• Completion of a temporary localizer on Runway 10.
• Completion of the Taxiway D relocation project.
• Purchase of a hanger from a major corporation.
• Construction began on the new fuel farm.
• Purchases of new snow removal equipment including 4 new snow brooms, a Hagie Spray Vehicle,a high speed snow blower.
• Purchases of 3 new John Deere Tractor/Mowers.
Long-Term Debt
The Metropolitan Airport Authority did not issue any new debt in the current year. The unused legal debtcapacity is $43,665,758, which represents 2.3 percent of the assessed valuation less the debt to berepaid by pledged revenue pursuant to the applicable bond ordinance. More information regarding thelong-term debt of Metropolitan Airport Authority and combined affiliate can be found in Note 4 to the basicfinancial statements.
Economic Factors
Twelve hubs, or connecting cities, were served during the majority of fiscal year 2012. AirTran stoppedserving the Orlando market in January 2012 and ceased all operations at the QCIA after a fifteen yearhistory between AirTran and the Metropolitan Airport Authority.
Allegiant, the newest carrier to the Authority, began service to Las Vegas and Phoenix-Mesa in the fall of2010. They quickly added the Tampa Bay area (St. Petersburg/Clearwater) to this list in February 2011and then Orlando-Sanford in February 2012. While most of these four cities saw two flights per week,there were on occasion more flights added during peak holiday times. The public has been supporting theflights to these much requested leisure destinations.
10
Metropolitan Airport Authority of Rock Island County, Illinoisand Combined Affiliate
Management's Discussion and AnalysisYear Ended June 30, 2012
The QCIA Airport Services, LLC continued to work the ground handling (above/below wing) operations forthe AirTran and Allegiant flights as well as charters for honor flights, gambling junkets and football teams.
American Eagle continued service to Chicago O'Hare and Dallas-Ft. Worth. Delta continued service toAtlanta, Detroit, Minneapolis-St. Paul and Memphis; although flights to these hubs varied over the monthsand aircraft size changed on these routes frequently. The Memphis route was discontinued in September2011 due to the Airline's reorganization of the Memphis hub. United Express continues their flights toChicago O'Hare and Denver. Much like Delta, aircraft size continues to vary depending on the subsidiarycarrier flying the routes for United Express.
Authority management will be watching the effects that these service changes will have on passengernumbers and the complexion of concession revenue at the QCIA. Enplanements/deplanements weredown approximately 11 percent over the prior fiscal year. The high cost of fuel over the fiscal yearcontinued. As a result of this and other economic factors, the airlines began reducing their overallcapacity and made a variety of adjustments to their routes, type and size of aircraft flown. One thing thatcontinues to evolve with the airlines is the addition of ancillary fees for baggage, seat selection, and othersimilar amenities in order for the airlines to explore alternative revenues that are not attached directly tothe ticket price.
As in the prior years, due diligence will be exercised during budget planning to target areas for savingsand efficiency. All capital projects planned have been started and each has a dedicated revenue streamto ensure payment. Future projects will need to be prioritized and perhaps delayed depending on theeconomic impact of the air service changes. The Board and management are also looking for ways toincrease non-aeronautical revenue for the airport such as ground and building rents through economicdevelopment on airport land.
Requests for Information
This financial report has been prepared in the spirit of full disclosure to provide the reader with anoverview of the Metropolitan Airport Authority's financial operations. If the reader has questions or wouldlike additional information about the Metropolitan Airport Authority of Rock Island County, Illinois or QCIAAirport Services, LLC, please direct the request to Bruce Carter, Director of Aviation, at P. O. Box 9009,Moline, Illinois 61265.
11
Metropolitan Airport Authority of Rock Island County, Illinoisand Combined Affiliate
Combined Statements of Net AssetsJune 30, 2012 and 2011
2012 2011
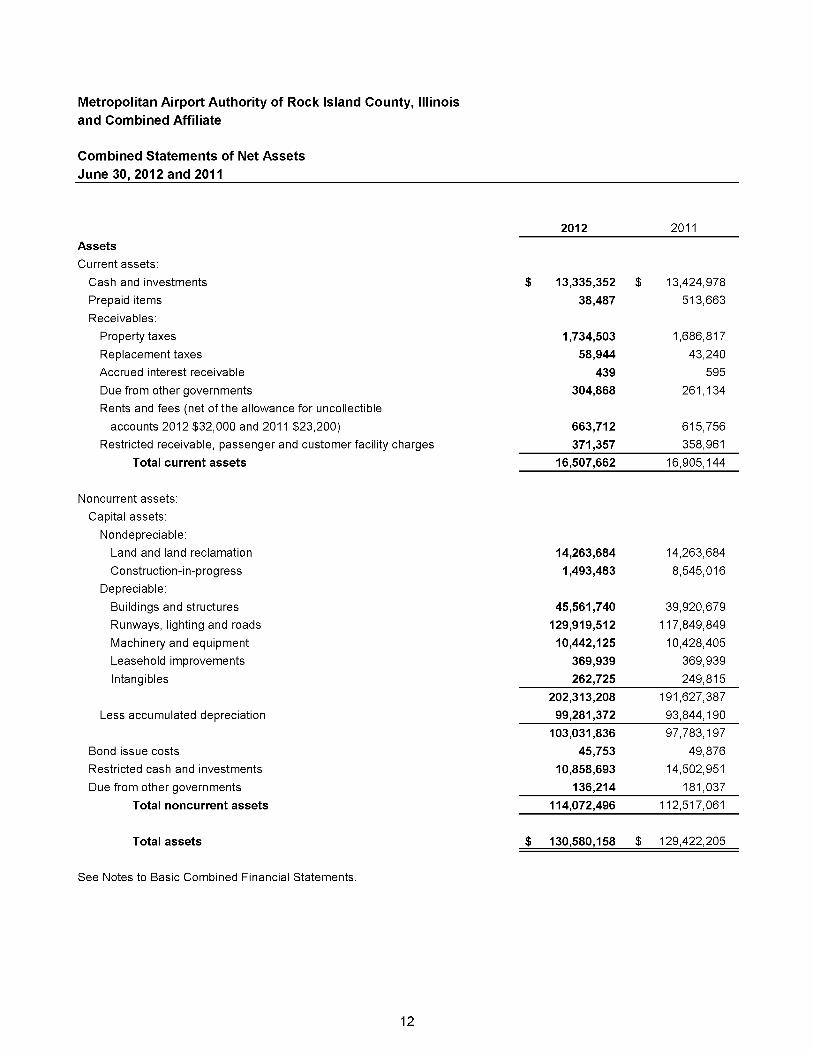
AssetsCurrent assets:
Cash and investments $ 13,335,352 $ 13,424,978
Prepaid items 38,487 513,663
Receivables:
Property taxes 1,734,503 1,686,817
Replacement taxes 58,944 43,240
Accrued interest receivable 439 595
Due from other governments 304,868 261,134Rents and fees (net of the allowance for uncollectible
accounts 2012 $32,000 and 2011 $23,200) 663,712 615,756Restricted receivable, passenger and customer facility charges 371,357 358,961
Total current assets 16,507,662 16,905,144
Noncurrent assets:
Capital assets:
Nondepreciable:
Land and land reclamation 14,263,684 14,263,684
Construction-in-progress 1,493,483 8,545,016
Depreciable:
Buildings and structures 45,561,740 39,920,679
Runways, lighting and roads 129,919,512 117,849,849
Machinery and equipment 10,442,125 10,428,405
Leasehold improvements 369,939 369,939
Intangibles 262,725 249,815
202,313,208 191,627,387
Less accumulated depreciation 99,281,372 93,844,190
103,031,836 97,783,197
Bond issue costs 45,753 49,876Restricted cash and investments 10,858,693 14,502,951
Due from other governments 136,214 181,037
Total noncurrent assets 114,072,496 112,517,061
Total assets $ 130,580,158 $ 129,422,205
See Notes to Basic Combined Financial Statements.
12

2012 2011
LiabilitiesCurrent liabilities:
Current portion, long-term debt
Accounts payable
Accrued compensated absences
Accrued salaries and wages
Accrued interest
Unearned revenue, primarily property tax
Claims payable
Due to other governments
Other
$ 1,070,000 $758,765233,946144,737103,718900,609
60,000
8755,068,970Total current liabilities 3,272,650
210,000
2,235,336
236,514
152,083
1,247,615
793,338
50,969
107,346
35,769
Noncurrent liabilities:
Long-term debt (net of discounts and deferred amount on
refunding 2012 $10,040; 2011 $12,760)
Other postemployment benefits
Total noncurrent liabilities
24,744,96047,900
25,812,240
47,900
25,860,14024,792,860
30,929,110Total liabilities 28,065,510
Net AssetsInvested in capital assets, net of related debt
Restricted for Airport facilities
Unrestricted
Total net assets
82,674,803 80,565,825
5,772,123 6,057,043
14,067,722 11,870,227
102,514,648 98,493,095
$ 130,580,158 $ 129,422,205Total liabilities and net assets
13

Metropolitan Airport Authority of Rock Island County, Illinoisand Combined Affiliate
Combined Statements of Revenues, Expenses and Changes in Net AssetsYears Ended June 30, 2012 and 2011
2012 2011Operating revenues:
Airline terminal complex $ 3,478,811 $ 3,393,842Parking lot 3,069,292 3,448,567
Aeronautical facilities 2,353,753 2,376,218General aviation, commercial/industrial activities 773,164 744,171General activities, utilities and other 574,829 585,588Fueling and ground handling services 1,074,718 1,063,757
Total operating revenues 11,324,567 11,612,143
Operating expenses:Salaries and benefits 4,089,233 4,171,749Maintenance and repairs 1,018,863 1,265,659Insurance 1,187,558 1,173,942Public relations and advertising 612,724 864,183Labor purchases and services 949,780 979,060Heat, light, power and water 578,109 602,836Other expenses 1,727,064 1,564,764Depreciation 7,664,169 6,156,054
Total operating expenses 17,827,500 16,778,247
Operating (loss) (6,502,933) (5,166,104)
Nonoperating revenues (expenses):Passenger facility charges 1,678,265 1,828,725Customer facility charges 704,517 713,378Property taxes 1,437,665 1,385,823Replacement property taxes 323,174 351,303Investment and other income 59,253 115,563Interest expense (988,227) (836,598)Amortization expense (6,843) (198,897)Gain (loss) on disposal of capital assets (333,018) 68,899
Total nonoperating revenues 2,874,786 3,428,196
Loss before capital contributions (3,628,147) (1,737,908)
Capital contributions 7,649,700 10,862,887Change in net assets 4,021,553 9,124,979
Net assets, beginning 98,493,095 89,368,116Net assets, ending $ 102,514,648 $ 98,493,095
See Notes to Basic Combined Financial Statements.
14
Metropolitan Airport Authority of Rock Island County, Illinoisand Combined Affiliate
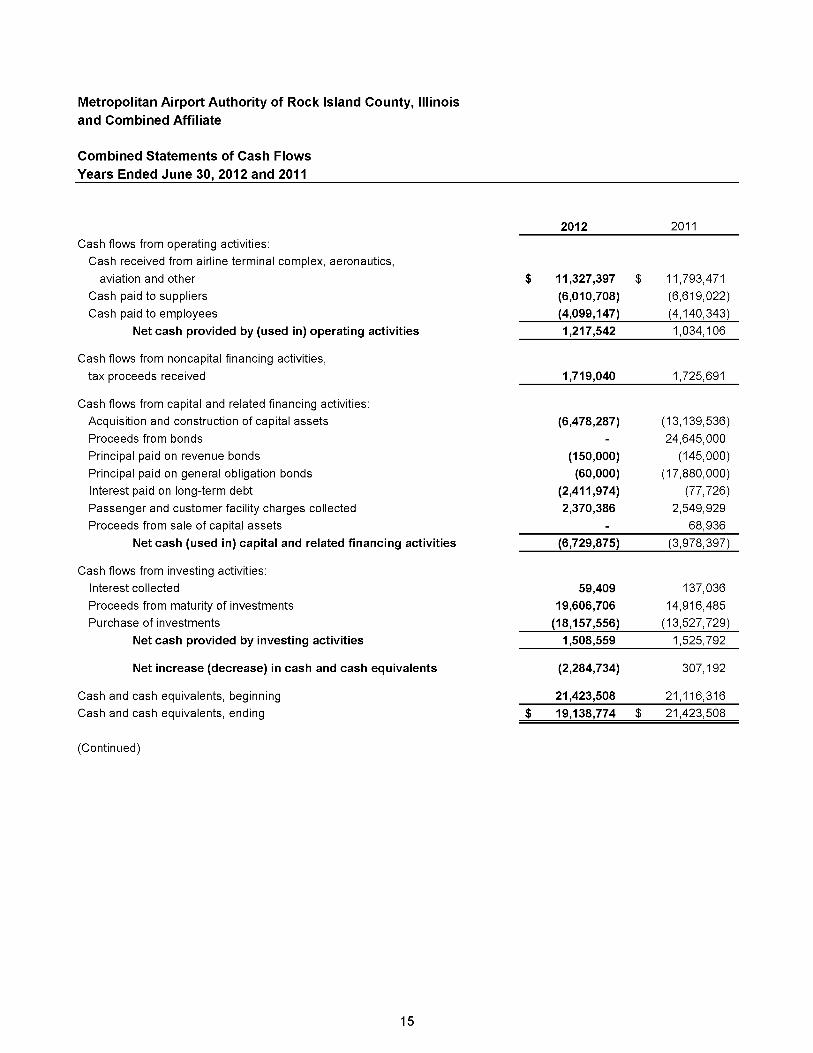
Combined Statements of Cash FlowsYears Ended June 30, 2012 and 2011
2012 2011Cash flows from operating activities:
Cash received from airline terminal complex, aeronautics,aviation and other $ 11,327,397 $ 11,793,471
Cash paid to suppliers (6,010,708) (6,619,022)Cash paid to employees (4,099,147) (4,140,343)
Net cash provided by (used in) operating activities 1,217,542 1,034,106
Cash flows from noncapital financing activities,
tax proceeds received 1,719,040 1,725,691
Cash flows from capital and related financing activities:Acquisition and construction of capital assets (6,478,287) (13,139,536)Proceeds from bonds 24,645,000Principal paid on revenue bonds (150,000) (145,000)Principal paid on general obligation bonds (60,000) (17,880,000)Interest paid on long-term debt (2,411,974) (77,726)Passenger and customer facility charges collected 2,370,386 2,549,929Proceeds from sale of capital assets 68,936
Net cash (used in) capital and related financing activities (6,729,875) (3,978,397)
Cash flows from investing activities:Interest collected 59,409 137,036Proceeds from maturity of investments 19,606,706 14,916,485Purchase of investments (18,157,556) (13,527,729)
Net cash provided by investing activities 1,508,559 1,525,792
Net increase (decrease) in cash and cash equivalents (2,284,734) 307,192
Cash and cash equivalents, beginning 21,423,508 21,116,316Cash and cash equivalents, ending $ 19,138,774 $ 21,423,508
(Continued)
15

Metropolitan Airport Authority of Rock Island County, Illinoisand Combined Affiliate
Combined Statements of Cash Flows (Continued)Years Ended June 30, 2012 and 2011
2012 2011Reconciliation of operating (loss) to net cash provided by
(used in) operating activities:Operating (loss) $ (6,502,933) $ (5,166,104)Adjustments to reconcile operating (loss) to net cash provided by
(used in) operating activities:Depreciation 7,664,169 6,156,054(Increase) decrease in:
Accounts receivable (47,956) 306,946Prepaid items 475,176 (439,450)
Increase (decrease) in:Accounts payable (420,817) 85,263Accrued salaries and wages (7,346) 7,049Accrued compensated absences (2,568) 24,357Unearned revenue 85,680 2,061Deposits (34,894) 6,961Claims payable 9,031 50,969
Net cash provided by (used in) operating activities $ 1,217,542 $ 1,034,106
Reconciliation of cash and cash equivalents to specific assetson the combined statements of net assets:Cash and investments $ 24,194,045 $ 27,927,929Less items not meeting the definition of cash equivalents 5,055,271 6,504,421Cash and cash equivalents at end of year $ 19,138,774 $ 21,423,508
Schedule of noncash capital and financing activities:Acquisition of capital assets through accounts payable
due to other governments and prepaid assets $ (1,163,100) $ 2,078,015Capital contributions 7,650,789 10,907,528Capitalized interest 279,850 476,435
See Notes to Basic Combined Financial Statements.
16

Metropolitan Airport Authority of Rock Island County, Illinoisand Combined Affiliate
Notes to Basic Combined Financial Statements
Note 1. Nature of Business, Reporting Entity and Significant Accounting Policies
Nature of business:
The basic combined financial statements include the activities of the following entities:
Metropolitan Airport Authority (Airport) provides an airline terminal, runways and otheraeronautical facilities in Moline, Illinois, for passenger and freight airlines and private aircraft.
QCIA Airport Services, LLC (QCIAAS) provides fueling and ground handling services tocommercial and charter airlines. The Authority is the sole member of this entity. QCIAAS wascreated in fiscal year 2004 with a perpetual term.
The Airport and QCIAAS are collectively referred to as the Authority.
Reporting entity:
Accounting principles generally accepted in the United States of America require the reporting entityinclude (1) the primary government, (2) organizations for which the primary government is financiallyaccountable and (3) other organizations for which the nature and significance of their relationship withthe primary government are such that exclusion would cause the reporting entity's financial statementsto be misleading or incomplete. The Authority has the statutory authority to levy taxes and to issuebonded debt without the approval of another government. It has the right to sue and be sued, and hasthe right to buy, sell, lease or mortgage property in its own name. Based on these criteria, the Authorityis considered a primary government and there are no other organizations or agencies whose financialstatements should be combined and presented with these financial statements other than QCIAAS asnoted above.
Significant accounting policies:
Principles of combination: The accompanying basic combined financial statements include theaccounts of the Airport and QCIAAS. All significant intercompany accounts and transactions have beeneliminated in combination.
Basis of accounting and measurement focus: The economic measurement focus and the accrual basisof accounting are used by the Authority. Under the accrual basis of accounting, revenue is recognizedwhen earned and expenses are recognized when the liability has been incurred. Under this basis ofaccounting, all assets and all liabilities associated with the operation of the Authority are included in thebalance sheet.
Accounting estimates: The preparation of financial statements in conformity with accounting principlesgenerally accepted in the United States of America requires management to make estimates andassumptions that affect the reported amount of assets and liabilities and disclosure of contingentassets and liabilities at the date of the financial statements and the reported amount of revenues andexpenses during the reporting period. Actual results could differ from those estimates.
Cash, cash equivalents and investments: For purposes of reporting cash flows, all short-terminvestments that are highly liquid are considered to be cash equivalents. Cash equivalents are readilyconvertible to a known amount of cash and, at the day of purchase, have maturity no longer than threemonths.
17

Metropolitan Airport Authority of Rock Island County, Illinoisand Combined Affiliate
Notes to Basic Combined Financial Statements
Note 1. Nature of Business, Reporting Entity and Significant Accounting Policies (Continued)
Investments consist of the Illinois Funds Money Market Fund, Governmental Money Market Fund, twoRepurchase Agreements and Commercial Paper. The first two are external investment pools that arenot SEC registered. The Repurchase Agreements and the Governmental Money Market Funds aremanaged by a financial institution and, therefore, regulated by the Comptroller of the Currency forCollective Investment Funds. The Illinois Funds Money Market is regulated by the State Treasurer'sOffice. The value of the external investment pools are recorded at amortized cost pursuant to Rule 2a-7under the Investment Company Act of 1940.
Property taxes: Property taxes receivable represent the 2011 tax levy which is collectible in the 2012-2013 fiscal year and six months of the 2012 tax levy which is collectible in the 2013-2014 fiscal year.Property taxes are assessed in December and become a lien on the property as of the precedingJanuary 1 and are to be received in quarterly installments in June, August, September and Novemberof the following year. Property taxes receivable from the 2012 tax levy are unearned on June 30, 2012,since the period for which the taxes are levied is fiscal year June 30, 2013.
Debt issuance costs, discounts and deferred amount on refunding: Debt discounts and deferredamount on refunding are reported with long-term debt. Debt issue costs are recorded as an asset in thefinancial statements. Debt issues costs, discounts and deferred amount on refunding are deferred andamortized over the term of the related debt using a method which approximates the effective interestmethod. The deferred amount on refunding was expensed during the fiscal year ending June 30, 2011when the 2000C General Obligation Airport System Alternate Revenue Source Bonds were refunded.
Capital assets: Capital assets are carried at cost and defined by the Authority as assets with an initial,individual cost of $10,000 or more and an initial useful life greater than one year. Interest related toconstruction of capital assets is capitalized. Capitalized interest was $279,850 during fiscal year 2012and $476,435 during fiscal year 2011. Donated capital assets are recorded at estimated fair value atthe date of donation. Depreciation is computed by the straight-line method over estimated useful livesas follows:
Buildings and structures
Runways, lighting and roads
Machinery and equipment
Leasehold improvements
Intangibles
3-50 years
5-50 years
3-25 years
10 years
3-7 years
Compensated absences: Vacation, compensating, and personal leave is accrued as a liability as it isearned. Any compensated absences accrued for at the fiscal year end is expected to be used withinthe following year as it is the Authority's policy to not carry over unused hours beyond an employee'sanniversary date. Therefore, the entire compensated balance at June 30, 2012 of $233,946 is shownas a current liability. Sick leave benefits do not vest as the benefit is only paid in the event of death.Total nonvested sick leave benefits, for which the Authority is contingently liable as of June 30, 2012,are $568,357.
Prepaid items: Prepaid items primarily consist of advance payments to the state of Illinois for the localshare of capital projects.
18
Metropolitan Airport Authority of Rock Island County, Illinoisand Combined Affiliate
Notes to Basic Combined Financial Statements
Note 1. Nature of Business, Reporting Entity and Significant Accounting Policies (Continued)
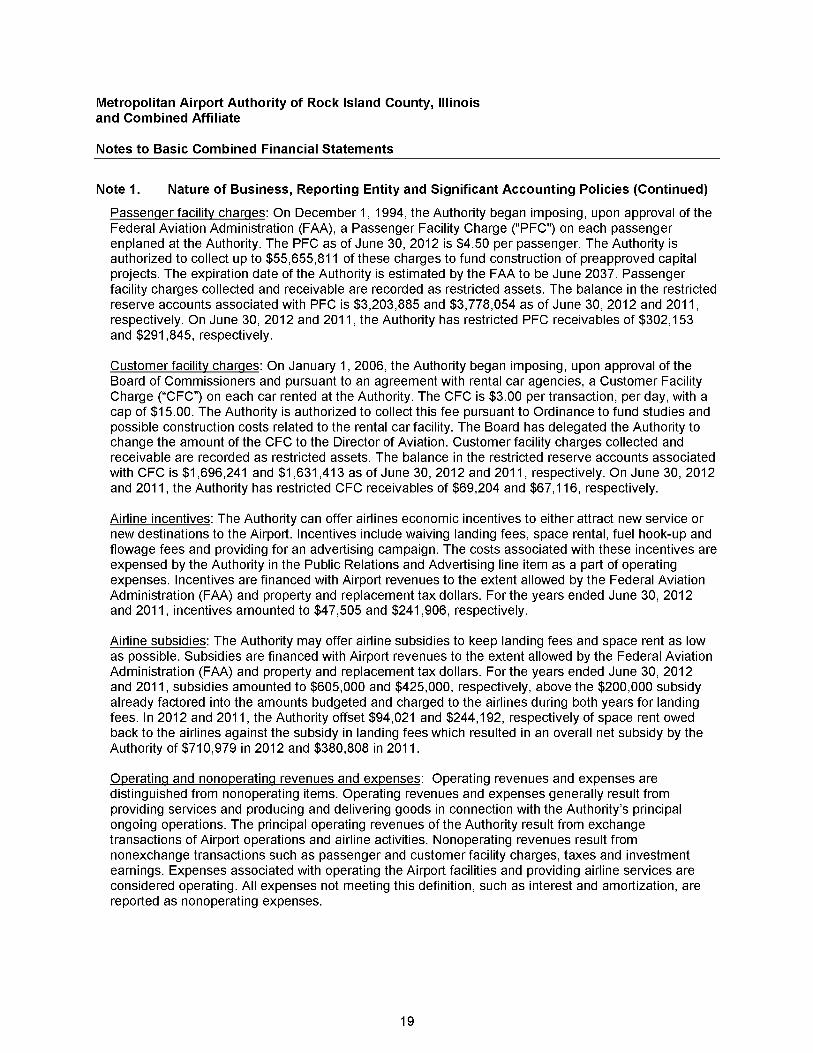
Passenger facility charges: On December 1, 1994, the Authority began imposing, upon approval of theFederal Aviation Administration (FAA), a Passenger Facility Charge ("PFC") on each passengerenplaned at the Authority. The PFC as of June 30, 2012 is $4.50 per passenger. The Authority isauthorized to collect up to $55,655,811 of these charges to fund construction of preapproved capitalprojects. The expiration date of the Authority is estimated by the FAA to be June 2037. Passengerfacility charges collected and receivable are recorded as restricted assets. The balance in the restrictedreserve accounts associated with PFC is $3,203,885 and $3,778,054 as of June 30, 2012 and 2011,respectively. On June 30, 2012 and 2011, the Authority has restricted PFC receivables of $302,153and $291,845, respectively.
Customer facility charges: On January 1, 2006, the Authority began imposing, upon approval of theBoard of Commissioners and pursuant to an agreement with rental car agencies, a Customer FacilityCharge ("CFC") on each car rented at the Authority. The CFC is $3.00 per transaction, per day, with acap of $15.00. The Authority is authorized to collect this fee pursuant to Ordinance to fund studies andpossible construction costs related to the rental car facility. The Board has delegated the Authority tochange the amount of the CFC to the Director of Aviation. Customer facility charges collected andreceivable are recorded as restricted assets. The balance in the restricted reserve accounts associatedwith CFC is $1,696,241 and $1,631,413 as of June 30, 2012 and 2011, respectively. On June 30, 2012and 2011, the Authority has restricted CFC receivables of $69,204 and $67,116, respectively.
Airline incentives: The Authority can offer airlines economic incentives to either attract new service ornew destinations to the Airport. Incentives include waiving landing fees, space rental, fuel hook-up andflowage fees and providing for an advertising campaign. The costs associated with these incentives areexpensed by the Authority in the Public Relations and Advertising line item as a part of operatingexpenses. Incentives are financed with Airport revenues to the extent allowed by the Federal AviationAdministration (FAA) and property and replacement tax dollars. For the years ended June 30, 2012and 2011, incentives amounted to $47,505 and $241,906, respectively.
Airline subsidies: The Authority may offer airline subsidies to keep landing fees and space rent as lowas possible. Subsidies are financed with Airport revenues to the extent allowed by the Federal AviationAdministration (FAA) and property and replacement tax dollars. For the years ended June 30, 2012and 2011, subsidies amounted to $605,000 and $425,000, respectively, above the $200,000 subsidyalready factored into the amounts budgeted and charged to the airlines during both years for landingfees. In 2012 and 2011, the Authority offset $94,021 and $244,192, respectively of space rent owedback to the airlines against the subsidy in landing fees which resulted in an overall net subsidy by theAuthority of $710,979 in 2012 and $380,808 in 2011.
Operating and nonoperating revenues and expenses: Operating revenues and expenses aredistinguished from nonoperating items. Operating revenues and expenses generally result fromproviding services and producing and delivering goods in connection with the Authority's principalongoing operations. The principal operating revenues of the Authority result from exchangetransactions of Airport operations and airline activities. Nonoperating revenues result fromnonexchange transactions such as passenger and customer facility charges, taxes and investmentearnings. Expenses associated with operating the Airport facilities and providing airline services areconsidered operating. All expenses not meeting this definition, such as interest and amortization, arereported as nonoperating expenses.
19
Metropolitan Airport Authority of Rock Island County, Illinoisand Combined Affiliate
Notes to Basic Combined Financial Statements
Note 1. Nature of Business, Reporting Entity and Significant Accounting Policies (Continued)
Net assets: Net assets represent the difference between assets and liabilities. Net assets invested incapital assets, net of related debt, consists of capital assets, net of accumulated depreciation, reducedby any outstanding balances of any borrowings used for the acquisition, construction or improvement ofthose assets. Net assets invested in capital assets, net of related debt excludes unspent debtproceeds. As of June 30, 2012 and 2011 there were unspent bond proceeds of $5,457,927 and$8,804,868, respectively. Net assets are reported as restricted when there are limitations imposed ontheir use either through enabling legislation adopted by the Authority or through external restrictionsimposed by creditors, grantors or laws or regulations of other governments. When an expense isincurred for purposes for which both restricted and unrestricted net assets are available, the Authorityfirst applies restricted resources.
Accounting pronouncements: The Authority is applying all applicable Governmental AccountingStandards Board (GAS B) pronouncements as well as following all Financial Accounting StandardsBoard guidance issued on or before November 30, 1989, unless that guidance conflicts with orcontradicts GASB pronouncements. The Authority has elected to not apply FASB guidance subsequentto November 30, 1989.
Reclassification: Certain amounts in the 2011 financial statements have been reclassified to conform tothe 2012 presentation with no effect on net assets or change in net assets.
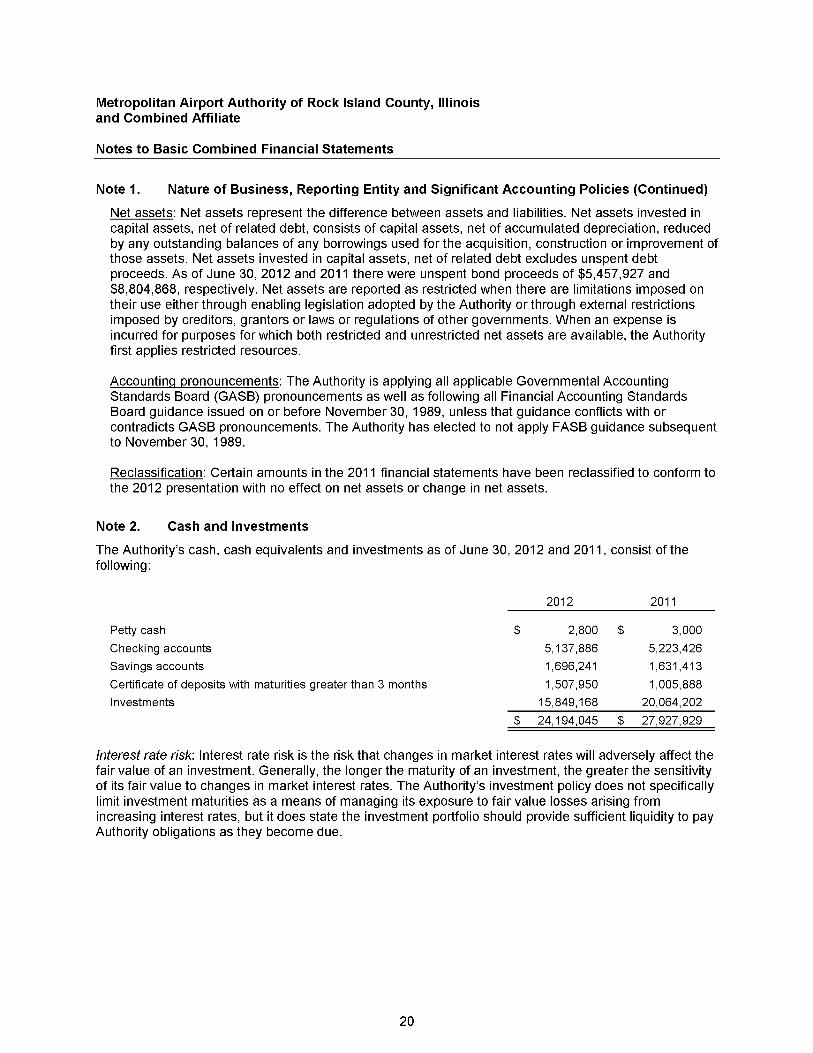
Note 2. Cash and Investments
The Authority's cash, cash equivalents and investments as of June 30, 2012 and 2011, consist of thefollowing:
2012 2011
Petty cash $ 2,800 $ 3,000
Checking accounts 5,137,886 5,223,426
Savings accounts 1,696,241 1,631,413
Certificate of deposits with maturities greater than 3 months 1,507,950 1,005,888
Investments 15,849,168 20,064,202
$ 24,194,045 $ 27,927,929
Interest rate risk: Interest rate risk is the risk that changes in market interest rates will adversely affect thefair value of an investment. Generally, the longer the maturity of an investment, the greater the sensitivityof its fair value to changes in market interest rates. The Authority's investment policy does not specificallylimit investment maturities as a means of managing its exposure to fair value losses arising fromincreasing interest rates, but it does state the investment portfolio should provide sufficient liquidity to payAuthority obligations as they become due.
20
Metropolitan Airport Authority of Rock Island County, Illinoisand Combined Affiliate
Notes to Basic Combined Financial Statements
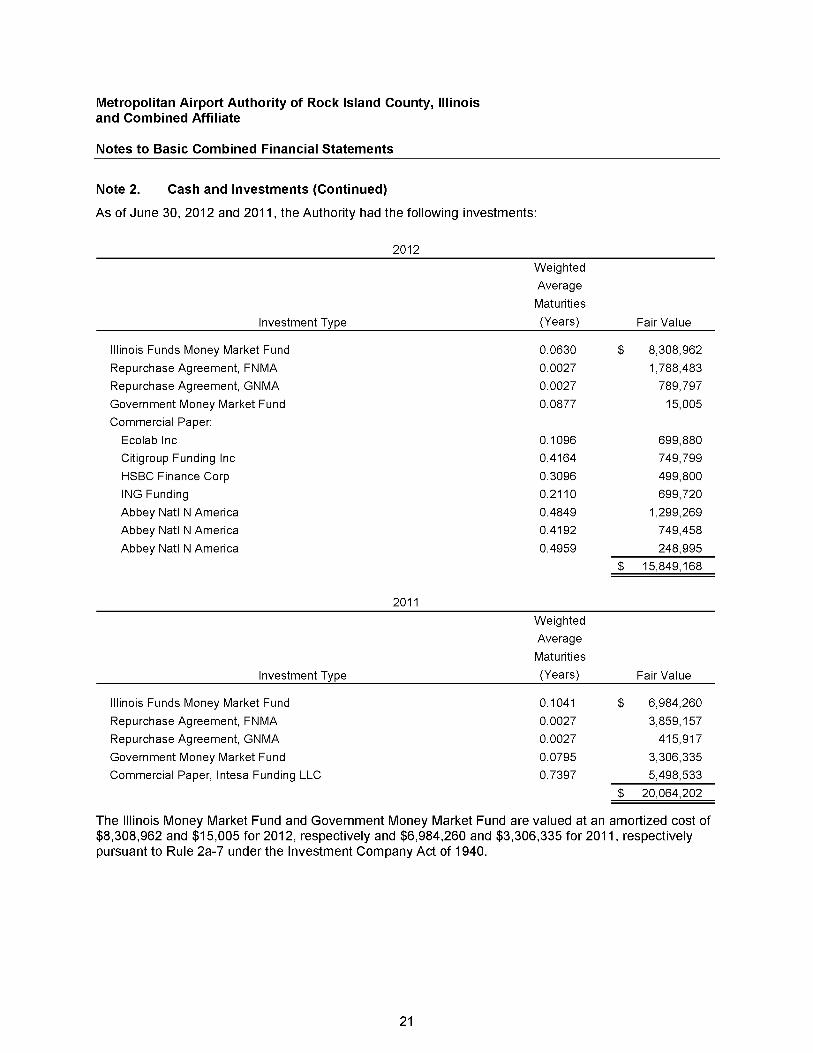
Note 2. Cash and Investments (Continued)
As of June 30, 2012 and 2011, the Authority had the following investments:
Investment Type
2012
Weighted
Average
Maturities
(Years) Fair Value
0.0630 $ 8,308,962
0.0027 1,788,483
0.0027 789,797
0.0877 15,005
0.1096 699,8800.4164 749,799
0.3096 499,800
0.2110 699,7200.4849 1,299,2690.4192 749,4580.4959 248,995
$ 15,849,168
2011
Weighted
Average
Maturities
(Years) Fair Value
0.1041 $ 6,984,260
0.0027 3,859,157
0.0027 415,917
0.0795 3,306,335
0.7397 5,498,533
$ 20,064,202
Illinois Funds Money Market Fund
Repurchase Agreement, FNMA
Repurchase Agreement, GNMA
Government Money Market Fund
Commercial Paper:
Ecolab Inc
Citigroup Funding Inc
HSBC Finance Corp
ING Funding
Abbey Natl N America
Abbey Natl N America
Abbey Natl N America
Investment Type
Illinois Funds Money Market Fund
Repurchase Agreement, FNMA
Repurchase Agreement, GNMA
Government Money Market Fund
Commercial Paper, Intesa Funding LLC
The Illinois Money Market Fund and Government Money Market Fund are valued at an amortized cost of$8,308,962 and $15,005 for 2012, respectively and $6,984,260 and $3,306,335 for 2011, respectivelypursuant to Rule 2a-7 under the Investment Company Act of 1940.
21

Metropolitan Airport Authority of Rock Island County, Illinoisand Combined Affiliate
Notes to Basic Combined Financial Statements
Note 2. Cash and Investments (Continued)
Credit risk: Credit risk is the risk that an issuer of an investment will not fulfill its obligation to the holder ofthe investment. This is measured by the assignment of a rating by a nationally recognized statisticalrating organization. Statutes authorize the Authority to make deposits in federally insured banks, savingsand loan associations or other financial institutions, and to invest available funds in the following types ofdepository accounts or investments:
• Securities of the U.S. Government or its Agencies• Certificates of Deposit• Passbook Savings Accounts• Commercial Paper• Illinois State Funds• Treasury Management Investment Fund• Repurchase Agreements• Obligations of the Federal National Mortgage Association• Bankers Acceptance
The Authority's general investment policy is to apply the prudent-person rule: Investments shall be madeutilizing the judgment and care, under the circumstances then present, which persons of prudence,discretion and intelligence exercise in the management of their own affairs, not for speculation, but forinvestments, considering probable safety of their capital as well as the probable income to be derived.The Authority's investment policy does not further limit its investment choices in relation to credit risk.
As of June 30, 2012 and 2011, the Authority's investments were rated as follows:
2012
Investment Type
Moody's
Investor Services
Standard &Poor's
Illinois Funds Money Market Fund
Repurchase agreement, FNMA
Government Money Market Fund
Commercial Paper:
Ecolab Inc
Citigroup Funding Inc
HSBC Finance Corp
ING Funding
Abbey Natl N America
Not rated
AaaAaa-mf
P-2P-2P-2P-1P-1
2011
AAAm
AA+
AAAm
A-2
A-2A-1A-1A-1
Investment Type
Moody's
Investor Services
Standard &
Poor's
Illinois Funds Money Market Fund
Repurchase agreement, FNMA
Government Money Market Fund
Commercial Paper, Intesa Funding LLC
Not rated
Aaa
Aaa-mf
P-1
22
AAAm
AAAm
AAAmA-1

Metropolitan Airport Authority of Rock Island County, Illinoisand Combined Affiliate
Notes to Basic Combined Financial Statements
Note 2. Cash and Investments (Continued)
Concentration of credit risk: The Authority's investment policy limits the deposit of funds with the State ofIllinois Public Treasurer's Investment Pool to 60 percent. Furthermore, with the exception of U.S.Treasury securities and local governmental investment pools, no more than 50 percent of the totalinvestment portfolio shall be invested with a single financial institution. The Authority's investments incommercial paper with Abbey Natl N America did represent more than 5 percent of the total investmentsat 14.5 percent as of June 30, 2012. Commercial paper with Intesa funding LLC did represent more than5 percent of total investments at 27 percent as of June 30, 2011. Money market mutual funds, repurchaseagreements, external investment pools, and other pooled investments are excluded from thisconsideration since the Authority doesn't "hold" the underlying investments.
Custodial credit risk: Custodial credit risk is the risk that in the event of a bank failure, the government'sdeposits may not be returned to it. It is the Authority's policy to require that time deposits in excess ofFDIC insurable limits be secured by collateral or private insurance to protect public deposits in a singlefinancial institution if it were to default.
As of June 30, 2012 and 2011, none of the Authority's deposits with financial institutions were exposed tocustodial credit risk due to deposits not being covered by federal depository insurance or secured bysome form of collateral authorized by the Authority's investment policy.
The custodial credit risk for investments is the risk that, in the event of the failure of the counterparty (e.g.broker-dealer) to a transaction, a government will not be able to recover the value of its investment ofcollateral securities that are in the possession of another party. The Authority had no investments thatwere exposed to custodial credit risk.
Note 3. Capital Assets
Capital asset activity for the year ended June 30, 2012, is as follows:
June 30, 2011 Additions Retirements June 30, 2012Nondepreciable assets:
Land and land reclamation $ 14,263,684 $ $ $ 14,263,684Construction-i n-prog ress 8,545,016 13,164,722 20,216,255 1,493,483
Total nondepreciable assets 22,808,700 13,164,722 20,216,255 15,757,167
Depreciable assets:Buildings and structures 39,920,679 5,641,061 45,561,740Runways, lighting and roads 117,849,849 14,588,771 2,519,108 129,919,512Machinery and equipment 10,428,405 41,317 27,597 10,442,125Leasehold improvements 369,939 369,939Intangibles 249,815 26,210 13,300 262,725
Total depreciable assets 168,818,687 20,297,359 2,560,005 186,556,041
Less accumulated depreciation for:Buildings and structures 20,613,763 1,299,942 21,913,705Runways, lighting and roads 66,893,721 5,444,667 2,186,090 70,152,298Machinery and equipment 5,916,563 833,354 27,597 6,722,320Leasehold improvements 268,135 37,075 305,210Intangibles 152,008 49,131 13,300 187,839
Total accumulated depreciation 93,844,190 7,664,169 2,226,987 99,281,372
Total depreciable assets, net 74,974,497 12,633,190 333,018 87,274,669
Capital assets, net $ 97.783.197 $ 25.797.912 $ 20.549.273 $ 103.031.836
23
Metropolitan Airport Authority of Rock Island County, Illinoisand Combined Affiliate
Notes to Basic Combined Financial Statements
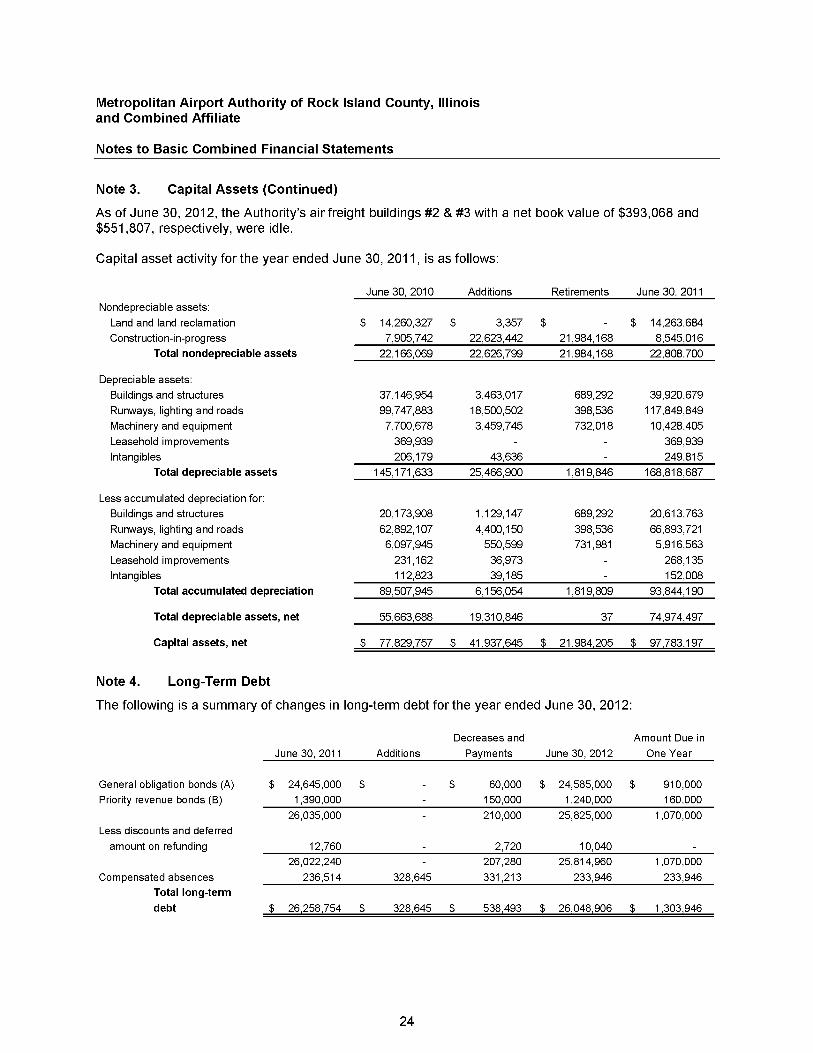
Note 3. Capital Assets (Continued)
As of June 30, 2012, the Authority's air freight buildings #2 & #3 with a net book value of $393,068 and$551,807, respectively, were idle.
Capital asset activity for the year ended June 30, 2011, is as follows:
June 30,2010 Additions Retirements June 30, 2011Nondepreciable assets:
Land and land reclamation $ 14,260,327 $ 3,357 $ $ 14,263,684Construction-i n-prog ress 7,905,742 22,623,442 21,984,168 8,545,016
Total nondepreciable assets 22,166,069 22,626,799 21,984,168 22,808,700
Depreciable assets:Buildings and structures 37,146,954 3,463,017 689,292 39,920,679
Runways, lighting and roads 99,747,883 18,500,502 398,536 117,849,849Machinery and equipment 7,700,678 3,459,745 732,018 10,428,405
Leasehold improvements 369,939 369,939Intangibles 206,179 43,636 249,815
Total depreciable assets 145,171,633 25,466,900 1,819,846 168,818,687
Less accumulated depreciation for:Buildings and structures 20,173,908 1,129,147 689,292 20,613,763
Runways, lighting and roads 62,892,107 4,400,150 398,536 66,893,721Machinery and equipment 6,097,945 550,599 731,981 5,916,563
Leasehold improvements 231,162 36,973 268,135Intangibles 112,823 39,185 152,008
Total accumulated depreciation 89,507,945 6,156,054 1,819,809 93,844,190
Total depreciable assets, net 55,663,688 19,310,846 37 74,974,497
Capital assets, net $ 77.829.757 $ 41.937.645 $ 21.984.205 $ 97.783.197
Note 4. Long-Term Debt
The following is a summary of changes in long-term debt for the year ended June 30, 2012:
Decreases and Amount Due in
June 30, 2011 Additions Payments June 30, 2012 One Year
General obligation bonds (A) $ 24,645,000 $ $ 60,000 $ 24,585,000 $ 910,000Priority revenue bonds (B) 1,390,000 150,000 1,240,000 160,000
26,035,000 210,000 25,825,000 1,070,000Less discounts and deferred
amount on refunding 12,760 2,720 10,04026,022,240 207,280 25,814,960 1,070,000
Compensated absences 236,514 328,645 331,213 233,946 233,946Total long-term
debt $ 26,258,754 $ 328,645 $ 538,493 $ 26,048,906 $ 1,303,946
24
Metropolitan Airport Authority of Rock Island County, Illinoisand Combined Affiliate
Notes to Basic Combined Financial Statements
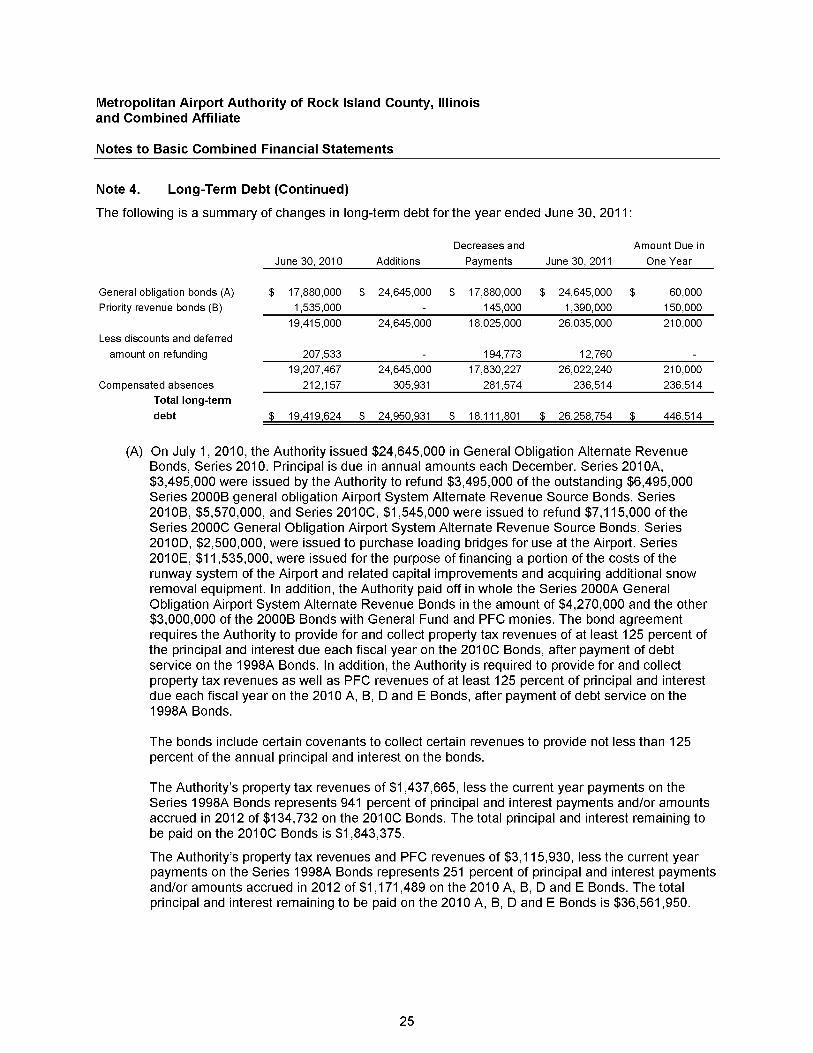
Note 4. Long-Term Debt (Continued)
The following is a summary of changes in long-term debt for the year ended June 30, 2011 :
Decreases and Amount Due in
June 30, 2010 Additions Payments June 30, 2011 One Year
General obligation bonds (A) $ 17,880,000 $ 24,645,000 $ 17,880,000 $ 24,645,000 $ 60,000Priority revenue bonds (8) 1,535,000 145,000 1,390,000 150,000
19,415,000 24,645,000 18,025,000 26,035,000 210,000Less discounts and deferred
amount on refunding 207,533 194,773 12,76019,207,467 24,645,000 17,830,227 26,022,240 210,000
Compensated absences 212,157 305,931 281,574 236,514 236,514Total long-term
debt $ 19,419,624 $ 24,950,931 $ 18,111,801 $ 26,258,754 $ 446,514
(A) On July 1, 2010, the Authority issued $24,645,000 in General Obligation Alternate RevenueBonds, Series 2010. Principal is due in annual amounts each December. Series 201 OA,$3,495,000 were issued by the Authority to refund $3,495,000 of the outstanding $6,495,000Series 2000B general obligation Airport System Alternate Revenue Source Bonds. Series2010B, $5,570,000, and Series 201 OC, $1,545,000 were issued to refund $7,115,000 of theSeries 2000C General Obligation Airport System Alternate Revenue Source Bonds. Series2010D, $2,500,000, were issued to purchase loading bridges for use at the Airport. Series2010E, $11,535,000, were issued for the purpose of financing a portion of the costs of therunway system of the Airport and related capital improvements and acquiring additional snowremoval equipment. In addition, the Authority paid off in whole the Series 2000A GeneralObligation Airport System Alternate Revenue Bonds in the amount of $4,270,000 and the other$3,000,000 of the 2000B Bonds with General Fund and PFC monies. The bond agreementrequires the Authority to provide for and collect property tax revenues of at least 125 percent ofthe principal and interest due each fiscal year on the 201OC Bonds, after payment of debtservice on the 1998A Bonds. In addition, the Authority is required to provide for and collectproperty tax revenues as well as PFC revenues of at least 125 percent of principal and interestdue each fiscal year on the 2010 A, B, D and E Bonds, after payment of debt service on the1998A Bonds.
The bonds include certain covenants to collect certain revenues to provide not less than 125percent of the annual principal and interest on the bonds.
The Authority's property tax revenues of $1 ,437,665, less the current year payments on theSeries 1998A Bonds represents 941 percent of principal and interest payments and/or amountsaccrued in 2012 of $134,732 on the 201OC Bonds. The total principal and interest remaining tobe paid on the 201OC Bonds is $1,843,375.
The Authority's property tax revenues and PFC revenues of $3,115,930, less the current yearpayments on the Series 1998A Bonds represents 251 percent of principal and interest paymentsand/or amounts accrued in 2012 of $1 ,171,489 on the 2010 A, B, D and E Bonds. The totalprincipal and interest remaining to be paid on the 2010 A, B, D and E Bonds is $36,561,950.
25
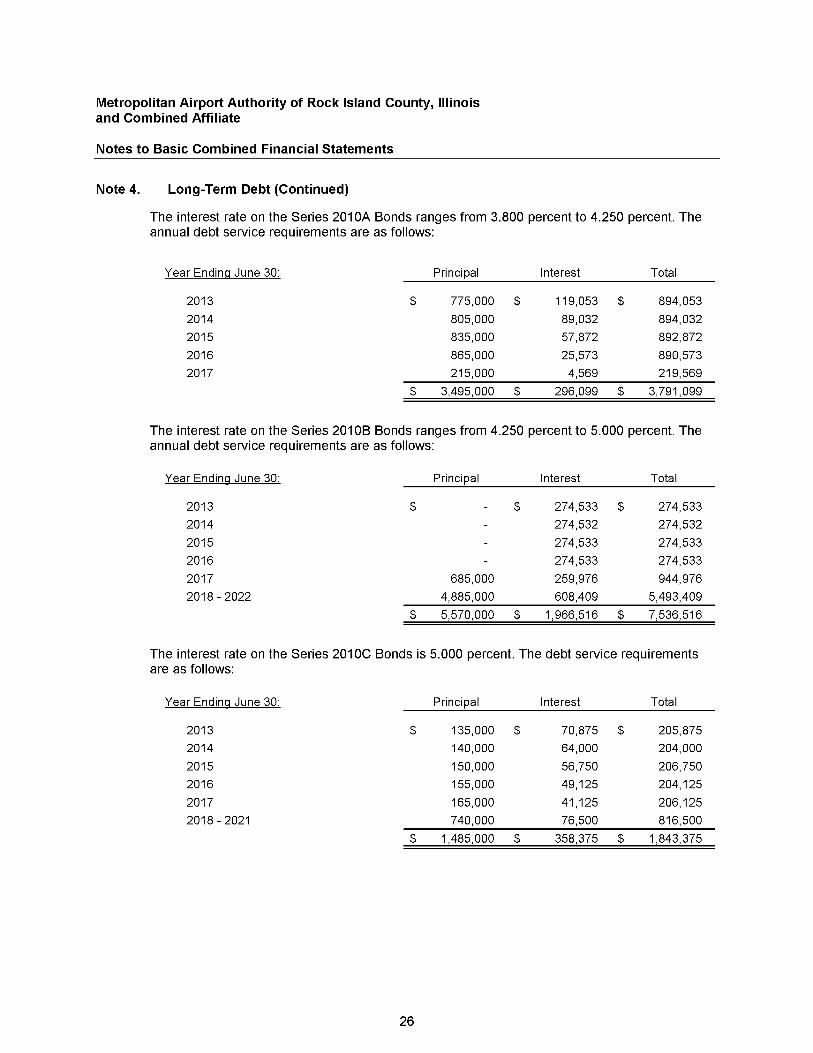
Metropolitan Airport Authority of Rock Island County, Illinoisand Combined Affiliate
Notes to Basic Combined Financial Statements
Note 4. Long-Term Debt (Continued)
The interest rate on the Series 201 OA Bonds ranges from 3.800 percent to 4.250 percent. Theannual debt service requirements are as follows:
Year Ending June 30: Principal Interest Total
2013 $ 775,000 $ 119,053 $ 894,053
2014 805,000 89,032 894,032
2015 835,000 57,872 892,872
2016 865,000 25,573 890,573
2017 215,000 4,569 219,569
$ 3,495,000 $ 296,099 $ 3,791,099
The interest rate on the Series 201 OB Bonds ranges from 4.250 percent to 5.000 percent. Theannual debt service requirements are as follows:
Year Ending June 30: Principal Interest Total
2013 $ $ 274,533 $ 274,533
2014 274,532 274,532
2015 274,533 274,533
2016 274,533 274,533
2017 685,000 259,976 944,9762018 - 2022 4,885,000 608,409 5,493,409
$ 5,570,000 $ 1,966,516 $ 7,536,516
The interest rate on the Series 201 OC Bonds is 5.000 percent. The debt service requirementsare as follows:
Year Ending June 30: Principal Interest Total
2013 $ 135,000 $ 70,875 $ 205,875
2014 140,000 64,000 204,000
2015 150,000 56,750 206,750
2016 155,000 49,125 204,125
2017 165,000 41,125 206,1252018 - 2021 740,000 76,500 816,500
$ 1,485,000 $ 358,375 $ 1,843,375
26

Metropolitan Airport Authority of Rock Island County, Illinoisand Combined Affiliate
Notes to Basic Combined Financial Statements
Note 4. Long-Term Debt (Continued)
The interest rate on the Series 201 OD Bonds ranges from 5.500 percent to 5.650 percent. Theannual debt service requirements are as follows:
Year Ending June 30: Principal Interest Total
2013 $ $ 138,010 $ 138,010
2014 138,010 138,010
2015 138,010 138,010
2016 138,010 138,010
2017 138,010 138,010
2018 - 2022 340,000 680,445 1,020,4452023 - 2024 2,160,000 111,375 2,271,375
$ 2,500,000 $ 1,481,870 $ 3,981,870
The interest rate on the Series 201 OE Bonds ranges from 5.350 percent to 5.500 percent. Theannual debt service requirements are as follows:
Year Ending June 30: Principal Interest Total
2013 $ $ 624,045 $ 624,045
2014 624,045 624,045
2015 624,045 624,045
2016 624,045 624,045
2017 624,045 624,045
2018 - 2022 3,120,225 3,120,2252023 - 2027 4,615,000 2,711,163 7,326,163
2028 - 2031 6,920,000 765,852 7,685,852
$ 11,535,000 $ 9,717,465 $ 21,252,465
(B) On December 28, 1998, the Authority issued $2,730,000 of Series 1998 A priority revenuebonds with a variable interest rate payable monthly. Principal is due in annual amounts eachNovember through 2018. The bond agreement requires the Authority to provide for and collectrevenues of at least 125 percent of the principal and interest due each fiscal year on alloutstanding bonds.
27
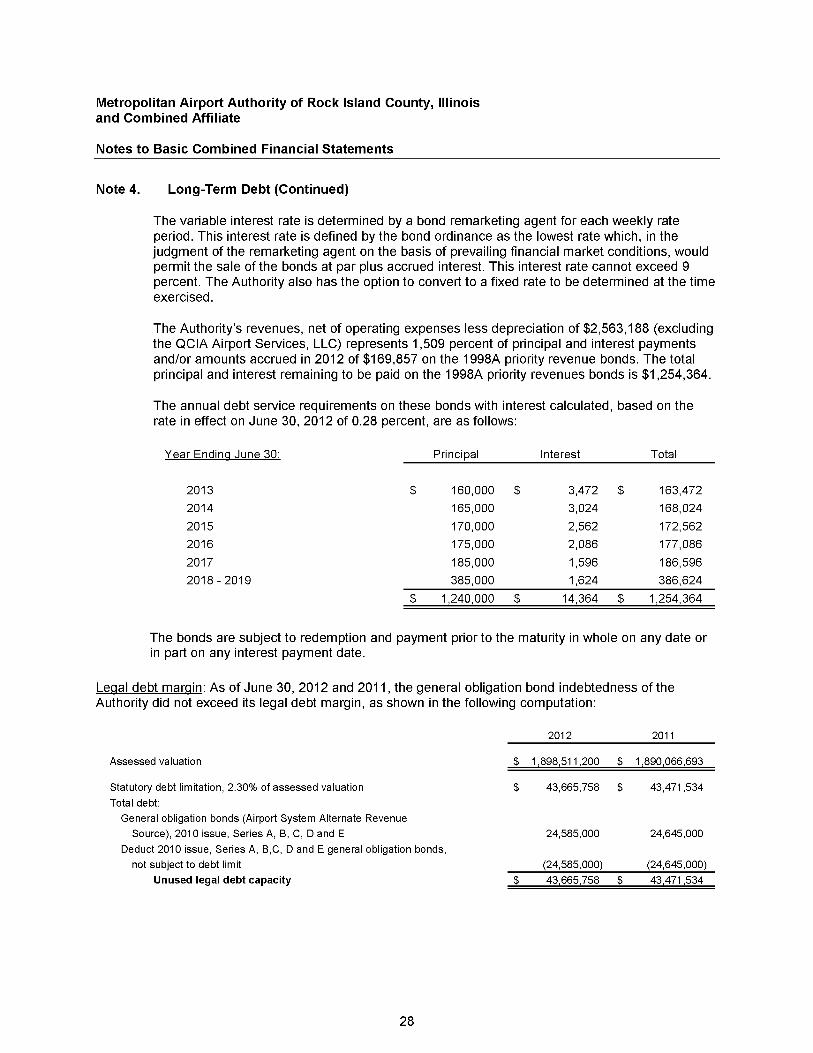
Metropolitan Airport Authority of Rock Island County, Illinoisand Combined Affiliate
Notes to Basic Combined Financial Statements
Note 4. Long-Term Debt (Continued)
The variable interest rate is determined by a bond remarketing agent for each weekly rateperiod. This interest rate is defined by the bond ordinance as the lowest rate which, in thejudgment of the remarketing agent on the basis of prevailing financial market conditions, wouldpermit the sale of the bonds at par plus accrued interest. This interest rate cannot exceed 9percent. The Authority also has the option to convert to a fixed rate to be determined at the timeexercised.
The Authority's revenues, net of operating expenses less depreciation of $2,563,188 (excludingthe QCIA Airport Services, LLC) represents 1,509 percent of principal and interest paymentsand/or amounts accrued in 2012 of $169,857 on the 1998A priority revenue bonds. The totalprincipal and interest remaining to be paid on the 1998A priority revenues bonds is $1,254,364.
The annual debt service requirements on these bonds with interest calculated, based on therate in effect on June 30, 2012 of 0.28 percent, are as follows:
Year Ending June 30: Principal Interest Total
2013 $ 160,000 $ 3,472 $ 163,472
2014 165,000 3,024 168,024
2015 170,000 2,562 172,562
2016 175,000 2,086 177,086
2017 185,000 1,596 186,5962018-2019 385,000 1,624 386,624
$ 1,240,000 $ 14,364 $ 1,254,364
The bonds are subject to redemption and payment prior to the maturity in whole on any date orin part on any interest payment date.
Legal debt margin: As of June 30, 2012 and 2011, the general obligation bond indebtedness of theAuthority did not exceed its legal debt margin, as shown in the following computation:
2012 2011
Assessed valuation $ 1,898,511,200 $ 1,890,066,693
Statutory debt limitation, 2.30% of assessed valuation $ 43,665,758 $ 43,471,534
Total debt:
General obligation bonds (Airport System Alternate RevenueSource), 2010 issue, Series A, B, C, D and E 24,585,000 24,645,000
Deduct 2010 issue, Series A, B,C, D and E general obligation bonds,not subject to debt limit (24,585,000) (24,645,000)
Unused legal debt capacity $ 43,665,758 $ 43,471,534
28

Metropolitan Airport Authority of Rock Island County, Illinoisand Combined Affiliate
Notes to Basic Combined Financial Statements
Note 5. Retirement Fund Commitments
Illinois Municipal Retirement Fund:
Plan description: The Authority's defined benefit pension plan for employees provides retirement anddisability benefits, post retirement increases and death benefits to plan members and beneficiaries. TheAuthority's plan is affiliated with the Illinois Municipal Retirement Fund (IMRF), an agent multiple-employer plan. Benefit provisions are established by statute and may only be changed by the GeneralAssembly of the State of Illinois. IMRF issues a publicly available financial report that includes financialstatements and required supplementary information. That report may be obtained on-line at www.imrf.org.
Funding policy: As set by statute, the Authority's plan members are required to contribute 4.50 percent oftheir annual covered salary. The statutes require employers to contribute the amount necessary, inaddition to member contributions, to finance the retirement coverage of its own employees. The employercontribution rate used by the employer for fiscal years 2012 and 2011 was 10.85 percent and 8.50percent, respectively, of annual covered payroll. The employer's annual required contribution rate forfiscal years 2012 and 2011 was 10.85 percent and 10.09 percent, respectively. The Authority alsocontributes for disability benefits, death benefits and supplemental retirement benefits, all of which arepooled at the IMRF level. Contribution rates for disability and death benefits are set by the IMRF Board ofTrustees, while the supplemental retirement benefits rate is set by statute.
Annual pension: For fiscal year ended June 30, 2012, the Authority's actual contributions for pensioncost was $436,090 while its required contribution for fiscal year 2012 was $383,170. For fiscal year endedJune 30, 2011, the Authority's actual contributions for pension cost was $335,064 while its requiredcontribution for fiscal year 2011 was $387,984.
Three-Year Trend InformationFiscal Year
EndedAnnual Pension
Cost (APC)Percentage of
APC ContributedNet PensionObligation
06/30/201206/30/201106/30/2010
$ 383,170387,984249,264
114%86
100
- %
The required contribution for fiscal year ended June 30, 2012 was determined as part of theDecember 31, 2009, actuarial valuation using the entry age normal actuarial cost method. The actuarialassumptions at December 31,2009, included (a) 7.5 percent investment rate of return (net ofadministrative and direct investment expenses), (b) projected salary increases of 4.00 percent a year,attributable to inflation, (c) additional projected salary increases ranging from 0.4 percent to 10 percentper year depending on age and service, attributable to seniority/merit and (d) postretirement benefitincreases of 3 percent annually. The actuarial value of Authority's plan assets was determined usingtechniques that spread the effects of short-term volatility in the market value of investment over a five-year period with a 20 percent corridor between the actuarial and market value of assets. The Authority'splan unfunded actuarial accrued liability is being amortized as a level percentage of projected payroll onan open 30-year basis.
29
Metropolitan Airport Authority of Rock Island County, Illinoisand Combined Affiliate
Notes to Basic Combined Financial Statements
Note 5. Retirement Fund Commitments (Continued)
The required contribution for fiscal year ended June 30, 2011 was determined as part of theDecember 31, 2008, actuarial valuation using the entry age normal actuarial cost method. The actuarialassumptions at December 31,2008, included (a) 7.5 percent investment rate of return (net ofadministrative and direct investment expenses), (b) projected salary increases of 4.00 percent a year,attributable to inflation, (c) additional projected salary increases ranging from 0.4 percent to 10 percentper year depending on age and service, attributable to seniority/merit and (d) postretirement benefitincreases of 3 percent annually. The actuarial value of Authority's plan assets was determined usingtechniques that spread the effects of short-term volatility in the market value of investment over a five-year period with a 20 percent corridor between the actuarial and market value of assets. The Authority'splan unfunded actuarial accrued liability is being amortized as a level percentage of projected payroll onan open 30-year basis.
Funded status and funding progress as of June 30, 2012: As of December 31,2011, the most recentactuarial valuation date, the plan was 78.93 percent funded. The actuarial accrued liability for benefitswas $9,665,555 and the actuarial value of assets was $7,629,015, resulting in an underfunded actuarialaccrued liability (UAAL) of $2,036,540. The covered payroll (annual payroll of active employees coveredby the plan) was $3,529,495 and the ratio of the UAAL to the covered payroll was 58 percent.
Funded status and funding progress as of June 30, 2011: As of December 31, 2010, the most recentactuarial valuation date, the plan was 80.78 percent funded. The actuarial accrued liability for benefitswas $8,924,852 and the actuarial value of assets was $7,209,870, resulting in an underfunded actuarialaccrued liability (UAAL) of $1 ,714,982. The covered payroll (annual payroll of active employees coveredby the plan) was $3,328,339 and the ratio of the UAAL to the covered payroll was 52 percent.
The schedule of funding progress, presented as RSI following the notes to the financial statements,presents multiyear trend information about whether the actuarial value of plan assets is increasing ordecreasing over time relative to the actuarial accrued liability for benefits.
Note 6. Leasing Activities
The Authority's leasing operations are accounted for as operating leases and consist primarily of spacerentals and landing fees which are governed by written agreements. These agreements range frommonth-to-month leases to long-term leases with various specified terms. Some of these lease agreementscontain cancelable conditions which eliminate any future guaranteed rentals or are contingent upon theincome produced by the lessee.
Certain long-term agreements are industrial site leases which have terms that are subject to restrictionsand covenants on the permitted use and performance standards of the property.
The Authority also leases land and building space under various long-term leases which expire betweenOctober 2012 and May 2037.
30

Metropolitan Airport Authority of Rock Island County, Illinoisand Combined Affiliate
Notes to Basic Combined Financial Statements
Note 6. Leasing Activities (Continued)
The following is a schedule by years of the future minimum lease rentals to be received under theseleases as of June 30:
During the year ending June 30:
2013
2014
2015
2016
20172018 - 2022
2023 - 2027
2028 - 2032
2033 - 2037
Total future minimum lease rentals to be received
$ 2,320,181
2,149,641
1,937,387
1,193,179
475,961
1,690,340
994,695
778,580
236,542
$ 11,776,506
Note 7. Deferred Compensation Plan
The Authority offers its employees a deferred compensation plan created in accordance with InternalRevenue Code Section 457(b). The plan, available to all Authority employees, permits them to defer aportion of their salary until future years.
Note 8. Commitments
As of June 30, 2012, the Authority has financial commitments related to various construction projectstotaling approximately $3,347,938. The contracts will be paid with federal and state grants, passengerfacility charges and operating proceeds.
Note 9. Risk Management
The Authority provides self-insured health and dental benefits to substantially all of its employees andtheir immediate families. Self-insurance is in effect up to a stop loss amount of $70,000 per coveredperson with an aggregate annual ceiling of approximately $537,567, excluding lasered individuals.Coverage for all claims in excess of the stop loss amounts has been obtained from private insurancecompanies. The claim administration procedures are performed by an independent claims administrator.Liabilities are reported when it is probable that a loss has occurred and the amount of the loss can bereasonably estimated. Claims payable include all known claims and an amount for claims that have beenincurred but not reported (IBNR). Claim liabilities are estimated by considering the effects of inflation,recent claim settlement trends, including frequency and amount of pay-outs and other economic andsocial factors. The changes in the aggregate liabilities for claims included in claims payable for the yearended June 30, 2012 and claims receivable for the year ended June 30, 2011, are as follows:
Claims payable, beginning of yearClaims incurredClaim payments
Claims payable (receivable), end of year
2012 2011
$ 50,969 $ (134,640)487,076 557,461(478,045) (371,852)
$ 60,000 $ 50,969
31
Metropolitan Airport Authority of Rock Island County, Illinoisand Combined Affiliate
Notes to Basic Combined Financial Statements
Note 9. Risk Management (Continued)
As of June 30, 2011 the Authority had re-insurance receivables totaling $34,031 which were nettedagainst claims payable amounts of $85,000 for a net payable of $50,969.
The Authority is also self-insured for unemployment compensation claims. Unemployment compensationis charged quarterly as the state assesses the Authority based upon actual claims paid.
The Authority is exposed to various risks of loss related to theft, damage to or the destruction of assets.These risks are covered by the purchase of commercial insurance. The Authority's liability insurancecarrier does not provide coverage for perils of war or terrorism. Settled claims have not exceededcommercial insurance coverage in any of the past three fiscal years.
Note 10. Industrial Revenue Bonds
The Authority has issued Industrial Revenue Bonds to provide financial assistance to private sectorentities for the acquisition and construction of industrial and commercial facilities deemed to be in thepublic interest. The bonds are secured by the property financed and are payable solely from paymentsreceived on the underlying mortgage loans. Upon repayment of the bonds, ownership of the acquiredfacilities transfers to the private sector entity served by the bond issuance. Neither the Authority, thestate, nor any political subdivision thereof is obligated in any manner for repayment of the bonds.Accordingly, the bonds are not reported as liabilities in the accompanying financial statements.
As of June 30, 2012 and 2011, there was one series of Industrial Revenue Bonds outstanding with aprincipal amount outstanding of approximately $2,200,000.
Note 11. Other Postemployment Benefits (OPEB)
Plan description: The Authority sponsors a single-employer, self-insured, health care plan that providesmedical benefits to employees and retirees. Retiree coverage begins at IMRF retirement age of at least55 and continues until the retiree is medicare eligible. The plan does not issue a stand-alone financialreport.
Funding policy: Health insurance plan contributions on behalf of the employee are negotiated bymanagement and the union and governed by the Authority's union contract. Employees pay a portion ofthe health insurance costs and the Authority pays the remainder. Retirees are required to pay the samepremiums as those charged to COBRA participants. Those rates are calculated as 125 percent of theexpected costs based on the entire population covered.
Annual OPEB cost and net OPEB obligation: The Authority's annual other postemployment benefit(OPEB) cost (expense) was calculated by an actuary based on the annual required contribution (ARC) ofthe employer, an amount actuarially determined in accordance to the parameters of GASB Statement No.45. The ARC represents a level of funding that, if paid on an ongoing basis, is projected to cover thenormal cost each year and amortize any unfunded actuarial liabilities over a period not to exceed 30years. The Authority has recorded an OPEB cost (expense) of the entire projected actuarial accruedliability of $47,900 as of June 30, 2012 and June 30, 2011.
32

Metropolitan Airport Authority of Rock Island County, Illinoisand Combined Affiliate
Notes to Basic Combined Financial Statements
Note 11. Other Postemployment Benefits (OPEB) (Continued)
The Authority's annual OPES cost, percentage of annual OPES cost contributed to the plan and the netOPES obligations for 2012 and the two preceding years follows:
Percentage ofAnnual Annual OPES Net OPES
Fiscal Year Ended OPES Cost Cost Contributed Obligation
06/30/2012 $ 4,902 46.2% $ 47,90006/30/2011 4,902 46.2 47,90006/30/2010 4,902 46.2 47,900
Funded status and funding progress as of June 30, 2012 and 2011: As of June 30, 2010, the most recentactuarial valuation date, the actuarial accrued liability for benefits for fiscal years ending 2012 and 2011 of$47,900 was unfunded. The covered payroll (annual payroll of active employees covered by the plan) forfiscal years 2012 and 2011 was $3,529,495 and $3,328,339 and the ratio of the unfunded actuarialaccrued liability to the covered payroll was 1.36 percent and 1.44 percent, respectively.
Actuarial valuations of an ongoing plan involve estimates of the value of reported amounts andassumptions about the probability of occurrence of events far into the future. Examples includeassumptions about future employment, mortality and the health care cost trend. Amounts determinedregarding the funded status of the plan and the annual required contributions of the employer are subjectto continual revision as actual results are compared with past expectations and new estimates are madeabout the future. The schedule of funding progress, presented as required supplementary informationfollowing the notes to the financial statements, presents multiyear trend information about whether theactuarial value of plan assets is increasing or decreasing over time relative to the actuarial accruedliabilities for benefits.
Actuarial method and assumptions: Projections of benefits for financial reporting purposes are based onthe substantive plan (the plan as understood by the employer and the plan members) and included thetypes of benefits provided at the time of each valuation and the historical pattern of sharing of benefitscosts between the employer and plan members to that point. The actuarial methods and assumptionsused include techniques that are designed to reduce the effects of short-term volatility in actuarialaccrued liabilities and the actuarial value of assets, consistent with the long-term perspective of thecalculations.
As of June 30, 2010, actuarial valuation date, entry age actuarial cost method was used. The actuarialassumptions included a 5 percent investment rate of return which is based on the expected long-terminvestment return of the employer's own investments used to pay plan benefits and a 3 percent inflationrate and an initial annual health care cost inflation rate of 8 percent initially, grading down to an ultimaterate of 6 percent. The Authority's unfunded actuarial accrued liability is being amortized as a levelpercentage of payroll on an open basis.
33

Metropolitan Airport Authority of Rock Island County, Illinoisand Combined Affiliate
Notes to Basic Combined Financial Statements
Note 12. Pending Pronouncements
As of June 30, 2012, the GASB has issued the following Statements not yet implemented by theAuthority. The Statements which might impact the Authority are as follows:
• GASB Statement No. 60, Accounting and Financial Reporting for Service ConcessionArrangements, issued November 2010, will be effective for the Authority beginning with its yearending June 30, 2013. This Statement is intended to improve financial reporting by addressingissues related to service concession arrangements (SCAs), which are a type of public-private orpublic-public partnership. Specifically, this Statement improves financial reporting by establishingrecognition, measurement and disclosure requirements SCAs for both transferors andgovernmental operators, requiring governments to account for and report SCAs in the samemanner, which improves the comparability of financial statements. This Statement also improvesthe decision usefulness of financial reporting by requiring that specific relevant disclosures bemade by transferors and governmental operators about SCAs.
• GASB Statement No. 61, The Financial Reporting Entity: Omnibus an amendment of GASBStatements No. 14 and No. 34, issued November 201 0, will be effective for the Authoritybeginning with its year ending June 30, 2013. This Statement is intended to improve financialreporting for a governmental financial reporting entity by improving guidance for including,presenting, and disclosing information about component units and equity interest transactions of afinancial reporting entity. The amendments to the criteria for including component units allow usersof financial statements to better assess the accountability of elected officials by ensuring that thefinancial reporting entity includes only organizations for which the elected officials are financiallyaccountable or that are determined by the government to be misleading to exclude. Theamendments to the criteria for blending also improve the focus of a financial reporting entity on theprimary government by ensuring that the primary government includes only those component unitsthat are so intertwined with the primary government that they are essentially the same as theprimary government, and by clarifying which component units have that characteristic.
• GASB Statement No. 62, Codification of Accounting and Financial Reporting Guidance Containedin Pre-November 30, 1989 FASB and AICPA Pronouncements, issued January 2011, will beeffective for the Authority beginning with its year ending June 30, 2013. This Statement is intendedto enhance the usefulness of the Codification of Governmental Accounting and FinancialReporting Standards by incorporating guidance that previously could only be found in certainFASB and AICPA pronouncements. This Statement incorporates into the GASB's authoritativeliterature the applicable guidance previously presented in the following pronouncements issuedbefore November 30, 1989: FASB Statements and Interpretations, Accounting Principles BoardOpinions, and Accounting Research Bulletins of the AICPA's Committee on AccountingProcedure. By incorporating and maintaining this guidance in a single source, the GASB believesthat GASB 62 reduces the complexity of locating and using authoritative literature needed toprepare state and local government financial reports.
34

Metropolitan Airport Authority of Rock Island County, Illinoisand Combined Affiliate
Notes to Basic Combined Financial Statements
Note 12. Pending Pronouncements (Continued)
• GASB Statement No. 63, Financial Reporting of Deferred Outflows of Resources, Deferred Inflowsof Resources, and Net Position, issued July 2011, will be effective for the Authority beginning withits year ending June 30, 2013. This Statement is intended to improve financial reporting byproviding citizens and other users of state and local government financial reports with informationabout how past transactions will continue to impact a government's financial statements in thefuture. This Statement provides a new statement of net position format to report all assets,deferred outflows of resources, liabilities deferred inflows of resources, and net position (which isthe net residual amount of the other elements). The Statement requires that deferred outflows ofresources and deferred inflows of resources be reported separately from assets and liabilities.This Statement also amends certain provisions of Statement No. 34, Basic Financial Statements-and Management's Discussion and Analysis-for State and Local Governments, and relatedpronouncements to reflect the residual measure in the statement of financial position as netposition, rather than net assets.
• GASB Statement No. 65, Items Previously Reported as Assets and Liabilities, issued April 2012,will be effective for the Authority beginning with its year ending June 30, 2014. This Statementclarifies the appropriate reporting of deferred outflows of resources and deferred inflows ofresources to ensure consistency in financial reporting. GASB Concepts Statement (CON) No.4,Elements of Financial Statements, specifies that recognition of deferred outflows and deferredinflows should be limited to those instances specifically identified in authoritative GASBpronouncements. Consequently, guidance was needed to determine which balances beingreported as assets and liabilities should actually be reported as deferred outflows of resources ordeferred inflows of resources, according to the definitions in CON 4. Based on those definitions,this Statement reclassifies certain items currently being reported as assets and liabilities asdeferred outflows of resources and deferred inflows of resources. In addition, the Statementrecognizes certain items currently being reported as assets and liabilities as outflows of resourcesand inflows of resources.
• GASB Statement No. 66, Technical Corrections - 2012, issued April 2012, will be effective for theAuthority beginning with its year ending June 30, 2014. This Statement enhances the usefulnessof financial reports by resolving conflicting accounting and financial reporting guidance that coulddiminish the consistency of financial reporting. This Statement amends GASB Statement No.1 0,Accounting and Financial Reporting for Risk Financing and Related Insurance Issues, byremoving the provision that limits fund-based reporting of a state or local government's riskfinancing activities to the general fund and the internal service fund types. As a result,governments would base their decisions about governmental fund type usage for risk financingactivities on the definitions in GASB Statement No. 54, Fund Balance Reporting andGovernmental Fund Type Definitions. This Statement also amends GASB Statement No. 62,Codification of Accounting and Financial Reporting Guidance Contained in Pre-November 30,1989 FASB and AICPA Pronouncements, by modifying the specific guidance on accounting for:(a) operating lease payments that vary from a straight-line basis; (b) the difference between theinitial investment (purchase price) and the principal amount of a purchased loan or group of loans;and (c) servicing fees related to mortgage loans that are sold when the stated service fee ratediffers significantly from a current (normal) servicing fee rate. These changes would eliminate anyuncertainty regarding the application of GASB Statement No. 13, Accounting for Operating Leaseswith Scheduled Rent Increases, and result in guidance that is consistent with the requirements inGASB Statement No. 48, Sales and Pledges of Receivables and Future Revenues and Intra-EntityTransfers of Assets and Future Revenues, respectively.
35
Metropolitan Airport Authority of Rock Island County, Illinoisand Combined Affiliate
Notes to Basic Combined Financial Statements
Note 12. Pending Pronouncements (Continued)
• GASB Statement No. 67, Financial Reporting for Pension Plans, issued June 2012, will beeffective for the Authority beginning with its year ending June 30, 2014. This Statement replacesthe requirements of GASB Statement No. 25, Financial Reporting for Defined Benefit PensionPlans and Note Disclosures for Defined Contribution Plans, and GASB Statement No. 50, PensionDisclosures, as they relate to pension plans that are administered through trusts or similararrangements meeting certain criteria. This Statement builds upon the existing framework forfinancial reports of defined benefit pension plans, which includes a statement of fiduciary netposition (the amount held in a trust for paying retirement benefits) and a statement of changes infiduciary net position. This Statement enhances note disclosures and required supplementaryinformation for both defined benefit and defined contribution pension plans. This Statement alsorequires the presentation of new information about annual money-weighted rates of return in thenotes to the financial statements and in 1O-year required supplementary information schedules.
• GASB Statement No. 68, Accounting and Financial Reporting for Pensions, issued June 2012, willbe effective for the Authority beginning with its year ending June 30, 2015. This Statementreplaces the requirements of GASB Statement No. 27, Accounting for Pensions by State andLocal Governmental Employers, and GASB Statement No. 50, Pension Disclosures, as they relateto governments that provide pensions through pension plans administered as trusts or similararrangements that meet certain criteria. This Statement requires governments providing definedbenefit pensions to recognize their long-term obligation for pension benefits as a liability for thefirst time, and to more comprehensively and comparably measure the annual costs of pensionbenefits. This Statement also enhances accountability and transparency through revised and newnote disclosures and required supplementary information.
The Authority's management has not yet determined the effect these Statements will have on theAuthority's financial statements.
Note 13. Subsequent Event
The Authority entered into a ground lease agreement on August 1, 2012 with a lessee to build a newhotel on Airport land subject to certain contingencies. Rent will commence at the end of the twelve-monthperiod following the lessee's contingency date. Rent will be collected at a minimum monthly amount of 7.5percent of the appraised value of the property, currently calculated at $3,812.50 per month or 2.3 percentof monthly gross receipts, whichever is greater. Annual rent shall be subject to review and reappraisalevery 5 years. The lease term is 30 years with three 1O-year options and two additional 5-year options.
36
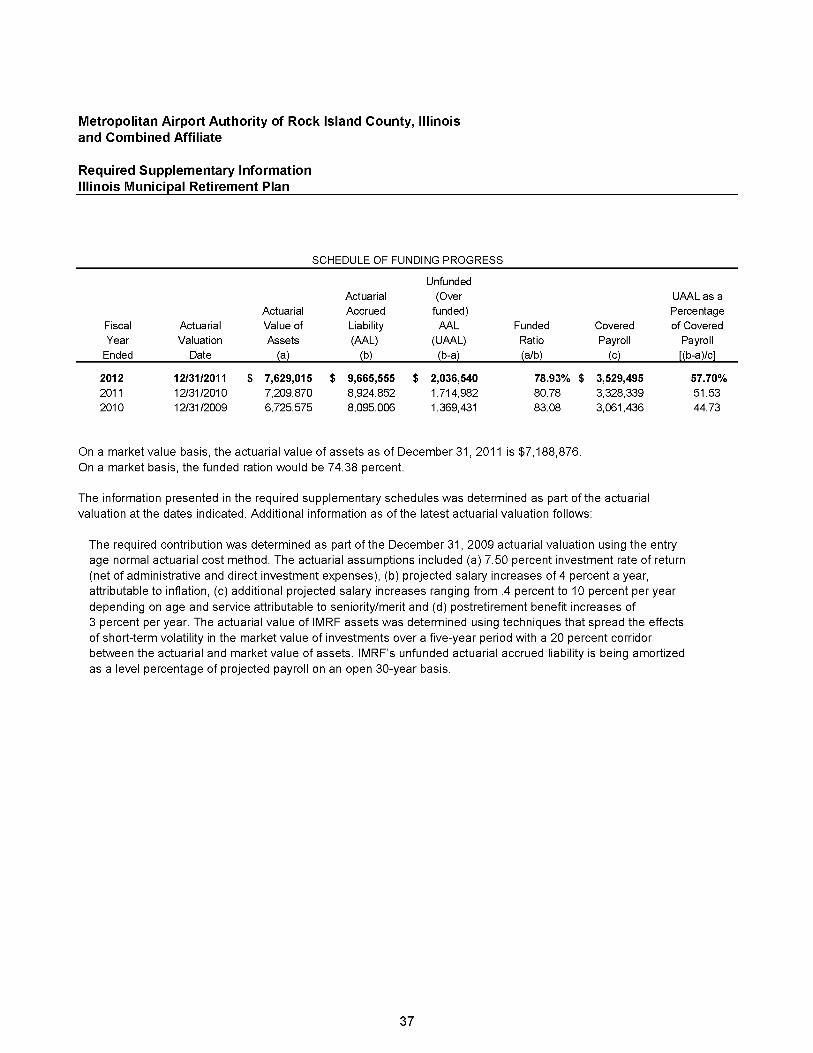
Metropolitan Airport Authority of Rock Island County, Illinoisand Combined Affiliate
Required Supplementary InformationIllinois Municipal Retirement Plan
SCHEDULE OF FUNDING PROGRESS
UnfundedActuarial (Over UAAL as a
Actuarial Accrued funded) PercentageFiscal Actuarial Value of Liability AAL Funded Covered of CoveredYear Valuation Assets (AAL) (UAAL) Ratio Payroll PayrollEnded Date (a) (b) (b-a) (alb) (c) [(b-a)/c]
2012 12/3112011 $ 7,629,015 $ 9,665,555 $ 2,036,540 78.93% $ 3,529,495 57.70%2011 12131/2010 7,209,870 8,924,852 1,714,982 80.78 3,328,339 51.532010 12131/2009 6,725,575 8,095,006 1,369,431 83.08 3,061,436 44.73
On a market value basis, the actuarial value of assets as of December 31, 2011 is $7,188,876.On a market basis, the funded ration would be 74.38 percent.
The information presented in the required supplementary schedules was determined as part of the actuarialvaluation at the dates indicated. Additional information as of the latest actuarial valuation follows:
The required contribution was determined as part of the December 31, 2009 actuarial valuation using the entryage normal actuarial cost method. The actuarial assumptions included (a) 7.50 percent investment rate of return(net of administrative and direct investment expenses), (b) projected salary increases of 4 percent a year,attributable to inflation, (c) additional projected salary increases ranging from .4 percent to 10 percent per yeardepending on age and service attributable to seniority/merit and (d) postretirement benefit increases of3 percent per year. The actuarial value of IMRF assets was determined using techniques that spread the effectsof short-term volatility in the market value of investments over a five-year period with a 20 percent corridorbetween the actuarial and market value of assets. IMRF's unfunded actuarial accrued liability is being amortizedas a level percentage of projected payroll on an open 30-year basis.
37

Metropolitan Airport Authority of Rock Island County, Illinoisand Combined Affiliate
Required Supplementary InformationMetropolitan Airport Authority Health Benefit Plan
SCHEDULE OF FUNDING PROGRESS
Actuarial UAAL as aActuarial Accrued Percentage
Fiscal Actuarial Value of Liability Unfunded Funded Covered of CoveredYear Valuation Assets (AAL) (UAAL) Ratio Payroll PayrollEnded Date (a) (b) (b-a) (alb) (c) [(b-a)/c]
2012 06/3012010 $ $ 47,900 $ 47,900 -% $ 3,529,495 1.36%2011 06/30/2010 47,900 47,900 3,328,339 1.44
2010 06/30/2010 47,900 47,900 3,061,436 1.56
The information presented in the required supplementary schedule was determined as part of the actuarial valuationas of June, 2010. Additional information follows:
a. The actuarial method used to determine the ARC is the entry age actuarial cost method.b. There are no plan assets.c. The actuarial assumptions included: (a) 5 percent investment rate of return which includes 3 percent inflation rate and
(b) an initial 8 percent health care inflation rate declining down to a 6 percent ultimate rate.d. The amortization method is level percentage of pay on an open basis.
38

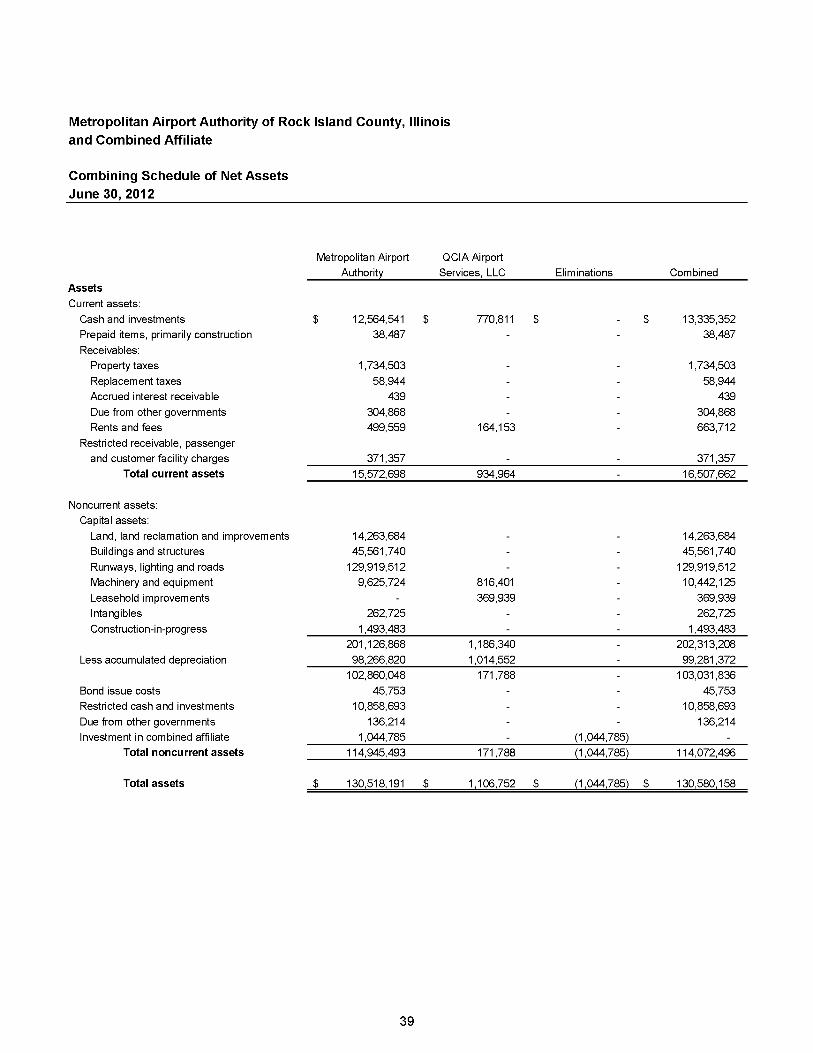
Metropolitan Airport Authority of Rock Island County, Illinoisand Combined Affiliate
Combining Schedule of Net AssetsJune 30, 2012
Metropolitan Airport QCIA AirportAuthority Services, LLC Eliminations Combined
AssetsCurrent assets:
Cash and investments $ 12,564,541 $ 770,811 $ $ 13,335,352Prepaid items, primarily construction 38,487 38,487
Receivables:Property taxes 1,734,503 1,734,503
Replacement taxes 58,944 58,944Accrued interest receivable 439 439
Due from other governments 304,868 304,868Rents and fees 499,559 164,153 663,712
Restricted receivable, passengerand customer facility charges 371,357 371,357
Total current assets 15,572,698 934,964 16,507,662
Noncurrent assets:Capital assets:
Land, land reclamation and improvements 14,263,684 14,263,684Buildings and structures 45,561,740 45,561,740
Runways, lighting and roads 129,919,512 129,919,512Machinery and equipment 9,625,724 816,401 10,442,125
Leasehold improvements 369,939 369,939Intangibles 262,725 262,725
Construction-in-progress 1,493,483 1,493,483
201,126,868 1,186,340 202,313,208
Less accumulated depreciation 98,266,820 1,014,552 99,281,372102,860,048 171,788 103,031,836
Bond issue costs 45,753 45,753Restricted cash and investments 10,858,693 10,858,693
Due from other governments 136,214 136,214Investment in combined affiliate 1,044,785 (1,044,785)
Total noncurrent assets 114,945,493 171,788 (1,044,785) 114,072,496
Total assets $ 130,518,191 $ 1,106,752 $ (1 ,044,785) $ 130,580,158
39

Metropolitan Airport QCIA AirportAuthority Services, LLC Eliminations Combined
LiabilitiesCurrent liabilities:
Current portion, long-term debt $ 1,070,000 $ $ $ 1,070,000Accounts payable 731,789 26,976 758,765
Accrued compensated absences 210,159 23,787 233,946Accrued salaries and wages 133,533 11,204 144,737
Accrued Interest 103,718 103,718Unearned revenue 900,609 900,609
Claims payable 60,000 60,000Due to other governments
Other 875 875Total current liabilities 3,210,683 61,967 3,272,650
Noncurrent liabilities:
Long-term debtOther post employment benefits
Total noncurrent liabilities
24,744,96047,900
24,744,96047,900
24,792,860 24,792,860
Net AssetsInvested in capital assets, net of related debt 82,503,015 171,788 82,674,803
Restricted for Airport facilities 5,772,123 5,772,123Unrestricted 14,239,510 872,997 (1,044,785) 14,067,722
Total net assets 102,514,648 1,044,785 (1,044,785) 102,514,648
Total liabilities and net assets $ 130,518,191 $ 1,106,752 $ (1 ,044,785) $ 130,580,158
40
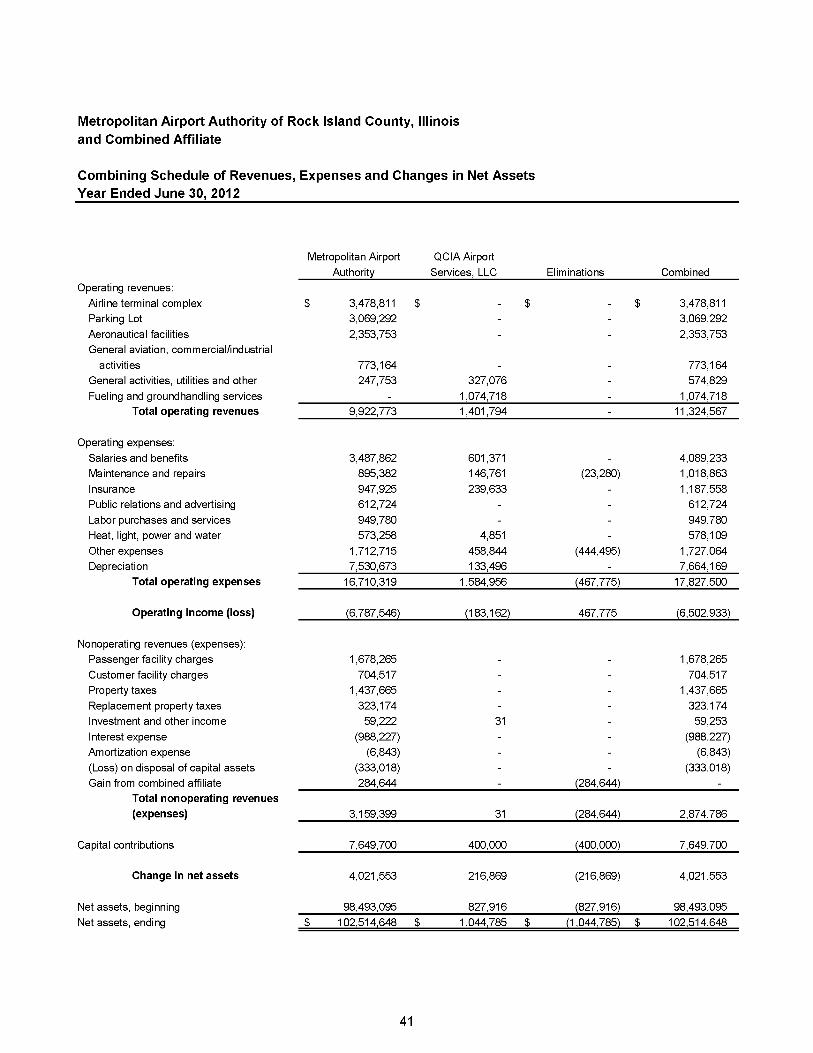
Metropolitan Airport Authority of Rock Island County, Illinoisand Combined Affiliate
Combining Schedule of Revenues, Expenses and Changes in Net AssetsYear Ended June 30, 2012
Metropolitan Airport QCIA Airport
Authority Services, LLC Eliminations CombinedOperating revenues:
Airline terminal complex $ 3,478,811 $ $ $ 3,478,811
Parking Lot 3,069,292 3,069,292
Aeronautical facilities 2,353,753 2,353,753General aviation, commercial/industrial
activities 773,164 773,164General activities, utilities and other 247,753 327,076 574,829
Fueling and ground handling services 1,074,718 1,074,718Total operating revenues 9,922,773 1,401,794 11,324,567
Operating expenses:
Salaries and benefits 3,487,862 601,371 4,089,233Maintenance and repairs 895,382 146,761 (23,280) 1,018,863
Insurance 947,925 239,633 1,187,558Public relations and advertising 612,724 612,724
Labor purchases and services 949,780 949,780Heat, light, power and water 573,258 4,851 578,109
Other expenses 1,712,715 458,844 (444,495) 1,727,064Depreciation 7,530,673 133,496 7,664,169
Total operating expenses 16,710,319 1,584,956 (467,775) 17,827,500
Operating income (loss) (6,787,546) (183,162) 467,775 (6,502,933)
Nonoperating revenues (expenses):Passenger facility charges 1,678,265 1,678,265
Customer facility charges 704,517 704,517Property taxes 1,437,665 1,437,665
Replacement property taxes 323,174 323,174Investment and other income 59,222 31 59,253
Interest expense (988,227) (988,227)Amortization expense (6,843) (6,843)
(Loss) on disposal of capital assets (333,018) (333,018)Gain from combined affiliate 284,644 (284,644)
Total nonoperating revenues(expenses) 3,159,399 31 (284,644) 2,874,786
Capital contributions 7,649,700 400,000 (400,000) 7,649,700
Change in net assets 4,021,553 216,869 (216,869) 4,021,553
Net assets, beginning 98,493,095 827,916 (827,916) 98,493,095
Net assets, ending $ 102,514,648 $ 1,044,785 $ (1,044,785) $ 102,514,648
41

Metropolitan Airport Authority of Rock Island County, Illinoisand Combined Affiliate
Schedule of Other ExpensesYears Ended June 30, 2012 and 2011
2012 2011
Employee benefits and payroll taxes $ 757,855 $ 655,075
Engineering and consulting services 149,366 187,036
General supplies and uniforms 131,696 128,294
Travel and training 100,428 94,368
Professional fees 227,354 179,690
Office supplies 12,909 12,181
Telephone and computer 233,835 192,313
Dues and subscriptions 42,505 37,392
Property taxes 20,985 22,162
Postage 5,301 5,386
Miscellaneous 44,830 50,867
$ 1,727,064 $ 1,564,764
42


Metropolitan Airport Authority of Rock Island County, Illinoisand Combined Affiliate
Statistical SectionContents
The statistical section of the Authority's comprehensive annual financial report presents detailed information
as a context for understanding what the information presented in the financial statements, note disclosures
and required supplementary information say about the Authority's overall financial health.
Contents Page
Financial TrendsThese schedules contain trend information to help the reader understand
how the Authority's financial performance and well being have changed
over time.
44 - 45
Revenue CapacityThese schedules contain information to help the reader assess the Authority's
most significant local revenue sources, the property tax (or sales tax).
46 - 51
Debt CapacityThese schedules present information to help the reader assess the
affordability of the Authority's current level of outstanding debt and the Authority's
ability to issue additional debt in the future.
52 - 55
Demographic and Economic InformationThese schedules offer demographic and economic indicators to help the
reader understand the environment within which the Authority's financial
activities take place.
56 - 58
Operating InformationThese schedules contain service and infrastructure data to help the reader
understand how the information in the Authority's financial report relates to the
services the Authority provides and the activities it performs.
59 - 69
Sources: Unless otherwise noted, the information in these schedules is derived from the
comprehensive annual financial report for the relevant year.
43
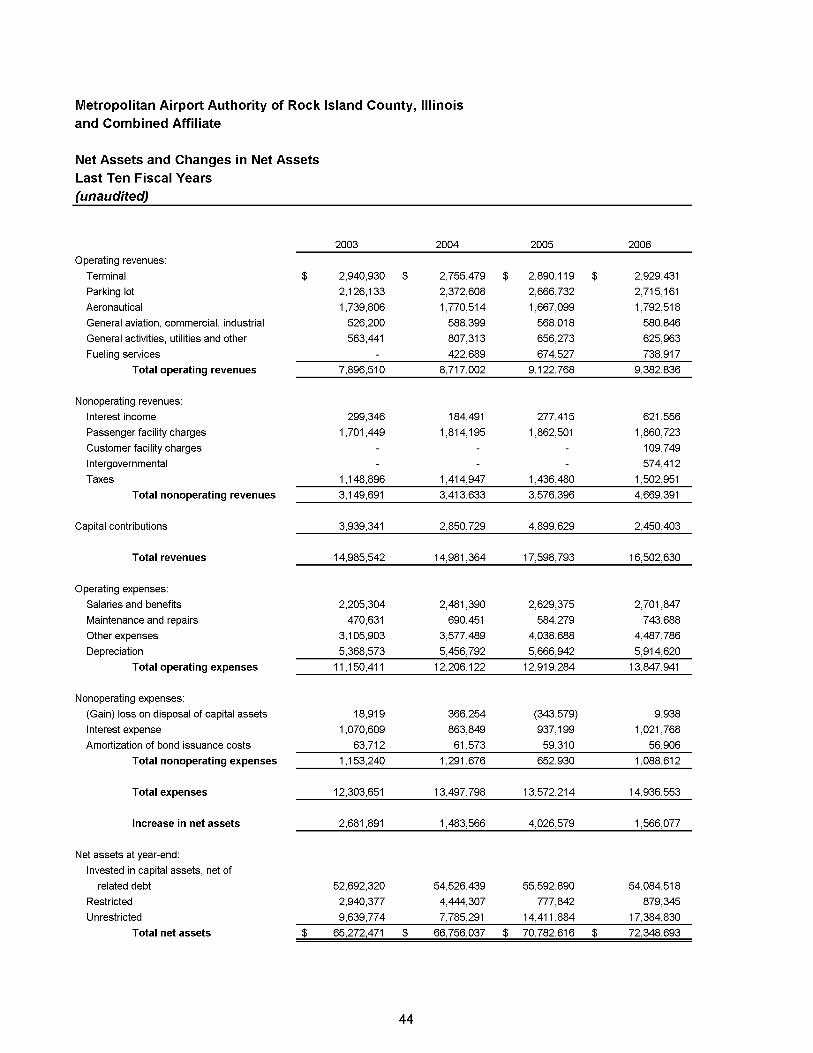
Metropolitan Airport Authority of Rock Island County, Illinoisand Combined Affiliate
Net Assets and Changes in Net AssetsLast Ten Fiscal Years(unaudited)
2003 2004 2005 2006
Operating revenues:
Terminal $ 2,940,930 $ 2,755,479 $ 2,890,119 $ 2,929,431
Parking lot 2,126,133 2,372,608 2,666,732 2,715,161
Aeronautical 1,739,806 1,770,514 1,667,099 1,792,518
General aviation, commercial, industrial 526,200 588,399 568,018 580,846
General activities, utilities and other 563,441 807,313 656,273 625,963
Fueling services 422,689 674,527 738,917
Total operating revenues 7,896,510 8,717,002 9,122,768 9,382,836
Nonoperating revenues:
Interest income 299,346 184,491 277,415 621,556
Passenger facility charges 1,701,449 1,814,195 1,862,501 1,860,723
Customer facility charges 109,749
Intergovernmental 574,412
Taxes 1,148,896 1,414,947 1,436,480 1,502,951
Total nonoperating revenues 3,149,691 3,413,633 3,576,396 4,669,391
Capital contributions 3,939,341 2,850,729 4,899,629 2,450,403
Total revenues 14,985,542 14,981,364 17,598,793 16,502,630
Operating expenses:
Salaries and benefits 2,205,304 2,481,390 2,629,375 2,701,847
Maintenance and repairs 470,631 690,451 584,279 743,688
Other expenses 3,105,903 3,577,489 4,038,688 4,487,786
Depreciation 5,368,573 5,456,792 5,666,942 5,914,620
Total operating expenses 11,150,411 12,206,122 12,919,284 13,847,941
Nonoperating expenses:
(Gain) loss on disposal of capital assets 18,919 366,254 (343,579) 9,938
Interest expense 1,070,609 863,849 937,199 1,021,768
Amortization of bond issuance costs 63,712 61,573 59,310 56,906
Total nonoperating expenses 1,153,240 1,291,676 652,930 1,088,612
Total expenses 12,303,651 13,497,798 13,572,214 14,936,553
Increase in net assets 2,681,891 1,483,566 4,026,579 1,566,077
Net assets at year-end:
Invested in capital assets, net of
related debt 52,692,320 54,526,439 55,592,890 54,084,518
Restricted 2,940,377 4,444,307 777,842 879,345
Unrestricted 9,639,774 7,785,291 14,411,884 17,384,830
Total net assets $ 65,272,471 $ 66,756,037 $ 70,782,616 $ 72,348,693
44
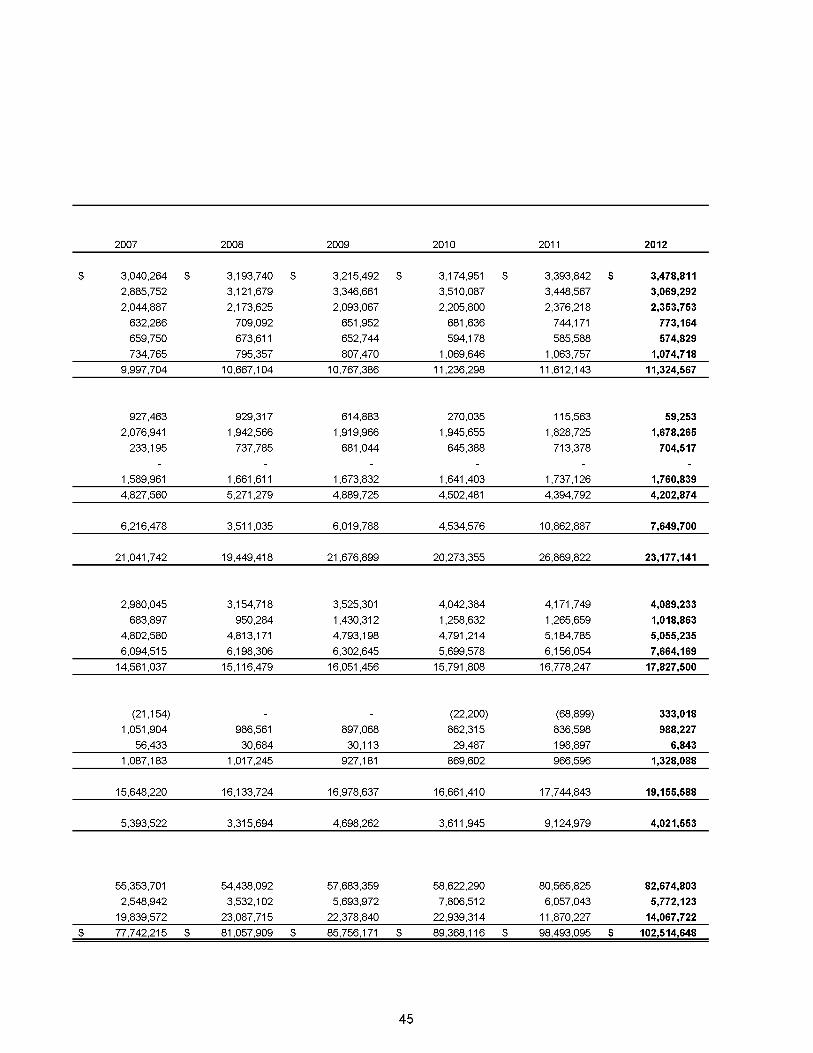
2007 2008 2009 2010 2011 2012
$ 3,040,264 $ 3,193,740 $ 3,215,492 $ 3,174,951 $ 3,393,842 $ 3,478,8112,885,752 3,121,679 3,346,661 3,510,087 3,448,567 3,069,2922,044,887 2,173,625 2,093,067 2,205,800 2,376,218 2,353,753
632,286 709,092 651,952 681,636 744,171 773,164659,750 673,611 652,744 594,178 585,588 574,829734,765 795,357 807,470 1,069,646 1,063,757 1,074,718
9,997,704 10,667,104 10,767,386 11,236,298 11,612,143 11,324,567
927,463 929,317 614,883 270,035 115,563 59,2532,076,941 1,942,566 1,919,966 1,945,655 1,828,725 1,678,265
233,195 737,785 681,044 645,388 713,378 704,517
1,589,961 1,661,611 1,673,832 1,641,403 1,737,126 1,760,8394,827,560 5,271,279 4,889,725 4,502,481 4,394,792 4,202,874
6,216,478 3,511,035 6,019,788 4,534,576 10,862,887 7,649,700
21,041,742 19,449,418 21,676,899 20,273,355 26,869,822 23,177,141
2,980,045 3,154,718 3,525,301 4,042,384 4,171,749 4,089,233683,897 950,284 1,430,312 1,258,632 1,265,659 1,018,863
4,802,580 4,813,171 4,793,198 4,791,214 5,184,785 5,055,2356,094,515 6,198,306 6,302,645 5,699,578 6,156,054 7,664,169
14,561,037 15,116,479 16,051,456 15,791,808 16,778,247 17,827,500
(21,154) (22,200) (68,899) 333,0181,051,904 986,561 897,068 862,315 836,598 988,227
56,433 30,684 30,113 29,487 198,897 6,8431,087,183 1,017,245 927,181 869,602 966,596 1,328,088
15,648,220 16,133,724 16,978,637 16,661,410 17,744,843 19,155,588
5,393,522 3,315,694 4,698,262 3,611,945 9,124,979 4,021,553
55,353,701
2,548,942
19,839,572
54,438,092
3,532,102
23,087,715
57,683,359
5,693,972
22,378,840
58,622,290
7,806,512
22,939,314
80,565,825
6,057,043
11,870,227
82,674,8035,772,123
14,067,722$ 77,742,215 $ 81,057,909 $ 85,756,171 $ 89,368,116 $ 98,493,095 $ 102,514,648
45

Metropolitan Airport Authority of Rock Island County, Illinoisand Combined Affiliate
Principal Revenue Sources and Revenues Per Enplaned PassengerLast Ten Fiscal Years(unaudited)
2003 2004 2005 2006
Airline revenues:
Landing Fees $ 1,321,150 $ 1,301,978 $ 1,241,336 $ 1,316,940
Terminal Rents 1,287,353 1,169,387 1,233,416 1,233,839
Total airline revenues 2,608,503 2,471,365 2,474,752 2,550,779
Percentage of total revenues 23.6% 20.4% 19.5% 18.2%
Nonairline revenues:
Parking 2,125,994 2,372,608 2,666,847 2,715,161
Rental Cars 944,240 1,016,650 1,106,845 1,145,201
Other 2,217,773 2,856,379 2,874,324 2,971,695
Total nonairline revenues 5,288,007 6,245,637 6,648,016 6,832,057
Percentage of total revenues 47.9% 51.5% 52.4% 48.6%
Non operating revenues:
Passenger and customer facility charges 1,701,449 1,814,195 1,862,501 1,970,472
Interest 299,346 184,491 277,415 621,556
Other, primarily taxes 1,148,896 1,414,947 1,436,480 2,077,363
Total nonoperating revenues 3,149,691 3,413,633 3,576,396 4,669,391
Percentage of total revenues 28.5% 28.1% 28.2% 33.2%
Total revenues $ 11,046,201 $ 12,130,635 $ 12,699,164 $ 14,052,227
Enplaned Passengers 400,047 418,502 443,205 445,549
Total revenue per enplanedpassenger $ 27.61 $ 28.99 $ 28.65 $ 31.54
Airline revenue per enplaned passenger $ 6.52 $ 5.91 $ 5.58 $ 5.73
46

2007 2008 2009 2010 2011 2012
$ 1,469,158 $ 1,586,210 $ 1,577,262 $ 1,710,341 $ 1,816,139 $ 1,752,6501,221,043 1,283,188 1,288,906 1,268,006 1,331,800 1,265,8712,690,201 2,869,398 2,866,168 2,978,347 3,147,939 3,018,521
18.1% 18.0% 18.3% 18.9% 19.6% 19.4%
2,885,752 3,121,679 3,346,661 3,510,087 3,448,567 3,069,2921,230,119 1,335,420 1,344,640 1,326,833 1,423,439 1,554,048
3,191,632 3,340,607 3,209,917 3,443,231 3,661,097 3,682,7067,307,503 7,797,706 7,901,218 8,280,151 8,533,103 8,306,046
49.2% 48.9% 50.5% 52.5% 53.1% 53.5%
2,310,136 2,680,351 2,601,010 2,591,043 2,542,103 2,382,782927,463 929,317 614,883 270,035 115,563 59,2531,611,115 1,661,611 1,673,832 1,641,403 1,737,126 1,760,8394,848,714 5,271,279 4,889,725 4,502,481 4,394,792 4,202,874
32.7% 33.1% 31.2% 28.6% 27.3% 27.1%
$ 14,846,418 $ 15,938,383 $ 15,657,111 $ 15,760,979 $ 16,075,834 $ 15,527,441
469,735 487,803 465,406 470,196 460,247 409,795
$ 31.61 $ 32.67 $ 33.64 $ 33.52 $ 34.93 $ 37.89
$ 5.73 $ 5.88 $ 6.16 $ 6.33 $ 6.84 $ 7.37
47

Metropolitan Airport Authority of Rock Island County, Illinoisand Combined Affiliate
Changes in Cash and Cash EquivalentsLast Ten Fiscal Years(Unaudited)
2003 2004 2005
Cash flows from operating activities:
Cash received from providing services $ 7,918,365 $ 8,286,509 $ 9,258,982
Cash paid to suppliers (3,790,864) (3,965,698) (4,963,873)
Cash paid to employees (2,191 ,259) (2,362,059) (2,425,819)
Net cash provided by (used in)operating activities 1,936,242 1,958,752 1,869,290
Cash flows from investing activities:
Interest collected 311,938 178,295 254,524
Proceeds from maturity of investments 8,557,188 7,419,792 8,961,704
Purchase of investments (7,419,792) (8,961,704) (11,544,834)
Net cash provided by (used in) investing activities 1,449,334 (1,363,617) (2,328,606)
Cash flows from capital and related financing activities:
Acquisition and construction of capital assets (1,274,765) (824,967) (569,258)
Principal paid on revenue bonds (110,000) (115,000) (115,000)
Principal paid on general obligation bonds (1,090,000) (1,155,000) (1,235,000)
Principal paid on bank note (5,643)
Interest paid on long-term debt (1,070,609) (863,849) (937,199)
Payments on closed-end lines of credit (246,083) (2,773,042)
Passenger and customer facility charges collected 1,756,679 1,756,844 1,883,122
Proceeds from sale of capital assets 17,550 375,406
Issuance of note receivable (199,838)
Prepaid bond issuance costs
Proceeds from bonds
Payments received on note receivable 33,306 99,919
Net cash (used in) capital and relatedfinancing activities (2,017,228) (4,141,546) (503,653)
Cash flows from noncapital financing activities:
Tax proceeds received 1,115,241 1,199,981 1,439,570
Intergovernmental 166,135 74,217
Net cash provided by noncapital financing activities 1,281,376 1,274,198 1,439,570
Net increase (decrease) in cash 2,649,724 (2,272,213) 476,601
Cash and cash equivalents, beginning of year 1,951,148 4,600,872 2,328,659
Cash and cash equivalents, end of year $ 4,600,872 $ 2,328,659 $ 2,805,260
48
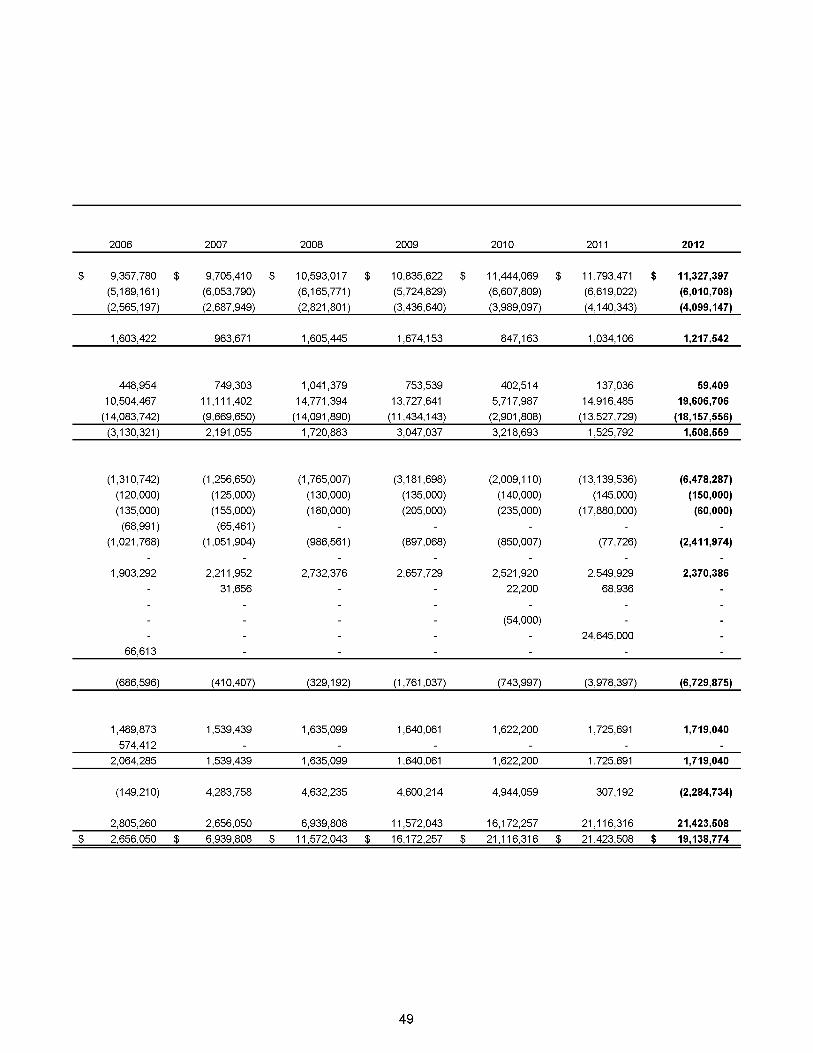
49

Metropolitan Airport Authority of Rock Island County, Illinoisand Combined Affiliate
Revenue RatesLast Ten Fiscal Years(Unaudited)
2003 2004 2005 2006
Calculated landing fee (per 1,000 pounds
of landed weight) $ 2.28 $ 2.43 $ 2.10 $ 2.12
Airport Authority subsidy
Billed landing fee (per 1,000 poundsof landed weight) $ 2.28 $ 2.43 $ 2.10 $ 2.12
Calculated terminal rental rate (per
square foot) 23.26 21.13 22.29 21.99
Excess rate charged to airlines
Billed terminal rental rate (persquare foot) 23.26 21.13 22.29 21.99
Note: In fiscal year 2012 and 2011, the amounts overpaid by the Airlines for terminal space rent was applied to the amount subsidized
by the Authority for landing fees resulting in a net subsidy by the Authority in each year.
50
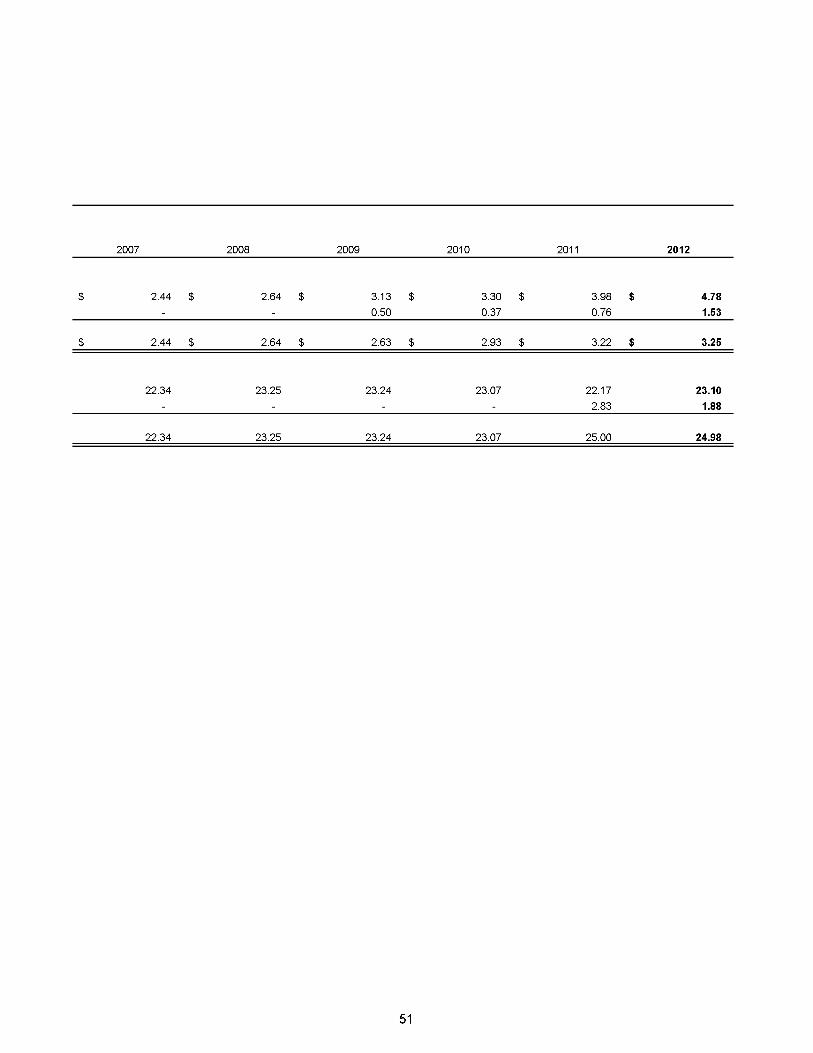
2007 2008 2009 2010 2011 2012
$ 2.44 $ 2.64 $ 3.13 $ 3.30 $ 3.98 $ 4.780.50 0.37 0.76 1.53
$ 2.44 $ 2.64 $ 2.63 $ 2.93 $ 3.22 $ 3.25
22.34 23.25 23.24 23.07 22.17 23.102.83 1.88
22.34 23.25 23.24 23.07 25.00 24.98
51

Metropolitan Airport Authority of Rock Island County, Illinoisand Combined Affiliate
Ratios of Outstanding Debt, Debt Service and Debt LimitsLast Ten Fiscal Years(Unaudited)
2003 2004 2005Outstanding debt per enplaned passenger:Outstanding debt by type:Revenue bonds $ 2,415,000 $ 2,300,000 $ 2,185,000General obligation bonds 21,180,000 20,025,000 18,790,000Closed end line of credit 2,773,042Bank note 134,452
Total outstanding debt 26,368,042 22,325,000 21,109,452
Outstanding debt per enplaned passenger 65.91 53.35 47.63
Debt service:Principal 1,376,038 4,043,042 1,350,000Interest 1,070,609 863,849 994,752
Total debt service 2,446,647 4,906,891 2,344,752
Ratio of debt service to total expenses 19.89% 36.35% * 17.28%
Net debt service per enplaned passenger:Net debt service $ 2,446,647 $ 4,906,891 $ 2,344,752Net debt service per enplaned passenger 6.12 11.72 5.29
Debt limit information:Debt limit 34,582,893 36,382,274 35,932,006Debt applicable to limit 134,452
Debt margin 34,582,893 36,382,274 35,797,554Debt margin as a percentage of the debt limit 100.00% 100.00% 99.63%Debt limit per enplaned passenger $ 86.45 $ 86.93 $ 81.07
* These numbers include the prepayment and/or refunding of outstanding debt skewing theratio of debt service to total expenses.
52

2006 2007 2008 2009 2010 2011 2012
$ 2,065,000 $ 1,940,000 $ 1,810,000 $ 1,675,000 $ 1,535,000 $ 1,390,000 $ 1,240,00018,655,000 18,500,000 18,320,000 18,115,000 17,880,000 24,645,000 24,585,000
65,461
20,785,461 20,440,000 20,130,000 19,790,000 19,415,000 26,035,000 25,825,000
46.65 43.51 41.27 42.52 41.29 56.57 63.02
323,991 345,461 310,000 340,000 375,000 18,025,000 210,0001,021,768 1,051,904 986,561 897,068 862,315 836,598 988,2271,345,759 1,397,365 1,296,561 1,237,068 1,237,315 18,861,598 1,198,227
9.01% 8.93% 8.04% 7.29% 7.43% 106.29% 6.26%
$ 1,345,759 $ 1,397,365 $ 1,296,561 $ 1,237,068 $ 1,237,315 $ 18,861,598 $ 1,198,2273.02 2.97 2.66 2.66 2.63 40.98 2.92
37,598,584 39,127,775 41,020,595 42,027,054 42,484,351 43,471,534 43,665,75865,461
37,533,123 39,127,775 41,020,595 42,027,054 42,484,351 43,471,534 43,665,75899.83% 100.00% 100.00% 100.00% 100.00% 100.00% 100.00%
$ 84.39 $ 83.30 $ 84.09 $ 90.30 $ 90.35 $ 94.45 $ 106.56
53

Metropolitan Airport Authority of Rock Island County, Illinoisand Combined Affiliate
Pledged Revenue CoverageLast Ten Fiscal Years(Unaudited)
2003 2004 2005 2006
Net revenues:
Operating revenues $ 7,896,510 $ 8,717,002 $ 9,122,768 $ 9,382,836
Passenger and customer facility charges 1,701,449 1,814,195 1,862,501 1,970,472
Taxes 1,131,921 1,340,730 1,436,480 1,502,951
Intergovernmental 166,135 74,217 574,412
Investment income 299,346 184,491 277,415 621,556
Gain on disposal of capital assets 343,579
Gross revenues 11,195,361 12,130,635 13,042,743 14,052,227
Less operating expenses, less depreciation (5,781,838) (6,749,330) (7,252,342) (7,933,327)Net revenues $ 5,413,523 $ 5,381,305 $ 5,790,401 $ 6,118,900
Debt service:
Principal $ 1,446,083 $ 4,043,042 $ 1,355,643 $ 323,991
Interest 1,070,609 863,849 937,199 1,021,768Total debt service $ 2,516,692 $ 4,906,891 $ 2,292,842 $ 1,345,759
Debt service coverage $ 2.15 $ 1.10 * $ 2.53 $ 4.55
* These numbers include the prepayment and/or refunding of outstanding debt, skewing the debt service coverage ratio
below the requirement of 1.25.
Note: The net revenue numbers above include QCIA Airport Services, LLC revenue and expenses.
54
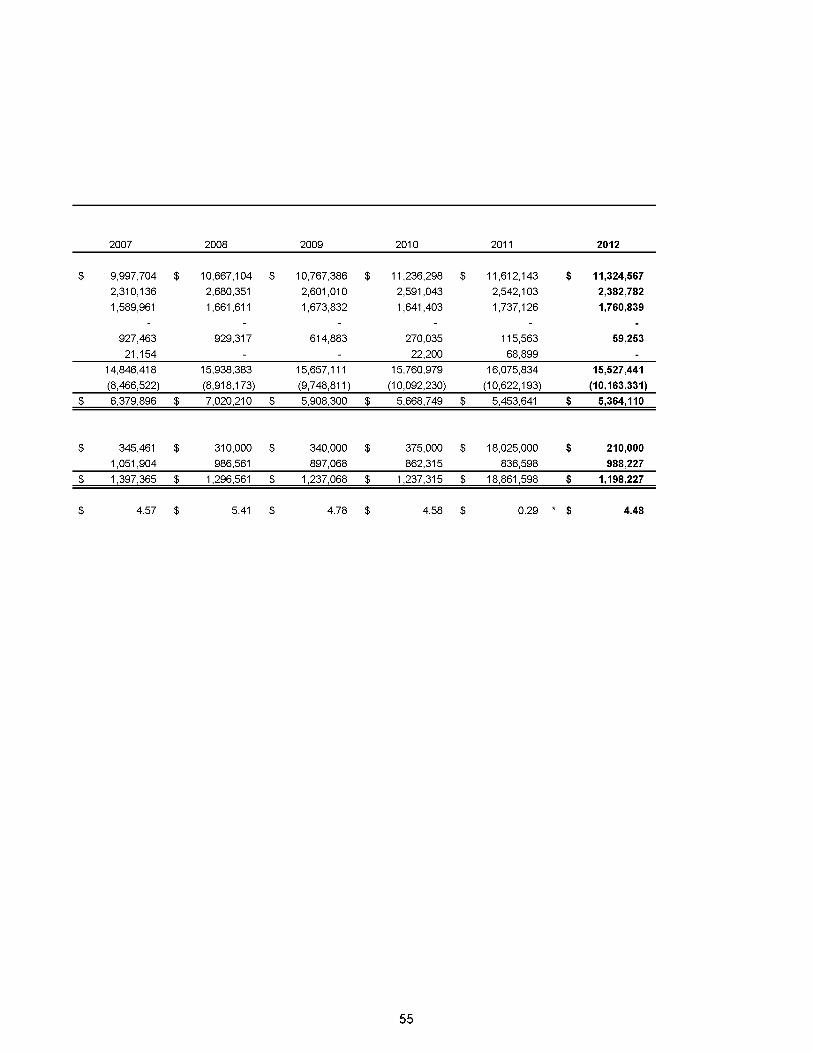
2007 2008 2009 2010 2011 2012
$ 9,997,704 $ 10,667,104 $ 10,767,386 $ 11,236,298 $ 11,612,143 $ 11,324,5672,310,136 2,680,351 2,601,010 2,591,043 2,542,103 2,382,7821,589,961 1,661,611 1,673,832 1,641,403 1,737,126 1,760,839
927,463 929,317 614,883 270,035 115,563 59,25321,154 22,200 68,899
14,846,418 15,938,383 15,657,111 15,760,979 16,075,834 15,527,441(8,466,522) (8,918,173) (9,748,811) (10,092,230) (10,622,193) (10,163,331)
$ 6,379,896 $ 7,020,210 $ 5,908,300 $ 5,668,749 $ 5,453,641 $ 5,364,110
$ 345,461 $ 310,000 $ 340,000 $ 375,000 $ 18,025,000 $ 210,0001,051,904 986,561 897,068 862,315 836,598 988,227
$ 1,397,365 $ 1,296,561 $ 1,237,068 $ 1,237,315 $ 18,861,598 $ 1,198,227
$ 4.57 $ 5.41 $ 4.78 $ 4.58 $ 0.29 * $ 4.48
55

Metropolitan Airport Authority of Rock Island County, Illinoisand Combined Affiliate
Population in the Air Trade AreaLast Thirty Years - Ten-Year Increments(Unaudited)
2010 2000 1990 1980
Primary trade area:
State of Illinois:
County of Rock Island 147,546 149,374 148,723 165,968
County of Mercer 16,434 16,957 17,290 19,286
County of Henry 50,486 51,020 51,159 57,968
State of Iowa, County of Scott 165,224 158,668 150,979 160,022
Total primary trade area 379,690 376,019 368,151 403,244
Secondary trade area:
State of Iowa:
County of Cedar 18,499 18,187 17,381 18,635
County of Clinton 49,116 50,149 51,040 57,122
County of Muscatine 42,745 41,722 39,907 40,436
Total secondary trade area 110,360 110,058 108,328 116,193
Total primary and secondarytrade area population 490,050 486,077 476,479 519,437
State of Illinois 12,830,632 12,419,293 11,430,602 11,426,518
United States 308,745,538 281,421,906 248,709,873 226,545,805
Source: US Department of Commerce, Bureau of the Census
Note: Quad City International Airport's secondary trade area fluctuates with service and price levels.
56

Percentage Change
1980 -1990 1990 - 2000 2000 - 2010
(10.39)%
(10.35)
(11.75)
(5.65)
0.44%
(1.93)
(0.27)
5.09
(1.22)%
(3.08)
(1.05)
4.13
(8.70) 2.14 0.98
(6.73) 4.64 1.72
(10.65) (1.75) (2.06)
(1.31) 4.55 2.45
(6.77) 1.60 0.27
(8.27) 2.01 0.82
0.04 8.65 3.31
9.78 13.15 9.71
57

Metropolitan Airport Authority of Rock Island County, Illinoisand Combined Affiliate
Principal EmployersCurrent Year and Nine Years Ago(Unaudited)
2012 2003
Percentage Percentage
of Total Area of Total Area
Employer Employees Rank Employment Employees Rank Employment
Rock Island Arsenal 8,500 1 3.76% 6,000 2 2.76%
Deere & Company 7,300 2 3.23% 7,317 1 3.36%
Genesis Health System 4,900 3 2.17% 3,000 3 1.38%
Trinity Medical Center 2,900 4 1.28% 2,500 5 1.15%
Tyson Fresh Meats/Formerly IBP 2,400 5 1.06% 2,300 6 1.06%
Alcoa, Inc. 2,250 6 0.99% 2,513 4 1.15%
Hy-Vee Food Stores 1,622 7 0.72% 0.00%
Kraft Foods/Oscar Mayer 1,500 8 0.66% 1,200 7 0.55%
XPAC 1,195 9 0.53% 0.00%Wal-Marl Super Centers 1,066 10 0.47% 0.00%
Mid American Energy 0.00% 1,200 8 0.55%
Illini Hospital 0.00% 950 9 0.44%
CNH Global 0.00% 816 10 0.37%
Source: Quad Cities First, Greater Quad City Region, and Bi-State Regional Commission
58


Metropolitan Airport Authority of Rock Island County, Illinoisand Combined Affiliate
Authority and Combined Affiliate Employees(Unaudited)
2012 2011 2010
Administration 7 8 6Management 6 7 7Airfield and building maintenance 21 21 22Custodial 8 9 9Dispatch 4 4 4Public safety 14 15 15Fueling 7 7 7Customer Service Agents 14 12 19
81 83 89
Note: Authority records for detail of employees date back to fiscal year 2005.
59

2009 2008 2007 2006 2005
7 7 6 6 66 6 5 5 6
20 21 19 19 187 8 8 9 94 4 3 3 315 15 15 15 157 7 8 7 71783 68 64 64 64
60

Metropolitan Airport Authority of Rock Island County, Illinoisand Combined Affiliate
Enplaned Passengers(Unaudited)
Share of Share of Share of Share of
Airline 2012 2012 Total 2011 2011 Total 2010 2010 Total 2009 2009 Total
Airtran 9,800 2.39% 56,498 12.28% 103,901 22.10% 106,720 22.93%
Allegiant 54,738 13.36 26,451 5.75
American Eagle 71,432 17.43 63.656 13.83 60.974 12.96 60.691 13.04
AT A Connection
Delta Connection 153,275 37.40 179.902 39.09 155.198 33.01 69.397 14.91
Northwest Airlink 21.875 4.65 109.958 23.63
Sl0jway
TWA Express
United Express 117,633 28.71 130.641 28.38 124.722 26.53 116.072 24.94
Subtotal 406,878 99.29 457.148 99.33 466.670 99.25 462.838 99.45
Charters 2,917 0.71 3.099 0.67 3.526 0.75 2.568 0.55
Total 409,795 100.00% 460.247 100.00% 470.196 100.00% 465,406 100.00%
61

Share of Share of Share of
2008 2008 Total 2007 2007 Total 2006 2006 Total 2005 2004 2003
120,538 24.71% 91,505 19.48% 96,866 21.74% 96,367 81,870 65,865
67,243 13.78 63,769 13.58 68,318 15.33 50,862 64,433 116,487
16,859 26,242 28,524
56,186 11.52 59,137 12.59 43,352 9.73 32,706 35,759 14,448
118,231 24.24 121,951 25.96 117,653 26.41 125,955 87,400 73,374
1,563
123,624 25.34 131,912 28.08 117,779 26.43 119,051 120,589 98,220
485,822 99.59 468,274 99.69 443,968 99.65 441,800 416,293 398,481
1,981 0.41 1,461 0.31 1,581 0.35 1,405 2,209 1,566
487,803 100.00% 469,735 100.00% 445,549 100.00% 443,205 418,502 400,047
62

Metropolitan Airport Authority of Rock Island County, Illinoisand Combined Affiliate
Takeoff and Landing Operations Summary(Unaudited)
GeneralCalendar Year Air Carrier/Air Taxi Military Aviation Total
2002 $ 27,813 $ 1,531 $ 40,513 $ 69,8572003 26,937 1,015 37,402 65,3542004 27,076 1,015 37,025 65,1162005 24,770 730 30,009 55,5092006 25,071 798 25,435 51,3042007 23,582 555 25,738 49,8752008 23,640 477 25,053 49,1702009 22,764 435 21,825 45,0242010 21,917 401 19,057 41,3752011 20,603 359 15,816 36,778
63


Metropolitan Airport Authority of Rock Island County, Illinoisand Combined Affiliate
Takeoff and Landing Operations by Airline or Cargo CarrierLast Ten Fiscal Years(Unaudited)
Airline 2012
Share of
2012 Total 2011
Share of
2011 Total 2010
Share of
2010 Total 2009
Share of
2009 Total
AbxfAirborne Express -% -% -% -%
ATA1Chicago Express
Air Cargo Carriers
AirTran
Delta Connection
108 1.13 609 6.15 1.216 12.14 1.257 11.47
399 4.17 195 1.97
2,213 23.16 1.761 17.79 1.707 17.05 1.823 16.64
3,557 37.22 4.010 40.52 3.640 36.35 1.582 14.44
263 2.75 263 2.66 260 2.60 125 1.14
260 2.60 3.080 28.11
Allegiant
American Eagle
CSAAir
DHL/Ameriflight
Northwest
Planemasters
Sl0jway
Suburban Air Freight 597 5.45
United Express 3,017 31.57 3.059 30.91 2.931 29.27 2.494 22.76
Total landings 9,557 100.00% 9.897 100.00% 10.014 100.00% 10.958 100.00%
NOTE: Effective September 1. 2009 Northwest merged with Delta Connection.
64
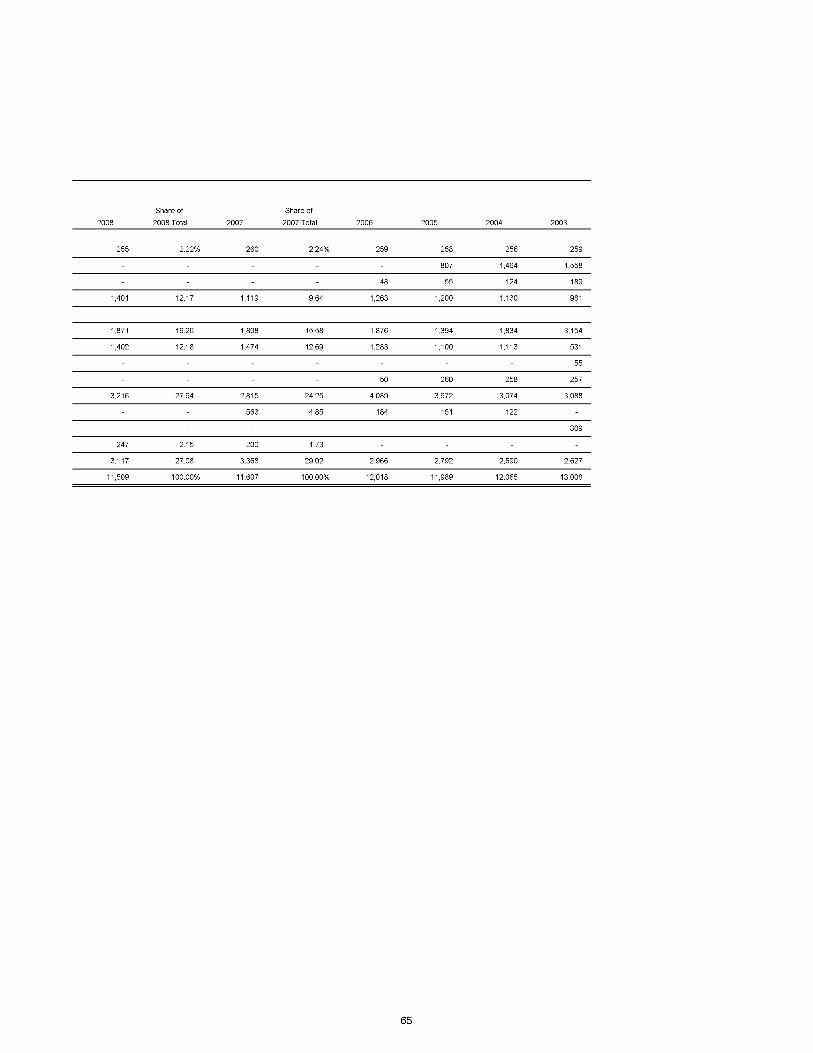
Share of Share of
2008 2008 Total 2007 2007 Total 2006 2005 2004 2003
255 2.22% 260 2.24% 259 258 256 259
807 1,464 1,558
48 55 124 189
1,401 12.17 1,119 9.64 1,263 1,200 1,130 981
1,871 16.26 1,808 15.58 1,876 1,394 1,834 3,154
1,402 12.18 1,474 12.69 1,283 1,100 1,113 531
55
50 260 258 257
3,216 27.94 2,815 24.25 4,089 3,972 3,074 3,088
563 4.85 184 151 122
309
247 2.15 200 1.73
3,117 27.08 3,368 29.02 2,966 2,792 2,690 2,627
11,509 100.00% 11,607 100.00% 12,018 11,989 12,065 13,008
65

Metropolitan Airport Authority of Rock Island County, Illinoisand Combined Affiliate
Airline Landed WeightsLast Ten Fiscal Years(Unaudited)
Share of Share of Share of Share ofAirline 2012 2012 Tolal 2011 2011 Tolal 2010 2010 Tolal 2009 2009 Tolal
AbxlAirborne Express -% -% -% -%
AT AlChicago Express
Air Cargo Carriers
AirTran 11,232,000 2.13 63.792.000 11.43 126.512.000 22.07 130.776.000 21.98
Allegiant 55,309,000 10.47 27.016.000 4.84
American Eagle 93,250,887 17.64 74.703.224 13.39 73.210.251 12.77 77.356.315 13.00
Delta Connection 190,824,300 36.11 216.546.600 38.81 201.419.000 35.13 83.174.000 13.98
CSAAir
DHL/Ameriflight 4,232,500 0.80 4.238.294 0.76 4.188.494 0.73 2.011.900
Northwest 12.220.000 2.13 130.204.275 21.89
Planemasters
Skyway
Suburban Air Freight 25.899.700 4.35
United Express 173,658,325 32.86 171.739.521 30.78 155.724.986 27.16 145.472.883 24.45
Total landed weights 528,507,012 100.00% 558.035.639 100.00% 573.274.731 100.00% 594.895.073 100.00%
NOTE: Effective September 1, 2009 Northwest merged with Delta Connection.
66

Share of Share of
2008 2008 Tolal 2007 2007 Tolal 2006 2005 2004 2003
25,620,300 4.05% 25,965,000 4.18% 25,885,800 25,759,600 25,625,200 25,922,000
22,999,500 41,724,000 44,403,000
1,242,300 1,425,000 3,225,900 4,278,400
154,056,000 24.37 116,376,000 18.72 134,406,000 132,000,000 100,387,000 97,119,000
79,206,348 12.53 76,851,858 12.36 79,690,947 58,990,494 75,980,239 195,413,797
65,894,000 10,42 74,498,475 11.99 60,301,000 49,927,984 50,951,436 24,957,000
467,500
775,000 4,016,500 3,999,000 3,983,500
149,690,500 23.68 131,111,500 21.09 186,092,300 175,644,400 121,411,900 103,056,700
25,664,027 4.13 1,564,000 1,283,500 1,037,000
5,129,400
4,001,400 0.63 3,240,000 0.52
153,720,999 24.32 167,904,506 27.01 142,267,880 155,565,500 144,900,000 127,702,000
632,189,547 100.00% 621,611,366 100.00% 632,225,227 627,612,478 569,241,675 632,432,297
67

Metropolitan Airport Authority of Rock Island County, Illinoisand Combined Affiliate
Primary Origin and Destination Passenger Markets(Unaudited)
Hubs Served 2012 Served By
ChicagoAtlantaMinneapolisOrlandoDallasDenverMemphisDetroitLas VegasPhoenix-MesaS1. Petersburg/ClearwaterOrlando-Sanford
American Eagle, United ExpressDelta ConnectionDelta ConnectionAirTranAmerican EagleUnited ExpressDelta ConnectionDelta ConnectionAllegiantAllegiantAllegiantAllegiant
68

Metropolitan Airport Authority of Rock Island County, Illinoisand Combined Affiliate
Capital Asset Information(Unaudited)
Location City of Moline, Rock Island County, Illinois165 miles west of Chicago, Illinois
Area 2,000 acre campus
Airport Code MLI
Runways 9/27 10,000 feet by 150 feet13/31 7,000 feet by 150 feet5/23 5,000 feet by 150 feet
Terminal Tenants, Exclusive 81,203 sq. ft.Tenants, Common 54,958 sq. ft.Support 21,491 sq. ft.Total 157,652 sq. ft.
Passenger Gates 12Loading Bridges 10Concessionaires 4Rental Car Agencies 4
Apron Commercial Airlines 4Cargo Airlines 1FBO 1
Parking Public:Short-Term 197Long-Term 1,959
Employee 297
Rental Cars 321
Air Cargo Building One:Suite 1 6,000 sq. ft.Suite 2 4,500 sq. ft.Suite 3 6,000 sq. ft.
Building Two:Suite 1 6,000 sq. ft.Suite 2 9,440 sq. ft.
Building Three 21,040 sq. ft.52,980 sq. ft.
International: Customs
69