Metrics for the New World of Support - thinkhdi.com/media/HDICorp/Files/White-Papers/whtppr... ·...
16
Metrics for the New World of Support By Roy Atkinson Senior Writer/Analyst, HDI
Transcript of Metrics for the New World of Support - thinkhdi.com/media/HDICorp/Files/White-Papers/whtppr... ·...

Metrics for the New World of Support
By Roy Atkinson Senior Writer/Analyst, HDI

© 2013 UBM LLC I www.ThinkHDI.com 2
METRICS FOR THE NEW WORLD OF SUPPORT
Executive Summary
For many years, support centers have been calculating and reporting more or less the same set of metrics. Unfortunately (or fortunately, depending on your point of view), many of these metrics have become obsolete, or simply meaningless to anyone outside the support center and its management. Worse yet, some have produced unintended consequences. They were developed for an industry that was almost completely dependent on the phone, and many of them are captured quite easily by automated call distributors (ACDs), but they don’t, as Hultquist says, “get us to what we really want.”
Too often, support centers focus almost completely on quantitative metrics, which are useful for operational controls and management; however, more emphasis needs to be placed on qualitative metrics, which are far more useful in making business decisions. We need to be measuring outcomes, not activities, and the measures and metrics we use need to address both what we do and how well we do it, enabling support centers to show what their work means to their companies or institutions.
Many of the suggestions and examples in this paper are not new; they’ve been written about and spoken about before in countless papers and presentations, and they’ve been noticed—but not adopted—by the industry. But now more than ever, support centers need to be able to help their organizations make business decisions and demonstrate their value to those organizations in an increasingly competitive world.
The new world of support will be based on more than transactional analysis; it will be built around relationships, goals, and business value. For years, support has been tracking volume, speed, and performance against transactional goals, which are mostly built around incident and/or request management. They speak to what happens when something breaks or when something is needed (but mostly the former). Again, they measure activities, not outcomes.
The new world of support is one in which there’s real competition—a novel experience for many internal support teams. Although outsourcing has been around for a long time, there are now options for managed services and cloud-based solutions that weren’t available even a few years ago. The appetite for technology has grown exponentially, and the ways that technology is being supported are evolving rapidly as well.
The new world of support is also one in which we use what we know about things breaking (incidents), or about services being needed (requests), to assess financial consequences and, in the best of worlds, predict what needs attention. Recent HDI research has shown that pressure to demonstrate business value has increased for both IT and, more specifically, the support center.2 At the very least we need to do more than just reset something until the next time it breaks, causing us to open yet another ticket on the same issue. The support center should be able to provide information that help senior management make strategic business decisions (that is, good metrics data that provide insight into what’s working well and what isn’t).
1 Cinda Daly, with Vince McCord and Steve Hultquist, “Top Down and Bottom Up: Performance Metrics That Count,” SupportWorld (July/August 2013), p. 11, http://www.thinkhdi.com/topics/library/supportworld/2013/julyaug13/dalyinterview-performance-metrics.aspx.
2 Roy Atkinson, “Show Me the Value: Support’s Mandate,” an HDI white paper (November 2013), http://www.thinkhdi.com/~/media/HDI-Corp/Files/Research-Corner/RC_Business_Value_Nov13.pdf.
Things that are easily measured very rarely get us to what we
really want. —Steve Hultquist1

© 2013 UBM LLC I www.ThinkHDI.com 3
METRICS FOR THE NEW WORLD OF SUPPORT
Whether technical service and support evolves into more of a liaison between an organization and its service providers, or whether the support organization itself becomes embedded within various departments in the company or institution, or even if it remains more or less the same, measurements and metrics will shape the conversations support centers have with other organizational units and with customers.3 More than ever, these conversations need to be couched in the language of the business (which often means “in financial terms”).
While measures and metrics need to be focused at each of three levels—operational, tactical and strategic—it’s also true that both operational and tactical measurements need to provide information that can be used at the strategic level. Many of the most frequently used support center metrics are operational—as some must be—but because they focus on quantity, not quality, they haven’t been providing the type of information needed at the tactical and strategic levels. They tend to tell the same story over and over again: “Something broke and a customer called, emailed, or chatted with us about it. We fixed it. That happened 4,600 times last month.”
It’s important to understand how our metrics are related to each other and what they do and do not tell us about how we are doing our jobs. In this white paper, we will discuss the reasons for change, the overemphasis on quantitative metrics, problematic metrics, the relationships between metrics, the stories metrics don’t tell, the metrics that senior management probably doesn’t value, a process for changing metrics, and suggested metrics for this new world.
A word of caution: Changing the metrics you report—or the way you report them—can be confusing for those who receive the reports every day/week/month, unless the changes have been effectively communicated to those stakeholders and care has been taken to modify any affected SLAs.4 Communication and senior management buy-in are key to changing the way we measure our success and that of the organization as a whole.
I. Reasons for Change
According to the 2013 HDI Support Center Practices & Salary Report, 96.7 percent of support centers are creating tickets from the phone channel, up slightly from 95.2 percent in the 2012 HDI Support Center Practices & Salary Report; 55 percent of tickets were created from phone contacts in both 2012 and 2013. However, older support channels are not being dropped as new ones, such as mobile apps, are added. (Fax is still listed as a channel for 8.6 percent of support centers, and 6 percent of tickets were created from fax in 2013.5) In today’s world of technical service and support, these new channels have become exceedingly important; that’s due, in part, to the fact that our preferred methods of communication are more numerous
Something broke and a customer called, emailed, or chatted with us about it. We fixed it. That happened 4,600 times last month.
3 Roy Atkinson, “The Support Center in 2017 and Beyond,” HDIConnect.com (June 6, 2012), http://www.hdiconnect.com/blogs/supportoperations/2012/06/the-support-center-in-2017-and-beyond.aspx.
4 For example, if your support organization is currently measuring customer satisfaction (CSAT) on a scale of 1 to 5, where 5 is best, your stakeholders may be confused if you shift to tracking customer effort scores (CES), where lower scores are better.
5 Jenny Rains, 2013 HDI Support Center Practices & Salary Report (HDI, 2013), p. 20, http://www.thinkhdi.com/topics/research/support-center-reports.aspx.
http://www.hdiconnect.com/blogs/supportoperations/2012/06/the-support-center-in-2017-and-beyond.aspx
© 2013 UBM LLC I www.ThinkHDI.com 4
METRICS FOR THE NEW WORLD OF SUPPORT
and our ability and/or desire to stay in the office has changed. Workers are using more devices, and they’re using them in more locations and in more ways.
Consider the contemporary worker’s array of devices: a laptop, a tablet, and a smartphone. Some—perhaps even all—are personal devices that connect to organizational resources through virtual private networks (VPNs), third-party secure gateways, or even mobile apps. Workers are and will be interacting with support in different ways and at different times from what the support center was set up to expect.
In this new world, metrics should be closely related to the business’s goals and our customers’ ability to achieve their goals and objectives. Few of the most popular metrics are good at answering goal-oriented or quality questions; instead, they’re best used to measure quantities of work done. Where metrics include dollar amounts, they tend to emphasize cost, not value, and even then they don’t delve too deeply into real expenses beyond the support center or what can be done to improve.
We collect data about nine different support channels in our annual HDI Support Center Practices & Salary Survey, and we’ll be adding two more in 2014: SMS/text and mobile app. All of these channels add complexity to the current methods of gathering and measuring the flow of work through the support center, but that’s only the beginning. We know that there are forces at work in most organizations today that require better metrics—ones that can show real business value. In many respects, the overarching questions remain the same: “Are you doing what we (the organization) asked you to do? How well are you doing it?” What’s changed is the “what” in support centers are being asked to do and the emphasis on how well they’re doing it.
Disruptive technologies do not replace, but rather augment
existing ones. —Mark Fitzgerald
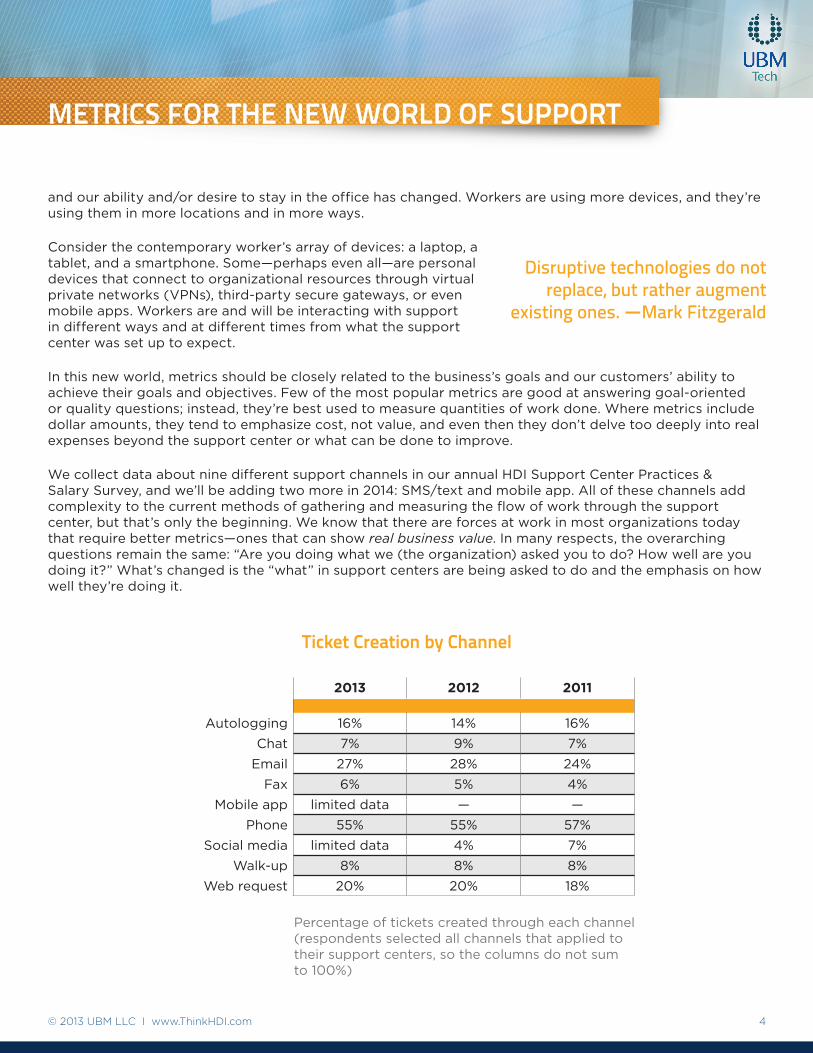
2013 2012 2011
Autologging 16% 14% 16%
Chat 7% 9% 7%
Email 27% 28% 24%
Fax 6% 5% 4%
Mobile app limited data — —
Phone 55% 55% 57%
Social media limited data 4% 7%
Walk-up 8% 8% 8%
Web request 20% 20% 18%
Percentage of tickets created through each channel (respondents selected all channels that applied to their support centers, so the columns do not sum to 100%)
Ticket Creation by Channel

© 2013 UBM LLC I www.ThinkHDI.com 5
METRICS FOR THE NEW WORLD OF SUPPORT
Support centers need to be able to demonstrate how phone conversations, emails, and chat sessions are increasing productivity, enabling innovation, meeting or exceeding customer expectations, and helping the business achieve its goals. We need to be able to show that our channels are the right ones, that they’re cost-effective, and that our work is keeping our customers happy and productive, whether they are internal (employees) or external (people who purchase our organization’s products and/or services).
In order to be useful in the evolving world of support, measures and metrics also need to look at—and from—the customer perspective, whether we’re talking about our business or institution as the collective customer, or whether we mean an individual to whom we are providing support. Traditionally, we’ve paid more attention to measuring what’s useful to support center management than what’s important to customers.6 In the new world of support, we need to acknowledge that customers—both internal and external—drive the business. In order to remain relevant at all, the support center needs to be relevant to customers.
II. Overemphasis on Quantitative Metrics
Each year, the HDI Support Center Practices & Salary Report highlights the metrics many organizations ask their support centers to track, including:
• Response times, including average speed to answer (phone), average handle time, average time to respond (chat, web request tickets and email)
• Tickets switched between channels
• Time to resolve
• First call resolution rate (phone)
• First level resolution rate (all channels)
• First contact resolution rate (all channels)
• Utilization (analyst time on calls)
• Fully-burdened cost per ticket (by channel)
• Customer satisfaction7
Essentially, these boil down to:
• How much work was there this day/week/month?
• How long did it take to get the work done?
• How much did this work cost?
• How happy are our individual customers with the interactions they had with us?
6 Rae Ann Bruno, “Make Customer Satisfaction Surveys Count,” HDIConnect.com (December 2, 2011), http://www.hdiconnect.com/blogs/supportoperations/2011/12/make-customer-satisfaction-surveys-count.aspx.
7 Customer satisfaction is an important topic on its own, and it will be discussed at some length in Section 3.

© 2013 UBM LLC I www.ThinkHDI.com 6
METRICS FOR THE NEW WORLD OF SUPPORT
But what do these numbers mean to our companies or institutions? What does call volume tell our business about us? About IT? About our company’s product or service? What does first call resolution or first contact resolution really mean?
These metrics are certainly useful to support center managers. They need to know about volume and handle time for staffing levels, and speed to answer, first call resolution (or first contact resolution, to be discussed later), and first level resolution all play into customer satisfaction. It’s easy, however, to overlook the deeper meaning of the numbers. If call volume is up, for example, does that mean your IT infrastructure (or the product for which we provide technical support) is failing more often?
A metrics review of your organization is probably in order; the goal should be to produce more valuable numbers that will help the organization make better management decisions. As one example, we in support may make the decision to wipe and reimage infected machines because of the costs support incurs in removing the virus and retaining the surrounding data. But we should also consider the impact that will have on the workflow of the individuals whose machines are being reimaged.
III. Problematic Metrics
Let’s take a metric almost everyone tracks: first call resolution (phone only). According to the 2013 HDI Support Center Practices & Salary Report, the industry average for FCR is 68.8 percent for incidents and 68 percent for service requests. That means that roughly two out of three calls result in resolution during that initial connection. But are they really resolved? Unless you’re carefully tracking your reopen rate (i.e., how many tickets are reopened after being marked resolved), you can’t say for certain.
You also need to watch for duplicate tickets (same customer, same issue), because some analysts, knowing that reopens are tracked and that they’re often rated more heavily on the quantity of their work than the quality, might game the system by opening a new ticket if the customer calls back with a persistent issue. So, reopen rate and duplicate tickets are related closely to the FCR rate (FCRR). In addition, a high
FCRR tends to indicate that your support center is answering the same questions or performing the same fixes over and over again, with little to no troubleshooting. (Tracking “level zero solvable” can help support centers identify repetitive tickets that are good candidates for self-service, making the overall process more effective.8)
It may be more beneficial to track first contact resolution, which is defined as a resolution made by the person who initially opens the ticket. This metric works across multiple channels, and it’s an indicator of effective support. Customers want quick solutions, not short phone calls, and most of them intensely dislike being rushed off the phone and told they’ll have to wait for a fix simply because the analyst’s allotted three minutes of talk time has elapsed.
Consider recognizing and rewarding accuracy and quality over speed and quantity.
8 Rick Joslin, “What Is LZS?,” Industry Insider, http://www.thinkhdi.com/~/media/HDICorp/Files/Library-Archive/Insider%20Articles/Level%200%20Solvable.pdf.

© 2013 UBM LLC I www.ThinkHDI.com 7
METRICS FOR THE NEW WORLD OF SUPPORT
Nearly 90 percent of support centers use email, and our research has shown that 10–20 percent of tickets (median) are converted from email to another channel, often phone.9 Say, for example, an email comes in without complete information. The analyst will then need to make a phone call to speak with the customer/end user, and since outgoing calls should be measured as part of call volume, any calls to the customer/end user become part of call volume.10 But the ticket is already part of the email volume. How can we measure and track the overlap? Can we relate the emails to the calls in any meaningful way?
If we have to pull call volume from the ACD and email volume from our ticket management, email management, or ITSM software, we may not be getting an accurate picture of what’s really going on with tickets. We can usually track abandoned calls, but what about abandoned emails, chat sessions, or web submissions? These questions should be asked during a regular metrics review, and if you’re considering changing or upgrading your ticket management or service management tools, you should be looking for software that’s capable of more efficiently tracking these “channel switches.”
Customer satisfaction is another consideration when it comes to channel switching. Customer satisfaction surveys are typically sent out when tickets are closed, either for every closed ticket or for a random selection of closed tickets.11 How do we tie these survey responses back to the original channel? Consider, for example, Customer A, who emailed the support center and waited 2.5 hours for a response that didn’t come. Will they be less satisfied (i.e., less likely to be a Promoter, or more likely to record a higher Customer Effort Score) than Customer B, who called, waited on hold for three minutes, and then had her issue resolved by had an analyst?12 Did Customer A give up on email and become Customer B? Did Customer A give up, abandon the ticket, and drop all communication with the support center? Channels need to be measured and tracked not only individually but also in relationship to one another, and the flow of customers between channels should be of particular interest.13
Customer satisfaction is a complicated topic and a complicated metric. Whether or not it’s a good reflection of how your customers really view your service depends largely on the questions you ask and how you ask them, as well as the relationships the support center has with its customers. For example, a professional, knowledgeable, and courteous support center analyst may be completely unable to assist a customer because of access restrictions. What’s more important to the customer: that the analyst was professional and courteous, or that the problem was not fixed despite his best efforts? How does a customer who receives excellent support express dissatisfaction with the fact that the service broke in the first place, or that the friendly, knowledgeable analyst was powerless to help? If they express strong dissatisfaction, do the consequences fall on the shoulders of the analyst who did her job as well as she
“The specific questions you’ll want to ask in your survey are best determined by
the needs, concerns, and issues of your customer base. —Dr. Fred Van Bennekom14
9 Rains, 2013 HDI Support Center Practices & Salary Report, pp. 51, 55, http://www.thinkhdi.com/topics/research/support-center-reports.aspx Average response time for email is 1–4 hours.
10 The total number of inbound and outbound calls that fall within some meaningful period or category.
11 Rains, 2013 HDI Support Center Practices & Salary Report, p. 60, http://www.thinkhdi.com/topics/research/support-center-reports.aspx.
12 A promoter is someone who scores support as a 9 or 10 on a Net Promoter Score survey. See the explanation of both the Net Promoter Score and Customer Effort Score in Section VIII.
13 Rob England, “Introducing Standard+Case,” Basic Service Management (n.d.), http://www.basicsm.com/content/introducing-standardcase.
14 Dr. Frederick C. Van Bennekom, Customer Surveying: A Guidebook for Service Managers (Customer Service Press, 2002).

© 2013 UBM LLC I www.ThinkHDI.com 8
METRICS FOR THE NEW WORLD OF SUPPORT
could? If your surveys focus on individual performance, they may be missing the point entirely, and may be motivating customers to stop responding to your surveys—or, worse yet, stop using your services entirely. Also, keep in mind that customers can be dissatisfied with one channel before trying another that might work better for them.
Ultimately, your organization needs to decide which customer measurements to use and what those measurements will look
like. Customer Satisfaction (CSAT), Net Promoter Score (NPS), and Customer Effort Score (CES) are three frequently-used customer sentiment metrics.15 Some customer service organizations recommend using all three, since they measure different aspects of the customer experience. Whichever method (or methods) your organization chooses, make sure that it’s measuring what’s important to the customer, not just what’s important to you.16
IV. The Relationships Between Metrics
Metrics don’t live in isolation. They’re closely related to each other in enumerating the various comings and goings within the support center and in measuring the customer experience. We’ve already seen how closely reopen rate and first call resolution rate are related, for example, but there are many other relationships to be taken into account.
• Customers want things done fast, but…
Fast fixes are high on everyone’s list of what contributes to customer satisfaction, but if and only if those fixes are effective. Customers/end users don’t want to discover that their quickly-resolved issues recur the next day or week. Quickly and correctly outweighs quickly every time. This is another reason why reopen rate is important and why duplicates should be tracked, which isn’t always easy to do. Measurement requires scrutiny of multiple tickets from the same person, but it yields valuable information on whether there’s an underlying cause that hasn’t been addressed (e.g., application conflicts, unapplied updates, equipment defects or user error).17 Keep in mind that this type of root cause analysis and tracking are part of problem management, whether the issues in question affect multiple people or not.
• A “Shift-Left” strategy is a good choice, but…18
When the solutions for frequently-reported issues transition from the phone queue into well-designed self-service, analysts are left with the more difficult and more technical issues. This means
Fast fixes aren’t fast if they aren’t effective.
If you change the way you measure anything, the change should be clearly communicated to and agreed upon by stakeholders.
15 Net Promoter, NPS, and Net Promoter Score are trademarks of Satmetrix Systems, Inc., Bain & Company, Inc., and Fred Reichheld.
16 Bruno, “Make Customer Satisfaction Surveys Count,” http://www.hdiconnect.com/blogs/supportoperations/2011/12/make-customer-satisfaction-surveys-count.aspx.
17 Even if your tool has a “duplicate ticket” function, there may be tickets in different categories or with different information that lead back to a “same customer same issue” scenario.
18 For more on Shift-Left, see Cinda Daly, “Reducing Support Costs with a ‘Shift-Left’ Strategy: An Interview with Pete McGarahan,” The Daly Interview (May 2010), http://mcgarahan.com/images/mcgarahan2012/DI_may_pete_mcgarahan%5B1%5D.pdf.

© 2013 UBM LLC I www.ThinkHDI.com 9
METRICS FOR THE NEW WORLD OF SUPPORT
that they’ll be spending more time problem-solving, researching, and testing fixes. You will be trading the perception of speed for real effectiveness and proper use of skilled analysts’ time. Handle time will go up and FCRR will go down, which is why you need to keep an eye on the negative correlation between effective self-service and speed-based metrics.
The Shift-Left strategy is effectively measured by the first level resolution (FLR) metric. An increasing FLR rate (FLRR) shows that more tickets are being resolved at the front line.
• The cost per ticket vs. number of tickets conundrum…
Cost per ticket is defined as “the total costs of a support center’s operations divided by the total number of tickets created (fully-burdened cost per ticket).”19 What this means is that cost per ticket will fluctuate depending on the number of tickets. When IT or application developers are doing their jobs well, there will be fewer tickets (for incidents, at least). That means that the cost per ticket will go up until a critical point is reached where staff and floor space can be reduced, and less equipment needs to be replaced to adequately provision the support center. Over the past several years, cost per ticket has decreased across phone, email, chat, and walk-up; in 2013, those costs w up slightly.20
Ticket volume, however, has climbed year over year.21 If the number of tickets goes up and total costs remain roughly the same, the cost per ticket will go down. The changes in cost per ticket, therefore, reflect support centers’ ability to “do more with less” (i.e., processing more incidents and requests while maintaining the same overall costs).
Watch for competing goals, such as high FCRR
and Shift-Left.
19 HDI Glossary, http://www.thinkhdi.com/topics/library/glossary.aspx.
20 Jenny Rains, 2012 HDI Support Center Practices & Salary Report (HDI, 2012); Rains, 2013 HDI Support Center Practices & Salary Report. Both available at http://www.thinkhdi.com/topics/research/support-center-reports.aspx.
21 Sixty-six percent of support centers reported an increase in ticket volume in 2013 and 2012; 68 percent reported an increase in 2011, 67 percent in 2010, 70 percent in 2009, and 75 percent in 2008. See the HDI Practices & Salary Reports for 2009-2013 for more findings related to ticket volume and cost per ticket.
All else being equal, cost per ticket decreases as ticket volume increases. When
examining costs, the two need to be taken together.
2013 2012 2011 2010
Chat $12 $10 $10 $15
Email $15 $13 $14 $15
Phone $17 $17 $17 $20
Walk-up $18 $16 $20 $21
Fully-Burdened Cost per Ticket (Median US Data)

© 2013 UBM LLC I www.ThinkHDI.com 10
METRICS FOR THE NEW WORLD OF SUPPORT
• The missing link of “total costs” and the importance of time to resolve…
When figuring total costs, support organizations have almost always focused on the costs for the support center alone, failing to consider other immensely important factors. One way to increase awareness of the true impact of support is to measure downtime.22 We’re all familiar with the old adage, “Time is money.” This is literally true in the case of missing or broken services or hardware, and the effects may be broader than we usually think. Consider what happens when a new employee doesn’t receive the equipment IT requested for her. This increases her ramp-up time, and her work suffers as a result. Most people don’t work in isolation; they generally part of a larger process. When that process is interrupted, anyone else involved in the process will be affected; downstream activities will be delayed, and upstream activities may have to be suspended until the service or component is restored.23
In general, however, the cost of customers’ lost time and productivity isn’t considered when calculating the cost per ticket.24 The cost of downtime or the impact on customers/end users is not difficult to calculate, but it may be difficult to produce this metric. It requires knowing something about the value of the customer/end user’s time, and that entails some careful negotiations with other departments. It is unlikely that you’ll get a high degree of detail about salaries and costs, but you can probably get a dollar amount that represents the average employee productivity per hour.
Let’s say that on one particular day, twenty people in the ticket sales department at an event company were offline for two hours because of a fault in the network. In this example, these twenty affected employees pull in, on average, $420 in sales per hour each via the Internet. Now we have $16,800 (20 × 2 × $420) in lost sales that they may or may not be able to make up. So the cost of downtime for this two-hour network event was $16,800. As you can see, the costs associated with an interruption of service go far beyond the cost per ticket. Therefore, the time to resolve (usually measured as mean time to resolve, or MTTR) is extremely important.
Even if you can’t obtain average productivity as a dollar amount from a business department, you can track downtime or loss of productivity by using impacted user minutes (IUM). In the case of the disconnected salespeople above, IUM would be 20 × 120 (120 minutes per salesperson), or 2,400 minutes. Without the dollars attached, the number is less compelling, but it’s still important to track increases or decreases from week to week or month to month.
While speed to answer and time to respond are related to customer response (i.e., they can make customers unhappy if they are too long), the key to business value is time to resolve. The faster we can get customers/end users back to work or fulfill their requests, the happier and more productive they will be. Remember: an issue’s not resolved until the customer says it’s resolved.25
22 Downtime is defined by ITIL as “time during which a computer or machine is not working” or “the time when an IT service or other configuration item is not available during its agreed service time. The availability of an IT service is often calculated from agreed service time and downtime.”
23 Although the cost of downtime is more of a business-focused metric, it’s not irrelevant in higher education and other industry verticals because of the effects on upstream and downstream processes.
24 As an example, see HDI’s Cost Itemization Calculator, http://www.thinkhdi.com/~/media/HDICorp/Files/Library-Archive/Cost%20Itemization%20Calculator.xls.
25 Reasonable allowance must be made for unresponsive customers. Incidents or requests should not remain unresolved indefinitely, but a process should be in place to ensure that the customer has every opportunity to confirm whether an incident has been resolved or a request is complete.
Measure the costs of downtime and watch trends to
see increases or decreases.

© 2013 UBM LLC I www.ThinkHDI.com 11
METRICS FOR THE NEW WORLD OF SUPPORT
In the absence of being able to get a complete picture of the effects of an interruption in service, measuring the direct effects is better than not measuring at all. To that end, having a good estimate of the average hourly productivity of one full-time equivalent (FTE) in a particular job is extremely useful.26 Keeping time to resolve to a minimum, then, is key to keeping the organization productive and keeping costs down—not only within support, but across the organization as a whole.
• Notallticketsarecreatedequal…
Despite ITIL’s popularity, there still seems to be some confusion about how to differentiate between incidents and requests, and why we should even bother. Put as simply as possible, an incident happens when something breaks, and a service request happens when someone needs something—even if that something is just the answer to a question or a reset password.27 Measuring incidents and service requests separately can reveal trends in work interruptions caused by defects (incidents) as well as the requests for—and adoption of—services offered (service requests). Requests are valuable, and incidents are costly.
V. The Stories Metrics Don’t TellThe first principle of data collection is GIGO: garbage in, garbage out. Unless we know we have “good” data, we should maintain a somewhat skeptical stance regarding our metrics.
• Dowehaveasufficientsample?
You may think that you know how customers feel about your services because of your CSAT, NPS, or CES results, but how big was the sample? How big should it be? Use a calculator to determine your required margin of error and level of confidence based on your total customer population.28 For example, if you provide internal support (employees), and your organization has 30,000 employees, you’ll need 380 returned surveys to yield a five percent margin of error with a 95 percent confidence level. To get the margin of error to two percent, you’ll need to receive 2,224 surveys in the same reporting period.
• Whatareweaskingabout?
Again, metrics are answers to our organization’s questions. First, we need to ask about the right things; to do that we should find out what our stakeholders want and what they expect our reports to address. In other words, what questions would they like answered? If we’re reporting on the number of tickets resolved in a month, but the CIO is looking for an indication that we spent fewer hours this month providing break/fix support than we did last month, we haven’t asked or answered
26 FTE is defined as “an accumulation of work time that adds up to a full-time position. For example, two half-time positions equal one full-time equivalent, and twenty hours per week equals half of a full-time equivalent. FTE is defined by the Government Accountability Office (GAO) as the number of total hours worked divided by the maximum number of compensable hours in a full-time schedule as defined by law.”
27 For full definitions, see the ITIL Glossary, http://www.itil-officialsite.com/InternationalActivities/ITILGlossaries_2.aspx.
28 See, for example, the calculator available from Raosoft, http://www.raosoft.com/samplesize.html. There are many such calculators available; no recommendation for this particular calculator, as opposed to others, is implied or intended.
Measure incidents and requests separately. Trend the number of incidents to see if they are
increasing or decreasing.

© 2013 UBM LLC I www.ThinkHDI.com 12
METRICS FOR THE NEW WORLD OF SUPPORT
the right question. More importantly, the way we ask the question can make the answers more—or less—meaningful.
For example, FCRR is the answer to the question, “How many times this day/week/month/year was the person who first received the customer contact able to resolve the issue?” Instead of continuing to report call volume as one number, we can ask, “How does that compare to the last reporting period(s), and what does that mean?”
In addition to reporting the raw numbers, you can say: “December contact volume is down 667 compared with October. At an average cost of $17 per contact, that’s a savings of $11,339; furthermore, there were 646 fewer reported incidents, while service requests were up by 215. Tickets categorized as ‘Other’ have also decreased, thereby increasing the accuracy of reporting.” In this way, your metrics will tell a business story: more people requested service, but things broke and services were interrupted less often. Taken together, these two facts show that the services are both more reliable and more valuable than they were during the prior reporting period.
Again, you should contact your stakeholders to ascertain how they want to see information. If you’re changing the things you report on and the way you report on them, your stakeholders—whether IT management, non-IT management, or customers/end users—need to understand what you’re changing, why you’re changing it, and what’s in it for them.29 Stakeholders are far more likely to take a few extra seconds to read your report if they’re getting useful information out of it.
VI. The Metrics Senior Management Probably Doesn’t ValueImagine a meeting between your CIO and CEO. The CEO might ask, “So, what did those forty people in the support center do last month?” If your CIO answers, “They answered the phone within twenty seconds 90 percent of the time, and they processed 4,600 tickets,” chances are the CEO won’t be too pleased.
Now reimagine the meeting, but this time the CIO says, “The support center held the developers’ feet to the fire last month. We were getting lots of errors in the ERP system, but support helped troubleshoot the issues and we’ve fixed some bugs and moved all the end users to the same browser for ERP, reducing lost time in the system by five percent, which we calculate saved us about $98,000. They also got the fourteen new sales employees set up in record time.” This type of information casts an entirely different light on things, and depends heavily on gathering the appropriate data and reporting the appropriate metrics to the appropriate people. Remember the three types of metrics: operational, tactical, and strategic.
Month Total Volume Incidents Service Requests Other Cost
October 12,688 7,088 4,644 956 $215,696.00
November 12,361 6,726 4,821 814 $210,137.00
December 12,021 6,442 4,859 720 $204,357.00
Q4 Change 667 646 215 236 $11,339.00
red = reduction
29 Metrics reporting is usually part of an SLA, and changes may require renegotiation.

© 2013 UBM LLC I www.ThinkHDI.com 13
METRICS FOR THE NEW WORLD OF SUPPORT
Reporting operational metrics to people who deal in strategic information does no one any good. Operational performance metrics like handle time, volume, speed of answer, and first call/contact resolution rate probably aren’t important at the strategic level, unless executives have specifically requested them.30 Tickets transferred to another channel may also be of interest, especially in the period after a new channel has been introduced.
Cost information should be included in operational and tactical metrics, and a financial summary of trends can be very useful at the strategic level. Cost data is especially important for shedding light on new projects or initiatives. If, for example, support center costs are reduced in the quarter after the launch of a new self-service initiative, that information should be passed up the chain. Other departments or business units that need to transmit information to their customers may wish to follow the support center’s model for getting it done.
Simply put, the metrics your support center reports to senior management should be focused on business outcomes and should be aligned with your company or institution’s strategic goals. Tactical metrics focus more on critical success factors (CSFs) and key performance indicators (KPIs), while operational metrics should show that your work (e.g., answering the phone, handling tickets, fixing broken things) was completed expeditiously.31
If you report some of your metrics to your customers, it’s good to include information about the volume of work you do, lest they think the support center is just a group of people waiting for the phone to ring. You may also wish to highlight a particular metric in your organization’s newsletter from time to time.
VII. A Process for Changing MetricsAs mentioned earlier, it’s very important to communicate with stakeholders about any changes in the metrics you’re reporting. The metrics you’re responsible for should be spelled out and defined in your SLAs. Before changing any metrics or reporting that go beyond the terms of your SLAs, you should:
• Plan new metrics with the stakeholders to make sure they’re the right ones and will be reported in a way that makes sense to them.
• Develop a firm timeline to begin reporting the new metrics.
• Build a marketing campaign around the changes, including:
� Why – What will the new metrics give the stakeholders that they do not have now?
� How – Explain the process for the transition.
� When – Publicize the timeline for the transition.
• Update your SLAs to include the additional or changed metrics.
• Deliver on your promises. Make sure the format, the information, and the delivery of new metrics is as promised.
30 Rains, 2013 HDI Support Center Practices & Salary Report, pp. 49–51, http://www.thinkhdi.com/topics/research/support-center-reports.aspx.
31 For a complete discussion, see Ted Gaughan and Kurt McWhirter, The Definitive Guide to IT Service Metrics (IT Governance Publishing, 2012).

© 2013 UBM LLC I www.ThinkHDI.com 14
METRICS FOR THE NEW WORLD OF SUPPORT
VIII. Suggested MetricsIn addition to commonly-tracked operational and performance metrics such as speed of answer, handle time, utilization, first call and/or first contact resolution, time to respond, abandonment rate, and fully-burdened cost per ticket, here are some suggested metrics that can demonstrate quality, business value, and progress. If you aren’t already measuring, recording, and reporting on these metrics, think about which ones make sense for your organization and then discuss them with your stakeholders. Remember that metrics aren’t intended for snapshot audits; rather, their value comes from tracking and trending over time.
• Impacted user minutes (IUM): Number of minutes from report to resolution multiplied by the number of affected users. Example: 120 minutes × 20 users = 2,400 IUM
• Cost of downtime (CoD): Impacted user minutes multiplied by the cost per IUM. Example: (120 minutes × 20 users) × $7 per minute per user = $16,800
• Mean time to resolve (MTTR): Average elapsed time between report and resolution, in business hours; total business hours from open to resolution divided by the total number of incidents.32 Example: 756 business hours ÷ 2400 incidents = .32 hours MTTR
This top-level metric can be tracked for detail (MMTR at Level 1, MTTR at Level 2), for all escalated incidents or service requests, by priority, by category, and so on. This type of detail can illuminate bottlenecks, “black holes,” and inefficiencies.
• Percentage of tickets transferred to another channel: Tickets moved from any channel to another channel (e.g., email to phone, social media to email). Tracking this metric can tell management which channels are effective, which ones customers prefer, and which types of tickets are being successfully resolved through each of the channels. Tracking can prove difficult in ticket management systems that are not set up for multichannel support.
• Number of incidents and number of service requests: Incidents represent breakage, defects, and failure; service requests represent value provided to customers.
• Customer satisfaction metrics: These can be used individually or in combination. Each has flaws, but taken together, they build a better picture of customer sentiment, positive or negative.
� CSAT: Customer satisfaction, usually rated on a scale of 1–5, gathered from customer surveys. Surveys should be short, and they should include items important to the customer, not just the support center.33 Higher scores are better.
� CES: Customer effort score, usually rated on a scale of 0–5, gathered from the answer to a single question, “How much effort did you personally have to expend to handle your incident or request?” Lower scores are better.
� NPS: Net Promoter Score, rated by asking, “How likely are you to recommend our services to a friend or colleague?” Calculated by subtracting the percentage of Detractors from the percentage of Promoters (Passives aren’t counted). Example: 91% Promoters – 5% Detractors = NPS 86
» Promoters (score 9–10) are loyal enthusiasts.
» Passives (score 7–8) are satisfied but unenthusiastic customers.
» Detractors (score 0–6) are unhappy customers.
32 See also, Jeff Rumburg, “Metric of the Month: Mean Time to Resolve,” Industry Insider, http://www.thinkhdi.com/~/media/HDICorp/Files/Library-Archive/Insider%20Articles/mean-time-to-resolve.pdf.
33 Bruno, “Make Customer Satisfaction Surveys Count!,” http://www.hdiconnect.com/blogs/supportoperations/2011/12/make-customer-satisfaction-surveys-count.aspx.

© 2013 UBM LLC I www.ThinkHDI.com 15
METRICS FOR THE NEW WORLD OF SUPPORT
• Reopen rate: Shows the number of tickets reopened after being marked resolved; calculated by dividing the number of reopened of tickets by the total number of closed tickets and multiplying that total by 100. Example: 48 reopened tickets ÷ 2,400 total tickets = .02 × 100 = 2% reopen rate
• Same customer/same issue (SC/SI): The percentage of tickets that represent recurring issues for the same customers. This may be the result of analysts gaming the system, or it may indicate a recurring flaw in a system or service. Note that “same customer” can mean several customers who each have multiple tickets in a given time period for the same issue. This indicates a problem that needs to be managed using root cause analysis. To calculate this metric, divide the number of tickets with the same customer and same issue by the total number of tickets and multiply the total by 100. Example: 27 SC/SI tickets ÷ 4,600 total tickets = .006 × 100 = .6% SC/SI rate
• First level resolution rate (FLRR): The percentage of tickets resolved without escalation beyond level 1. This measures L1 effectiveness, especially in organizations that are moving more technically challenging work to L1. To calculate this metric, divide the total number of tickets resolved at L1 by the total number of tickets and multiply the total by 100. Example: 2,753 total tickets resolved at L1 ÷ 4,600 total tickets = .598 × 100 = 59.8% FLRR
• Incorrectly assigned tickets/incorrectly categorized tickets: Assigning tickets to the wrong group or category slows down the resolution process and decreases customer satisfaction; calculated dividing the number of tickets that are reassigned or recategorized by the total number of closed tickets and multiplying the total by 100. Example: 110 tickets reassigned (or recategorized) ÷ 4,600 = .0239 × 100 = 2.39% incorrectly assigned/categorized
IX. ConclusionThe stories told by and with metrics should be compiled, formatted, and reported in ways that are appropriate for the intended audience (e.g., call volume is probably not interesting to the CEO, but it may be the first thing a senior IT manager wants to see).
Metrics tell business stories when they’re understood and used together to make sense of the ongoing work of the support center. For example, it’s easy to see why customer satisfaction scores would go up if MMTR and IUM go down. If IUM is going down, so is CoD. In general, everything that saves time effectively also saves money. Getting things right the first time (first contact and/or first level resolution) and making sure they’re right (low reopen rate, low SC/SI rate) can go a long way toward bringing an organization into the new world of support, where quality is valued over quantity, where customers matter more than ever, and where the support center is a valuable organizational component.
© 2013 UBM LLC I www.ThinkHDI.com 16
METRICS FOR THE NEW WORLD OF SUPPORT
About the Author
Roy Atkinson is HDI’s senior writer/analyst. He is the chief writer for white papers and SupportWorld articles, and a key in-house subject matter expert. Roy has an extensive background as a practitioner in IT support and customer service. He served as technical lead for an award-winning enterprise software implementation, and as project manager for many others. Roy is a former member of the Apple Consultants Network. He is a frequent speaker and writer on social support, customer service excellence, and mobile device support, and serves on the HDI International Certification Standards Committee.
About HDI
HDI is the professional association and certification body for the technical service and support industry. Facilitating collaboration and networking, HDI hosts acclaimed conferences and events, produces renowned publications and research, and certifies and trains thousands of professionals each year. HDI also connects solution providers with practitioners through industry partnerships and marketing services.
Guided by an international panel of industry experts and practitioners, HDI serves a community of more than 120,000 technical service and support professionals and is the premier resource for best practices and emerging trends.