Neural mechanisms of decision making - emotion vs. cognition

EVS29 International Battery, Hybrid and Fuel Cell Electric Vehicle Symposium 1
EVS29 Symposium
Montréal, Québec, Canada, June 19-22, 2016
Methods to Identify User Needs and Decision Mechanisms
for the Adoption of Electric Vehicles
Axel Ensslen1, Niklas Kuehl
1, Carola Stryja
1, Patrick Jochem
1
1Karlsruhe Service Research Institute (KSRI) at the Karlsruhe Institute of Technology,
Englerstrasse 11, Karlsruhe, 76131, Germany
Summary
The knowledge on user acceptance for electric vehicles is of high relevance for several stakeholders in this
new vehicle market. This study provides an overview of applied methods in adoption research in the field
of electric vehicles. These methods comprehend (1) experimental studies and lab-experiments, (2)
interviews and focus groups, (3) surveys, (4) analyses of sales documentations and (5) social media
analytics. We classify the data collection methods by two dimensions – (A) sample size and (B) degree of
anonymity. We provide case study results for selected methods, identify the advantages, and show how
new methods may complement the traditional approaches in future research.
Keywords: Consumers, EV (electric vehicle), Germany, market, marketing
1 Introduction
During the last years supply and demand for all-electric vehicles (EV) has been rapidly developing [20].
The absolute numbers are, however, still low and the experiences of users with EV scarce. First users
indicated already high overall satisfaction with first generation EV, but also identified some shortcomings
compared to conventional internal combustion engine vehicles (ICEV). E.g. in a survey with French-
German EV users they stated several advantages (such as advantageous driving characteristics, their
characteristic to reduce CO2 emissions, particularly on the local level [10] and enhanced prestige perceived
[8]) but also two main barriers: the limited range and high purchase prices [9]. These findings were
supported by many other surveys [4, 15, 35]. The two major barriers might shrink for the new generation of
EV, which are going to have higher ranges and lower costs due to declining battery prices [33]. But,
nevertheless, knowledge on user needs is still highly relevant for the automotive industry and research.
Literature from different disciplines on this issue is rapidly increasing. Several methods are frequently
applied but – to our knowledge – an overview including most recent methods is still missing. Therefore, we
intend to shed some light into this research gap by (1) providing an overview on existing methods to
identify (potential) customer needs and potential EV adoption decisions and (2) identifying research
question specific advantages for each method. The structure of the paper is as follows: Section 2 provides
an overview of existing methods to explore user needs regarding EV, section 3 presents case study results
from a selection of the methods presented, section 4 discusses the different methodological approaches
before limitations of this study are presented in section 5 and a conclusion and an outlook are provided in
section 6.
World Electric Vehicle Journal Vol. 8 - ISSN 2032-6653 - ©2016 WEVA Page WEVJ8-0673
EVS29 International Battery, Hybrid and Fuel Cell Electric Vehicle Symposium 2
2 Overview on methods to explore user needs for EV
In social sciences interviews and surveys are the most common methods to gain empirical insight in
customer needs. The method of interviews is typically based on a semi-structured guideline and the
interviewers follow a defined set and direction of questions while remaining free to ask more detailed
questions if the interviewee shows the respective expertise [14]. As another way to collect qualitative data
on specific topics, focus groups represent a special form of interviews. A focus group consists of a small
number of experts who discuss a topic in a structured manner. Stated preference surveys are based on a
determined set of questions often conducted ex-ante before choices were made to collect information on
choice intentions for different product or service alternatives. In consequence, most frequently stated
behavioral intentions are measured. But surveys can also be applied ex-post, i.e. after a decision was made
in order to identify revealed preferences. Surveys have the advantage of measuring the answers provided to
the questions precisely. However, the data measured can only reflect decisions from an ex-ante or ex-post
point of view. They are not used to document how potential adoption decisions are taken. Analyzing sales documentations could be an option, particularly for EV stakeholders documenting their sales activities
anyways. However, intimately personal factors affecting decision-making can most likely not be accounted
for by this approach. Therefore, in-depth analyses of single study participants – especially for the analysis
of their unconscious behaviors – are provided by laboratory experiments. With regard to the limited
number of participants in a survey, interview or experiment, new forms of data collection have emerged in
order to analyze several thousand data sets, e.g. through social media analytics. These methods gain insight
about collective opinions and trends, but only reveal intrinsically expressed information by a certain group
of people.
Frequently analyses on needs with regard to EV were based on preferences of representative samples with
respondents who have predominantly never experienced EV. Hence, these analyses might not account for
critical success factors of EV, as e.g. driving pleasure [10]. Asking EV users and fleet managers about their
next car purchase decisions could potentially deliver better insights concerning EV specific needs and
consequently the preferences during upcoming purchase decisions, as trialability of an innovation, i.e.
having the possibility to experience it, is a crucial success factor for its potential adoption [37].
Based on discussions with colleagues in the EV research domain and a brief literature review on methods
used to identify customer needs for EV and decision making, five major categories could be identified.
These are in the following classified according to the origin of data: Data from experimental studies (cf.
section 2.1), from interviews (cf. section 2.2), from surveys (cf. section 2.3), from sales documentations (cf.
section 2.4) and data from social media (cf. section 2.5).
2.1 Analysis of data from experimental studies
According to [36] affective or hedonic attributes such as joy, pride and positive emotions influence EV
purchase intentions. Weaknesses of interviews and surveys include limited explanatory power of effects.
Results from these methods permit to describe certain effects but not their causes [21]. In order to draw
implications about causal links of observed effects actual behavior has to be measured. Useful means for
this are lab experiments. Within lab experiments, choice situations can be simulated and participant’s
behavior can be observed and analyzed in further detail as it would be possible based on data from
interviews or surveys.
The samples used in lab experiments are mostly limited to undergraduate student samples due to practical
issues and budget restrictions. The number of subjects (i.e. participants) necessary for the detection of a
treatment effect depends on the effect magnitude [31]. According to [31], ‘large’ effects require the
treatment of fewer subjects while ‘small’ effects are detected only in larger subject samples. Thus, for
strong effects 10 to 20 subjects per treatment group are sufficient while for moderate effects 20 to 30
subjects per treatment group are recommended [31]. The central question in this research is how emotions
and decision design affect EV purchase decisions. There is only little research on this topic e.g. [28, 12] –
but only based on survey data. The goal of the experiments proposed in this paper will be to analyze how
study participants react on simulated choice tasks for different powertrain alternatives. During the
experiment and choice task completion physiological data is collected. Emotional arousal manifests in
physiological effects which in turn can be observed through electrodermal activity or data from
electrocardiograms. The expected output is to understand the effect emotional factors such as anxiety, joy,
stress, effort or arousal have on EV purchase decisions, which will help to better address these issues in real
purchase situations [7, 24].
World Electric Vehicle Journal Vol. 8 - ISSN 2032-6653 - ©2016 WEVA Page WEVJ8-0674

EVS29 International Battery, Hybrid and Fuel Cell Electric Vehicle Symposium 3
2.2 Analysis of data from interviews and focus groups
A traditional approach to identify customer needs is the interview. Depending on the scope and the
conduction channel (e.g. personal or via telephone), the sample usually consists of 10 to 30 (sometimes
even up to a few hundred) conversations. The interviewees can be selected either randomly or with regard
to their representativeness (e.g. age and gender) [16]. As depicted above, interviews are usually
characterized by a structured questionnaire with mainly open questions in order to encourage the
interviewee to share deeper knowledge. This allows a flexible interview conduction since the interviewer
can switch between questions if this would help to gain a common understanding of the situation and to
keep the conversation fluent [3].
Another closely related approach of gathering qualitative data is the technique of focus groups. Focus
groups are used to gain insight by moderating a group of experts while they are discussing a topic
determined by the researcher. To our knowledge, there is no consensus in literature that clearly
distinguishes focus groups from group interviews but it is said that focus groups differ in general through
their formal setting, their directive interviewing and their structured question formats [30].
Interviews and focus groups with open questions are frequently analyzed by using coding techniques.
Similar comments and expressions made by the interviewees are tagged with same codes to identify
recurring statements and to gain a deeper understanding of the underlying needs and decision processes
[26]. In our field of investigation, insights into the decision processes of vehicle purchase by private
customers or institutions are focused on. By structuring the interview insights, the main influencing
variables on the decision are identified and their relationship examined. The main variables identified in the
interviews might provide the foundation for an experimental study design (cf. section 2.1).
2.3 Analysis of data from surveys
Surveys have the objective to sample individual units from a population by collecting quantitative survey
data with collection techniques such as questionnaires in order to make statistical inference about a
population being studied. If the subsample is chosen properly, the results can be interpreted as
representative for a targeted population. This is a highly desirable property of this methodology.
Methodological challenges include amongst others the identification and selection of potential sample
members, contacting the sampled individuals and collecting data [17]. Survey modes include telephone,
mail (post), online surveys, personal in-home surveys, personal mail or street intercept surveys and hybrids
of these [27]. Decision-making for alternative fuel vehicles based on stated preference analyses has been
studied profoundly during the last years. Particularly choice modelling by using surveys and discrete choice
models were often applied in order to study stated preferences on alternative fuel vehicles [2, 6, 18].
Particularly the application of discrete choice methods on stated or revealed preference data from EV users
and fleet managers with EV experience provide helpful insights in characterizations of potential EV
adopters and their needs [9, 10, 34]. In section 3.1 results from a German case study including survey
questions comparing stated relevance of different criteria for EV and ICEV purchase decisions are
presented.
2.4 Analysis of data from sales documentations
Today, most sales departments dealing with complex products apply customer relationship management
(CRM) approaches in order to improve business relationships to their customers. In these CRM systems, all
contact activities with customers are documented – even if they happen with different salespersons or
departments. The underlying database can be analyzed by applying data mining methods. E.g. in order to
provide a basis for decision making and support the identification of sales potentials [13]. However, as
global EV sales activities just started to increase during the last years [20], we could not find any published
study on documented sales activities for EV. This approach could shed light on the vehicle purchase
decision from a different perspective. Documented sales activities could provide in-depth insights in
decision-making structures for EV adoption. Particularly sales documentations for B2B sales activities
seem worth of being analyzed more profoundly [32] because commercial car purchases exceed private ones
significantly. First results from a German case study are provided in section 3.2.
World Electric Vehicle Journal Vol. 8 - ISSN 2032-6653 - ©2016 WEVA Page WEVJ8-0675

EVS29 International Battery, Hybrid and Fuel Cell Electric Vehicle Symposium 4
2.5 Analysis of social media data
Apart from rather “traditional” approaches, a different – available and free – comprehensive data source
comes from social media. The most popular social networking sites are Facebook and Twitter [19]. While
Facebook users mostly post privately within their own friends’ communities [38], micro blog data on
Twitter is publicly accessible. These micro blog posts (“tweets”) contain a total of 140 characters and are
expressed publicly to be read, liked, shared (“retweet”) or commented. Obtained data is (in general) not
representative for the population; Recent studies show that people using Twitter tend to be more open than
others – especially when tweeting about research and science topics [25], like e-mobility. Nonetheless, a
representativeness concerning age and location is possible by filtering the metadata. The observation size
can be theoretically up to 1.3 billion1.
The central question is if and how tweets can be used to automatically identify and quantify customer needs
in the field of e-mobility. Therefore, a sample of tweets can be manually labelled on whether or not they
contain a customer need by independent researchers. With the labelled data at hand, supervised learning
algorithms are trained to identify the structure of tweet instances containing customer needs. The best-
performing model is then used on large micro blog data sets to automatically identify such “need-tweets”.
These needs can be extracted by either looking at the aggregated data or applying unsupervised clustering
algorithms to gain knowledge on their nature and quantity. If the needs are previously known and the
objective is only to quantify them, it is possible to use pre-defined “whitelists” or more complex ontologies
to validate them (in the data). The expected output is a list of “top needs”, based on how often they were
expressed. The results have the main advantages of only considering needs that are willingly and
intrinsically expressed by (possible) customers and that it is easily scalable. One disadvantage lies with the
fact that only Twitter users are analyzed. Exemplary results from a first case study are provided in section
3.3.
3 Selected case study results
Within this section exemplary results from the methodological approaches presented in section 2 are given
in order to learn about strengths and weaknesses of selected approaches. Results presented are from
analyzing a set of questions collected during a survey for fleet managers of EV using organizations (section
3.1), from analysing sales documentations (section 3.2), and from analysing social media data (section
3.3).
3.1 Analysis of data from surveys
As an example for results from surveys we focus on vehicle purchase criteria from organizational fleet
managers within this case study. In order to derive critical success factors for EV adoption in organizations
a large field trial with 327 EV in 109 organizations was carried out in the southern part of Germany.
Profound information on the case study are available in [11]. 109 fleet managers, i.e. persons in
organizations responsible for car purchase decisions, were interviewed between March 2014 and August
2015. All fleet managers who provided answers to the survey worked for organizations participating in the
project, i.e. already took the decision to purchase EV.
The fleet managers were asked to select the most important criterion they consider first amongst 11 criteria
when they took the purchase decisions for EV. Subsequently they were asked to indicate which criteria
they considered afterwards. The same set of questions was asked about the criteria the fleet managers
consider when making purchase decisions for ICEV. In order to test if the fleet managers’ purchase
decision criteria for the two drive train technologies were different, Mann-Whitney U Tests were carried
out with IBM SPSS Statistics 22.
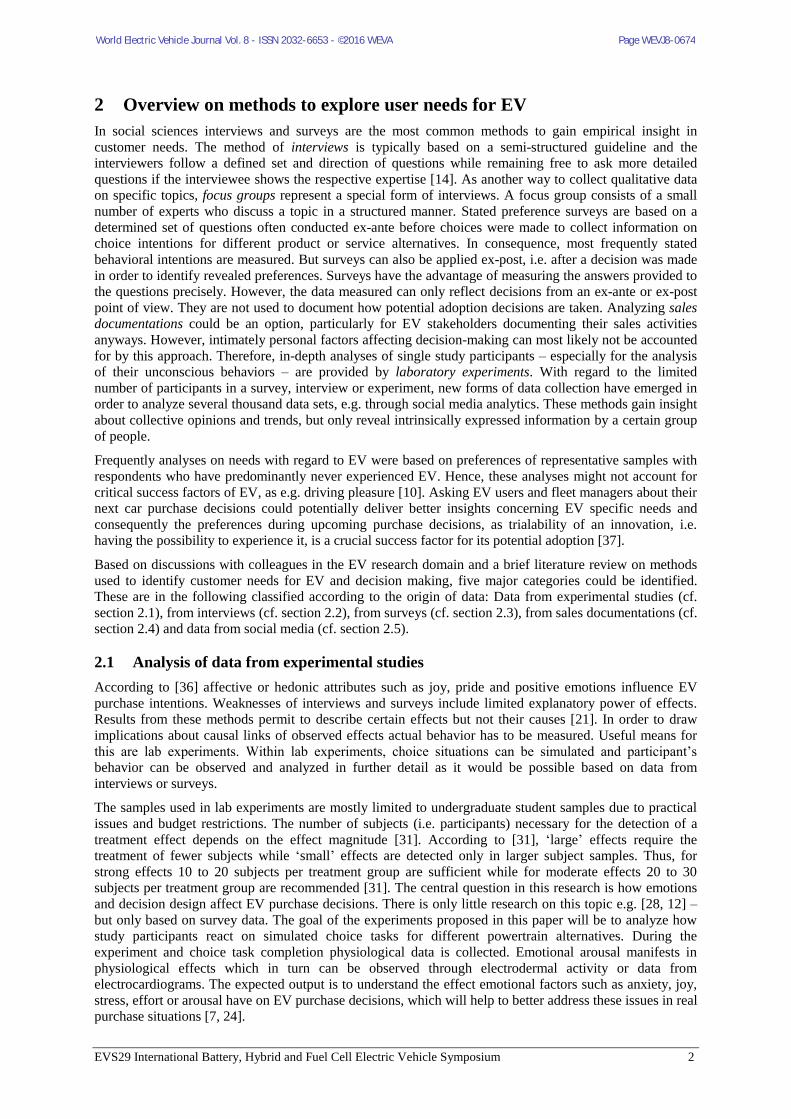
Figure 1 provides an overview on the results. The criteria of safety (U(95,87) = 4,952.5; Z = 2.732;
p = .006; r = 0.20), car size (U(95,87) = 5,499; Z = 4.083; p < .001; r = 0.30) and usage costs
(U(95,87) = 5,282.5; Z = 3.664; p < .001; r = 0.27) are involved significantly later and less frequently when
deciding to purchase an EV than in purchase decisions for ICEV. Contrariwise, the design is considered
earlier and more frequently. The higher importance of the criterion design (U(95,87) = 3,523.5; Z = -2.128;
p = .033; r = -0.16) could be an indication that the perception of the EV by the social environment is more
1 Total users of Twitter as of 2015, c.f. http://www.businessinsider.com/twitter-monthly-active-users-2015-7?r=UK&IR=T
World Electric Vehicle Journal Vol. 8 - ISSN 2032-6653 - ©2016 WEVA Page WEVJ8-0676
EVS29 International Battery, Hybrid and Fuel Cell Electric Vehicle Symposium 5
important. One could see it as a confirmation of the assumption, that in addition to meeting mobility
requirements, EV are used for public relations purposes. Furthermore, range (U(95,87) = 2,289.5; Z = -
6.005; p < .001; r = -0.45) is considered earlier and more frequently during EV purchase decisions, what
was expected, as EV range is still considered a major barrier restraining wide adoption. According to [5]
effect sizes for the criteria safety and design are rather small. Effect sizes for car size and usage costs are
medium whereas effect sizes for range are close to being strong.
Figure 1: Purchase decision criteria for EV and ICEV mentioned by the participating organizations’ fleet managers
3.2 Analysis of data from sales documentations
During a large e-mobility field trial in Germany including 109 organizations with 327 EV sales activities
were documented by the sales force. Sales did not only comprehend EV, but also additional services. These
offered service bundles, “e-mobility product service systems” (PSS), include besides EV, the
corresponding charging infrastructure and further connected charging services. Profound information on
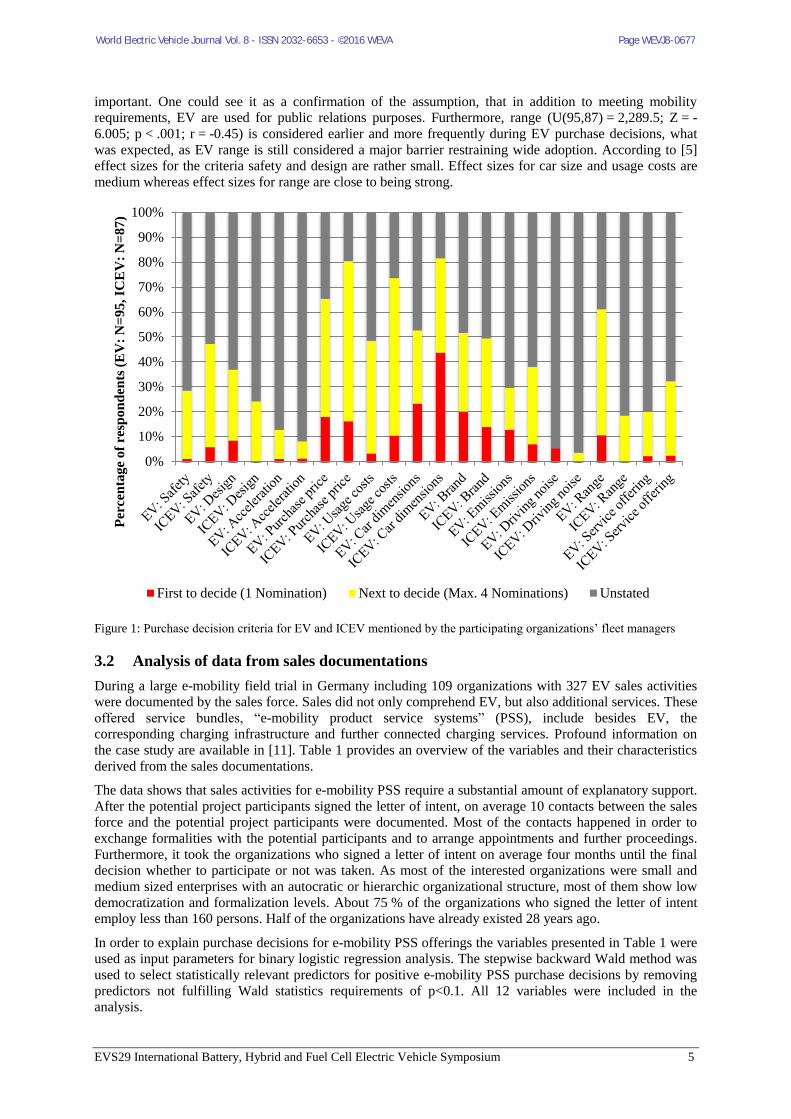
the case study are available in [11]. Table 1 provides an overview of the variables and their characteristics
derived from the sales documentations.
The data shows that sales activities for e-mobility PSS require a substantial amount of explanatory support.
After the potential project participants signed the letter of intent, on average 10 contacts between the sales
force and the potential project participants were documented. Most of the contacts happened in order to
exchange formalities with the potential participants and to arrange appointments and further proceedings.
Furthermore, it took the organizations who signed a letter of intent on average four months until the final
decision whether to participate or not was taken. As most of the interested organizations were small and
medium sized enterprises with an autocratic or hierarchic organizational structure, most of them show low
democratization and formalization levels. About 75 % of the organizations who signed the letter of intent
employ less than 160 persons. Half of the organizations have already existed 28 years ago.
In order to explain purchase decisions for e-mobility PSS offerings the variables presented in Table 1 were
used as input parameters for binary logistic regression analysis. The stepwise backward Wald method was
used to select statistically relevant predictors for positive e-mobility PSS purchase decisions by removing
predictors not fulfilling Wald statistics requirements of p<0.1. All 12 variables were included in the
analysis.
0%
10%
20%
30%
40%
50%
60%
70%
80%
90%
100%
Per
cen
tage
of
resp
on
den
ts (
EV
: N
=9
5, IC
EV
: N
=8
7)
First to decide (1 Nomination) Next to decide (Max. 4 Nominations) Unstated
World Electric Vehicle Journal Vol. 8 - ISSN 2032-6653 - ©2016 WEVA Page WEVJ8-0677
EVS29 International Battery, Hybrid and Fuel Cell Electric Vehicle Symposium 6
Table 1: Data set derived from the sales documentations of the field trial considered
Nominal variables N Percentages
Decision to participate in the field trial, i.e. decision to
purchase e-mobility PSS. 229
Positive purchase decision for PSS: 50.22 %;
Negative purchase decision for PSS: 30.57 %;
No decision: 19.21 %
Democratization level2 220 High: 15.5 % Low: 84.5 %
Formalization level3 220 High: 29.1 % Low: 70.9 %
Metric variables N Min Max M SD 𝒒𝟎.𝟐𝟓 𝒒𝟎.𝟓𝟎 𝒒𝟎.𝟕𝟓
Duration (in days) between signing the letter of intent and
signing the contract to purchase the e-mobility PSS
offered.
186 4 536 122 103 55 88 149
Total number of contacts between potential participants
and project specific sales force. A signed contract is
defined as a single sales activity.
229 1 35 10.21 5.69 7 9 12
Number of reminder contacts: Number of contacts that
took place to remind the potential participant of handing
in missing documents. Furthermore this number counts
how often the sales force had to ask the contact person if
there is still interest to participate in the project.
229 0 6 0.62 1.12 0 0 1
Number of proactive contacts: This number counts how
often the potential participant showed to be proactive and
interested in participating in the project. 229 0 3 0.17 0.46 0 0 0
Number of contacts to persuade: Number of contacts with
further information sent to the organization in order to
persuade them from participating in the project. 228 0 3 0.37 0.64 0 0 1
Number of formal contacts: Formal contacts took place to
exchange formalities between the potential participants
and project partners. (e.g. distribution of documents in
particular offers, letter of acceptance, cancellation)
229 0 12 5.03 2.26 3 5 6
Number of contacts to arrange appointments and further
proceedings 229 0 13 3.20 2.68 1 2 4
Number of failed contacts attempts 229 0 9 0.8 1.49 0 0 1
Organizations’ number of employees4 154 1 65000 955 6003 14 51 155
Organizations’ founding year5 162 1820 2015 1979 35 1972 1989 2003
Only organizations who communicated their e-mobility PSS purchase decision were included in the
analysis. Therefore, results from 177 organizations could be included in the analysis. 43 of the 52
organizations not considered did not communicate their decision. Missing values for 9 of the remaining 186
organizations who communicated their decision results in the final set of 177 organizations in this analysis.
2 Democratization level of an organization has to do with the number of people involved in decisions concerning fleet issues and their
decision-making autonomy. A decision-making structure is considered lowly democratized when decisions are made at a single point in the
organization by one or two individuals without further authorization, and highly democratized when the process involves several individuals and departments. Other indicators of lowly democratized decision-making: decision processes are initiated by only a dominating few;
decision action results from proactive opportunity-seeking behaviour; solutions emphasize positive goals (rather than immediate fixes);
solutions result in major departures from existing circumstances; decisions are highly integrated with the goals of the organization; and cognitive limitations prevent optimal solutions [32]. 3 Formalization level represents the extent to which rules and formal procedures guide the decisions concerning fleet issues. Fleets with
formalized decision-making behaviour usually codify rules and procedures as written policy. At higher levels of formalization, decisions are generally initiated only in response to problems that disrupt standard operating procedures. In less formalized organizations, decisions are
guided more by intuition, personal judgement, and political bargaining [32]. 4 Information from company profile databases 5 Information from company profile databases
World Electric Vehicle Journal Vol. 8 - ISSN 2032-6653 - ©2016 WEVA Page WEVJ8-0678
EVS29 International Battery, Hybrid and Fuel Cell Electric Vehicle Symposium 7
67 organizations communicated not to be willing to purchase the e-mobility PSS offering and 110
organizations took a positive purchase decision. The method for determining the model excluded 6
variables, i.e. the total number of contacts between potential e-mobility PSS adopters and the sales force,
the democratization level, the number of contacts to arrange appointments and further proceedings, the
number of failed contacts attempts, the organizations’ number of employees as well as the organizations’
founding year. Table 2 provides an overview of the variables in the binary logistic regression model
derived.
Table 2: Variables in the model
B S.E. Wald df Sig. Exp(B)
Duration of e-mobility PSS purchase decision -0.012 0.003 19.360 1 0.000 0.988
Level of formalization 0.704 0.417 2.854 1 0.091 2.023
Number of reminder contacts 0.585 0.240 5.941 1 0.015 1.796
Number of proactive contacts 1.040 0.612 2.886 1 0.089 2.830
Number of contacts to persuade 0.782 0.340 5.291 1 0.021 2.186
Number of formal contacts 0.165 0.091 3.255 1 0.071 1.179
Constant 0.122 0.544 0.051 1 0.822 1.130
The probability of organizations for positive e-mobility PSS purchase decisions decrease significantly with
increasing duration of the decision making process. On the other hand probabilities for positive e-mobility
PSS purchase decisions increase with an increasing level of formalization in the organizations, with an
increasing number of contacts, i.e. reminder contacts, proactive contacts, contacts to persuade as well as
formal contacts. Multi-collinearities could not be observed, as all correlations between dependent variables
are inferior to 0.8 [29]. The model summary indicates that the overall quality is acceptable (-2 Log
likelihood: 187.4; Cox and Snell R Square: 0.24; Nagelkerke R Square: 0.32). Therefore our results show
that an acceptable part of the variations observed concerning e-mobility PSS adoption decisions can be
explained by variables derived from underlying textual sales documentations.
The results show that sales activities for e-mobility PSS require high amounts of consultancy and take very
long, although monetary incentives were provided in order to make quick decisions. As the field
experiment proves that e-mobility PSS co-creating value in service networks between charge point
operators and EV users could be allocated successfully in 109 organizations, we recommend to couple
monetary incentives to e-mobility PSS adopting organizations contributing actively to service networks
intending to overcome EV specific barriers as the lack of accessible charging infrastructure and range
anxiety. Furthermore, we recommend e-mobility PSS selling organizations to create e-mobility PSS offers
which are customer-oriented, i.e. useful and easy to understand. Attempts to reduce complexity might be
fruitful. Considering that public relations purposes are currently a driving factor for successful e-mobility
PSS sales activities (section 3.1), services explicitly supporting this goal of e-mobility PSS adopting
organizations might create additional value.
3.3 Analysis of social media data
A first study showed that in a set of 600k retrieved e-mobility-specific tweets, 2.4k have high potential
concerning needs directly expressed by users for Germany (disregarding bots, news, ads) [22]. The data set
was received between March and August 2015 by recording all German-speaking tweets that contained one
of 33 e-mobility-specific key words6 via the Twitter Streaming API. The 2.4k potentially interesting tweets
were labelled by 35 paid individuals on whether or not they contain a need. With this data at hand, Machine
Learning algorithms can be trained to automatically detect tweets that contain customer needs in the future,
which is part of ongoing research [23] beyond this paper.
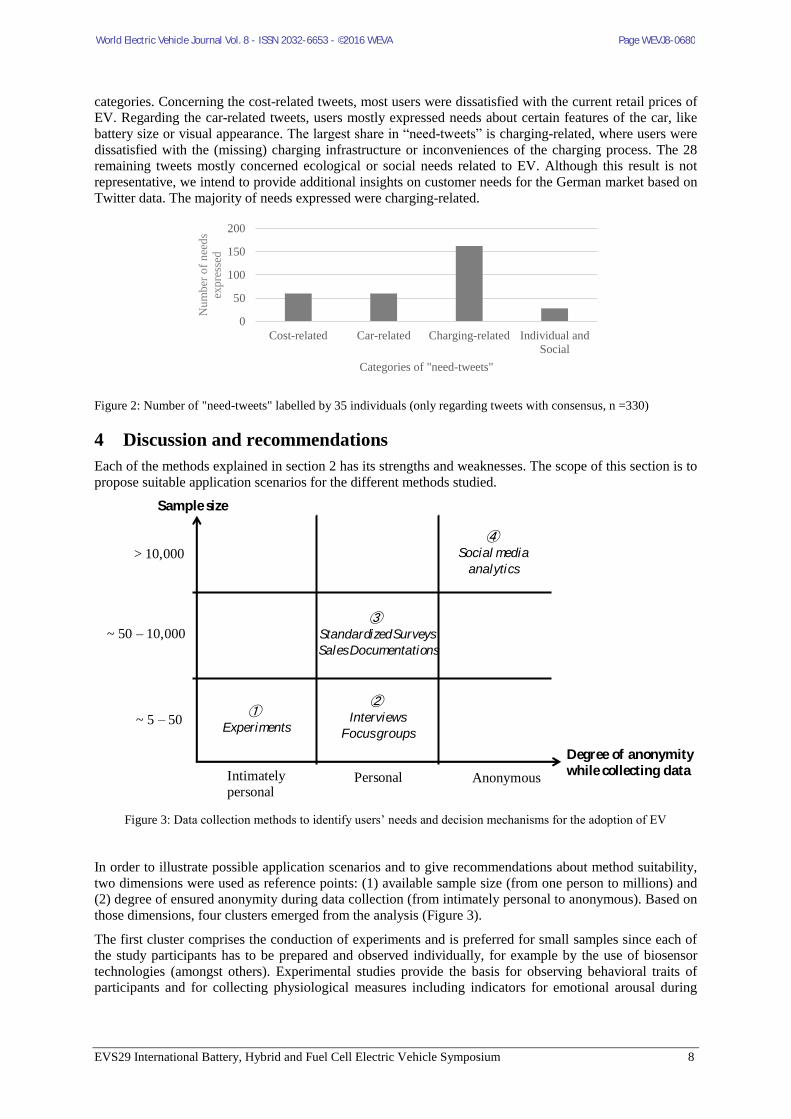
Out of the 2.4k tweets, there was a consensus between labelers on 330 tweets expressing needs. The
remaining data were either tweets not containing a need or tweets with disagreements [23]. Of those 330
“need-tweets”, 60 were cost-related, 60 car-related, 162 charging-related and 28 about individual and social
needs (Figure 2). Other references were specific and could not be related to any of the four mentioned
6 Keywords (alphabetical, case-insensitive): bmw i3; e-tankstelle; eauto; ecar; egolf; electric mobility; electric vehicle; elektroauto;
elektrofahrzeug; elektromobilitaet; elektromobilität; e-mobility; emobility; eup; fortwo electric drive; ladesaeule; ladesäule; miev; nissan leaf; opel ampera; peugeot ion; renault zoe; tesla model s.
World Electric Vehicle Journal Vol. 8 - ISSN 2032-6653 - ©2016 WEVA Page WEVJ8-0679
EVS29 International Battery, Hybrid and Fuel Cell Electric Vehicle Symposium 8
categories. Concerning the cost-related tweets, most users were dissatisfied with the current retail prices of
EV. Regarding the car-related tweets, users mostly expressed needs about certain features of the car, like
battery size or visual appearance. The largest share in “need-tweets” is charging-related, where users were
dissatisfied with the (missing) charging infrastructure or inconveniences of the charging process. The 28
remaining tweets mostly concerned ecological or social needs related to EV. Although this result is not
representative, we intend to provide additional insights on customer needs for the German market based on
Twitter data. The majority of needs expressed were charging-related.
Figure 2: Number of "need-tweets" labelled by 35 individuals (only regarding tweets with consensus, n =330)
4 Discussion and recommendations
Each of the methods explained in section 2 has its strengths and weaknesses. The scope of this section is to
propose suitable application scenarios for the different methods studied.
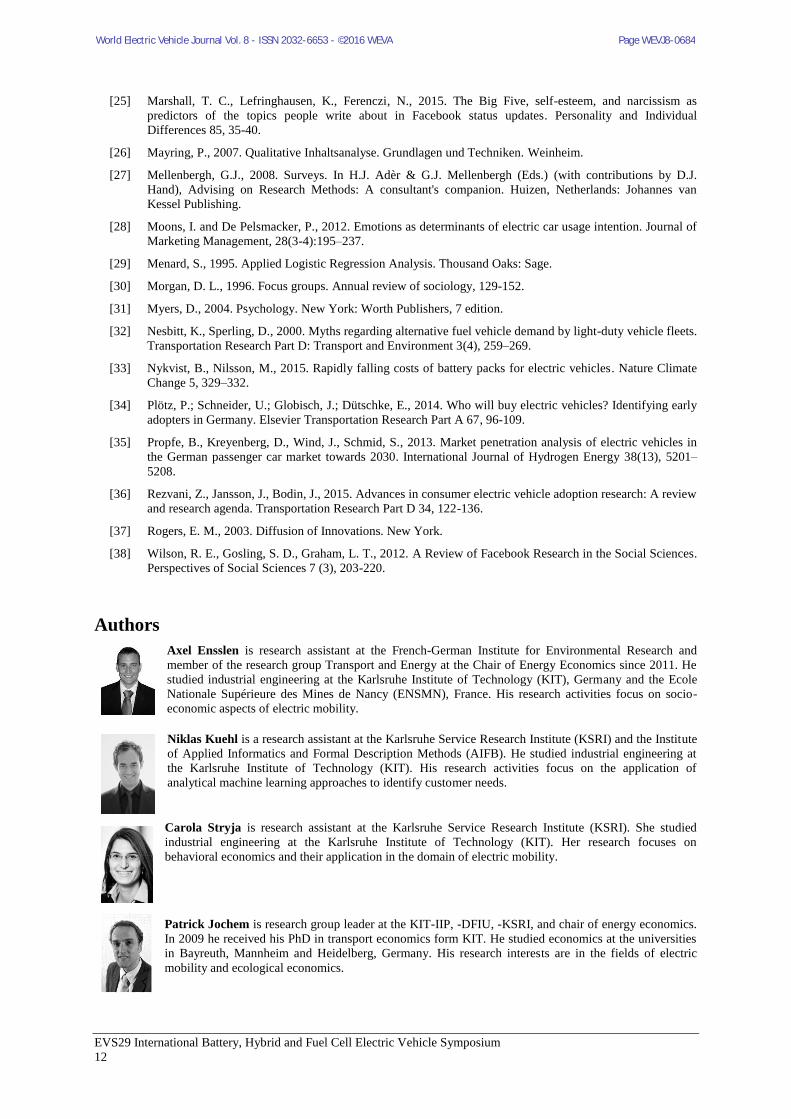
Figure 3: Data collection methods to identify users’ needs and decision mechanisms for the adoption of EV
In order to illustrate possible application scenarios and to give recommendations about method suitability,
two dimensions were used as reference points: (1) available sample size (from one person to millions) and
(2) degree of ensured anonymity during data collection (from intimately personal to anonymous). Based on
those dimensions, four clusters emerged from the analysis (Figure 3).
The first cluster comprises the conduction of experiments and is preferred for small samples since each of
the study participants has to be prepared and observed individually, for example by the use of biosensor
technologies (amongst others). Experimental studies provide the basis for observing behavioral traits of
participants and for collecting physiological measures including indicators for emotional arousal during
0
50
100
150
200
Cost-related Car-related Charging-related Individual and
Social
Nu
mb
er o
f n
eed
s
exp
ress
ed
Categories of "need-tweets"
Sample size
Degree of anonymitywhilecollecting data
> 10,000
~ 50 – 10,000
~ 5 – 50
AnonymousPersonalIntimately
personal
①Experiments
②Interviews
Focus groups
③StandardizedSurveys
SalesDocumentations
④Social media
analytics
World Electric Vehicle Journal Vol. 8 - ISSN 2032-6653 - ©2016 WEVA Page WEVJ8-0680

EVS29 International Battery, Hybrid and Fuel Cell Electric Vehicle Symposium 9
simulated decision situations. In the context of decision behavior analysis, this approach allows to analyze
the influence of emotions on EV adoption decisions.
The second cluster includes the qualitative social research methods of interviews and focus groups
comprising data collected on a personal level. These two methods can be used to explore needs when
requirements for new products and services are still diffuse and ideas and concepts need to be developed.
Furthermore, qualitative methods are also applied when sample sizes of persons who had possibilities to
test innovations are too small for using quantitative methods.
Data from the third cluster either originate from conversations (e.g. sales documentations) or is collected in
surveys. Stated preference surveys provide the basis to check hypotheses frequently generated in qualitative
pre-studies. Stated preference surveys are usually conducted within a certain context that might be more or
less constructive in order to provide an answer to the research question considered. For example, asking
persons who have not made any experiences with EV about their preferences might be biased, as EV
specific needs cannot be known at first hand by persons who never used an EV. Another example concerns
analyses of the decision making process for e-mobility PSS. Asking EV users, who were not involved in e-
mobility PSS purchase decisions on this decision process might be biased, too. On the other hand, using
surveys to address research questions concerning subjective experiences of fleet managers and decision
makers during their e-mobility PSS decision-making processes might deliver interesting results,
particularly concerning subjective perceptions. In all cases the researchers interact with the study
participants, i.e. the study participants know that they contribute to research activities. Surveys, focus
groups and guided interviews are well established in the research community and have been broadly used
in EV adoption studies.
Concerning white spots in empirical research, we identified a lack of studies analyzing revealed
preferences, i.e. studies based on objective data documenting EV adopters’ e-mobility PSS adoption
decisions from sales forces point of view. Our analyses of documented sales activities for e-mobility PSS
intended to close this gap. We therefore analyzed sales documentations of e-mobility PSS originating from
an e-mobility project in the southern part of Germany. Insights into procurement decisions of e-mobility
PSS could be provided although the process of decision-making remained hidden. Certain performance
indicators during the decision-making process provided information on success potentials concerning e-
mobility PSS sales activities.
The fourth cluster includes methodological approaches analyzing social media data. These methods should
be preferably used if huge data sets of many (potential) users are required and results are needed quickly.
As it can be applied in real-time and no man-power is required, it is well-suited to identify trends.
Innovative applications might be possible, e.g. analyses of effectiveness of political measures being tested
and investigated in real-time. As only already available data published on social media platforms are used,
the collection of data is mostly anonymous. Furthermore, only aggregated data seem of interest when
macroeconomic trends are analyzed.
To the best of our knowledge there have been neither studies available analyzing EV adoption decision
mechanisms during choice experiments coupled with physiological measures for emotions, nor any
published studies analyzing e-mobility PSS adoption decisions of organizations based on sales
documentations, nor studies analyzing trends concerning potential EV users’ needs based on data from
social media. Therefore, the work presented in this article significantly increases the methodological
approaches used in e-mobility market research activities. We propose that results from traditional methods
might be supported by the results from other methodological approaches in order to increase their
reliability.
5 Limitations
We do not claim to cover the complete set of methods available, i.e. our listed five methods only represent
a subsample of methods to identify customer needs. E.g. Design Thinking [1] is not considered in this
study.
The experimental studies planned face several challenges. First of all, the currently targeted samples
focusing on local students cause severe sample biases, as they might not have any experiences with EV and
might not have been involved in EV purchase decisions so far. Furthermore, real EV purchase scenarios are
difficult to simulate due to budget restrictions for the planned experiments. Simulating EV adoption
scenarios by consideration of rental scenarios might be a less cost intensive alternative.
World Electric Vehicle Journal Vol. 8 - ISSN 2032-6653 - ©2016 WEVA Page WEVJ8-0681

EVS29 International Battery, Hybrid and Fuel Cell Electric Vehicle Symposium
10
Concerning the case study results analyzing survey data and sales documentations it needs to be critically
mentioned that project specific e-mobility PSS could only be successfully allocated due to the monetary
incentives provided to the organizations for taking part in the field experiment with a contractual obligation
to acquire an EV, project specific connected charging infrastructure and corresponding connected charging
services [11]. Organizations willing to participate were incentivized to take the decision as quickly as
possible, as the monetary incentives were provided for each month the organizations were participating in
the project, which lasted until the end of 2015. Furthermore, the sample is not representative for the
German organizations as the sectors manufacturing, information and communication and public
administration are overrepresented whereas the sectors wholesale and trade and other service activities are
underrepresented. However, the sample might be representative for EV adopting organizations in the
southern part of Germany (Baden-Württemberg) in the year 2014. As documentations for e-mobility PSS
sales activities are only available for organizations who signed a letter of intent at sales events for e-
mobility PSS, information on organizations that were generally interested, but did not sign the letter of
intent, are missing and not considered in our analyses.
Concerning the analysis of social media, filtering “the nuggets” from the huge amount of textual data sets
available as well as fully automating their treatment including machine learning methods remain
challenging tasks.
6 Conclusions and Outlook
The knowledge on user acceptance for electric vehicles might influence the mid-term market potentials of
electric vehicles considerably. Hence, electric vehicle providers have a significant interest in this
information. We developed an overview of applied methods in adoption research in the field of electric
vehicles. These methods comprehend (1) experimental studies and lab-experiments, (2) interviews and
focus groups, (3) surveys, (4) analyses of sales documentations, and (5) social media analytics.
Furthermore, we classified the methods by two dimensions: (A) sample size and (B) degree of anonymity.
We identified the advantages of each methodology and showed how the new methods may complement the
traditional approaches in future research and provided selected results for some methods.
Even though our overview is not complete, the general recommendations persist. There is no unambiguous
suggestion, but general assistance: While user needs of products in the very early market phase might be
better analyzed by experiments or interviews and focus groups, the user needs of already established
products might be better and analyzed by data from representative surveys. The results might be supported
by insights from sales documentation and social media data analysis. Social media analyses can support in
exploring trends, quantifying needs and offers the possibility to work with real-time-data. We showed that
the analysis of sales documentation can reveal promising insights on customer needs. Therefore, we
encourage e-mobility service providers to permit scientists further access to selected sales data in the
future.
Future research might improve algorithms for analyzing sales documentations and data from social media.
It might be worth to develop algorithms automatically structuring sales documentations and social media
data by automating data extraction and improving statistical modelling by applying business analytics and
machine learning methods. This could be beneficial to better support sales activities for e-mobility product
service systems in the future. Social media analytics could be a promising tool in supporting the detection
of new challenges in e-mobility.
Acknowledgments
This paper has been written in the context of the research projects DELFIN, Get eReady and the
Profilregion Mobilitätssysteme Karlsruhe. The DELFIN project is funded by the German Federal Ministry
of Education and Research (BMBF) under the promotion sign 01FE13002. The Get eReady project is
funded by the German Federal Ministery of Economics and Energy (BMWI) under the promotion sign
16SBW020E. The Profilregion Mobilitätssysteme Karlsruhe is funded by the Ministry of Science, Research
and the Arts Baden-Württemberg (MWK). We also thank the project management agency German
Aerospace Center (PT-DLR) for the project support.
World Electric Vehicle Journal Vol. 8 - ISSN 2032-6653 - ©2016 WEVA Page WEVJ8-0682

EVS29 International Battery, Hybrid and Fuel Cell Electric Vehicle Symposium
11
References
[1] Brown, T., 2008. Design Thinking. Harvard Business Review. S. 84–92.
[2] Brownstone, D., Bunch, D. S., Train, K. E., 2000. Joint mixed logit models of stated and revealed
preferences for alternative-fuel vehicles. Transportation Res. Part B: Methodological 34(5),315–338.
[3] Bryman, A.; Bell, E., 2011:Business Research Methods. New York: Oxford University press.
[4] Bühler, F., Cocron, P., Neumann, I., Franke, T., Krems, J. F., 2014. Is EV experience related to EV
acceptance? Results from a German field study. Transportation Research Part F 25, 34-49.
[5] Cohen, J., 1992. A power primer. Psychological Bulletin, 112, 155-159.
[6] Daziano, R. A., Achtnicht, M., 2014. Forecasting Adoption of Ultra-Low-Emission Vehicles Using Bayes
Estimates of a Multinomial Probit Model and the GHK Simulator. Transportation Science 4, 671-683.
[7] Desmet, P. M., Hekkert, P., Jacobs, J. J., 2000. When a car makes you smile. Advances in consumer
research 27, 111-117.
[8] Ensslen, A., Jochem, P., Fichtner, W., 2013. Experiences of EV Users in the French-German Context,
Proceedings of EVS27-Conference, Barcelona, Spain.
[9] Ensslen, A., Jochem, P., Rometsch, M., Fichtner, W., 2016. Adoption of EV in the French-German context.
In: Schäuble, J., Jochem, P., Fichtner, W., 2016. Cross-border Mobility for Electric Vehicles. KIT Scientific
Publishing.
[10] Ensslen, A., Paetz, A.-G., Babrowski, S., Jochem, P., Fichtner, W., 2015. On the road to an electric mobility
mass market - How can early adopters be characterized?. In: Working Paper Series in Production and
Energy, No. 8, ISSN: 2196-7296.
[11] Ensslen, A., Gnann, T., Globisch, J., Plötz, P., Jochem, P., Fichtner, W., 2016. Willingness to Pay for E-
Mobility Services: A Case Study from Germany. In KSS 2016 Proceedings. Karlsruhe.
[12] Franke, T., Neumann, I., Bühler, F., Cocron, P., and Krems, J. F., 2012. Experiencing Range in an Electric
Vehicle: Understanding Psychological Barriers. Applied Psychology 61(3), 368–391.
[13] Gerecke, U. Customer Relationship Management, 2001. Controlling 13 (4-5), 235-242.
[14] Gläser, J., Laudel, G., 2010. Experteninterviews und qualitative Inhaltsanalyse. Wiesbaden: Springer-
Verlag.
[15] Gnann, T., Plötz, P., Kühn, A., Wietschel, M., 2015. Modelling market diffusion of electric vehicles with
real world driving data – German market and policy options. Transportation Research Part A 77, 95-112.
[16] Griffin, A., Hauser J. R. 1993. The voice of the customer. Marketing science 12 (1), 1-27.
[17] Groves, R.M., Fowler, F. J., Couper, M.P., Lepkowski, J.M., Singer, E., Tourangeau, R., 2009. Survey
Methodology. New Jersey: John Wiley & Sons.
[18] Hidrue, M. K., Parsons, G. R., Kempton, W., Gardner, M. P., 2011. Willingness to pay for electric vehicles
and their attributes. Resource and Energy Economics 33 (3), 686-705.
[19] Hughes, D. J., Rowe, M., Batey, M. and Lee, A., 2012. A tale of two sites:Twitter vs. Facebook and the
personality predictors of social media usage. Computers in Human Behavior 28 (2), pp. 561-569.
[20] IAE – International Energy Agency (2013). Global EV Outlook.
https://www.iea.org/publications/freepublications/publication/GlobalEVOutlook_2013.pdf, accessed on
2016-03-10.
[21] Kantowitz, B. H., Roediger III, H. L., and Elmes, D. G., 2005. Experimental Psychology - Understanding
Psychological Research. Stamford: Wadsworth Thomson Learning, 8 edition.
[22] Kuehl, N., Scheurenbrand, J., Satzger, G., 2016. ''Needs from Tweets'': Towards Deriving Customer Needs
From Micro Blog Data. Multikonferenz Wirtschaftsinformatik (MKWI), Illmenau, Germany.
[23] Kuehl, N., Scheurenbrand, J., Satzger, G., 2016. Needmining: Identifying customer needs in micro blog
data, KSRI Discussion Paper, Karlsruhe, Germany.
[24] Luce, M. F., 1998. “Choosing to Avoid: Coping with Negatively Emotion‐laden Consumer Decisions”.
Journal of Consumer Research 24(4), 409–433.
World Electric Vehicle Journal Vol. 8 - ISSN 2032-6653 - ©2016 WEVA Page WEVJ8-0683
EVS29 International Battery, Hybrid and Fuel Cell Electric Vehicle Symposium
12
[25] Marshall, T. C., Lefringhausen, K., Ferenczi, N., 2015. The Big Five, self-esteem, and narcissism as
predictors of the topics people write about in Facebook status updates. Personality and Individual
Differences 85, 35-40.
[26] Mayring, P., 2007. Qualitative Inhaltsanalyse. Grundlagen und Techniken. Weinheim.
[27] Mellenbergh, G.J., 2008. Surveys. In H.J. Adèr & G.J. Mellenbergh (Eds.) (with contributions by D.J.
Hand), Advising on Research Methods: A consultant's companion. Huizen, Netherlands: Johannes van
Kessel Publishing.
[28] Moons, I. and De Pelsmacker, P., 2012. Emotions as determinants of electric car usage intention. Journal of
Marketing Management, 28(3-4):195–237.
[29] Menard, S., 1995. Applied Logistic Regression Analysis. Thousand Oaks: Sage.
[30] Morgan, D. L., 1996. Focus groups. Annual review of sociology, 129-152.
[31] Myers, D., 2004. Psychology. New York: Worth Publishers, 7 edition.
[32] Nesbitt, K., Sperling, D., 2000. Myths regarding alternative fuel vehicle demand by light-duty vehicle fleets.
Transportation Research Part D: Transport and Environment 3(4), 259–269.
[33] Nykvist, B., Nilsson, M., 2015. Rapidly falling costs of battery packs for electric vehicles. Nature Climate
Change 5, 329–332.
[34] Plötz, P.; Schneider, U.; Globisch, J.; Dütschke, E., 2014. Who will buy electric vehicles? Identifying early
adopters in Germany. Elsevier Transportation Research Part A 67, 96-109.
[35] Propfe, B., Kreyenberg, D., Wind, J., Schmid, S., 2013. Market penetration analysis of electric vehicles in
the German passenger car market towards 2030. International Journal of Hydrogen Energy 38(13), 5201–
5208.
[36] Rezvani, Z., Jansson, J., Bodin, J., 2015. Advances in consumer electric vehicle adoption research: A review
and research agenda. Transportation Research Part D 34, 122-136.
[37] Rogers, E. M., 2003. Diffusion of Innovations. New York.
[38] Wilson, R. E., Gosling, S. D., Graham, L. T., 2012. A Review of Facebook Research in the Social Sciences.
Perspectives of Social Sciences 7 (3), 203-220.
Authors
Axel Ensslen is research assistant at the French-German Institute for Environmental Research and
member of the research group Transport and Energy at the Chair of Energy Economics since 2011. He
studied industrial engineering at the Karlsruhe Institute of Technology (KIT), Germany and the Ecole
Nationale Supérieure des Mines de Nancy (ENSMN), France. His research activities focus on socio-
economic aspects of electric mobility.
Niklas Kuehl is a research assistant at the Karlsruhe Service Research Institute (KSRI) and the Institute
of Applied Informatics and Formal Description Methods (AIFB). He studied industrial engineering at
the Karlsruhe Institute of Technology (KIT). His research activities focus on the application of
analytical machine learning approaches to identify customer needs.
Carola Stryja is research assistant at the Karlsruhe Service Research Institute (KSRI). She studied
industrial engineering at the Karlsruhe Institute of Technology (KIT). Her research focuses on
behavioral economics and their application in the domain of electric mobility.
Patrick Jochem is research group leader at the KIT-IIP, -DFIU, -KSRI, and chair of energy economics.
In 2009 he received his PhD in transport economics form KIT. He studied economics at the universities
in Bayreuth, Mannheim and Heidelberg, Germany. His research interests are in the fields of electric
mobility and ecological economics.
World Electric Vehicle Journal Vol. 8 - ISSN 2032-6653 - ©2016 WEVA Page WEVJ8-0684