Methods of Analysis by the U.S. Geological Survey … · Gas chromatogram with flame photometric...
34
Methods of Analysis by the U.S. Geological Survey National Water Quality Laboratory—Determination of Organophosphate Pesticides in Whole Water by Continuous Liquid-Liquid Extraction and Capillary-Column Gas Chromatography with Flame Photometric Detection ______________________________________________________________________ Water-Resources Investigations Report 03–4139 U.S. Department of the Interior U.S. Geological Survey
Transcript of Methods of Analysis by the U.S. Geological Survey … · Gas chromatogram with flame photometric...
Methods of Analysis by the U.S. Geological Survey National Water Quality Laboratory—Determination of Organophosphate Pesticides in Whole Water by Continuous Liquid-Liquid Extraction and Capillary-Column Gas Chromatography with Flame Photometric Detection______________________________________________________________________
Water-Resources Investigations Report 03–4139
U.S. Department of the Interior U.S. Geological Survey
Methods of Analysis by the U.S. Geological Survey National Water Quality Laboratory—Determination of Organophosphate Pesticides in Whole Water by Continuous Liquid-Liquid Extraction and Capillary-Column Gas Chromatography with Flame Photometric Detection
By Virendra K. Jha and Duane S. Wydoski______________________________________________________________________
U.S. Geological SurveyWater-Resources Investigations Report 03–4139
U.S. Geological Survey Method O-3402-03
Denver, Colorado2003
U.S. DEPARTMENT OF THE INTERIORGale A. Norton, Secretary
U.S. GEOLOGICAL SURVEYCharles G. Groat, Director
The use of trade, product, or firm names in this report is for descriptive purposes only and does not imply endorsement by the U.S. Government._____________________________________________________________________________For additional information write to: Copies of this report can be purchased from:
U.S. Geological Survey U.S. Geological SurveyChief, National Water Quality Laboratory Branch of Information ServicesBox 25046, Mail Stop 407 Box 25286Federal Center Federal CenterDenver, CO 80225-0046 Denver, CO 80225-0286
CONTENTSAbstract .............................................................................................................................................................. 1Introduction ......................................................................................................................................................... 1Analytical method ............................................................................................................................................... 2
1. Scope and application ............................................................................................................................ 22. Summary of method............................................................................................................................... 23. Safety precautions .................................................................................................................................. 44. Interferences........................................................................................................................................... 45. Sampling methods, sample handling, preservation, and holding time................................................... 46. Apparatus and instrumentation .............................................................................................................. 47. Consumable materials ............................................................................................................................ 58. Calibration and quality-control standards and criteria ........................................................................... 59. Analytical procedure .............................................................................................................................. 7
10. Gas chromatography with flame photometric detection analysis .......................................................... 811. Calculation of results ............................................................................................................................. 1112. Reporting of results ................................................................................................................................ 1213. Method performance .............................................................................................................................. 14
Summary and conclusions................................................................................................................................... 25References cited .................................................................................................................................................. 26
FIGURES1. Photograph showing continuous liquid-liquid extractors with solvent-dispersing frits ......................... 42. Gas chromatogram with flame photometric detection of a 50-picrograms-per-microliter calibration
standard solution of the individual organophosphate pesticides on a Restek Rtx-5 column for the analytical method .................................................................................................................................... 9
3. Gas chromatogram with flame photometric detection of a 50-picograms-per-microliter calibration standard solution of the individual organophosphate pesticides on a Restek Rtx-1701 column for the analytical method .................................................................................................................................... 10
TABLES1. Method compound names, parameter codes, laboratory codes, and Chemical Abstracts Service
registry numbers used by the U.S. Geological Survey National Water Quality Laboratory................... 32. Retention times of method compounds on the Rtx-5 and Rtx-1701 columns for the analytical method. 113. Suggested gas chromatography/flame photometry detection autosequence for the analytical method .. 114. Interim reporting levels for compounds in the analytical method........................................................... 125. Precision and bias of method compounds spiked at 0.02 microgram per liter in reagent-water,
surface-water, and ground-water matrices combined and estimated method detection limit for the analytical method............................................................................................................................... 13
6. Precision and bias from eight determinations of the method compounds spiked at 0.02 microgram per liter in reagent water for the analytical method................................................................................. 15
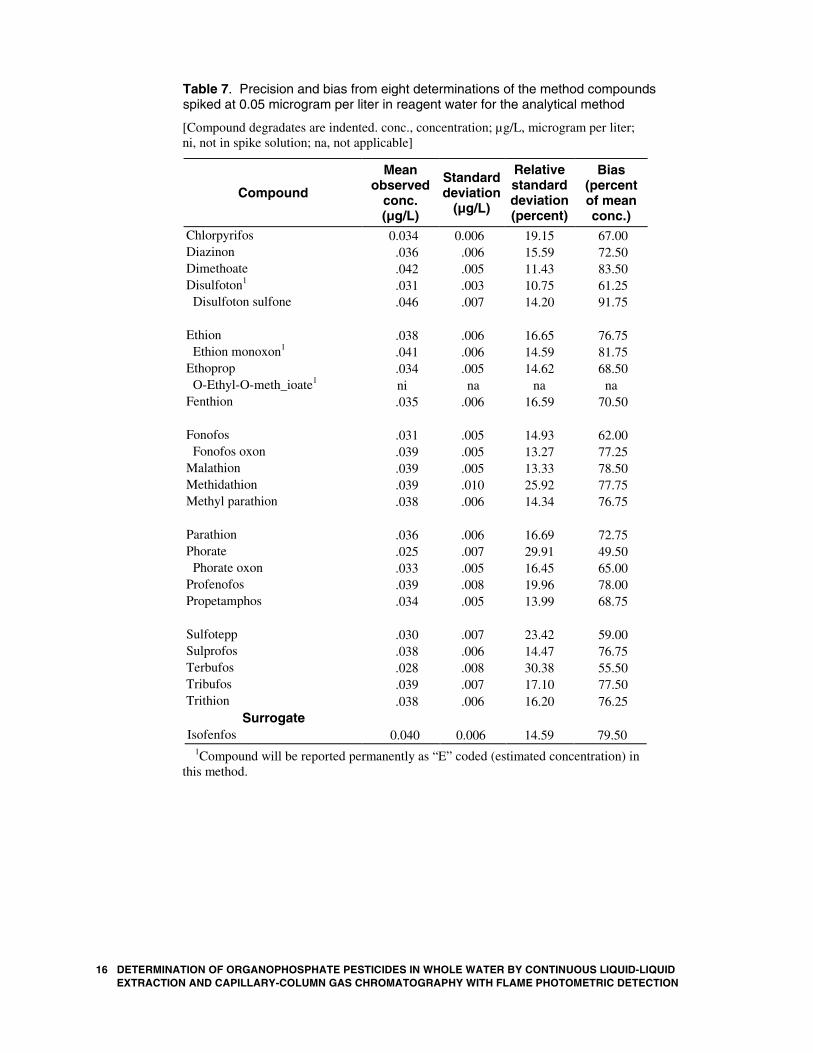
7. Precision and bias from eight determinations of the method compounds spiked at 0.05 microgram per liter in reagent water for the analytical method................................................................................. 16
Contents iii
8. Precision and bias from six determinations of the method compounds spiked at 0.5 microgram per liter in reagent water for the analytical method.................................................................................. 17
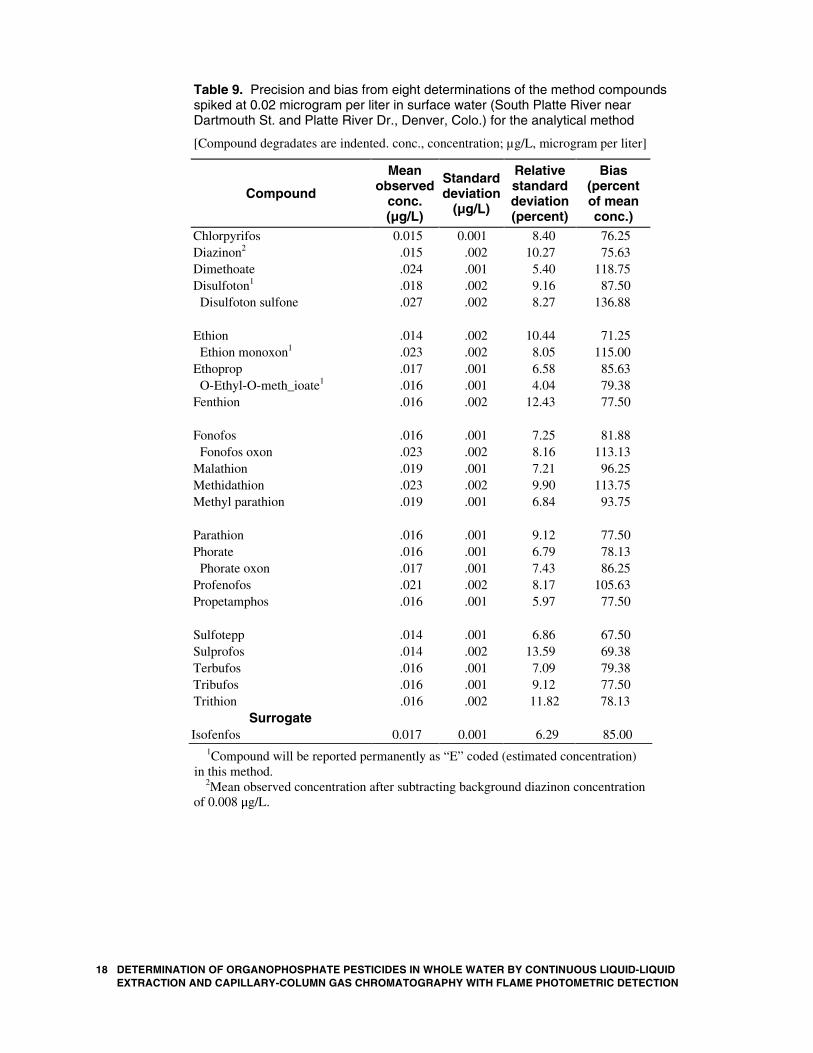
9. Precision and bias from eight determinations of the method compounds spiked at 0.02 microgram per liter in surface water (South Platte River near Dartmouth St. and Platte River Dr., Denver, Colo.) for the analytical method.......................................................................................................................... 18
10. Precision and bias from eight determinations of the method compounds spiked at 0.05 microgram per liter in surface water (South Platte River near Dartmouth St. and Platte River Dr., Denver, Colo.) for the analytical method.......................................................................................................................... 19
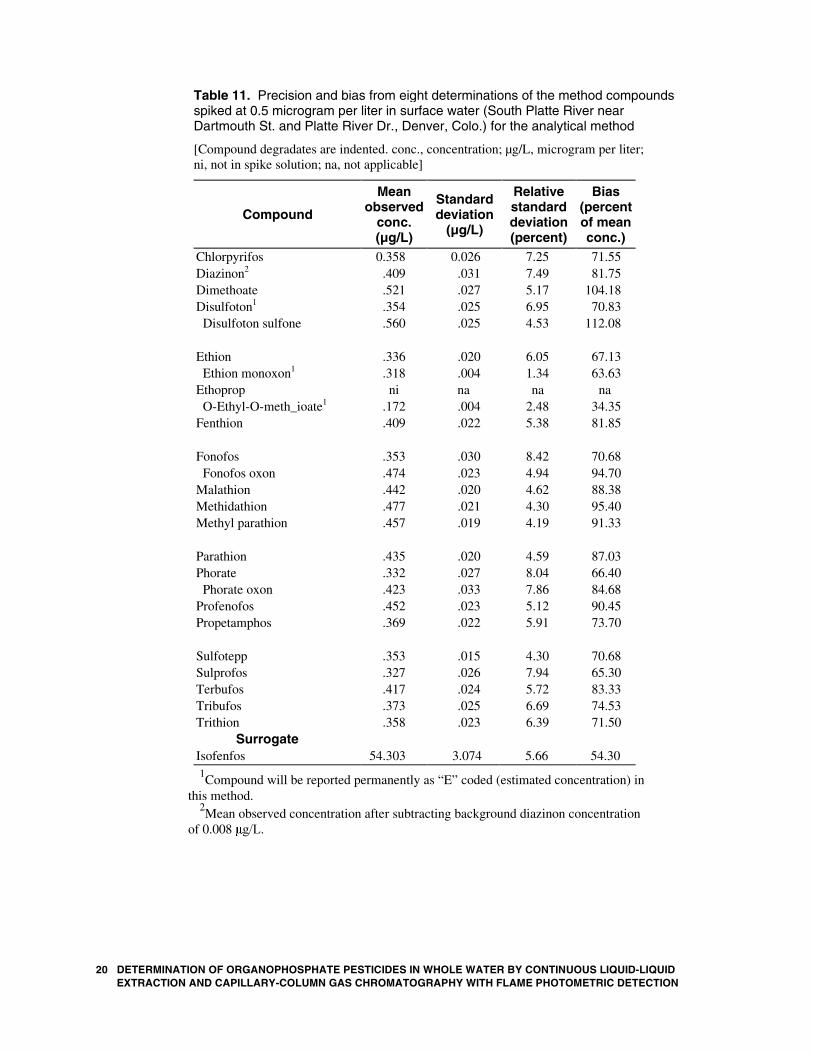
11. Precision and bias from eight determinations of the method compounds spiked at 0.5 microgram per liter in surface water (South Platte River near Dartmouth St. and Platte River Dr., Denver, Colo.) for the analytical method.......................................................................................................................... 20
12. Precision and bias from eight determinations of the method compounds spiked at 0.02 microgram per liter in ground water (domestic well water, Evergreen, Colo.) for the analytical method ................. 21
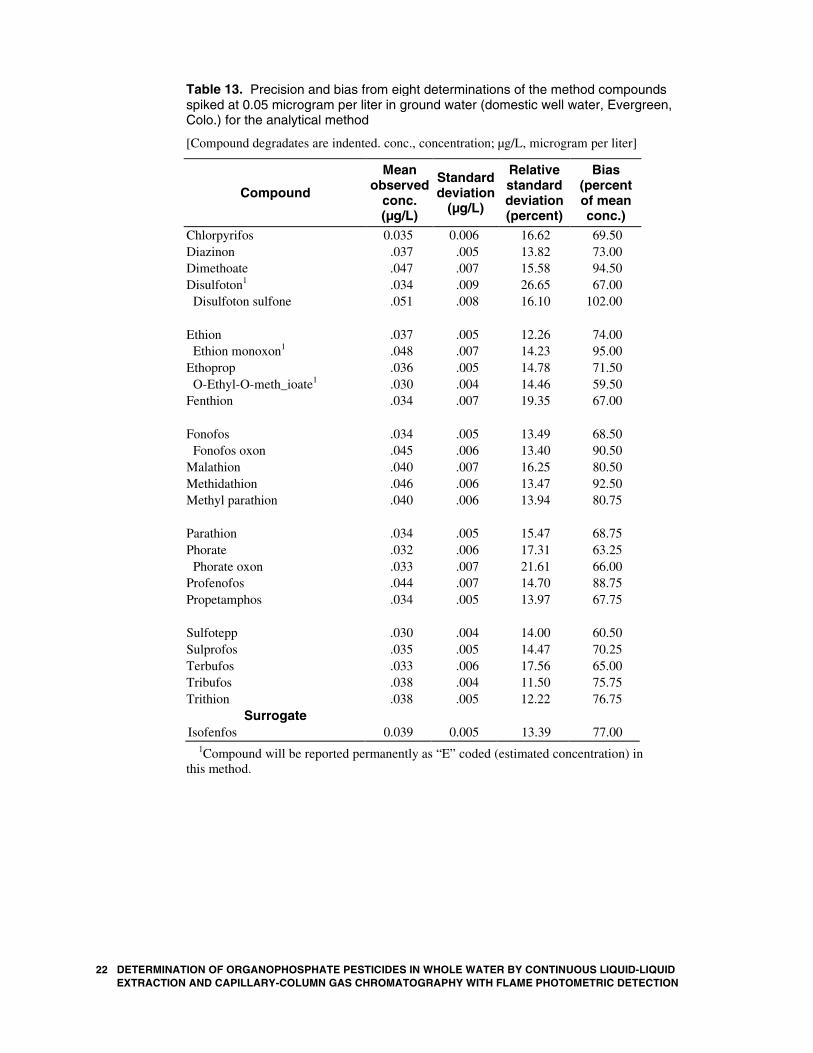
13. Precision and bias from eight determinations of the method compounds spiked at 0.05 microgram per liter in ground water (domestic well water, Evergreen, Colo.) for the analytical method ................. 22
14. Precision and bias from eight determinations of the method compounds spiked at 0.5 microgram per liter in ground water (domestic well water, Evergreen, Colo.) for the analytical method ................. 23
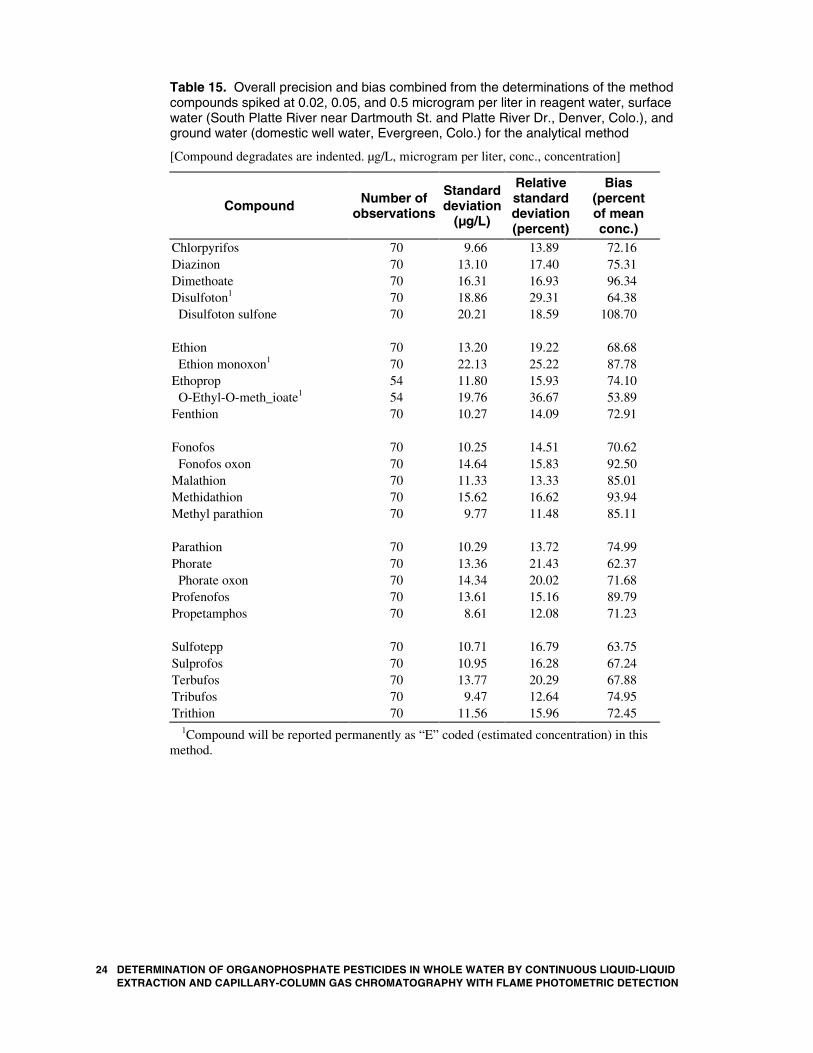
15. Overall precision and bias combined from the determinations of the method compounds spiked at 0.02, 0.05, and 0.5 microgram per liter in reagent water, surface water (South Platte River near Dartmouth St. and Platte River Dr., Denver, Colo.), and ground water (domestic well water, Evergreen, Colo.) for the analytical method ............................................................................................ 24
16. Compounds tested and found to have unacceptable performance ........................................................... 25
iv Contents
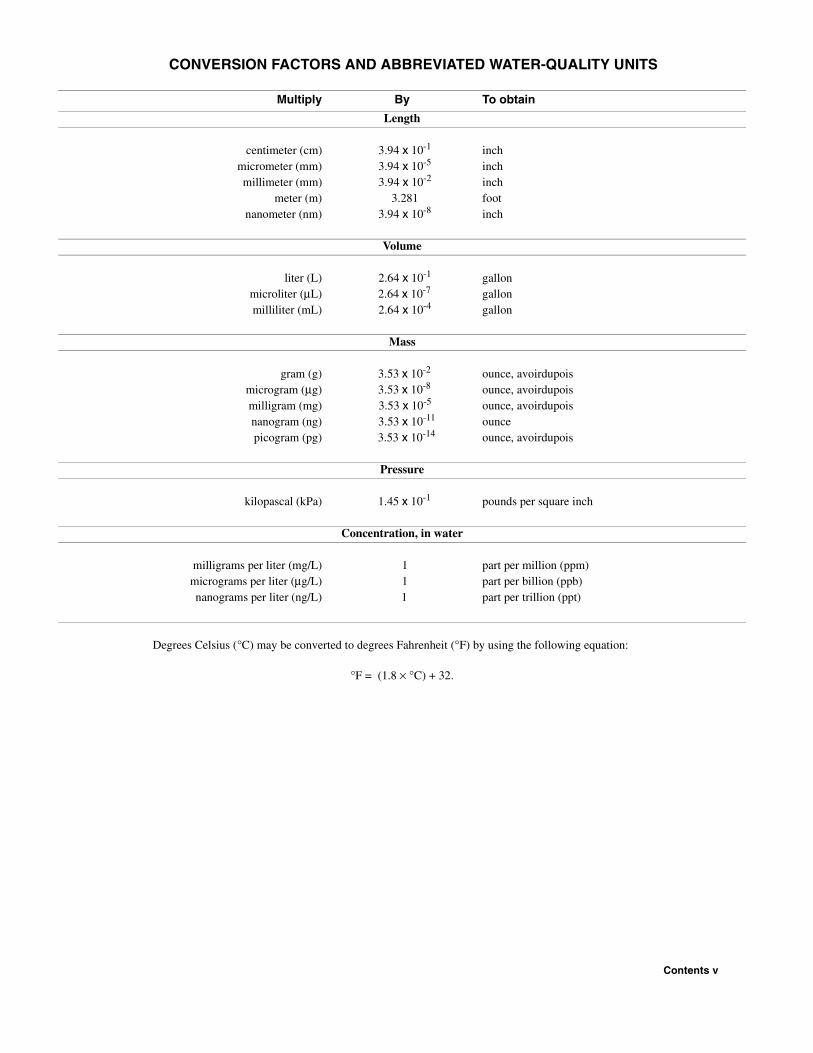
CONVERSION FACTORS AND ABBREVIATED WATER-QUALITY UNITS
Degrees Celsius (°C) may be converted to degrees Fahrenheit (°F) by using the following equation:
°F = (1.8 × °C) + 32.
Multiply By To obtain
Length
centimeter (cm) 3.94 x 10⁻¹ inchmicrometer (mm) 3.94 x 10⁻⁵ inch millimeter (mm) 3.94 x 10⁻² inch
meter (m) 3.281 foot nanometer (nm) 3.94 x 10⁻⁸ inch
Volume
liter (L) 2.64 x 10⁻¹ gallon microliter (µL) 2.64 x 10⁻⁷ gallon milliliter (mL) 2.64 x 10⁻⁴ gallon
Mass
gram (g) 3.53 x 10⁻² ounce, avoirdupoismicrogram (µg) 3.53 x 10⁻⁸ ounce, avoirdupoismilligram (mg) 3.53 x 10⁻⁵ ounce, avoirdupoisnanogram (ng) 3.53 x 10⁻¹¹ ouncepicogram (pg) 3.53 x 10⁻¹⁴ ounce, avoirdupois
Pressure
kilopascal (kPa) 1.45 x 10⁻¹ pounds per square inch
Concentration, in water
milligrams per liter (mg/L) 1 part per million (ppm)micrograms per liter (µg/L) 1 part per billion (ppb)nanograms per liter (ng/L) 1 part per trillion (ppt)
Contents v
ABBREVIATIONS AND ACRONYMS
CCV continuing calibration verification standardCLLE continuous liquid-liquid extractionDZU diazolidinyl ureaEDTA ethylenediamine tetra acetic acidFPD flame photometric detectorGC gas chromatographGC/FPD gas chromatograph/flame photometric detectorHPLC high-performance liquid chromatographyLRB laboratory reagent blankLRS laboratory reagent spikeLS laboratory scheduleLT–MDL long-term method detection levelMDL method detection limitmL/min milliliter per minuteMRL minimum reporting levelMSDS Material Safety Data SheetNWIS National Water Information SystemNWQL National Water Quality LaboratoryOP organophosphatepg/L picogram per literpg/µL picogram per microliterQC quality controlRSD relative standard deviationRT retention timeSOP standard operating procedureSPE solid-phase extractionTPC third-party check standardUSEPA U.S. Environmental Protection AgencyUSGS U.S. Geological Surveyµg/µL microgram per microliterµg/L microgram per liter< less than
vi Contents
GLOSSARY
Compound—A pesticide or pesticide degradate determined in an analysis.
Continuing calibration verification (CCV)—A calibration standard containing method compounds that is used to measure and control the bias of the existing calibration curve for the method compounds. The CCV is an instrumental standard only and is not processed through preparative steps of the method.
Fortified reagent-water-set sample—A quality-control sample prepared by adding known amounts of compounds to a reagent-water sample and analyzed with each set of environmental samples (usually 10). Also known as a “set spike.”
Laboratory reporting level (LRL)—The calculated concentration where the false-positive error is minimized to no more than 1 percent and the false-negative error is minimized to no more than 1 percent. The LRL is calculated as 2 times the method detection limit. A compound determined to be not identified, confirmed, or measured in a sample is reported as <LRL.
Long-term method detection level (LT–MDL)—A detection level derived by determining the standard deviation of a minimum of 24 method detection limit spike-sample measurements over an extended time. LT–MDL data are collected continuously to assess year-to-year variations in the LT–MDL. The LT–MDL controls false positive error. The chance of falsely reporting a concentration at or greater than the LT–MDL for a sample that did not contain the compound is determined to be less than or equal to 1 percent.
Method detection limit (MDL)—The minimum concentration of a compound that can be measured and reported with 99-percent confidence that the compound concentration is greater than zero. At this concentration the false positive error is minimized to no more than 1-percent probability (U.S. Environmental Protection Agency, 1997).
Minimum reporting level (MRL)—Smallest measured concentration of a compound that may be reported reliably by using a given analytical method (Childress and others, 1999, p. 2).
Surrogate—A compound that is not expected to be found in any environmental sample and is added to every sample in a known amount prior to sample processing. The surrogate is used to monitor method performance for each sample.
Contents vii
Methods of Analysis by the U.S. Geological Survey National Water Quality Laboratory—Determination of Organophosphate Pesticides in Whole Water by Continuous Liquid-Liquid Extraction and Capillary-Column Gas Chromatography with Flame Photometric Detection
By Virendra K. Jha and Duane S. Wydoski
code. Estimated-value compounds, which are “E-
AbstractA method for the isolation of 20 parent organophosphate pesticides and 5 organophosphate pesticide degradates from natural-water samples is described. Compounds are extracted from water samples with methylene chloride using a continuous liquid-liquid extractor for 6 hours. The solvent is evaporated using heat and a flow of nitrogen to a volume of 1 milliliter and solvent exchanged to ethyl acetate. Extracted compounds are determined by capillary-column gas chromatography with flame photometric detection.
Single-operator derived method detection limits in three water-matrix samples ranged from 0.003 to 0.009 microgram per liter. Method performance was validated by spiking all compounds in three different matrices at three different concentrations. Eight replicates were analyzed at each concentration in each matrix. Mean recoveries of most method compounds spiked in surface-water samples ranged from 54 to 137 percent and those in ground-water samples ranged from 40 to 109 percent for all pesticides. Recoveries in reagent-water samples ranged from 42 to 104 percent for all pesticides. The only exception was O-ethyl-O-methyl-S-propylphosphorothioate, which had variable recovery in all three matrices ranging from 27 to 79 percent. As a result, the detected concentration of O-ethyl-O-methyl-S-propylphosphorothioate in samples is reported in this method with an estimated remark code. Based on the performance issue, two more compounds, disulfoton and ethion monoxon, also will be reported in this method with an estimated remark
coded” in the data base, do not meet the performance criteria for unqualified quantification, but are retained in the method because the compounds are important owing to high use or potential environmental effects and because analytical performance has been consistent and reproducible.
INTRODUCTION
The U.S. Geological Survey (USGS) mission includes providing reliable scientific information for assessing the Nation's water resources. These assessments of the Nation's water include not only location, quantity, and availability, but also determinations of water quality, which require extensive and diverse studies along with supporting research. This part of the USGS mission produces much of the water-quality data used by planners, developers, water-quality managers, and agencies dealing with water-quality issues that require reliable, standardized data.
Previously, the USGS National Water Quality Laboratory (NWQL) determined whole-water recoverable (method O-3104-83; NWQL laboratory schedules 1319, 1334, or 1399) and dissolved (method O-1104-83; NWQL laboratory schedule 1316, discontinued in 1997) organophosphate pesticides (OPs) by using the USGS methods described by Wershaw and others (1987, p. 27–31). These methods consisted of extracting either unfiltered or filtered water samples with hexane and analyzing the extracts
Introduction 1
by using packed-column gas chromatography with flame-photometric detectors (GC/FPD). In 1990, the packed-column technology was replaced by megabore fused-silica column technology (0.25-mm diameter). These original methods included only seven compounds (diazinon, ethion, malathion, methyl parathion, methyl trithion, parathion, and trithion). In 1987, the NWQL offered the determination of five other organophosphate compounds: chlorpyrifos, tribufos, disulfoton, fonofos, and phorate as a custom add-on to the methods, and methyl trithion was dropped from the methods because a standard was no longer available. These five compounds became permanent (although undocumented) additions to the methods.
The hexane extraction procedure used in these methods produced mean recoveries that were lower than desired. In addition, the recoveries for malathion and disulfoton had higher variability than desired. Various procedures were used to improve the recoveries for these two compounds, such as (1) adding iso octane to the sample extract as a keeper solvent, (2) adding ethyl acetate to the sample extract as a keeper solvent, (3) adding buffer solution to the sample, and (4) adding ascorbic acid to the sample. However, none has proven satisfactory to date (2003). To improve recoveries of organophosphate compounds, the NWQL developed a new method that uses a continuous liquid-liquid extraction (CLLE) procedure that would improve organophosphate pesticide recoveries. This new method also expands the list of selected compounds from 11 to 25. Isofenfos is used as a surrogate standard because it is not expected to be found in water samples collected in the United States.
This method report addresses the following topics: principles and applications of the method, apparatus and consumable materials required, details of the calibration and analytical procedures, calculation of results, reporting of results (units and significant figures), and method performance. The method supplements other USGS methods for the determination of organophosphate pesticides that have been described by Wershaw and others (1987), Fishman (1993), Zaugg and others (1995), Sandstrom and others (2001), and Jha and Wydoski (2002, 2003). The new method was implemented as a custom method at the NWQL in October 2003.
There are substantial advantages of using the new method described in this report instead of the previous methods. The CLLEs provide high efficiency because
2 DETERMINATION OF ORGANOPHOSPHATE PESTICIDES IN WEXTRACTION AND CAPILLARY-COLUMN GAS CHROMATOGR
they can be operated in batches. The new method is cost effective because it can be operated automatically after initial startup.
ANALYTICAL METHOD
Organic Compounds and Parameter Codes: Organophosphate Pesticides, Whole Water, Gas Chromatography, O–3402–03 (see table 1)
1. Scope and Application
This method is suitable for the determination of 20 parent organophosphate pesticides (OPs) and 5 related OP degradation products in whole-water samples (table 1). Three of the compounds—disulfoton, ethion monoxon, and O-ethyl-O-methyl-S-propylphos-phorothioate—are reported permanently with an estimated concentration because of variable instrumental and extraction stability problems. This method is applicable to the determination of pesticides and pesticide degradates that are (1) efficiently isolated from the sample matrix with methylene chloride extraction using a continuous liquid-liquid extractor, (2) chromatographically resolved and identified using a gas chromatograph (GC) equipped with flame photometric detectors (FPD), and (3) sufficiently stable to chemical or thermal degradation to allow accurate quantification by using all sampling and analysis steps of the method.
Method compounds and their parameter codes, laboratory codes, and Chemical Abstracts Service (CAS) registry numbers for each compound are listed in table 1.
2. Summary of Method
Reagent grade NaCl (60 g) is added to all field samples for preservation, including laboratory blank and spike samples. OPs and degradates are extracted from whole-water samples using CLLE, and methylene chloride is used as an extraction solvent. The extract is concentrated down to 4 to 6 mL on a heating mantle. The concentrate is further evaporated by using nitrogen to a volume of 1 mL. Finally, the extracts are solvent exchanged to ethyl acetate and analyzed by capillary-column GC/FPD with the external standard quantitation method.
HOLE WATER BY CONTINUOUS LIQUID-LIQUID APHY WITH FLAME PHOTOMETRIC DETECTION
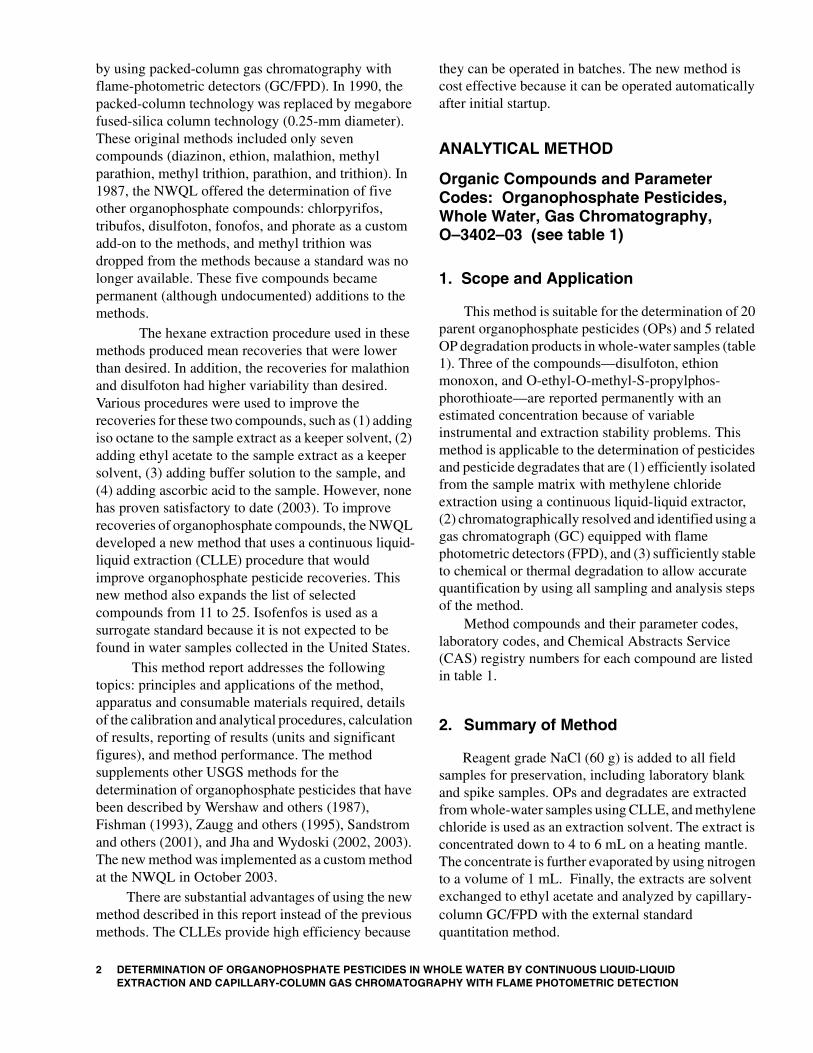
Table 1. Method compound names, parameter codes, laboratory codes, and Chemical Abstracts Service registry numbers used by the U.S. Geological Survey National Water Quality Laboratory
[Compound marked with an asterisk (*) is reported permanently with an “E” code (estimated concentration) in method O-3402-03. CAS, Chemical Abstracts Service]
Organophosphate compound (degradate indented)
Parameter code
Method code
Laboratory code
CAS number
Chlorpyrifos 38932 B 4520 2921-88-2 Diazinon 39570 E 4521 333-41-5 Dimethoate 39009 A 4522 60-51-5 Disulfoton * 39011 B 4523 298-04-4
Disulfoton sulfone 62034 A 4524 2497-06-5 Ethion 39398 C 4525 563-12-2
Ethion monoxon * 62036 A 4526 17356-42-2 Ethoprop 81758 A 4527 13194-48-4
O-Ethyl-O-methyl-S- propylphosphorothioate *
[O-Ethyl-O-meth_ioate]1
62026 A 4528 76960-87-7
Fenthion 30006 A 4529 55-38-9 Fonofos 82614 D 4530 944-22-9
Fonofos oxygen analog (fonofos oxon)2
62031 A 4531 944-21-8
Malathion 39530 C 4532 121-75-5 Methidathion 62033 A 4533 950-37-8 Methyl parathion 39600 C 4534 298-00-0 Parathion 39540 C 4535 56-38-2 Phorate 39023 B 4536 298-02-2
Phorate oxygen analog (phorate oxon)2
62028 A 4537 2600-69-3
Profenofos 62035 A 4538 41198-08-7 Propetamphos 62032 A 4539 31218-83-4 Sulfotepp 82201 A 4540 3689-24-5 Sulprofos 62037 A 4541 35400-43-2 Terbufos 82088 A 4542 13071-79-9
Tribufos (DEF or S,S,S- Tributylphosphotrithioate)2
39040 B 4543 78-48-8
Trithion (Carbophenothion)2 39786 C 4544 786-19-6
Isofenfos (surrogate) 99577 A 4545 25311-71-1
1Name in bracket [ ] is an abbreviation used in the National Water Information System (NWIS) because of character number limitation. The short, 20-character name also was used in the tables of this report to minimize space taken by lengthy chemical names. The short name was defined as the first 14 characters and the last 5 characters of the name, joined by an underscore: “_”.
2Name in parentheses is alternative compound name.
Analytical Method 3
3. Safety Precautions
Proper laboratory safety procedures need to be followed when handling chemicals and operating equipment. Organophosphate compounds and especially the degradates in this method are recognized potent cholinesterase inhibitors. Liver function can be affected adversely or other health problems can occur from prolonged exposure. All appropriate safety equipment should be worn and extreme care exercised when handling these compounds and solvents. Appropriate clothing, nitrile gloves, and eye protection are worn, and adequate ventilation is used when preparing samples or standard solutions. It is important to read the Material Safety Data Sheet (MSDS) on each compound and solvent prior to using this method. All organic solvents, water samples, and rinse waste are disposed in accordance with local hazardous waste-disposal rules and regulations.
4. Interferences
There are many organophosphate compounds in natural matrices that GC/FPD will detect. This method is designed to minimize false positives through dual GC column confirmation. Mass-spectral confirmation also should be used to confirm identification, if uncertain. Sulfur and organosulfur compounds and unknown organophosphate compounds occasionally might interfere with qualification and quantification of other individual organophosphate compounds.
5. Sampling Methods, Sample Handling, Preservation, and Holding Time
Detailed descriptions of sampling methods used by the USGS for obtaining depth- and width-integrated surface-water samples, sampling methods for obtaining ground-water samples, and sample processing are described by Wilde and others (1999). Samples are collected in pre-cleaned and baked 1-L, 33-mm neck, amber glass bottles with Teflon-lined screw caps and shipped chilled by overnight mail to the laboratory. After the samples are logged into the laboratory information management system (LIMS), 60 g of NaCl is added to the samples for preservation and they are stored at 4ºC until ready for extraction (usually within 7 days). No sample or extract holding-time studies have been performed for this method.
4 DETERMINATION OF ORGANOPHOSPHATE PESTICIDES IN WEXTRACTION AND CAPILLARY-COLUMN GAS CHROMATOGR
However, holding-time studies in reagent water and on dry solid-phase extraction (SPE) have been performed by Sandstrom and others (2001) for laboratory schedule (LS) 2002 method, which is used to determine most of the compounds in this new method. Based on findings by Sandstrom and others (2001), most of the compounds in this method have a holding time of 8 days or longer. Winslow and others (2001) have shown that the addition of chemical preservatives is required to preserve selected OPs. They added DZU as an antimicrobial inhibitor, Na3 EDTA to prevent metal ion-induced hydrolysis, and buffered the samples to pH 7. Winslow and others (2001) obtained acceptable recoveries in U.S. Environmental Protection Agency (USEPA) method 526, a method that uses gas chromatography/mass spectrometry and SPE. Some OPs might be susceptible to hydrolysis because no chemical preservatives are added to the sample.
6. Apparatus and Instrumentation
6.1 Analytical balance, capable of accurately weighing to the nearest 0.00001g.
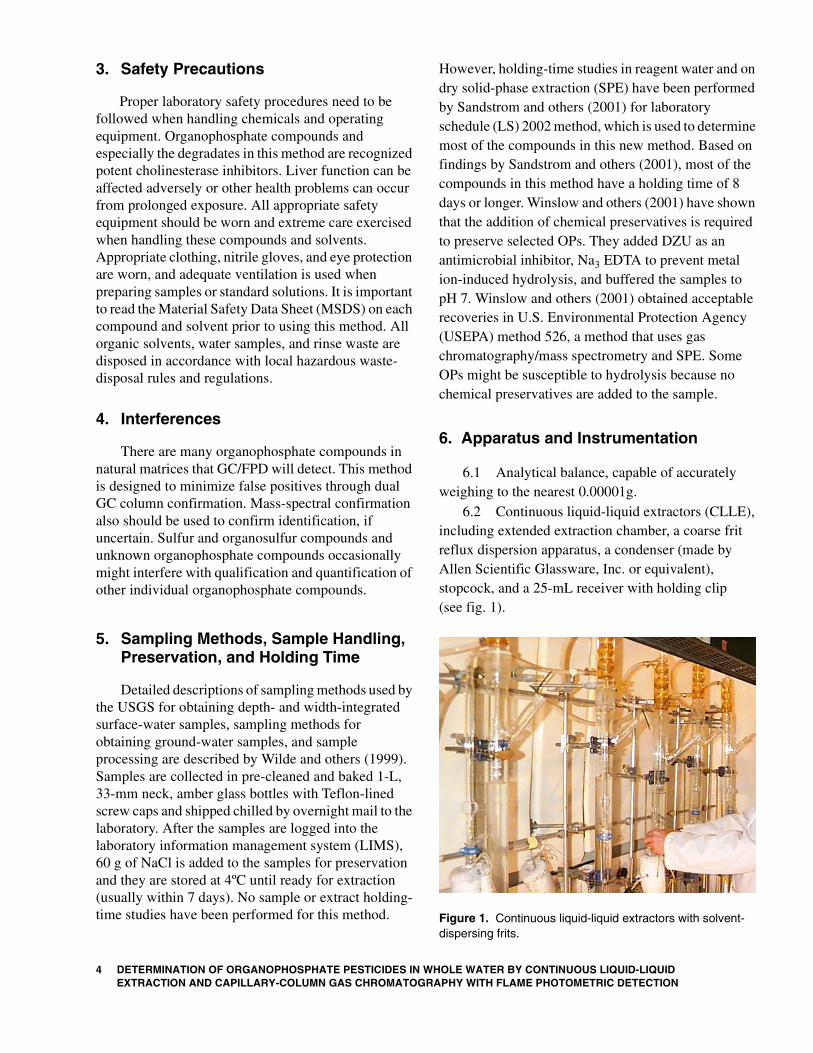
6.2 Continuous liquid-liquid extractors (CLLE), including extended extraction chamber, a coarse frit reflux dispersion apparatus, a condenser (made by Allen Scientific Glassware, Inc. or equivalent), stopcock, and a 25-mL receiver with holding clip (see fig. 1).
Figure 1. Continuous liquid-liquid extractors with solvent-dispersing frits.
HOLE WATER BY CONTINUOUS LIQUID-LIQUID APHY WITH FLAME PHOTOMETRIC DETECTION
6.3 Variac variable transformer, 0 to 140 volts, or equivalent.
6.4 Tube or teardrop-shaded heating mantle.6.5 A 25-mL calibrated receiver with 1-mL
collection nipple and ground glass fitting, cleaned and baked.
6.6 A 100-µL microdispenser or other volume as needed.
6.7 Waste containers, 1-L, resistant to chlorinated solvents.
6.8 Waste containers, 4-L, resistant to chlorinated solvents.
6.9 Nitrogen gas solvent evaporation device, Organomation Associates, Inc. or equivalent.
6.10 GC/FPD, Hewlett-Packard (HP), Model 5890 GC or comparable with HP 7673A automated sample injector. Dual HP flame photometric detectors or equivalent, and a data system with Turbochrom chromatography data-acquisition software and Target data-processing software or equivalent.
7. Consumable Materials
7.1 Glass bottles, amber, 1-L, 33-mm neck, baked at 450ºC for 2 hours, fitted with Teflon-lined screw caps; NWQL glass-chilled container (GCC) or equivalent.
7.2 Reagent water, ultrapure, B&J brand for HPLC or equivalent.
7.3 Ethyl acetate, methylene chloride and acetone solvents, glass distilled, pesticide analysis grade, B&J or equivalent.
7.4 Boiling chips, four-mesh granule sizes, hexane rinsed, baked at 400ºC for 4 hours.
7.5 Sodium chloride, reagent grade, baked at 400ºC for 4 hours.
7.6 OP surrogate solution.7.7 OP spike solution.7.8 Microdispenser glass bores, 100-µL, baked at
400ºC for 4 hours.7.9 Pasteur pipets (disposable), with rubber
bulbs.7.10 Vial, 1.5- or 2-mL, amber glass, with
aluminum crimp caps that have dual polytetra-fluoroethylene (PTFE)-faced silicon rubber septa or open-top screw-cap with PTFE-faced silicon rubber septum, Supelco Inc. or equivalent.
8. Calibration and Quality-Control Standards and Criteria
All quality-control (QC) information needs to be evaluated to determine whether analytical data are of acceptable quality to be reported. Minimum QC requirements include the following: (1) analysis of laboratory reagent blank (LRB); (2) determination of surrogate standard compound recoveries in each sample, LRB, and laboratory reagent spike (LRS); (3) determination of compound recoveries in the LRS; and (4) assessment of the GC/FPD chromatographic performance.
8.1 Calibration standards. Stock standards for the pesticides and degradates were obtained as pure materials from the USEPA National Pesticide Standard Repository (Ft. Meade, Md.) or commercial vendors (ChemService; EQ Laboratories). The analytical range for this method is from 0.005 to 0.100 µg/L. Calibration standards are prepared at six different concentrations (5, 10, 20, 50, 80, and 100 pg/µL) for each compound and surrogate compound by adding known volumes of stock standard solutions to a volumetric flask. The resulting solution is diluted to volume with ethyl acetate. The lowest standard needs to represent compound concentrations near, but greater than, its respective method detection limit (MDL). The remaining standards need to bracket the compound concentrations expected in the sample extracts.
8.2 Calibration curve. Starting with the lowest concentration, each calibration standard is analyzed and response is tabulated (peak area) in relation to the concentration in the standard. The results are used to prepare a linear calibration curve for each compound. For each sample set all six calibration standard solutions are analyzed prior to analyzing the samples. The determined concentration should be ±20 percent of the expected concentration for all compounds. The correlation coefficient (r2) for the calibration curve regression needs to be equal to or greater than 0.995. If the instrument does not meet these calibration criteria, the problem is corrected by servicing the GC or by preparing and reanalyzing new calibration standards.
8.3 Surrogate standard solution. The surrogate standard solution is prepared with isofenfos, which is available through Absolute Standard Inc. or equivalent. Surrogate solution is prepared by adding 250 µL of isofenfos stock solution (100 µg/mL in hexane) into 25 mL of methanol. The final concentration of isofenfos in methanol is 1,000 pg/µL. The surrogate standard solution is added to the sample at the time of
Analytical Method 5
extraction, 100 µL of the surrogate standard is added to 1 L of each field sample and to the LRS and LRB, and used to monitor performance of the sample preparation procedure (M.R. Burkhardt and T.J. Maloney, U.S. Geological Survey, written commun., 1998). Standard statistical techniques are used to establish control limits for surrogate recovery. When surrogate recovery for a sample is greater than the upper or less than the lower control limits, the following are checked: (1) calculations, so as to locate possible mathematical errors; (2) spiking or calibration solutions for possible surrogate (and other compounds) degradation; (3) contamination, which usually produces positive bias; and (4) instrument performance (see section 8.8). If those steps do not reveal the cause of the problem, the extract is reanalyzed. If a set blank extract reanalysis fails the surrogate control-limit criteria (M.R. Burkhardt and T.J. Maloney, U.S. Geological Survey, written commun., 1998), then the problem needs to be identified and corrected before continuing the analysis. If sample extract reanalysis meets the surrogate recovery and other QC criteria, then the result is reported using the reanalyzed extract data. If the surrogate in sample extract fails the recovery criteria, then protocol for corrective action is followed, which includes assigning estimated (E-code) qualifier, raising the sample reporting level, or not reporting the sample data, depending on the nature of the surrogate failure.
8.4 Spike solution. The LRS solution is prepared in methanol by adding 125 µL of an organophosphate stock (100 µg/mL in hexane) into 25 mL methanol. This solution contains all of the organophosphate compounds of interest, except the current (2003) surrogate compound (isofenfos). The spike solution concentration is 500 pg/µL, and 100 µL of this solution is added to 1 L of reagent water to prepare the LRS. The LRS is used to monitor recovery efficiencies for all method compounds (M.R. Burkhardt and T.J. Maloney, U.S. Geological Survey, written commun., 1998). For this report, spike solution was added to spike samples at three different concentrations (0.02, 0.05, and 0.5 µg/L) for the method performance determinations. The laboratory needs to analyze at least one LRS sample with every 10 samples or one per sample set (all samples extracted within a 24-hour period), whichever is greater. The concentration of each compound in the LRS sample needs to be within the range of the calibration standards. Standard statistical techniques (M.R. Burkhardt and T.J. Maloney, U.S. Geological Survey, written commun., 1998) are used to establish
6 DETERMINATION OF ORGANOPHOSPHATE PESTICIDES IN WEXTRACTION AND CAPILLARY-COLUMN GAS CHROMATOGR
control limits for compound recovery for the LRS. If the recovery of any compound falls outside the control-limit criteria, that compound is judged out of control, and the source of the problem needs to be identified and resolved before continuing the analyses. The data for compounds that fail quality-control criteria need to follow corrective-action procedures, which include assigning an “estimated” remark code, or raising the sample reporting level, or not reporting the sample data, depending on the nature of the spike failure.
The laboratory periodically needs to determine and document its detection capabilities for the method compounds. The detection levels for this method will be evaluated continuously using the long-term method detection level (LT–MDL) procedure (Childress and others, 1999) or other procedure as adopted by the NWQL.
8.5 Third-party check (TPC) standard. The third-party check standard is a separate source material from the standards. The TPC contains all of the OP compounds of interest, except the current (2003) surrogate compound (isofenfos). A working TPC standard is prepared in ethyl acetate by adding 10 µL of the TPC stock standard (100 µg/mL in hexane) to 10 mL ethyl acetate. The final working concentration of the TPC is 100 pg/µL. The TPC is analyzed in each analytical sequence after the calibration standards to verify the calibration curve and is compared to the calibrated standard. The determined concentration for all compounds in the TPC standard needs to be ±30 percent of the expected concentration.
8.6 Continuing calibration verification (CCV). The continuing calibration verification standard concentration typically is at the midpoint of the calibration range, usually the 20- or 50-pg/µL OP standard. A 20- or 50-pg/µL calibration standard containing all of the method compounds is inserted in an autosampler vial and placed after every 10 field or QC samples throughout the GC analytical sequence. The CCV standard is used to monitor the calibration of the GC for precision and bias. The calculated concentration in the CCV needs to be within 20 percent of the expected concentration for each compound. If the determined concentrations of compounds in the CCV are outside these control limits, corrective action needs to be taken. Typical corrective action in this instance is to maintain the instrument and return it to acceptable performance. This might require recalibration. In addition, the environmental samples
HOLE WATER BY CONTINUOUS LIQUID-LIQUID APHY WITH FLAME PHOTOMETRIC DETECTION
need to be reanalyzed (M.R. Burkhardt and T.J. Maloney, U.S. Geological Survey, written commun., 1998).
8.7 Laboratory reagent blank (LRB). Before processing any samples, the analyst must demonstrate that all glassware and reagent interferences are under control. Each time a set of samples is extracted, a LRB needs to be analyzed with representative matrix and all reagents used in the procedure. If the LRB contains interfering peaks that would prevent the determination of one or more compounds at the MDL, then the source of contamination is determined and the interference is eliminated before continuing future sample processing and analysis (M.R. Burkhardt and T.J. Maloney, U.S. Geological Survey, written commun., 1998).
8.8 Instrument system. Instrument performance needs to be monitored daily at a minimum. Gas chromatographic performance normally is reflected in the variation of determined concentration of the selected compound in calibration standards, TPC, and CCVs relative to the concentrations obtained by using a new capillary column and freshly prepared standards. Failure to meet the calibration, TPC, or CCV criteria indicates that GC maintenance is required to bring the system into compliance. A portion of the guard column might be cut off and removed to restore performance, or the injection port liner might be replaced.
8.9 Other GC/FPD performance requirements. Sample extract concentrations that exceed the high concentration calibration standard need to be diluted to within the calibration range and reanalyzed.
The laboratory might adopt additional QC practices for use with this method (see Pirkey and Glodt, 1998). The specific practices that are most productive depend on the needs of the laboratory and the nature of the samples.
9. Analytical Procedure
9.1 The CLLE apparatus, receivers, and stoppers for each sample are triple rinsed (first rinse with reagent water, second with acetone, and third with methylene chloride). Precleaned Teflon stopcocks are attached to the CLLE apparatus in the closed position. Two to five boiling chips are placed in the bottom of each receiver and attached firmly to the extractor with a clip.
9.2 The sample bottle containing the sample is weighed to the nearest gram and recorded (W1) (see section 11.2, equation 2).
9.3 Two additional bottles are prepared for each set of 10 samples, each containing about 1,000 mL of reagent water for the LRB and the LRS. Sixty g of NaCl is added to LRB and LRS, 100 µL (500 pg/µL) of primary fortification (spike) is added into reagent water spike bottle, and 100 µL (1,000 pg/µL) of surrogate solution is added to each sample, including LRB and LRS. Each sample bottle is capped and shaken well to mix until all the salt dissolves.
9.4 Fifty mL of methylene chloride is added to each CLLE extractor. Each sample is slowly transferred into an extractor using the side access arm. A clean stainless steel funnel is used to facilitate this transfer. About 10 mL of reagent water is transferred into the sample bottle. The bottle is capped and shaken to loosen any particulate matter adhered to the sample bottle. The water and particulate matter are transferred to the CLLE extractor. The sample bottle is rinsed with about 10 mL of methylene chloride, shaken or swirled to ensure the entire surface of the inside of the sample bottle has contact with solvent. Solvent is dispensed into CLLE. The solvent rinse procedure is performed twice. And finally, the sample bottle is rinsed with reagent water to ensure all remaining methylene chloride from earlier rinse is removed from sample bottle and transferred to CLLE.
9.5 With the frit assembly raised out of the way, reagent water is added to the extractor until methylene chloride just begins to drip from the CLLE side arm into the 25-mL receiver. The frit assembly is lowered until the bottom of the frit touches the surface of the water.
9.6 Methylene chloride is added with Teflon squeeze bottle into the spout at the top of the condenser until the reservoir above the frit is filled. Methylene chloride will begin to drip from the frit, causing the receiver to fill with methylene chloride. This procedure is continued until there is about 15 to 20 mL of methylene chloride in the receiver.
9.7 The water to the condensers is turned on, and the side access arm closed with a glass stopper. The heating mantle is placed over the receiver and hooked into place. The Variac voltage controllers are turned on and set for 70 volts. The methylene chloride should boil vigorously in the receiver tube and extraction continue for 6 hours. After the extraction is complete, the CLLE is drained into a designated waste container and the methylene chloride continues to boil in the receiver tube until the level reaches 4 to 6 mL. The receiver tube is allowed to cool.
Analytical Method 7
9.8 The empty sample bottle is weighed and recorded (W2). W2 is subtracted from W1 to obtain the exact volume of sample (W) extracted (weight = volume) (see section 11.2, equation 2).
9.9 The extract in the receiver tube is evaporated with a gentle stream of nitrogen until the volume of the sample is 1 mL. Solvent exchange to ethyl acetate is done by adding 1 mL of ethyl acetate into the receiver and the solution is evaporated with nitrogen down to 1 mL. Repeat the solvent exchange and evaporation with nitrogen. A final volume of 1 mL needs to be achieved after the second nitrogen evaporation. The final extract is transferred to a 1.8-mL autosampler vial. The autosampler vial is capped and stored in a refrigerator at 4ºC until ready for analysis.
10. Gas Chromatography with Flame Photometric Detection Analysis
10.1 The sample extracts are analyzed by gas chromatography with flame photometric detection (GC/FPD) by using a dual capillary-column system equipped with an autosampler; one split/splitless injection port (operated in the splitless mode); a 1-m, 0.32-mm inside-diameter (ID) section of fused silica capillary tubing, uncoated, deactivated guard column; a Y-type column connector to connect the guard column to the primary and secondary capillary columns; and two flame photometric detectors. A computer system is used to control the autosampler, GC operational conditions, and to acquire and process responses from the dual detectors.
10.2 The gas chromatographic configuration is described in this section.
Column 1 (primary column): 30-m long by 0.25-mm ID, 5 percent diphenyl and 95 percent dimethyl polysiloxane bonded fused silica capillary column, 0.25-µm film thickness (Restek Corp. Rtx-5 or equivalent).
Column 2 (confirmation column): 30-m long by 0.25-mm ID, 14 percent cyanpropylphenyl and 86 percent dimethyl polysiloxane bonded fused silica capillary column, 0.25-µm film thickness (Restek Corp. Rtx-1701 or equivalent).
Carrier gas: Helium, 99.999 percent purity, 1 to 3 mL/min column flow. This flow range corresponds to a linear flow velocity of 20 to 40 cm/sec on a Van Deemter plot, when using 30-m by 0.25-mm ID columns.
8 DETERMINATION OF ORGANOPHOSPHATE PESTICIDES IN WEXTRACTION AND CAPILLARY-COLUMN GAS CHROMATOGR
Detector make-up gas: Nitrogen, 99.999 percent purity, 4 to 10 mL/min flow.
Detector gas: Hydrogen, 99.999 percent purity, 3 to 5 mL/min flow.
Air: 99.6 percent purity, 90 to 110 mL/min flow.Injection mode: Splitless, injection port sweep
30 mL/min. Column head pressure 138 kPa (20 lb/in2 ).Septum purge rates: 1 to 2 mL/min. Purge valves
are on (open) at 2 minutes and off (closed) for 2 minutes prior to the end of sample analysis. Both columns are connected to guard column with a “Y” splitter, and the guard column is connected to the injection port. If flows through the GC columns are equivalent, then an injection volume of 4 µL of extract is divided evenly onto both columns.
Injector temperature: 220ºCDetector temperature: 220ºCDetectors: Two flame photometric detectors (FPD)
are used, set for phosphorus “P” mode, with optical filters that transmit 525-nm wavelength for specific phosphorus response.
Oven temperature program—Initial temperature 60ºC, hold 1 minute.
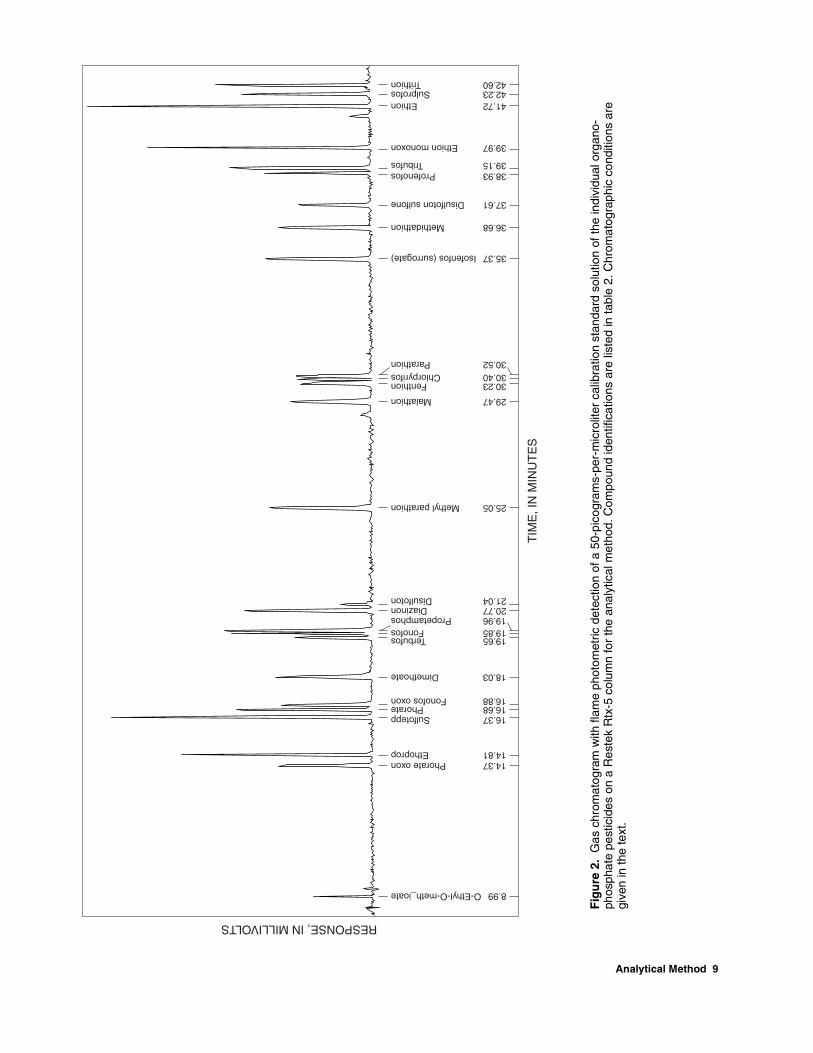
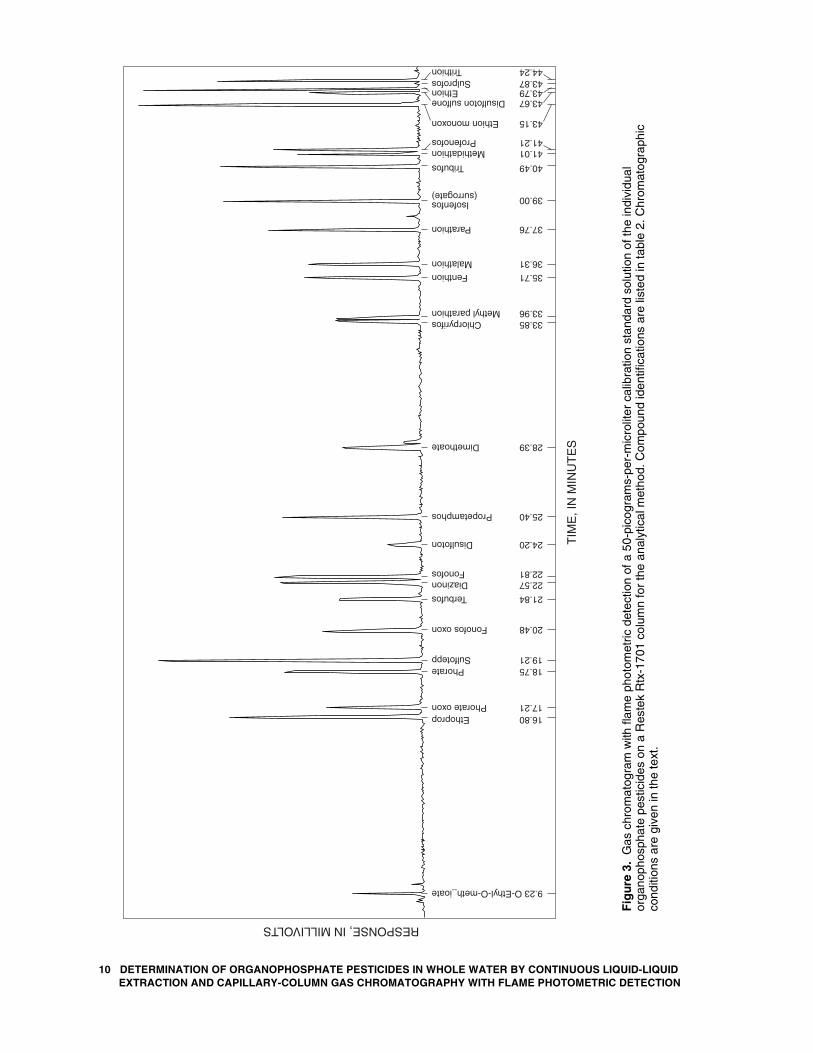
Ramp 1—15ºC/min to 160ºC, hold 0 minuteRamp 2—1ºC/min to 186ºC, hold 0 minuteRamp 3—7ºC/min to 280ºC, hold for 7 minutes. Total analysis time is about 54 minutes.10.3 Determine compound retention times
(RT)—Following GC setup, compound retention times are established by using the calibration standard solutions. A typical separation and peak shape obtained using the GC operating conditions described in section 10.2 for the individual OP pesticides on the Rtx-5 column are shown in figure 2. Separation and peak shape on the Rtx-1701 column are shown in figure 3. Peak identifications and retention times are listed in table 2 for the method compounds on the Rtx-5 and Rtx-1701 columns shown in figures 2 and 3.
10.4 Coelution problems—Two coelutions (one with fonofos and propetamphos and a second with fenthion, chlorpyrifos, and parathion) were observed on the Rtx-5 column, and three coelutions (one with chlorpyrifos and methyl parathion, a second with methidathion and profenophos, and a third with disulfoton sulfone, ethion, and sulprofos) were observed on the Rtx-1701 column using the GC conditions described in section 10.2. Compounds with coelutions on one column are well separated from method compounds on the other column except for chlorpyrifos (see table 2). Coelution conditions require
HOLE WATER BY CONTINUOUS LIQUID-LIQUID APHY WITH FLAME PHOTOMETRIC DETECTION
Fig
ure
2.
Gas
chr
omat
ogra
m w
ith fl
ame
phot
omet
ric d
etec
tion
of a
50-
pico
gram
s-pe
r-m
icro
liter
cal
ibra
tion
stan
dard
sol
utio
n of
the
indi
vidu
al o
rgan
o-ph
osph
ate
pest
icid
es o
n a
Res
tek
Rtx
-5 c
olum
n fo
r th
e an
alyt
ical
met
hod.
Com
poun
d id
entif
icat
ions
are
list
ed in
tabl
e 2.
Chr
omat
ogra
phic
con
ditio
ns a
re
give
n in
the
text
.
O-Ethyl-O-meth_ioate
PhorateoxonEthoprop
SulfoteppPhorate
Fonofosoxon
Dimethoate
TerbufosFonofos
PropetamphosDiazinon
Disulfoton
Methylparathion
Malathion
FenthionChlorpyrifos
Parathion
Isofenfos(surrogate)
Methidathion
Disulfotonsulfone
ProfenofosTribufos
Ethionmonoxon
EthionSulprofos
Trithion
8.99
14.3714.81
16.3716.6816.88
18.03
19.6519.8519.9620.7721.04
25.05
29.47
30.2330.4030.52
35.37
36.68
37.61
38.9339.15
39.97
41.7242.2342.60
RESPONSE,INMILLIVOLTS
TIM
E,I
NM
INU
TE
S
Analytical Method 9
Fig
ure
3.
Gas
chr
omat
ogra
m w
ith fl
ame
phot
omet
ric d
etec
tion
of a
50-
pico
gram
s-pe
r-m
icro
liter
cal
ibra
tion
stan
dard
sol
utio
n of
the
indi
vidu
al
orga
noph
osph
ate
pest
icid
es o
n a
Res
tek
Rtx
-170
1 co
lum
n fo
r th
e an
alyt
ical
met
hod.
Com
poun
d id
entif
icat
ions
are
list
ed in
tabl
e 2.
Chr
omat
ogra
phic
co
nditi
ons
are
give
n in
the
text
.
O-Ethyl-O-meth_ioate
PhorateoxonEthoprop
SulfoteppPhorate
Fonofosoxon
Dimethoate
Terbufos
Fonofos
Propetamphos
Diazinon
Disulfoton
Malathion
Fenthion
Methylparathion
Parathion
Isofenfos(surrogate)
Methidathion
Disulfotonsulfone
Tribufos
Ethionmonoxon
Trithion
9.23
17.2116.80
19.2118.75
20.48
28.39
21.84
22.81
25.40
22.57
24.20
36.31
35.71
33.96Chlorpyrifos 33.85
37.76
39.00
41.01Profenofos 41.21
43.67
40.49
43.15
44.24
Ethion 43.79Sulprofos 43.87
RESPONSE,INMILLIVOLTS
TIM
E,I
NM
INU
TE
S
10 DETERMINATION OF ORGANOPHOSPHATE PESTICIDES IN WHOLE WATER BY CONTINUOUS LIQUID-LIQUID EXTRACTION AND CAPILLARY-COLUMN GAS CHROMATOGRAPHY WITH FLAME PHOTOMETRIC DETECTION
special identification and calibration considerations. Compounds that show coelution with another method compound or interference on one column must be quantified on the other column, where no coelution problems occur.
10.5 GC autosequence—The suggested sequence for an automated analysis is listed in table 3.
10.6 Gas chromatography/flame photometric detection compound calibration—This method is an external standard quantitation method that uses multipoint external standard calibration for single-component compounds. The GC/FPD is calibrated (and compounds subsequently quantitated; see section 11) by using results obtained on both capillary columns. The individual pesticides can be calibrated by multipoint curves produced from analysis of the 5- to 100-pg/µL calibration standards (8.1). The GC/FPD peak area for the compound (A1) is plotted in relation
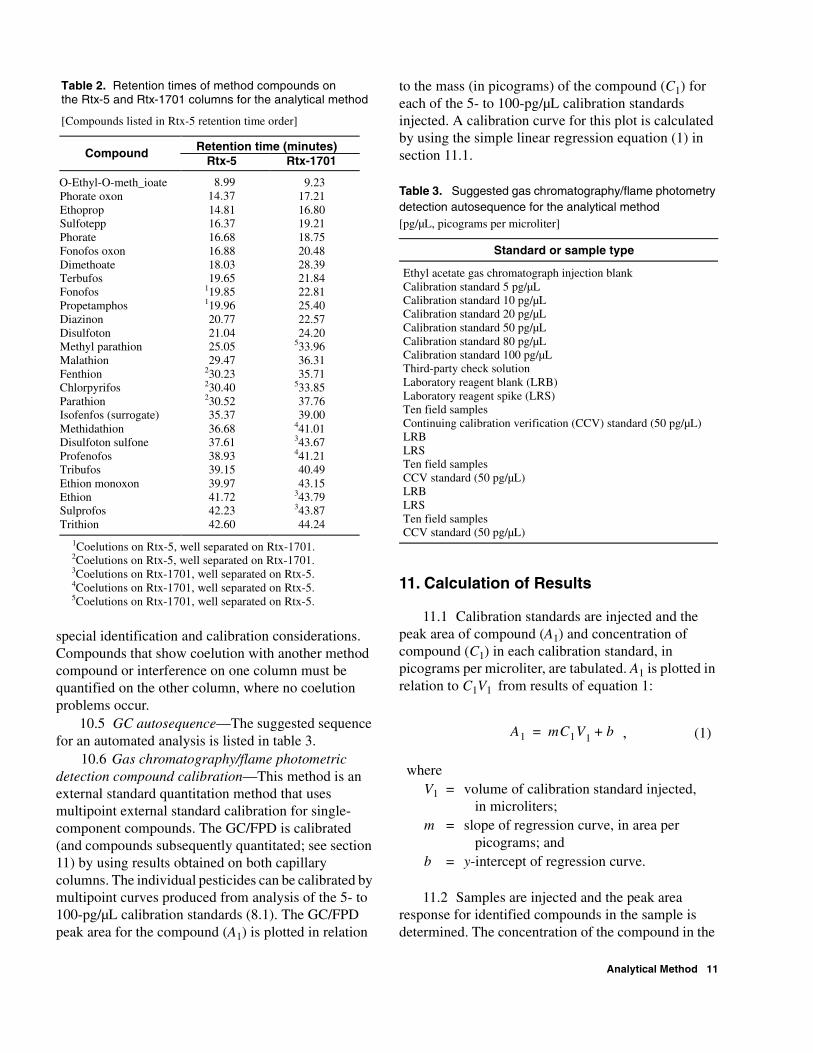
Table 2. Retention times of method compounds on the Rtx-5 and Rtx-1701 columns for the analytical method
[Compounds listed in Rtx-5 retention time order]
Retention time (minutes) Compound Rtx-5 Rtx-1701
O-Ethyl-O-meth_ioate 8.99 9.23 Phorate oxon 14.37 17.21 Ethoprop 14.81 16.80 Sulfotepp 16.37 19.21 Phorate 16.68 18.75 Fonofos oxon 16.88 20.48 Dimethoate 18.03 28.39 Terbufos 19.65 21.84 Fonofos 119.85 22.81 Propetamphos 119.96 25.40 Diazinon 20.77 22.57 Disulfoton 21.04 24.20 Methyl parathion 25.05 533.96 Malathion 29.47 36.31 Fenthion 230.23 35.71 Chlorpyrifos 230.40 533.85 Parathion 230.52 37.76 Isofenfos (surrogate) 35.37 39.00 Methidathion 36.68 441.01 Disulfoton sulfone 37.61 343.67 Profenofos 38.93 441.21 Tribufos 39.15 40.49 Ethion monoxon 39.97 43.15 Ethion 41.72 343.79 Sulprofos 42.23 343.87 Trithion 42.60 44.24
1Coelutions on Rtx-5, well separated on Rtx-1701. 2Coelutions on Rtx-5, well separated on Rtx-1701. 3Coelutions on Rtx-1701, well separated on Rtx-5. 4Coelutions on Rtx-1701, well separated on Rtx-5. 5Coelutions on Rtx-1701, well separated on Rtx-5.
to the mass (in picograms) of the compound (C1) for each of the 5- to 100-pg/µL calibration standards injected. A calibration curve for this plot is calculated by using the simple linear regression equation (1) in section 11.1.
Table 3. Suggested gas chromatography/flame photometry detection autosequence for the analytical method[pg/µL, picograms per microliter]
11. Calculation of Results
11.1 Calibration standards are injected and the peak area of compound (A1) and concentration of compound (C1) in each calibration standard, in picograms per microliter, are tabulated. A1 is plotted in relation to C1V1 from results of equation 1:
whereV1 = volume of calibration standard injected,
in microliters;m = slope of regression curve, in area per
picograms; andb = y-intercept of regression curve.
11.2 Samples are injected and the peak area response for identified compounds in the sample is determined. The concentration of the compound in the
Standard or sample type
Ethyl acetate gas chromatograph injection blank Calibration standard 5 pg/µL Calibration standard 10 pg/µL Calibration standard 20 pg/µL Calibration standard 50 pg/µL Calibration standard 80 pg/µL Calibration standard 100 pg/µL Third-party check solution Laboratory reagent blank (LRB) Laboratory reagent spike (LRS) Ten field samples Continuing calibration verification (CCV) standard (50 pg/µL) LRB LRS Ten field samples CCV standard (50 pg/µL) LRB LRS Ten field samples CCV standard (50 pg/µL)
A1 mC1V1 b+= , (1)
A
nalytical Method 11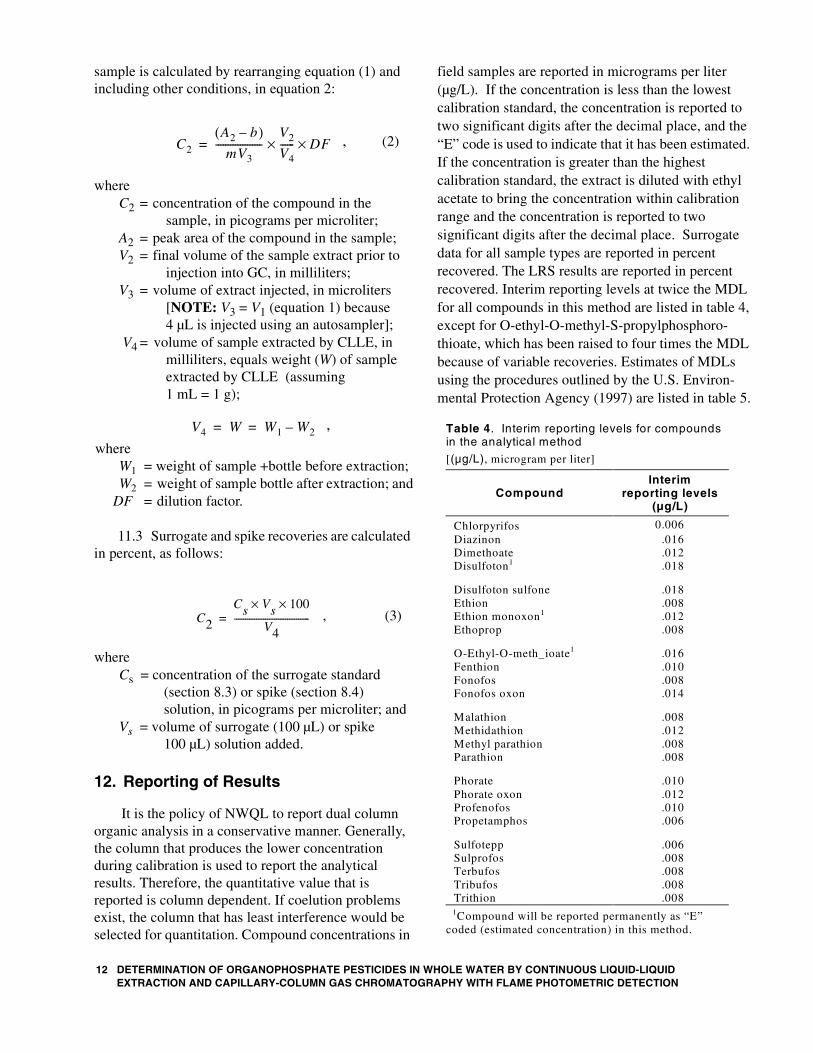
sample is calculated by rearranging equation (1) and including other conditions, in equation 2:
whereC2 = concentration of the compound in the
sample, in picograms per microliter;A2 = peak area of the compound in the sample;V2 = final volume of the sample extract prior to
injection into GC, in milliliters; V3 = volume of extract injected, in microliters
[NOTE: V3 = V1 (equation 1) because 4 µL is injected using an autosampler];
V4 = volume of sample extracted by CLLE, in milliliters, equals weight (W) of sample extracted by CLLE (assuming 1 mL = 1 g);
where W1 = weight of sample +bottle before extraction;W2 = weight of sample bottle after extraction; and
DF = dilution factor.
11.3 Surrogate and spike recoveries are calculated in percent, as follows:
whereCs = concentration of the surrogate standard
(section 8.3) or spike (section 8.4) solution, in picograms per microliter; and
Vs = volume of surrogate (100 µL) or spike 100 µL) solution added.
12. Reporting of Results
It is the policy of NWQL to report dual column organic analysis in a conservative manner. Generally, the column that produces the lower concentration during calibration is used to report the analytical results. Therefore, the quantitative value that is reported is column dependent. If coelution problems exist, the column that has least interference would be selected for quantitation. Compound concentrations in
C2
A2 b–( )mV3
-------------------V2
V4------× DF×= , (2)
V4 W W1 W2–= = ,
C2
Cs Vs 100××
V4----------------------------------= , (3)
12 DETERMINATION OF ORGANOPHOSPHATE PESTICIDES IN WEXTRACTION AND CAPILLARY-COLUMN GAS CHROMATOG
field samples are reported in micrograms per liter (µg/L). If the concentration is less than the lowest calibration standard, the concentration is reported to two significant digits after the decimal place, and the “E” code is used to indicate that it has been estimated. If the concentration is greater than the highest calibration standard, the extract is diluted with ethyl acetate to bring the concentration within calibration range and the concentration is reported to two significant digits after the decimal place. Surrogate data for all sample types are reported in percent recovered. The LRS results are reported in percent recovered. Interim reporting levels at twice the MDL for all compounds in this method are listed in table 4, except for O-ethyl-O-methyl-S-propylphosphoro-thioate, which has been raised to four times the MDL because of variable recoveries. Estimates of MDLs using the procedures outlined by the U.S. Environ-mental Protection Agency (1997) are listed in table 5.
Table 4. Interim reporting levels for compounds in the analytical method
[(µg/L), microgram per liter]
Compound Interim
reporting levels (µg/L)
Chlorpyrifos 0.006 Diazinon .016 Dimethoate .012 Disulfoton1 .018
Disulfoton sulfone .018 Ethion .008 Ethion monoxon1 .012 Ethoprop .008
O-Ethyl-O-meth_ioate1 .016 Fenthion .010 Fonofos .008 Fonofos oxon .014
Malathion .008 Methidathion .012 Methyl parathion .008 Parathion .008
Phorate .010 Phorate oxon .012 Profenofos .010 Propetamphos .006
Sulfotepp .006 Sulprofos .008 Terbufos .008 Tribufos .008 Trithion .008 1Compound will be reported permanently as “E”
coded (estimated concentration) in this method.
HOLE WATER BY CONTINUOUS LIQUID-LIQUID RAPHY WITH FLAME PHOTOMETRIC DETECTION
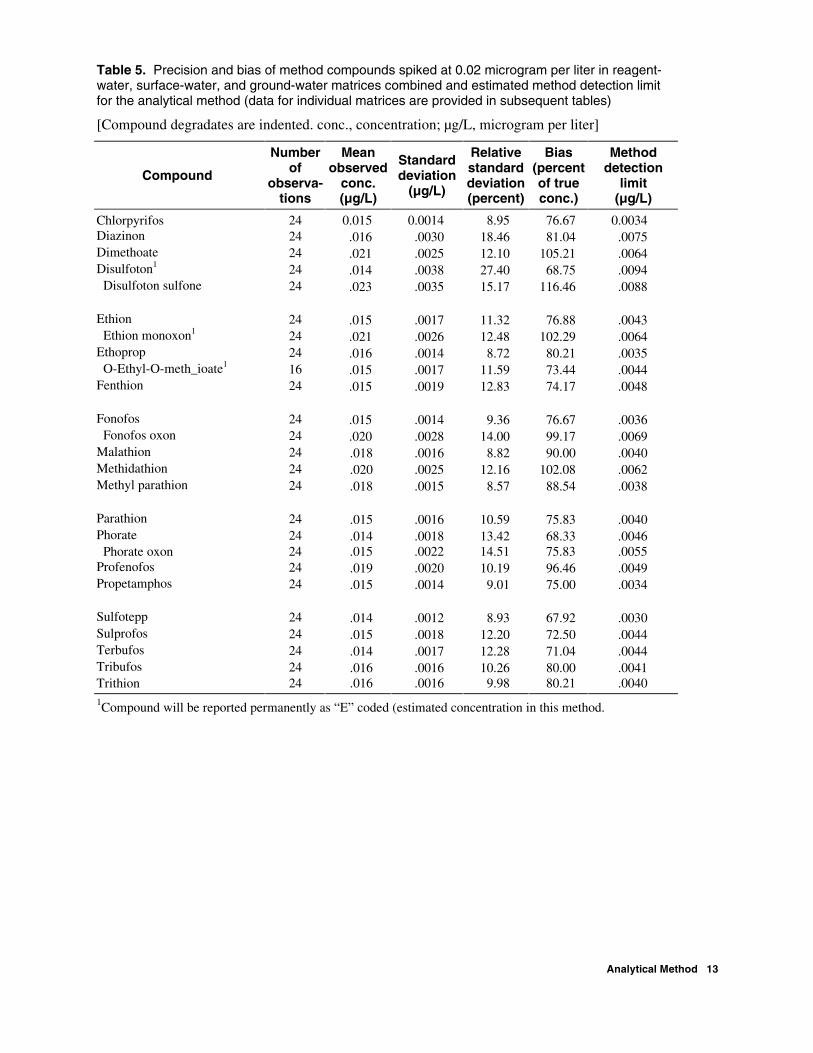
Table 5. Precision and bias of method compounds spiked at 0.02 microgram per liter in reagent-water, surface-water, and ground-water matrices combined and estimated method detection limit for the analytical method (data for individual matrices are provided in subsequent tables)
[Compound degradates are indented. conc., concentration; µg/L, microgram per liter]
Compound
Number of
observa- tions
Mean observed
conc. (µg/L)
Standard deviation
(µg/L)
Relative standard deviation (percent)
Bias (percent of true conc.)
Method detection
limit (µg/L)
Chlorpyrifos 24 0.015 0.0014 8.95 76.67 0.0034 Diazinon 24 .016 .0030 18.46 81.04 .0075 Dimethoate 24 .021 .0025 12.10 105.21 .0064 Disulfoton1 24 .014 .0038 27.40 68.75 .0094 Disulfoton sulfone 24 .023 .0035 15.17 116.46 .0088 Ethion 24 .015 .0017 11.32 76.88 .0043 Ethion monoxon1 24 .021 .0026 12.48 102.29 .0064 Ethoprop 24 .016 .0014 8.72 80.21 .0035 O-Ethyl-O-meth_ioate1 16 .015 .0017 11.59 73.44 .0044 Fenthion 24 .015 .0019 12.83 74.17 .0048 Fonofos 24 .015 .0014 9.36 76.67 .0036 Fonofos oxon 24 .020 .0028 14.00 99.17 .0069 Malathion 24 .018 .0016 8.82 90.00 .0040 Methidathion 24 .020 .0025 12.16 102.08 .0062 Methyl parathion 24 .018 .0015 8.57 88.54 .0038 Parathion 24 .015 .0016 10.59 75.83 .0040 Phorate 24 .014 .0018 13.42 68.33 .0046 Phorate oxon 24 .015 .0022 14.51 75.83 .0055 Profenofos 24 .019 .0020 10.19 96.46 .0049 Propetamphos 24 .015 .0014 9.01 75.00 .0034 Sulfotepp 24 .014 .0012 8.93 67.92 .0030 Sulprofos 24 .015 .0018 12.20 72.50 .0044 Terbufos 24 .014 .0017 12.28 71.04 .0044 Tribufos 24 .016 .0016 10.26 80.00 .0041 Trithion 24 .016 .0016 9.98 80.21 .0040 1Compound will be reported permanently as “E” coded (estimated concentration in this method.
Analytical Method 13
13. Method Performance
13.1 Samples of (1) reagent water, (2) surface water collected from the South Platte River, near Dartmouth Street and Platte River Drive, Denver, Colo., and (3) ground water collected from a domestic well in Evergreen, Colo., were used to test method performance. Eight samples of each water type were fortified with each compound at three different concen-trations of 0.02, 0.05, and 0.5 µg/L. One sample for each water type was unfortified to determine any potential background contamination or interference in each matrix.
13.2 All samples for a given matrix were extracted on the same day. Extracts were analyzed by GC/FPD, but different concentrations and matrices were analyzed on different days. Mean recoveries of most method compounds spiked in surface-water samples ranged from 54 to 137 percent and those in ground-water samples ranged from 40 to 109 percent for all pesticides. Recoveries in reagent-water samples ranged from 42 to 104 percent for all pesticides. The only exception was O-ethyl-O-methyl-S-propylphosphoro-thioate, which had variable recovery in all three matrices ranging from 27 to 79 percent. Precision and bias data are listed in tables 6 through 14.
13.3 The unfortified surface-water samples contained low concentrations of diazinon (0.008 µg/L). This concentration (0.008 µg/L) was subtracted from the diazinon concentrations determined in the surface-water-spiked subsamples to give corrected results in tables 9, 10, and 11. No other method compounds were found in the surface-water sample, and no method compounds were detected in the reagent-water or ground-water samples.
13.4 Estimated MDLs were determined by fortifying eight reagent-water samples, eight surface-water samples, and eight ground-water samples, with the method compounds at 0.02 µg/L, a concentration that was twice the minimum reporting level of 0.01 µg/L used in the previous method described by Wershaw and others (1987). The MDL was calculated by using the following equation:
, (4)MDL S t n 1– 1 α 0.99=–( , )×=
14 DETERMINATION OF ORGANOPHOSPHATE PESTICIDES IN WEXTRACTION AND CAPILLARY-COLUMN GAS CHROMATOGR
where S = standard deviation of replicate analyses, in
micrograms per liter, at the lowest concentration;
n = number of replicate analyses; and t(n - 1, 1− α = 0.99) = Student's t − value for the confidence level
with n −1 degrees of freedom (U.S. Environmental Protection Agency, 1997).
NOTE: Four significant figures after the decimal were used for standard deviations during MDL calculations.
13.5 Precision (percent relative standard deviation) and bias (percent mean recovery) for all matrices are listed in tables 6 through 14. Overall precision and bias of the compounds—combining all three water matrices and all nine concentrations—are listed in table 15. The term “variability” often is used interchangeably with the term “precision,” and “precision” is used in this report. Excellent perform-ance is indicated for this method, with most compounds having relative standard deviations (RSD) less than 25 percent in all three matrices and mean recoveries in excess of 70 percent, especially at low concentrations. O-ethyl-O-methyl-S-propylphosphor-othioate showed variable performance in all three matrices in comparison to the performance of all other compounds. It showed low RSD and good recovery (greater than 60 percent) for lower spikes in natural-water samples, but poor recovery (less than 40 percent) in high spikes for all sample types at about 30 percent; it showed RSD less than 10 percent with good recovery (above 60 percent) for high spiked samples.
13.6 The recoveries for methidathion, disulfoton sulfone, and ethion monoxon in surface-water samples were substantially greater than 100 percent (107 to 139 percent), especially in low- and medium-level-spiked samples. It is possible that they are present in the surface-water source at levels near or less than the MDL and would contribute to the concentrations recovered. These results also could be caused by matrix-enhanced sensitivity. The injection of a complex matrix sample extract might coat the surfaces of the injection port with matrix components and protect compounds from decomposition or adsorption. As a result, a greater response is observed for compounds in sample extracts than in clean calibration solutions (Erney and others, 1993, 1997).
HOLE WATER BY CONTINUOUS LIQUID-LIQUID APHY WITH FLAME PHOTOMETRIC DETECTION
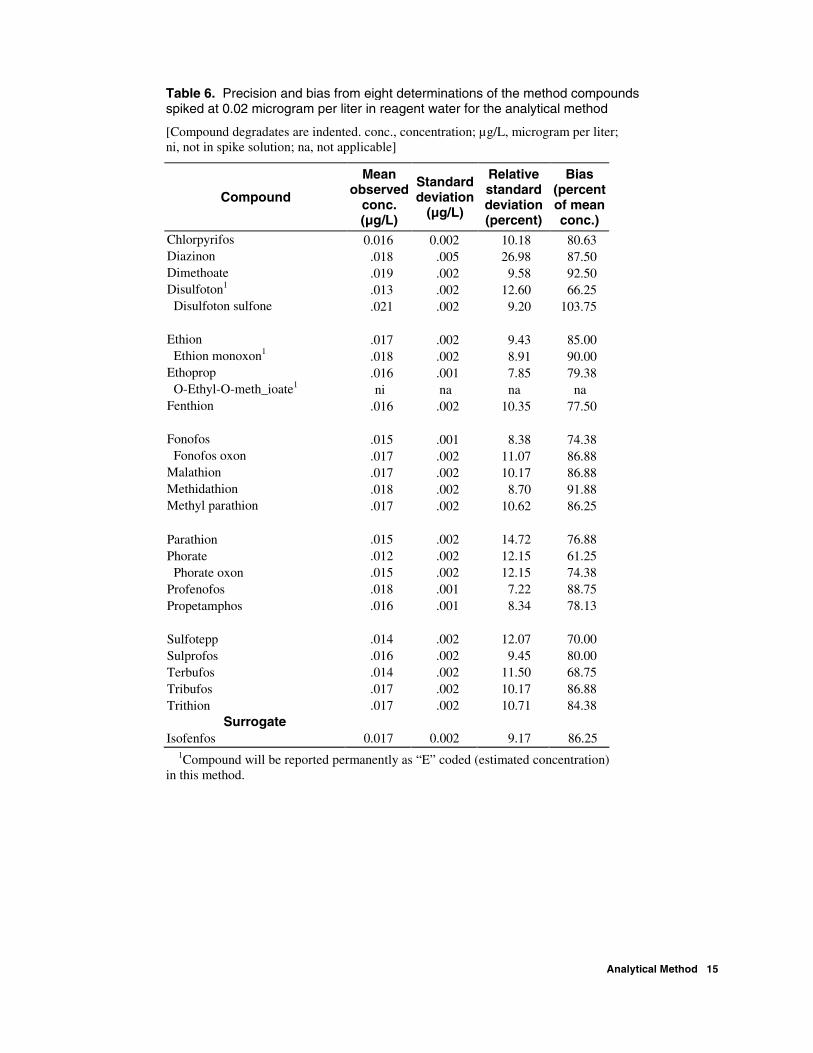
Table 6. Precision and bias from eight determinations of the method compounds spiked at 0.02 microgram per liter in reagent water for the analytical method
[Compound degradates are indented. conc., concentration; µg/L, microgram per liter; ni, not in spike solution; na, not applicable]
Compound
Mean observed
conc. (µg/L)
Standard deviation
(µg/L)
Relative standard deviation (percent)
Bias (percent of mean conc.)
Chlorpyrifos 0.016 0.002 10.18 80.63 Diazinon .018 .005 26.98 87.50 Dimethoate .019 .002 9.58 92.50 Disulfoton1 .013 .002 12.60 66.25 Disulfoton sulfone .021 .002 9.20 103.75 Ethion .017 .002 9.43 85.00 Ethion monoxon1 .018 .002 8.91 90.00 Ethoprop .016 .001 7.85 79.38 O-Ethyl-O-meth_ioate1 ni na na na Fenthion .016 .002 10.35 77.50 Fonofos .015 .001 8.38 74.38 Fonofos oxon .017 .002 11.07 86.88 Malathion .017 .002 10.17 86.88 Methidathion .018 .002 8.70 91.88 Methyl parathion .017 .002 10.62 86.25 Parathion .015 .002 14.72 76.88 Phorate .012 .002 12.15 61.25 Phorate oxon .015 .002 12.15 74.38 Profenofos .018 .001 7.22 88.75 Propetamphos .016 .001 8.34 78.13 Sulfotepp .014 .002 12.07 70.00 Sulprofos .016 .002 9.45 80.00 Terbufos .014 .002 11.50 68.75 Tribufos .017 .002 10.17 86.88 Trithion .017 .002 10.71 84.38
Surrogate Isofenfos 0.017 0.002 9.17 86.25
1Compound will be reported permanently as “E” coded (estimated concentration) in this method.
Analytical Method 15
16 DETERMINATION OF ORGANOPHOSPHATE PESTICIDES IN WEXTRACTION AND CAPILLARY-COLUMN GAS CHROMATOGR
Table 7. Precision and bias from eight determinations of the method compounds spiked at 0.05 microgram per liter in reagent water for the analytical method
[Compound degradates are indented. conc., concentration; µg/L, microgram per liter; ni, not in spike solution; na, not applicable]
Compound
Mean observed
conc. (µg/L)
Standard deviation
(µg/L)
Relative standard deviation (percent)
Bias (percent of mean conc.)
Chlorpyrifos 0.034 0.006 19.15 67.00 Diazinon .036 .006 15.59 72.50 Dimethoate .042 .005 11.43 83.50 Disulfoton1 .031 .003 10.75 61.25 Disulfoton sulfone .046 .007 14.20 91.75 Ethion .038 .006 16.65 76.75 Ethion monoxon1 .041 .006 14.59 81.75 Ethoprop .034 .005 14.62 68.50 O-Ethyl-O-meth_ioate1 ni na na na Fenthion .035 .006 16.59 70.50 Fonofos .031 .005 14.93 62.00 Fonofos oxon .039 .005 13.27 77.25 Malathion .039 .005 13.33 78.50 Methidathion .039 .010 25.92 77.75 Methyl parathion .038 .006 14.34 76.75 Parathion .036 .006 16.69 72.75 Phorate .025 .007 29.91 49.50 Phorate oxon .033 .005 16.45 65.00 Profenofos .039 .008 19.96 78.00 Propetamphos .034 .005 13.99 68.75 Sulfotepp .030 .007 23.42 59.00 Sulprofos .038 .006 14.47 76.75 Terbufos .028 .008 30.38 55.50 Tribufos .039 .007 17.10 77.50 Trithion .038 .006 16.20 76.25
Surrogate Isofenfos 0.040 0.006 14.59 79.50
1Compound will be reported permanently as “E” coded (estimated concentration) in this method.
HOLE WATER BY CONTINUOUS LIQUID-LIQUID APHY WITH FLAME PHOTOMETRIC DETECTION
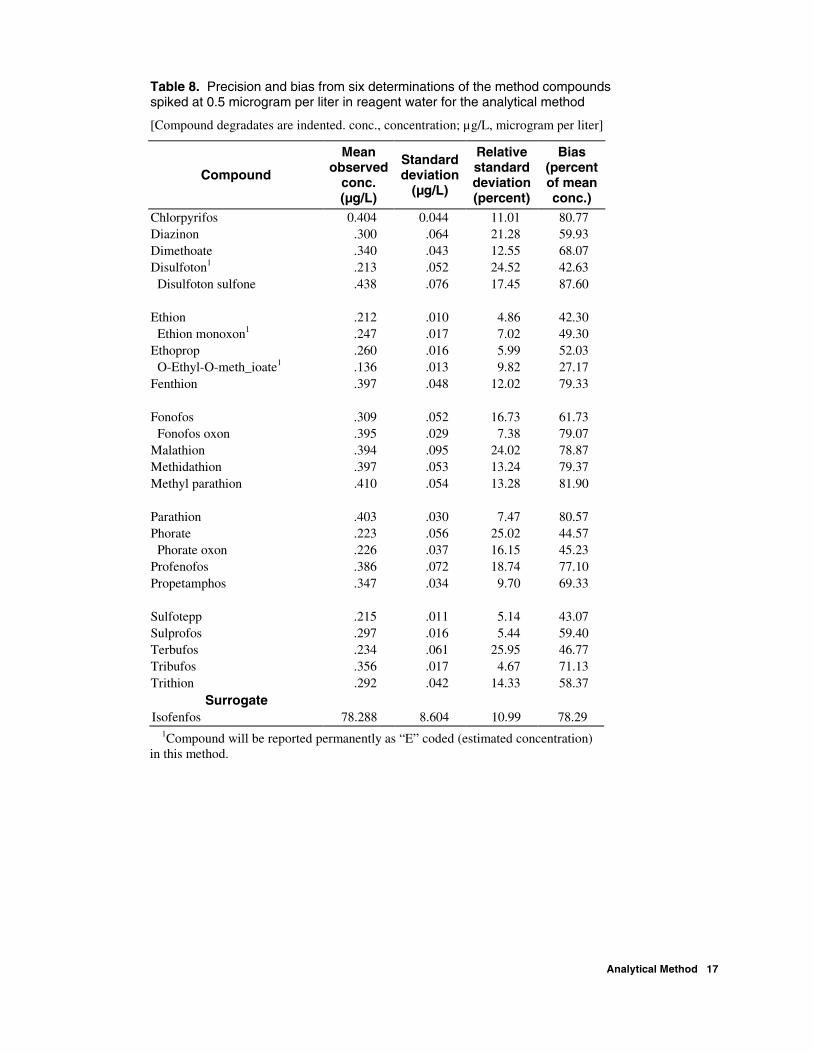
Table 8. Precision and bias from six determinations of the method compounds spiked at 0.5 microgram per liter in reagent water for the analytical method
[Compound degradates are indented. conc., concentration; µg/L, microgram per liter]
Compound
Mean observed
conc. (µg/L)
Standard deviation
(µg/L)
Relative standard deviation (percent)
Bias (percent of mean conc.)
Chlorpyrifos 0.404 0.044 11.01 80.77 Diazinon .300 .064 21.28 59.93 Dimethoate .340 .043 12.55 68.07 Disulfoton1 .213 .052 24.52 42.63 Disulfoton sulfone .438 .076 17.45 87.60 Ethion .212 .010 4.86 42.30 Ethion monoxon1 .247 .017 7.02 49.30 Ethoprop .260 .016 5.99 52.03 O-Ethyl-O-meth_ioate1 .136 .013 9.82 27.17 Fenthion .397 .048 12.02 79.33 Fonofos .309 .052 16.73 61.73 Fonofos oxon .395 .029 7.38 79.07 Malathion .394 .095 24.02 78.87 Methidathion .397 .053 13.24 79.37 Methyl parathion .410 .054 13.28 81.90 Parathion .403 .030 7.47 80.57 Phorate .223 .056 25.02 44.57 Phorate oxon .226 .037 16.15 45.23 Profenofos .386 .072 18.74 77.10 Propetamphos .347 .034 9.70 69.33 Sulfotepp .215 .011 5.14 43.07 Sulprofos .297 .016 5.44 59.40 Terbufos .234 .061 25.95 46.77 Tribufos .356 .017 4.67 71.13 Trithion .292 .042 14.33 58.37
Surrogate Isofenfos 78.288 8.604 10.99 78.29
1Compound will be reported permanently as “E” coded (estimated concentration) in this method.
Analytical Method 17
18 DETERMINATION OF ORGANOPHOSPHATE PESTICIDES IN WEXTRACTION AND CAPILLARY-COLUMN GAS CHROMATOGR
Table 9. Precision and bias from eight determinations of the method compounds spiked at 0.02 microgram per liter in surface water (South Platte River near Dartmouth St. and Platte River Dr., Denver, Colo.) for the analytical method
[Compound degradates are indented. conc., concentration; µg/L, microgram per liter]
Compound
Mean observed
conc. (µg/L)
Standard deviation
(µg/L)
Relative standard deviation (percent)
Bias (percent of mean conc.)
Chlorpyrifos 0.015 0.001 8.40 76.25 Diazinon2 .015 .002 10.27 75.63 Dimethoate .024 .001 5.40 118.75 Disulfoton1 .018 .002 9.16 87.50 Disulfoton sulfone .027 .002 8.27 136.88 Ethion .014 .002 10.44 71.25 Ethion monoxon1 .023 .002 8.05 115.00 Ethoprop .017 .001 6.58 85.63 O-Ethyl-O-meth_ioate1 .016 .001 4.04 79.38 Fenthion .016 .002 12.43 77.50 Fonofos .016 .001 7.25 81.88 Fonofos oxon .023 .002 8.16 113.13 Malathion .019 .001 7.21 96.25 Methidathion .023 .002 9.90 113.75 Methyl parathion .019 .001 6.84 93.75 Parathion .016 .001 9.12 77.50 Phorate .016 .001 6.79 78.13 Phorate oxon .017 .001 7.43 86.25 Profenofos .021 .002 8.17 105.63 Propetamphos .016 .001 5.97 77.50 Sulfotepp .014 .001 6.86 67.50 Sulprofos .014 .002 13.59 69.38 Terbufos .016 .001 7.09 79.38 Tribufos .016 .001 9.12 77.50 Trithion .016 .002 11.82 78.13
Surrogate Isofenfos 0.017 0.001 6.29 85.00
1Compound will be reported permanently as “E” coded (estimated concentration) in this method.
2Mean observed concentration after subtracting background diazinon concentration of 0.008 g/L.
HOLE WATER BY CONTINUOUS LIQUID-LIQUID APHY WITH FLAME PHOTOMETRIC DETECTION
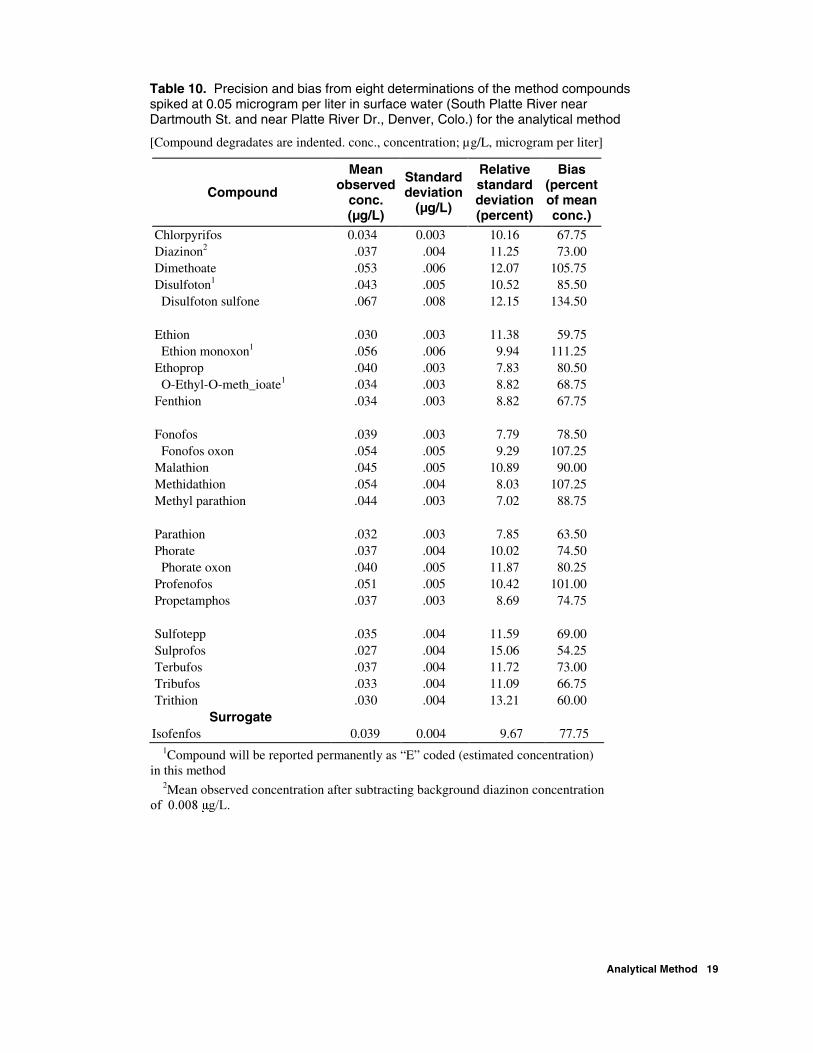
Table 10. Precision and bias from eight determinations of the method compounds spiked at 0.05 microgram per liter in surface water (South Platte River near Dartmouth St. and near Platte River Dr., Denver, Colo.) for the analytical method
[Compound degradates are indented. conc., concentration; µg/L, microgram per liter]
Compound
Mean observed
conc. (µg/L)
Standard deviation
(µg/L)
Relative standard deviation (percent)
Bias (percent of mean conc.)
Chlorpyrifos 0.034 0.003 10.16 67.75 Diazinon2 .037 .004 11.25 73.00 Dimethoate .053 .006 12.07 105.75 Disulfoton1 .043 .005 10.52 85.50 Disulfoton sulfone .067 .008 12.15 134.50 Ethion .030 .003 11.38 59.75 Ethion monoxon1 .056 .006 9.94 111.25 Ethoprop .040 .003 7.83 80.50 O-Ethyl-O-meth_ioate1 .034 .003 8.82 68.75 Fenthion .034 .003 8.82 67.75 Fonofos .039 .003 7.79 78.50 Fonofos oxon .054 .005 9.29 107.25 Malathion .045 .005 10.89 90.00 Methidathion .054 .004 8.03 107.25 Methyl parathion .044 .003 7.02 88.75 Parathion .032 .003 7.85 63.50 Phorate .037 .004 10.02 74.50 Phorate oxon .040 .005 11.87 80.25 Profenofos .051 .005 10.42 101.00 Propetamphos .037 .003 8.69 74.75 Sulfotepp .035 .004 11.59 69.00 Sulprofos .027 .004 15.06 54.25 Terbufos .037 .004 11.72 73.00 Tribufos .033 .004 11.09 66.75 Trithion .030 .004 13.21 60.00
Surrogate Isofenfos 0.039 0.004 9.67 77.75
1Compound will be reported permanently as “E” coded (estimated concentration) in this method
2Mean observed concentration after subtracting background diazinon concentration ���������� ���
Analytical Method 19
20 DETERMINATION OF ORGANOPHOSPHATE PESTICIDES IN WEXTRACTION AND CAPILLARY-COLUMN GAS CHROMATOGR
Table 11. Precision and bias from eight determinations of the method compounds spiked at 0.5 microgram per liter in surface water (South Platte River near Dartmouth St. and Platte River Dr., Denver, Colo.) for the analytical method
[Compound degradates are indented. conc., concentration; µg/L, microgram per liter; ni, not in spike solution; na, not applicable]
Compound
Mean observed
conc. (µg/L)
Standard deviation
(µg/L)
Relative standard deviation (percent)
Bias (percent of mean conc.)
Chlorpyrifos 0.358 0.026 7.25 71.55 Diazinon2 .409 .031 7.49 81.75 Dimethoate .521 .027 5.17 104.18 Disulfoton1 .354 .025 6.95 70.83 Disulfoton sulfone .560 .025 4.53 112.08 Ethion .336 .020 6.05 67.13 Ethion monoxon1 .318 .004 1.34 63.63 Ethoprop ni na na na O-Ethyl-O-meth_ioate1 .172 .004 2.48 34.35 Fenthion .409 .022 5.38 81.85 Fonofos .353 .030 8.42 70.68 Fonofos oxon .474 .023 4.94 94.70 Malathion .442 .020 4.62 88.38 Methidathion .477 .021 4.30 95.40 Methyl parathion .457 .019 4.19 91.33 Parathion .435 .020 4.59 87.03 Phorate .332 .027 8.04 66.40 Phorate oxon .423 .033 7.86 84.68 Profenofos .452 .023 5.12 90.45 Propetamphos .369 .022 5.91 73.70 Sulfotepp .353 .015 4.30 70.68 Sulprofos .327 .026 7.94 65.30 Terbufos .417 .024 5.72 83.33 Tribufos .373 .025 6.69 74.53 Trithion .358 .023 6.39 71.50
Surrogate Isofenfos 54.303 3.074 5.66 54.30 1Compound will be reported permanently as “E” coded (estimated concentration) in
this method. 2Mean observed concentration after subtracting background diazinon concentration
of 0.008 ��.
HOLE WATER BY CONTINUOUS LIQUID-LIQUID APHY WITH FLAME PHOTOMETRIC DETECTION
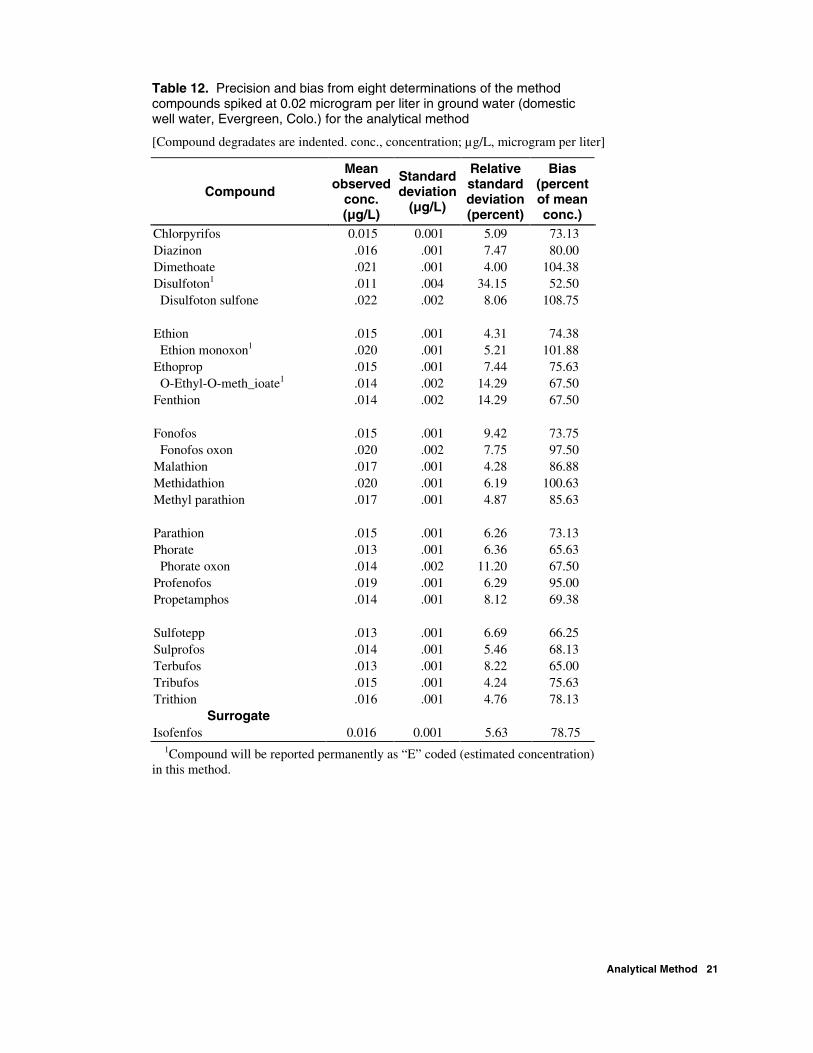
Table 12. Precision and bias from eight determinations of the method compounds spiked at 0.02 microgram per liter in ground water (domestic well water, Evergreen, Colo.) for the analytical method
[Compound degradates are indented. conc., concentration; µg/L, microgram per liter]
Compound
Mean observed
conc. (µg/L)
Standard deviation
(µg/L)
Relative standard deviation (percent)
Bias (percent of mean conc.)
Chlorpyrifos 0.015 0.001 5.09 73.13 Diazinon .016 .001 7.47 80.00 Dimethoate .021 .001 4.00 104.38 Disulfoton1 .011 .004 34.15 52.50 Disulfoton sulfone .022 .002 8.06 108.75 Ethion .015 .001 4.31 74.38 Ethion monoxon1 .020 .001 5.21 101.88 Ethoprop .015 .001 7.44 75.63 O-Ethyl-O-meth_ioate1 .014 .002 14.29 67.50 Fenthion .014 .002 14.29 67.50 Fonofos .015 .001 9.42 73.75 Fonofos oxon .020 .002 7.75 97.50 Malathion .017 .001 4.28 86.88 Methidathion .020 .001 6.19 100.63 Methyl parathion .017 .001 4.87 85.63 Parathion .015 .001 6.26 73.13 Phorate .013 .001 6.36 65.63 Phorate oxon .014 .002 11.20 67.50 Profenofos .019 .001 6.29 95.00 Propetamphos .014 .001 8.12 69.38 Sulfotepp .013 .001 6.69 66.25 Sulprofos .014 .001 5.46 68.13 Terbufos .013 .001 8.22 65.00 Tribufos .015 .001 4.24 75.63 Trithion .016 .001 4.76 78.13
Surrogate Isofenfos 0.016 0.001 5.63 78.75
1Compound will be reported permanently as “E” coded (estimated concentration) in this method.
Analytical Method 21
22 DETERMINATION OF ORGANOPHOSPHATE PESTICIDES IN WEXTRACTION AND CAPILLARY-COLUMN GAS CHROMATOGR
Table 13. Precision and bias from eight determinations of the method compounds spiked at 0.05 microgram per liter in ground water (domestic well water, Evergreen, Colo.) for the analytical method
[Compound degradates are indented. conc., concentration; µg/L, microgram per liter]
Compound
Mean observed
conc. (µg/L)
Standard deviation
(µg/L)
Relative standard deviation (percent)
Bias (percent of mean conc.)
Chlorpyrifos 0.035 0.006 16.62 69.50 Diazinon .037 .005 13.82 73.00 Dimethoate .047 .007 15.58 94.50 Disulfoton1 .034 .009 26.65 67.00 Disulfoton sulfone .051 .008 16.10 102.00 Ethion .037 .005 12.26 74.00 Ethion monoxon1 .048 .007 14.23 95.00 Ethoprop .036 .005 14.78 71.50 O-Ethyl-O-meth_ioate1 .030 .004 14.46 59.50 Fenthion .034 .007 19.35 67.00 Fonofos .034 .005 13.49 68.50 Fonofos oxon .045 .006 13.40 90.50 Malathion .040 .007 16.25 80.50 Methidathion .046 .006 13.47 92.50 Methyl parathion .040 .006 13.94 80.75 Parathion .034 .005 15.47 68.75 Phorate .032 .006 17.31 63.25 Phorate oxon .033 .007 21.61 66.00 Profenofos .044 .007 14.70 88.75 Propetamphos .034 .005 13.97 67.75 Sulfotepp .030 .004 14.00 60.50 Sulprofos .035 .005 14.47 70.25 Terbufos .033 .006 17.56 65.00 Tribufos .038 .004 11.50 75.75 Trithion .038 .005 12.22 76.75
Surrogate Isofenfos 0.039 0.005 13.39 77.00
1Compound will be reported permanently as “E” coded (estimated concentration) in this method.
HOLE WATER BY CONTINUOUS LIQUID-LIQUID APHY WITH FLAME PHOTOMETRIC DETECTION
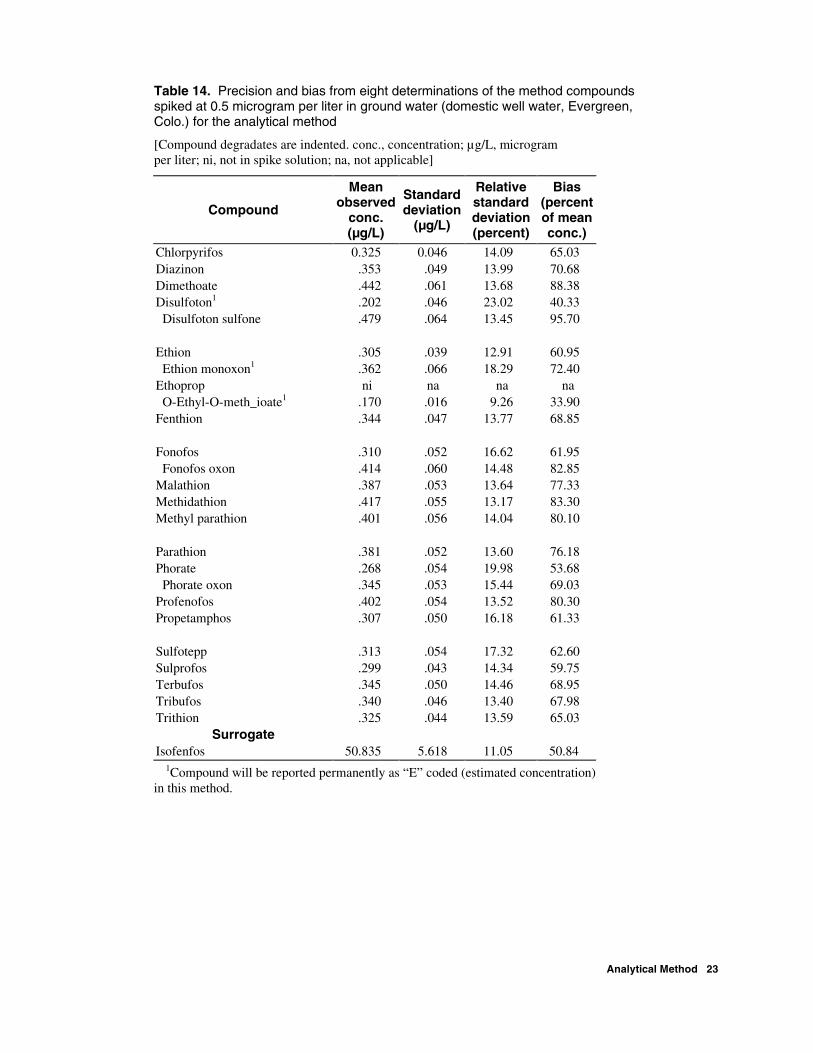
Table 14. Precision and bias from eight determinations of the method compounds spiked at 0.5 microgram per liter in ground water (domestic well water, Evergreen, Colo.) for the analytical method
[Compound degradates are indented. conc., concentration; µg/L, microgram per liter; ni, not in spike solution; na, not applicable]
Compound
Mean observed
conc. (µg/L)
Standard deviation
(µg/L)
Relative standard deviation (percent)
Bias (percent of mean conc.)
Chlorpyrifos 0.325 0.046 14.09 65.03 Diazinon .353 .049 13.99 70.68 Dimethoate .442 .061 13.68 88.38 Disulfoton1 .202 .046 23.02 40.33 Disulfoton sulfone .479 .064 13.45 95.70 Ethion .305 .039 12.91 60.95 Ethion monoxon1 .362 .066 18.29 72.40 Ethoprop ni na na na O-Ethyl-O-meth_ioate1 .170 .016 9.26 33.90 Fenthion .344 .047 13.77 68.85 Fonofos .310 .052 16.62 61.95 Fonofos oxon .414 .060 14.48 82.85 Malathion .387 .053 13.64 77.33 Methidathion .417 .055 13.17 83.30 Methyl parathion .401 .056 14.04 80.10 Parathion .381 .052 13.60 76.18 Phorate .268 .054 19.98 53.68 Phorate oxon .345 .053 15.44 69.03 Profenofos .402 .054 13.52 80.30 Propetamphos .307 .050 16.18 61.33 Sulfotepp .313 .054 17.32 62.60 Sulprofos .299 .043 14.34 59.75 Terbufos .345 .050 14.46 68.95 Tribufos .340 .046 13.40 67.98 Trithion .325 .044 13.59 65.03
Surrogate Isofenfos 50.835 5.618 11.05 50.84
1Compound will be reported permanently as “E” coded (estimated concentration) in this method.
Analytical Method 23
24 DETERMINATION OF ORGANOPHOSPHATE PESTICIDES IN WEXTRACTION AND CAPILLARY-COLUMN GAS CHROMATOGR
Table 15. Overall precision and bias combined from the determinations of the method compounds spiked at 0.02, 0.05, and 0.5 microgram per liter in reagent water, surface water (South Platte River near Dartmouth St. and Platte River Dr., Denver, Colo.), and ground water (domestic well water, Evergreen, Colo.) for the analytical method
[Compound degradates are indented. µg/L, microgram per liter, conc., concentration]
Compound Number of observations
Standard deviation
(µg/L)
Relative standard deviation (percent)
Bias (percent of mean conc.)
Chlorpyrifos 70 9.66 13.89 72.16 Diazinon 70 13.10 17.40 75.31 Dimethoate 70 16.31 16.93 96.34 Disulfoton1 70 18.86 29.31 64.38 Disulfoton sulfone 70 20.21 18.59 108.70 Ethion 70 13.20 19.22 68.68 Ethion monoxon1 70 22.13 25.22 87.78 Ethoprop 54 11.80 15.93 74.10 O-Ethyl-O-meth_ioate1 54 19.76 36.67 53.89 Fenthion 70 10.27 14.09 72.91 Fonofos 70 10.25 14.51 70.62 Fonofos oxon 70 14.64 15.83 92.50 Malathion 70 11.33 13.33 85.01 Methidathion 70 15.62 16.62 93.94 Methyl parathion 70 9.77 11.48 85.11 Parathion 70 10.29 13.72 74.99 Phorate 70 13.36 21.43 62.37 Phorate oxon 70 14.34 20.02 71.68 Profenofos 70 13.61 15.16 89.79 Propetamphos 70 8.61 12.08 71.23 Sulfotepp 70 10.71 16.79 63.75 Sulprofos 70 10.95 16.28 67.24 Terbufos 70 13.77 20.29 67.88 Tribufos 70 9.47 12.64 74.95 Trithion 70 11.56 15.96 72.45
1Compound will be reported permanently as “E” coded (estimated concentration) in this method.
HOLE WATER BY CONTINUOUS LIQUID-LIQUID APHY WITH FLAME PHOTOMETRIC DETECTION
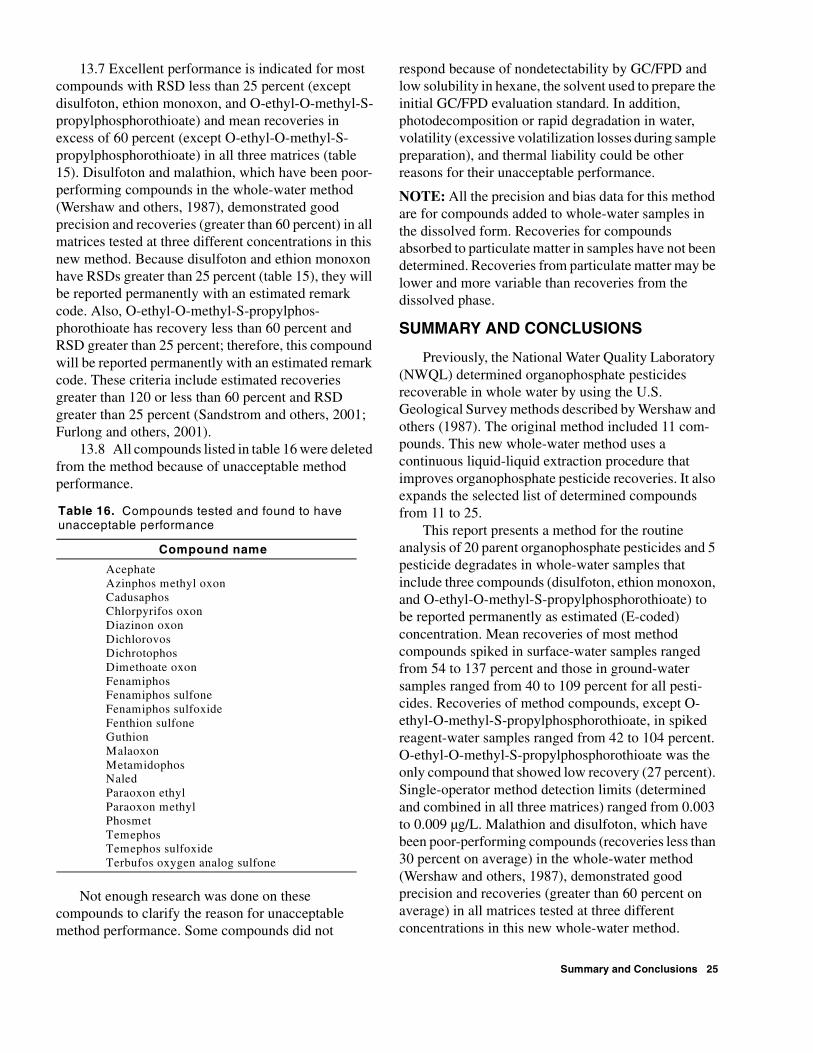
Summary and Conclusions 25
13.7 Excellent performance is indicated for most compounds with RSD less than 25 percent (except disulfoton, ethion monoxon, and O-ethyl-O-methyl-S-propylphosphorothioate) and mean recoveries in excess of 60 percent (except O-ethyl-O-methyl-S-propylphosphorothioate) in all three matrices (table 15). Disulfoton and malathion, which have been poor-performing compounds in the whole-water method (Wershaw and others, 1987), demonstrated good precision and recoveries (greater than 60 percent) in all matrices tested at three different concentrations in this new method. Because disulfoton and ethion monoxon have RSDs greater than 25 percent (table 15), they will be reported permanently with an estimated remark code. Also, O-ethyl-O-methyl-S-propylphos-phorothioate has recovery less than 60 percent and RSD greater than 25 percent; therefore, this compound will be reported permanently with an estimated remark code. These criteria include estimated recoveries greater than 120 or less than 60 percent and RSD greater than 25 percent (Sandstrom and others, 2001; Furlong and others, 2001).
13.8 All compounds listed in table 16 were deleted from the method because of unacceptable method performance.
Not enough research was done on these compounds to clarify the reason for unacceptable method performance. Some compounds did not
respond because of nondetectability by GC/FPD and low solubility in hexane, the solvent used to prepare the initial GC/FPD evaluation standard. In addition, photodecomposition or rapid degradation in water, volatility (excessive volatilization losses during sample preparation), and thermal liability could be other reasons for their unacceptable performance.
NOTE: All the precision and bias data for this method are for compounds added to whole-water samples in the dissolved form. Recoveries for compounds absorbed to particulate matter in samples have not been determined. Recoveries from particulate matter may be lower and more variable than recoveries from the dissolved phase.
SUMMARY AND CONCLUSIONS
Previously, the National Water Quality Laboratory (NWQL) determined organophosphate pesticides recoverable in whole water by using the U.S. Geological Survey methods described by Wershaw and others (1987). The original method included 11 com-pounds. This new whole-water method uses a continuous liquid-liquid extraction procedure that improves organophosphate pesticide recoveries. It also expands the selected list of determined compounds from 11 to 25.
This report presents a method for the routine analysis of 20 parent organophosphate pesticides and 5 pesticide degradates in whole-water samples that include three compounds (disulfoton, ethion monoxon, and O-ethyl-O-methyl-S-propylphosphorothioate) to be reported permanently as estimated (E-coded) concentration. Mean recoveries of most method compounds spiked in surface-water samples ranged from 54 to 137 percent and those in ground-water samples ranged from 40 to 109 percent for all pesti-cides. Recoveries of method compounds, except O-ethyl-O-methyl-S-propylphosphorothioate, in spiked reagent-water samples ranged from 42 to 104 percent. O-ethyl-O-methyl-S-propylphosphorothioate was the only compound that showed low recovery (27 percent). Single-operator method detection limits (determined and combined in all three matrices) ranged from 0.003 to 0.009 µg/L. Malathion and disulfoton, which have been poor-performing compounds (recoveries less than 30 percent on average) in the whole-water method (Wershaw and others, 1987), demonstrated good precision and recoveries (greater than 60 percent on average) in all matrices tested at three different concentrations in this new whole-water method.
Table 16. Compounds tested and found to have unacceptable performance
Compound name
Acephate Azinphos methyl oxon Cadusaphos Chlorpyrifos oxon Diazinon oxon Dichlorovos Dichrotophos Dimethoate oxon Fenamiphos Fenamiphos sulfone Fenamiphos sulfoxide Fenthion sulfone Guthion Malaoxon Metamidophos Naled Paraoxon ethyl Paraoxon methyl Phosmet Temephos Temephos sulfoxide Terbufos oxygen analog sulfone
26 DETERMINATION OF ORGANOPHOSPHATE PESTICIDES IN WHOLE WATER BY CONTINUOUS LIQUID-LIQUID EXTRACTION AND CAPILLARY-COLUMN GAS CHROMATOGRAPHY WITH FLAME PHOTOMETRIC DETECTION
REFERENCES CITED
Childress, C.J.O., Foreman, W.T., Connor, B.F., and Maloney, T.J., 1999, New reporting procedures based on long-term method detection levels and some considerations for interpretations of water-quality data provided by the U.S. Geological Survey National Water Quality Laboratory: U.S. Geological Survey Open-File Report 99-193, 19 p.
Erney, D.R., Gillespie, A.M., Gilvydis, D.M., and Poole, C.F., 1993, Explanation of the matrix-induced chromatographic response enhancement of organophosphorous pesticides during open tubular column gas chromatography with splitless or hot on-column injection and flame photometric detection: Journal of Chromatography, v. 638, p. 57–63.
Erney, D.R., Pawlowski, T.M., Poole, C.F., 1997, Matrix induced peak enhancement of pesticides in gas chromatography: Journal of High Resolution Chromatography, v. 20, p. 375–378.
Fishman, M.J., 1993, ed., Methods of analysis by the U.S. Geological Survey National Water Quality Laboratory—Determination of inorganic and organic constituents in water and fluvial sediments: U.S. Geological Survey Open-File Report 93-125, 217 p.
Furlong, E.T., Anderson, B.D., Werner, S.L., Soliven, P.P., Coffey, L.J., and Burkhardt, M.R., 2001, Methods of analysis by the U.S. Geological Survey National Water Quality Laboratory—Determination of pesticides in water by graphitized carbon-based solid-phase extraction and high-performance liquid chromatography/mass spectrometry: U.S. Geological Survey Water-Resources Investigations Report 01-4134, 73 p.
Jha, V.K., and Wydoski, D.S., 2002, Methods of analysis by the U.S. Geological Survey National Water Quality Laboratory—Determination of organophosphate pesticides in filtered water by gas chromatography with flame photometric detection: U.S. Geological Survey Water- Resources Investigations Report 02-4071, 29 p.
____2003, Methods of analysis by the U.S. Geological Survey National Water Quality Laboratory— Determination of organophosphate pesticides in bottom sediment by gas chromatography with flame photometric detection: U.S. Geological Survey Water-Resources Investigations Report 02-4222, 30 p.
Pirkey, K.D., and Glodt, S.R., 1998, Quality control at the U.S. Geological Survey National Water Quality Laboratory: U.S. Geological Survey Fact Sheet FS-026-98, 4 p.
Sandstrom, M.W., Stroppel, M.E., Foreman, W.T., and Schroeder, M.P., 2001, Methods of analysis by the U.S. Geological Survey National Water Quality Laboratory—Determination of moderate-use pesticides and selected degradates in water by C-18 solid-phase extraction and capillary-column gas chromatography/mass spectrometry with selected-ion monitoring (methods 2002/2011): U.S. Geological Survey Water-Resources Investigations Report 01-4098, 70 p.
U.S. Environmental Protection Agency, 1997, Guidelines establishing test procedures for the analysis of pollutants (App. B, Part 136, Definition and procedures for the determination of the method detection limit): U.S. Code of Federal Regulations, Title 40, p. 265–267.
Wershaw, R.L., Fishman, M.J., Grabbe, R.R., and Lowe, L.E., eds., 1987, Methods for the determination of organic substances in water and fluvial sediments: U.S. Geological Survey Techniques of Water-Resources Investigations, book 5, chap. A3, p. 27–31.
Wilde, F.D., Radtke, D.B., Gibs, Jacob, and Iwatsubo, R.T., eds., 1999, National field manual for the collection of water-quality data: U.S. Geological Survey Techniques of Water-Resources Investigations, book 9, chaps. A1 through A6.
Winslow, S.D., Prakash, B., Domono, M.M., Pepich, B.V., and Munch, D.J., 2001, Considerations necessary in gathering occurrence data for selected unstable compounds in the USEPA unregulated contaminant candidate list in USEPA method 526: Environmental Science and Technology, v. 35, p. 1851–1858.
Zaugg, S.D., Sandstrom, M.W., Smith, S.G., and Fehlberg, K.M., 1995, Methods of analysis by the U.S. Geological Survey National Water Quality Laboratory—Determination of pesticides in water by C-18 solid-phase extraction and capillary-column gas chromatography/mass spectrometry with selected-ion monitoring: U.S. Geological Survey Open-File Report 95-181, 49 p.