METHODS OF ANALYSIS BY THE U.S. GEOLOGICAL …€¦ · · 2010-03-19cartridges are dried using...
34
METHODS OF ANALYSIS BY THE U.S. GEOLOGICAL SURVEY NATIONAL WATER QUALITY LABORATORY-- DETERMINATION OF ORGANONITROGEN HERBICIDES IN WATER BY SOLID-PHASE EXTRACTION AND CAPILLARY-COLUMN GAS CHROMATOGRAPHY/MASS SPECTROMETRY WITH SELECTED-ION MONITORING U.S. GEOLOGICAL SURVEY Open-File Report 91-519 Seal
Transcript of METHODS OF ANALYSIS BY THE U.S. GEOLOGICAL …€¦ · · 2010-03-19cartridges are dried using...

METHODS OF ANALYSIS BY THE U.S. GEOLOGICAL SURVEY
NATIONAL WATER QUALITY LABORATORY--
DETERMINATION OF ORGANONITROGEN HERBICIDES IN
WATER BY SOLID-PHASE EXTRACTION AND
CAPILLARY-COLUMN GAS CHROMATOGRAPHY/MASS
SPECTROMETRY WITH SELECTED-ION MONITORING
U.S. GEOLOGICAL SURVEY
Open-File Report 91-519
Seal

METHODS OF ANALYSIS BY THE U.S. GEOLOGICAL SURVEY
NATIONAL WATER QUALITY LABORATORY--
DETERMINATION OF ORGANONITROGEN HERBICIDES IN
WATER BY SOLID-PHASE EXTRACTION AND
CAPILLARY-COLUMN GAS CHROMATOGRAPHY/MASS
SPECTROMETRY WITH SELECTED-ION MONITORING
By Mark W. Sandstrom, Duane S. Wydoski, Michael P. Schroeder,
Jana L. Zamboni, and William T. Foreman
U.S. GEOLOGICAL SURVEY
Open-File Report 91-519
Seal
Denver, Colorado
First Printing, 1992Second printing with minor revisions, 1994

U.S. DEPARTMENT OF THE INTERIOR
BRUCE BABBITT, Secretary
U. S. GEOLOGICAL SURVEY
Robert M. Hirsch, Acting Director
For additional information Copies of this report can bewrite to: purchased from:
Chief, National Water Quality Laboratory U.S. Geological SurveyU.S. Geological Survey Books and Open-File Reports Section5293 Ward Road, Mail Stop 407 Box 25425, Mail Stop 517Arvada, CO 80002 Federal Center
Denver, CO 80225

i

ii
iii
CONTENTS Page
Abstract....................................................................................................................... 1Introduction .............................................................................................................. 1Analytical method ................................................................................................... 2
1. Scope and application................................................................................ 22. Summary of method................................................................................. 33. Interferences................................................................................................ 34. Apparatus and equipment ....................................................................... 45. Reagents and consumable materials...................................................... 66. Sampling methods, sample-collection equipment, and
cleaning procedures............................................................................ 76.1 Sampling methods....................................................................... 76.2 Sample-collection equipment ................................................... 76.3 Cleaning procedures.................................................................... 8
7. Gas chromatograph/mass spectrometer performance....................... 87.1 Gas chromatograph performance evaluation........................ 87.2 Mass spectrometer performance evaluation.......................... 8
8. Calibration ................................................................................................... 89. Procedure ..................................................................................................... 11
10. Calculation and reporting of results...................................................... 1410.1 Sample analysis and data evaluation...................................... 1410.2 Qualitative identification........................................................... 1510.3 Quantitation.................................................................................. 1610.4 Reporting concentrations........................................................... 17
Method performance............................................................................................... 17Conclusions............................................................................................................... 24References cited ........................................................................................................ 25
FIGURES
Figures 1-3. Sketches showing:
1. Solid-phase-extraction vacuum manifold................................... 122. Solid-phase-extraction pumping apparatus ................................ 133. Apparatus used for elution of analytes from solid-phase-
extraction cartridges by gravity flow....................................... 15
iv
TABLES
Page
Table 1. Constituent codes, laboratory codes, and Chemical AbstractsService registry numbers for method analytes.......................... 4
2. Retention time, relative retention time, quantitation ion,and confirmation ions for target compounds, surrogatecompound, and internal standard ............................................... 10
3. Accuracy and precision data from seven determinations ofthe method analytes at 0.2 microgram per liter in reagentwater.................................................................................................... 18
4. Accuracy and precision data from seven determinationsof the method analytes at 2.0 micrograms per literin reagent water................................................................................ 19
5. Accuracy and precision data from seven determinations ofthe method analytes at 0.2 microgram per liter in surfacewater (South Platte River)............................................................. 20
6. Accuracy and precision data from seven determinations ofthe method analytes at 2.0 micrograms per liter insurface water (South Platte River)................................................ 21
7. Accuracy and precision data from seven determinations ofthe method analytes at 0.2 microgram per liter in groundwater (Arvada Well No. 14)........................................................... 22
8. Accuracy and precision data from seven determinations ofthe method analytes at 2.0 micrograms per liter inground water (Arvada Well No. 14)............................................ 23

v
CONVERSION FACTORS AND
ABBREVIATED WATER-QUALITY UNITS
Multiply By To obtain
centimeter (cm) 3.94 X 10⁻¹ inchinch (in.) 25.4 millimetergram (g) 3.53 X 10⁻² ouncekilopascal (kPa) 0.296 inch of mercury (Hg)liter (L) 0.265 gallonmeter (m) 3.28 footmicrogram (µg) 3.53 X 10⁻⁸ ouncemicroliter (µL) 2.64 X 10⁻⁷ gallonmicrometer (µm) 3.94 X 10⁻⁵ inchmilligram (mg) 3.53 X 10⁻⁵ ouncemilliliter (mL) 2.64 X 10⁻⁴ gallonmilliliter per minute (mL/min) 3.38 X 10⁻² ounce per minutemillimeter (mm) 3.94 X 10⁻² inchnanogram (ng) 3.53 X 10⁻¹¹ ounce
Degree Celsius (oC) may be converted to degree Fahrenheit (oF) by using thefollowing equation:
oF = 9/5 (oC) + 32.
The following terms and abbreviations also are used in this report:
oC/min degrees Celsius per minuteGC/MS gas chromatograph/mass spectrometerID inside diameterMDL method detection limitµg/L microgram per literng/µL nanogram per microliterOD outside diameterPAH polyaromatic hydrocarbonPFTBA perfluorotributylamineR T retention timeSIM selected-ion monitoringSPE solid-phase extractionTeflon-PFA Teflon-perfluoroalkoxyTefzel-ETFE Tefzel-ethylenetetrafluoroethylene

1
METHODS OF ANALYSIS BY THE U.S. GEOLOGICAL SURVEYNATIONAL WATER QUALITY LABORATORY--
DETERMINATION OF ORGANONITROGEN HERBICIDES INWATER BY SOLID-PHASE EXTRACTION AND
CAPILLARY-COLUMN GAS CHROMATOGRAPHY/MASSSPECTROMETRY WITH SELECTED-ION MONITORING
By MARK W. SANDSTROM, DUANE S. WYDOSKI, MICHAEL P. SCHROEDER,
JANA L. ZAMBONI, and WILLIAM T. FOREMAN
ABSTRACT
A method for the isolation of organonitrogen herbicides from naturalwater samples using solid-phase extraction and analysis by capillary-columngas chromatography/mass spectrometry with selected-ion monitoring isdescribed. Water samples are filtered to remove suspended particulate matterand then are pumped through disposable solid-phase extraction cartridgescontaining octadecyl-bonded porous silica to remove the herbicides. Thecartridges are dried using carbon dioxide, and adsorbed herbicides areremoved from the cartridges by elution with 1.8 milliliters of hexane-isopropanol (3:1). Extracts of the eluants are analyzed by capillary-column gaschromatography/mass spectrometry with selected-ion monitoring of at leastthree characteristic ions. The method detection limits are dependent onsample matrix and each particular herbicide. The method detection limits,based on a 100-milliliter sample size, range from 0.02 to 0.25 microgram perliter. Recoveries averaged 80 to 115 percent for the 23 herbicides and 2metabolites in 1 reagent-water and 2 natural-water samples fortified at levelsof 0.2 and 2.0 micrograms per liter.
INTRODUCTION
Organonitrogen herbicides include some of the most widely usedagricultural pesticides (Gianessi and others, 1986). They also are the mostfrequently detected pesticides in ground water in the United States (Hallberg,1989) and Europe (Leistra and Boesten, 1989). The traditional method fordetermining residues of these herbicides in natural-water samples involves

2
liquid-liquid extraction with an organic solvent followed by analysis by gaschromatography with nitrogen-phosphorus detection, using two columns forconfirmation of herbicide identity.
Recently, methods for herbicide analysis using solid-phase extraction(SPE) as an alternative to liquid-liquid extraction have been described (Bagnatiand others, 1988; Bellar and Budde, 1988; Eichelberger and others, 1988; Junkand Richard, 1988; Battista and others, 1989; Brooks and others, 1989; DiCorciaand others, 1989; Sandstrom, 1989; Thurman and others, 1990). These SPEmethods are attractive because they are rapid, efficient, use less solvents thanliquid-liquid extraction, and consequently have lesser laboratory expenses.The SPE methods can be conducted at the field site, which enables processingof samples with labile analytes or processing samples at remote sites. Inaddition, the SPE methods can be automated by using laboratory roboticsystems that do all or part of the sample-preparation steps. Some of these SPEmethods also incorporate the use of a gas chromatograph/mass spectrometer(GC/MS) operated under full scan and in a selected-ion monitoring (SIM)mode for confirmation and quantitation of herbicides. The GC/MS is a moresensitive and more specific detector than is the nitrogen-phosphorus detector.
This report describes a method for determining organonitrogenherbicides developed by the U.S. Geological Survey for use in the Survey'sNational Water Quality Laboratory. The method incorporates SPE forremoval of the herbicides from water samples and a GC/MS operated in theSIM mode for selective confirmation and quantitation of the herbicides. Themethod supplements other methods of the U.S. Geological Survey fordetermination of organic substances in water that are described by Wershawand others (1987). The method was implemented in the National WaterQuality Laboratory in March 1991.
This report provides a detailed description of all aspects of the methodfrom sampling protocol through calculation and reporting of results.Precision and accuracy data, and method detection limits for 23 organo-nitrogen herbicides and 2 metabolites of atrazine--desethylatrazine anddesisopropylatrazine--are presented.
ANALYTICAL METHOD
Parameters: Organonitrogen herbicides, dissolved, O-1121-91(See table 1 for codes.)
1. Scope and application
This method is suitable for the determination of selected organonitrogenherbicides and metabolites in natural-water samples containing at least0.05 µg/L of each herbicide or metabolite. The method is applicable toherbicides and metabolites that are: (1) Efficiently partitioned from the water

3
phase onto an octadecyl (C-18) organic phase that is chemically bonded to asolid inorganic matrix; and (2) sufficiently volatile and thermally stable forgas chromatography. Suspended particulate matter is removed from thesamples by filtration, so this method is suitable only for dissolved-phaseherbicides and metabolites. The method was used to determine theconcentrations of the 23 herbicides and the 2 metabolites of atrazine--desethylatrazine and desisopropylatrazine--listed in table 1. The 23 herbicidesare those in the current (1991) National Water Quality Laboratory schedule1389, which includes herbicides added to the schedule as part of the U.S.Geological Survey's National Water Quality Assessment Program.
Previously completed development of the method (Sandstrom, 1989), aswell as other comparable methods (Thurman and others, 1990) served asbackground for this report. Testing of the method included adjustment ofsample volume and final extract volume to optimize recovery of theherbicides, especially the metabolites of atrazine--desethylatrazine anddesisopropylatrazine.
2. Summary of method
2.1 Water samples (100 mL) are filtered to remove suspendedparticulate matter. Glass-fiber filters with a nominal 0.7-µm pore diameter ordisposable, in-line filter units, containing a nylon membrane with a nominal0.45-µm pore diameter depending on the concentration of the suspendedparticulate matter in the water samples, are used.
2.2 Filtered water samples are pumped through disposable,polypropylene SPE cartridges containing 0.5 g of porous silica coated with aC-18 organic phase that is chemically bonded to the surface of the silica.
2.3 The SPE cartridges are dried using a gentle stream of carbon dioxideto remove interstitial water.
2.4 The adsorbed herbicides and metabolites are removed from the SPEcartridges by elution with 1.8 mL of hexane-isopropanol (3:1).
2.5 The eluant is further evaporated using a gentle stream of nitrogento a final volume of 100 µL.
2.6 Extracts of the eluant are analyzed by a capillary-column GC/MSoperated in the SIM mode.
3. Interferences
Organic compounds having gas-chromatographic retention times andcharacteristic ions with a mass identical to those of the herbicides andmetabolites of interest may interfere.

4
Table 1.--Constituent codes, laboratory codes, and Chemical AbstractsService registry numbers for method analytes
[CAS, Chemical Abstracts Service; --, no code assigned]
Herbicide ormetabolite
Constituent code Laboratorycode
CAS number
Alachlor 46342 1587 15972-60-8Ametryn 38401 1588 834-12-8Atrazine 39632 1589 1912-24-9Bromacil -- -- 314-40-9Butachlor -- -- 23184-66-9Butylate -- -- 2008-41-5Carboxin -- -- 5234-68-4Cyanazine -- 1590 21725-46-2Cycloate -- -- 1134-23-2Desethylatrazine -- 1591 6190-65-4Desisopropylatrazine -- 1592 1007-28-9Diphenamid -- -- 957-51-7Hexazinone -- -- 51235-04-2Metolachlor 39415 1593 51218-45-2Metribuzin 82360 1594 21087-64-9Prometon -- 1597 1610-18-0Prometryn -- 1598 7287-19-6Propachlor -- -- 1918-16-7Propazine 38535 1595 139-40-2Simazine -- 1596 122-34-9Simetryn -- -- 1014-70-6Terbacil -- -- 5902-51-2Terbuthylazine -- -- 5915-41-3Trifluralin -- -- 1582-09-8Vernolate -- -- 1929-77-7
4. Apparatus and equipment
4.1 The apparatus and equipment required for this method are listed asfollows; specific sources and models used during the development of thismethod also are listed, where applicable:
4.1.1 Sample containers--125-mL, amber glass bottles fitted withTeflon-lined1 screw caps.
1 The use of trade and brand names in this report is for identification
purposes only, and does not constitute endorsement by the U.S. Geological

5
4.1.2 Pipetting needles--Stainless steel, 16 gage [1.65 mm outsidediameter (OD)], blunt tip with Luer-Lok fitting, 2.54-cm long; Popper andSons, Inc.
4.1.3 Cleaning/elution module for SPE cartridges; Supelco, Inc.,Visiprep Solid Phase Extraction Vacuum Manifold and Visidry DryingAttachment or equivalent.
4.1.4 Ceramic-piston, valveless metering pump with fittings for1/8-in. OD tubing; Fluid Metering Inc., Model QSY-2 CKC or equivalent.
4.1.5 Teflon-perfluoroalkoxy (Teflon-PFA) tubing, 1/8-in OD; Cole-Parmer Instrument Co., CL-06375-01 or equivalent.
4.1.6 Tefzel-ethylenetetrafluoroethylene (Tefzel-ETFE) female Luerconnector with 1/4-28 thread, Tefzel-ETFE union with 1/4-28 thread, andTefzel-ETFE nut with 1/4-28 thread and 1/8-in. OD tubing connector;Upchurch Scientific.
4.1.7 Bottle-top solvent dispenser, 1 to 5 mL; BrinkmannDispensette.
4.1.8 Vacuum pump--Any vacuum pump with sufficient capacityto maintain a slight vacuum of 1.5 to 3 kPa in the cleaning/elution module.
4.1.9 Micropipettes--50- and 100-µL, fixed- and variable-volumemicropipettes with disposable glass capillaries; VWR Scientific.
4.1.10 Analytical balance--Any analytical balance capable ofaccurately weighing 150 g ± 0.1 g.
4.1.11 Fused-silica capillary column--Any fused-silica capillarycolumn that provides adequate resolution, capacity, accuracy, and precision.A 25-m x 0.25-mm inside diameter (ID) fused-silica capillary column coatedwith a 0.25-µm bonded film of polyphenylmethylsilicone was used; J&W, DB-5 or equivalent.
4.1.12 Evaporative concentrator; Pierce Reacti-Vap evaporator andReacti-Therm heating module or equivalent. The heat-block temperatureneeds to be maintained at 25°C.
4.1.13 GC/MS bench-top system; Hewlett-Packard, Model 5971 orequivalent.
Survey.

6
4.1.13.1 GC conditions: oven, 100°C (hold 5 minutes), andthen program to 240°C at 6°C/min, then hold for 7 minutes; injection port,240°C; carrier gas, helium; injection volume, 2 µL, splitless injection.
4.1.13.2 MS conditions: interface, 235°C; dwell time 20milliseconds; mass ions monitored are listed in table 2 (in section 8 later inthe report).
5. Reagents and consumable materials
5.1 Helium carrier gas, as contaminant free as possible (Grade 5).
5.2 Carbon dioxide gas for drying, high purity.
5.3 Nitrogen gas for evaporation, high purity.
5.4 SPE cartridges; Analytichem International, Bond-Elut No. 607313 orequivalent. The disposable cartridges are packed with 500 mg of silica coatedwith a chemically bonded C-18 hydrocarbon phase. The solid packingmaterial is held in place with stainless-steel frits.
5.5 Disposable filter units; Rainin Instrument Co., Inc., Nylon-66disposable syringe filter units or equivalent. Filters consist of a 25-mmdiameter nylon membrane, nominal 0.45-µm pore diameter, enclosed in anylon housing with Luer-Lok inlet and outlet fittings.
5.6 Glass-fiber filters (142-, 47-, or 25-mm diam.), nominal 0.7-µm porediameter (GF/F grade); Whatman, Inc.
5.7 Stainless-steel filtration units (142-, 47-, or 25-mm diam.); BaxterScientific Products.
5.8 Solvents: Hexane, isopropanol, methanol, and reagent water; B&JBrand, high-purity pesticide quality or equivalent.
5.9 Disposable glass capillaries, to fit the 50- and 100-µL, fixed- andvariable-volume micropipettes; VWR Scientific. The glass capillaries areprecleaned by baking at about 350oC for 2 hours.
5.10 Stock standard solutions. Obtain the herbicides, metabolites, andinternal standard either as pure materials from the U.S. EnvironmentalProtection Agency's Pesticide and Industrial Chemicals Repository or ascertified solutions from commercial vendors. If pure materials are obtained,prepare standard solutions by diluting 5 to 10 mg of the pure material withtoluene in a 5- or 10-mL volumetric flask.
5.11 Primary fortification and dilution standard solutions. Use theindividual stock standard solutions to prepare low-concentration (5 ng/µL)

7
and high-concentration (12.5 ng/µL) primary fortification and dilutionstandard solutions. Prepare these solutions by combining appropriatevolumes of the stock standard solutions in a 2- or 5-mL volumetric flask anddiluting with methanol. Add a 100-µL aliquot of the low-concentration orhigh-concentration solution to a 2-L water sample to obtain concentrations of0.25 or 1.25 ng/µL for the method performance-evaluation studies. Use partof the high-concentration solution to prepare the calibration solutions.
5.12 Fortification solution of the polyaromatic hydrocarbon (PAH)internal standard. Prepare a solution of phenanthrene-d10 in toluene at aconcentration of 50 ng/µL by diluting the stock standard solutions. Use partof this solution to prepare the calibration solutions. Dilute part of thissolution to 5.0 ng/µL (add 200-µL to a 2-mL volumetric flask containingwater) and use for adding to the sample eluants after nitrogen evaporation ofthe eluants to about 100 µL.
5.13 Surrogate standard solution. Prepare a solution of terbuthylazine inmethanol at a concentration between 1.0 to 2.0 ng/µL. Add this solution toeach sample prior to extraction by the SPE method (a 50-µL aliquot of thissolution added to 100 mL of the sample should result in a concentration ofbetween 0.5 to 1.0 µg/L of the surrogate).
5.14 Calibration solutions. Prepare a series of six calibration solutions inhexane-isopropanol (3:1) that contain all herbicides and metabolites atconcentrations from 0.05 to 10.0 ng/µL and the PAH internal standard at aconstant concentration of 0.25 ng/µL. Prepare these calibration solutions byappropriate dilutions of the high-concentration (12 ng/µL) primaryfortification and dilution standard solution.
6. Sampling methods, sample-collection equipment, and cleaningprocedures
6.1 Sampling methods. Use sampling methods capable of collectingwater samples that accurately represent the water-quality characteristics of thesurface water or ground water at a given time or location. Detaileddescriptions of sampling methods used by the U.S. Geological Survey forobtaining depth- and width-integrated surface-water samples are given inEdwards and Glysson (1988) and Ward and Harr (in press). Similardescriptions of sampling methods for obtaining ground-water samples aregiven in Hardy and others (1989).
6.2 Sample-collection equipment. Use sample-collection equipment,including automatic samplers, that are free of plastic tubing, gaskets, andother parts that might leach interferences into water samples or sorb theherbicides and metabolites from the water. Use refrigerated, glass samplecontainers in automatic samplers that composite samples over time.

8
6.3 Cleaning procedures. Wash all sample-collection equipment withphosphate-free detergent, rinse with distilled or tap water to remove all tracesof detergent, and finally rinse with high purity methanol (contained in aTeflon squeeze-bottle). Clean all sample-collection equipment before eachsample is collected to prevent contamination of the samples.
7. Gas chromatograph/mass spectrometer performance
7.1 Gas chromatograph performance evaluation
The gas chromatograph performance normally is indicated by peakshape and by the variation of the target-compound (herbicide or metabolite)response factors relative to response factors obtained using a new capillarycolumn and freshly prepared calibration solutions. If peak shape deterioratesor if response factors fail to meet the calibration criteria, either change theinjection liner or perform maintenance on the capillary column to bring thegas chromatograph into compliance. Part of the inlet end of the capillarycolumn can be removed to restore performance.
7.2 Mass spectrometer performance evaluation
7.2.1 Check the mass spectrometer prior to the analysis of anysamples and every 24 hours thereafter during a series of analyses to ensuremass spectrometer performance according to the perfluorotributylamine(PFTBA) criteria outlined below. In addition, initially adjust the massspectrometer to ensure that the established reporting level for each targetcompound can be achieved.
7.2.2 Tune the mass spectrometer daily using the procedure andstandard software supplied by the manufacturer. Parameters in the tuningsoftware initially optimize the resolution at masses 69, 131, 264, and 502 in thespectrum of PFTBA. Manually adjust the resolution so that the 131 and 219ions are 100 ± 20 percent, and the 414 ion is 10 ± 5 percent relative to theabundance of the 131 and 219 ions.
8. Calibration
8.1 Initial calibration data are acquired by using a new capillary columnand freshly prepared calibration solutions. These data are used in subsequentevaluation of the GC/MS performance.
8.2 Prior to the analysis of each sample set and every 24 hoursthereafter during a series of analyses, analyze and evaluate a calibrationsolution (or solutions) containing all of the target compounds to ensure thatthe GC/MS performance is in compliance with the established criteria.

9
8.3 Acquire data for each calibration solution by injecting 2 µL of eachsolution into the GC/MS according to the GC/MS conditions described inparagraph 7.2. Calculate the relative retention time for each target compoundand the surrogate compound (RRTc) in the calibration solution or in a sampleas follows:
RRTc = RTcRTi
, (1)
where RTc = uncorrected retention time of the quantitation ion of thetarget compound or surrogate compound; and
RTi = uncorrected retention time of the quantitation ion of theinternal standard (phenanthrene-d10).
8.4 Calculate a response factor (RFc) for each target compound and thesurrogate compound in each calibration solution as follows:
RFc = Ac x Ci
Cc x Ai , (2)
where Ac = GC peak area of the quantitation ion for the targetcompound or surrogate compound;
Ci = concentration of the internal standard, in nanograms permicroliter;
Cc = concentration of the target compound or surrogatecompound, in nanograms per microliter; and
Ai = GC peak area of the quantitation ion for the internalstandard.
8.5 See table 2 for the respective quantitation ions and internal-standard reference used in these calculations. Use of the quantitation ionsand internal standard specified is mandatory.
8.6 Initial calibration data acquired using a new capillary column andfresh calibration solutions are acceptable if the relative standard deviation isless than or equal to 35 percent for response factors calculated across the

10
Table 2.--Retention time, relative retention time, quantitation ion, andconfirmation ions for target compounds, surrogate compound,
and internal standard
[S, surrogate compound; IS, internal standard;m/z, mass per unit charge; --, not used]
Com- Retention Relative Quanti- Second ThirdCompound pound
type ornumber
time(minutes)
retentiontime1
tationion
(m/z)
confirm-ation ion
(m/z)
confirm-ation ion
(m/z)
Butylate 1 15.328 0.671 174 217 146Vernolate 2 15.709 .687 128 86 43Propachlor 3 19.437 .850 120 176 93Cycloate 4 19.888 .870 154 -- --Desisopropylatrazine 5 20.106 .880 158 160 91Desethylatrazine 6 20.388 .892 172 187 58Trifluralin 7 20.724 .907 306 264 335Simazine 8 21.944 .960 201 186 173Prometon 9 21.970 .961 210 225 168Atrazine 10 22.149 .969 200 215 173Propazine 11 22.312 .976 214 229 172Terbuthylazine S 22.487 .984 214 229 173Phenanthrene-d10 IS 22.86 1.000 188 -- --Terbacil 14 23.395 1.023 161 160 116Metribuzin 15 24.608 1.076 198 199 144Simetryn 16 24.973 1.092 213 198 170Ametryn 17 25.139 1.100 227 212 185Alachlor 18 25.154 1.100 160 188 237Prometryn 19 25.260 1.105 241 184 199Bromacil 20 25.891 1.133 205 207 188Metolachlor 21 26.453 1.157 162 238 146Cyanazine 22 26.534 1.161 225 198 173Diphenamid 23 27.222 1.191 167 72 239Butachlor 24 29.045 1.271 176 160 188Carboxin 25 30.2 1.321 143 235 87Hexazinone 26 34.248 1.498 171 252 128
1Relative to phenanthrene-d10 internal standard.

11
working concentration range for each target compound or surrogatecompound. Use the average response factors for the calibration-solutionrange in subsequent sample target-compound quantitation.
8.7 Subsequent daily response factors calculated for each compoundneed to agree within ± 20 percent of the average response factor for the targetcompound of interest. Analyze at least one calibration solution daily.
8.8 The latest response factors calculated can be added to prior responsefactors and a new average response factor calculated, provided the latest datameet the criteria given above and the relative standard deviation for all of theresponse-factor data is less than or equal to 35 percent.
8.9 Calibration-curve fitting routines also can be used, provided backcalculation of the calibration-standard concentration agrees within ± 20percent of the expected value.
9. Procedure
9.1 Set up the solid-phase-extraction vacuum manifold as shown infigure 1. Attach the SPE cartridges to the Luer-Lok fittings and twistcounterclockwise to open the fittings. Preclean the SPE cartridges by rinsingwith 3 mL of the elution solvent (hexane-isopropanol 3:1). Allow the solventto drain by gravity, and then completely remove all solvent from thecartridge by either nitrogen positive pressure or vacuum. The clean cartridgescan be stored in 40-mL glass vials until used.
9.2 Set up the solid-phase-extraction pumping apparatus as shown infigure 2. Rinse the Teflon-PFA tubing, pump, and in-line filter (if used) withmethanol:water (1:1). Turn on the pump, and adjust the flow rate of thepump to 20 to 25 mL/min using a graduated cylinder to measure the volumethrough the SPE cartridge. Ensure there are no leaks in any of the fittings andthat the sample bottle is vented to prevent negative pressures and bubblesfrom forming during sample pumping. If an in-line filter is used, flush all airfrom the lines before attaching the filter, otherwise air pockets will preventflow through the filter, and the connections will leak.
9.3 Immediately before sample extraction, condition a SPE cartridgewith 3 mL of methanol followed by 3 mL of reagent water by allowing thesolvents to drain through the cartridge by gravity. About 10 minutes isrequired to allow the methanol and water to drip through the cartridge.Important: The SPE cartridge bed needs to be completely covered withmethanol or water at all times once conditioning (or sampling) has begun.

12
VACUUMMANIFOLD
GAS-PRESSUREMODULE
SPE CARTRIDGES
VACUUMGAGE
VACUUMBLEED-VALVE
DRYING-GAS LINE
DRYING-GASON-OFFVALVES
UNIVERSALADAPTERS
LUER-LOKFITTINGS
Figure 1.--Solid-phase-extraction (SPE) vacuum manifold.
9.4 Weigh the sample bottle to three significant figures, and record thegross sample weight. Add the methanol conditioner (1 percent of the samplevolume) to the sample, and record the initial sample weight. Add a 50-µLaliquot of the terbuthylazine surrogate (5 ng/µL) using a micropipette with adisposable glass capillary. Swirl the sample in the bottle to thoroughlyhomogenize.
9.5 Place the inlet end of the Teflon-PFA tubing into the sample container,and turn on the pump to displace all air from the tubing. Attach the in-linefilter (optional) and then the SPE cartridge, and begin collecting the samplethat is pumped through the cartridge. Ensure that there are no leaks orsources of bubbles in the system. Small bubbles might form as the sample ispumped through the tubing, but they will not cause any problems if theyaccumulate in the pump head or filter unit. Large air bubbles are a problembecause they can displace the methanol conditioner in the cartridge.

13
CERAMIC-PISTON, VALVELESS
METERING PUMP
TUBE FITTING, 1/8-INCHTO 1/4-INCH PIPE THREAD
TUBE TO LUERUNION
(see detail below)TUBE
UNION
Tefzel-ETFE femaleluer connector
Tefzel-ETFE union(1/8-inch diameter)
Tefzel-ETFE nut
Teflon-PFA tubing(1/8-inch diameter)
1/4-28thread
SPECARTRIDGE
SAMPLECONTAINER
CONTAINER FOREXTRACTED
SAMPLE
OPTIONALIN-LINE
FILTER UNIT
Figure 2.--Solid-phase-extraction (SPE) pumping apparatus.

14
9.6 Pump all of the sample through the SPE cartridge, and turn off thepump when completed. Disconnect the cartridge from the pump system, andremove residual interstitial water with a positive pressure of air. Weigh theextracted sample collected, and record the final weight of the sampleprocessed through the cartridge. Discard the extended sample, weigh theempty sample bottle, and record the tare weight.
9.7 Rinse the pump and Teflon-PFA tubing with 50 mL methanol:water (1:1) to prepare for the next sample.
9.8 Attach a universal adapter to the large, open end of the SPEcartridge, then attach the adapter to the male Luer-Lok fitting on the gas-pressure module of the solid-phase-extraction vacuum manifold (fig. 1), andthen dry the cartridge using a positive pressure (69 kPa for 15 minutes) ofhigh purity carbon dioxide to remove all interstitial water. High puritynitrogen gas also can be used to dry the cartridge, but the necessary gaspressure and drying time will need to be determined.
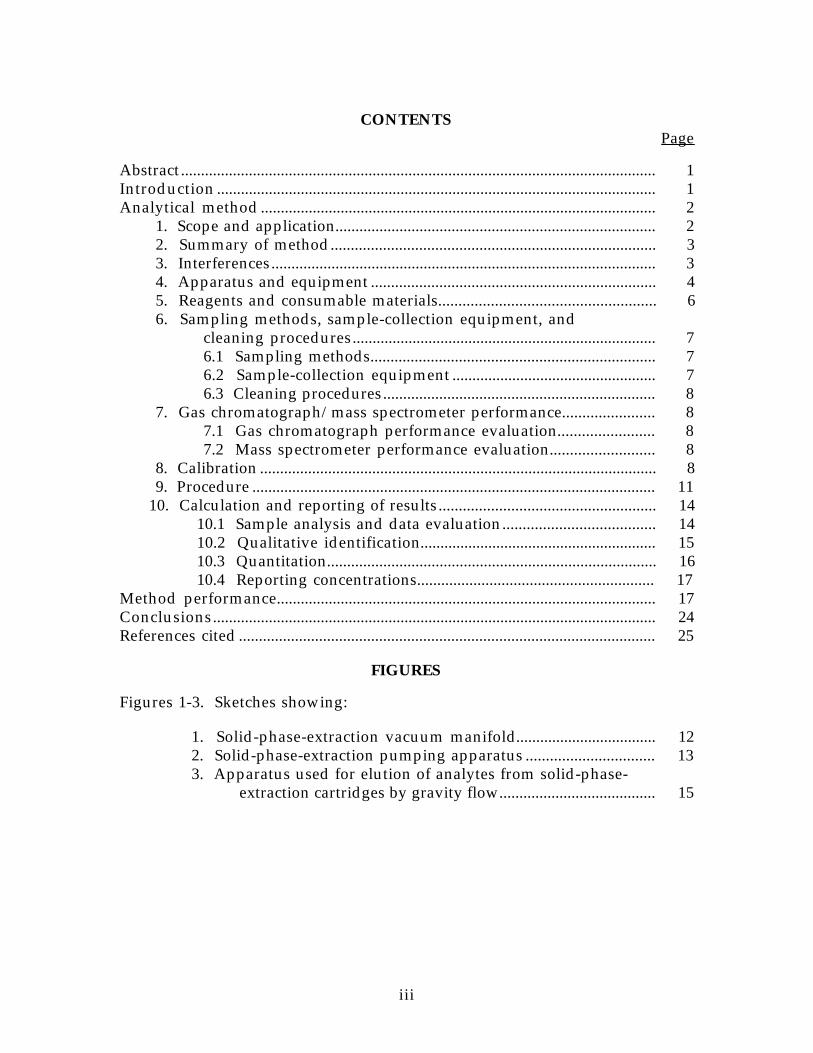
9.8.1 Elute the analytes by attaching a syringe needle to the Luer-Lok end of the SPE cartridge, positioning the needle and cartridge above a1.8-mL vial (fig. 3), and then adding 1.8 mL of the elution solvent to thecartridge and allowing the solvent to drain by gravity into the vial (about 5minutes). Air pressure (using a 50-mL glass syringe) can be used to force anyinterstitial solvent remaining in the cartridge into the vial.
9.8.2 Concentrate the eluant in the 1.8-mL vial to about 100 µLunder a gentle stream of nitrogen. At no time should the eluant be allowedto go dry, because this might result in loss of analytes. Add a 10-µL aliquot ofthe 5-ng/µL PAH internal-standard solution to the eluant, and extract 100 µLof the eluant into a 100-µL vial for GC/MS analysis.
10. Calculation and reporting of results
10.1 Sample analysis and data evaluation
Ensure that GC/MS conditions for the analysis of the targetcompounds in sample extracts are the same as those used in the analysis ofthe calibration solutions. Prior to the analysis of any sample extracts, ensurethat the PFTBA mass-spectral performance criteria have been met, and thatthe target-compound calibration data conform to the criteria in paragraph 7.2.In addition, optimize the system so the reporting level for each targetcompound can be achieved. Inject 2 µL of the sample extract and acquire datausing the GC/MS conditions described in paragraph 4.1.13.

15
1.8-milliliter vial
Stainless-steelsyringe needle,
16 gage
SPE cartridge
Vial rack
3-prong clamp
Figure 3.--Apparatus used for elution of analytes from solid-phaseextraction (SPE) cartridges by gravity flow.
10.2 Qualitative identification
10.2.1 The expected retention time (RT) of the GC peak of thequantitation ion for the target compound of interest needs to be within ± 10seconds of the expected retention time based on the RRTc obtained from theinternal-standard analysis. Calculate the expected retention time as follows:
RT = RRTc x RTi , (3)
where R T = expected retention time of the target compound or surrogatecompound;
RRTc = relative retention time of the target compound or surrogatecompound; and
RTi = uncorrected retention time of the quantitation ion of theinternal standard.

16
10.2.2 Mass-spectral verification for each target compound is doneby comparing the relative integrated abundance values of the three significantions monitored with the relative integrated abundance values obtained fromcalibration solutions analyzed by the GC/MS according to procedures given inparagraph 8. The relative ratios of the three ions need to be within ± 10percent of the relative ratios of those obtained on injection of a 1-ngcalibration solution.
10.3 Quantitation
10.3.1 If a target compound has passed the qualitative identificationcriteria above, calculate the concentration in the sample as follows:
C = Ci x Ac x 1000RFc x Ai x W , (4)
where C = concentration of the target compound or surrogatecompound in the sample, in micrograms per liter;
Ci = mass of the corresponding internal standard, in microgramsper sample;
Ac = area of the quantitation ion for the target compound orsurrogate compound identified;
RFc = factor for each target compound or surrogate compoundcalculated above;
Ai = area of the quantitation ion for the internal standard; and
W = weight of the sample extract, expressed in milliliters (1.0 g =1.0 mL).
10.3.2 The percent recovery of the surrogate compound is calculatedas follows:
R = Ci x Ac
RFc x Ai x Cs x Vs x 100 , (5)
where R = percent of recovery of the surrogate compound;
Ci = concentration of the corresponding internal standard, innanograms per sample;
Ac = area of the quantitation ion for the surrogate compound;

17
RFc = response factor for the surrogate compound;
Ai = area of the quantitation ion for the internal standard;
Cs = concentration of the surrogate compound in the surrogatestandard solution added to the sample, in nanograms permicroliter; and
Vs = volume of the surrogate standard solution added to thesample, in milliliters.
10.4 Reporting concentrations
Report concentrations of organonitrogen herbicides as follows: Ifthe concentration is less than the detection limit listed in table 2, report theconcentration as less than the detection limit; if the concentration is greaterthan the detection limit, report the concentration to two significant figures.
METHOD PERFORMANCE
A reagent-water sample, a surface-water sample collected from the SouthPlatte River in Colorado, and a ground-water sample collected in JeffersonCounty, Colo. (Arvada Well No. 14) were used to test the methodperformance. Each of the three samples was split into two subsamples. Oneset of three subsamples was fortified with 0.2 µg/L of each analyte and theother set of three subsamples was fortified with 2.0 µg/L of each analyte.Seven 100-mL aliquots of each of the six subsamples were analyzed in onelaboratory (the National Water Quality Laboratory) using one GC/MS.Accuracy and precision data from the analyses are presented in tables 3-8.
With these data, a method detection limit (MDL) was calculated for eachanalyte using the formula:
MDL = S x t (n-1, 1-alpha = 0.99), (6)
where S = standard deviation of replicate analyses (micrograms perliter) at the lowest concentration; and
n = number of replicate analyses.
t (n-1, 1-alpha = 0.99): Student's t value for the 99 percentconfidence level with n-1 degrees of freedom(Eichelberger and others, 1988).
18
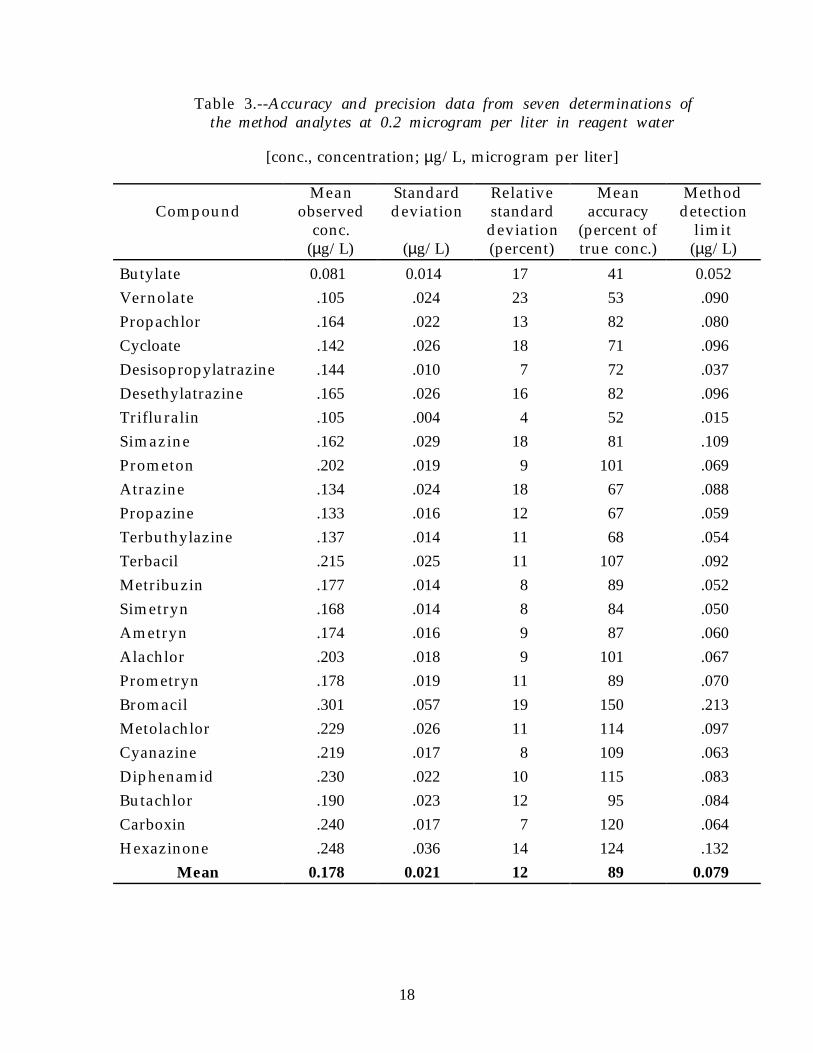
Table 3.--Accuracy and precision data from seven determinations ofthe method analytes at 0.2 microgram per liter in reagent water
[conc., concentration; µg/L, microgram per liter]
CompoundMean
observedconc.
Standarddeviation
Relativestandarddeviation
Meanaccuracy
(percent of
Methoddetection
limit(µg/L) (µg/L) (percent) true conc.) (µg/L)
Butylate 0.081 0.014 17 41 0.052Vernolate .105 .024 23 53 .090Propachlor .164 .022 13 82 .080Cycloate .142 .026 18 71 .096Desisopropylatrazine .144 .010 7 72 .037Desethylatrazine .165 .026 16 82 .096Trifluralin .105 .004 4 52 .015Simazine .162 .029 18 81 .109Prometon .202 .019 9 101 .069Atrazine .134 .024 18 67 .088Propazine .133 .016 12 67 .059Terbuthylazine .137 .014 11 68 .054Terbacil .215 .025 11 107 .092Metribuzin .177 .014 8 89 .052Simetryn .168 .014 8 84 .050Ametryn .174 .016 9 87 .060Alachlor .203 .018 9 101 .067Prometryn .178 .019 11 89 .070Bromacil .301 .057 19 150 .213Metolachlor .229 .026 11 114 .097Cyanazine .219 .017 8 109 .063Diphenamid .230 .022 10 115 .083Butachlor .190 .023 12 95 .084Carboxin .240 .017 7 120 .064Hexazinone .248 .036 14 124 .132
Mean 0.178 0.021 12 89 0.079

19
Table 4.--Accuracy and precision data from seven determinations of themethod analytes at 2.0 micrograms per liter in reagent water
[conc., concentration; µg/L, microgram per liter]
CompoundMean
observedconc.
Standarddeviation
Relativestandarddeviation
Meanaccuracy
(percent of(µg/L) (µg/L) (percent) true conc.)
Butylate 0.811 0.053 7 41Vernolate 1.107 .032 3 55Propachlor 1.470 .061 4 73Cycloate 1.338 .048 4 67Desisopropylatrazine .662 .073 11 33Desethylatrazine 1.273 .072 6 64Trifluralin .460 .045 10 23Simazine 1.250 .057 5 62Prometon 1.236 .076 6 62Atrazine 1.230 .044 4 61Propazine 1.233 .049 4 62Terbuthylazine 1.300 .037 3 65Terbacil 1.618 .174 11 81Metribuzin 1.505 .092 6 75Simetryn 1.188 .109 9 59Ametryn 1.320 .054 4 66Alachlor 1.459 .064 4 73Prometryn 1.328 .060 5 66Bromacil 1.214 .199 16 61Metolachlor 1.504 .096 6 75Cyanazine 1.207 .175 14 60Diphenamid 1.591 .093 6 80Butachlor 1.392 .078 6 70Carboxin 1.523 .116 8 76Hexazinone 1.528 .100 7 76
Mean 1.270 0.082 7 63

20
Table 5.--Accuracy and precision data from seven determinations ofthe method analytes at 0.2 microgram per liter in surface water
(South Platte River)
[conc., concentration; µg/L, microgram per liter]
CompoundMean
observedconc.
Standarddeviation
Relativestandarddeviation
Meanaccuracy
(percent of
Methoddetection
limit(µg/L) (µg/L) (percent) true conc.) (µg/L)
Butylate 0.116 0.014 12 58 0.051Vernolate .131 .026 20 66 .097Propachlor .198 .010 5 99 .036Cycloate .149 .011 8 74 .042Desisopropylatrazine .144 .005 4 72 .020Desethylatrazine .214 .052 24 107 .192Trifluralin .124 .009 7 62 .032Simazine .177 .009 5 88 .032Prometon .235 .011 5 118 .041Atrazine .151 .008 5 75 .028Propazine .147 .008 6 74 .031Terbuthylazine .156 .009 6 78 .034Terbacil .300 .014 5 150 .053Metribuzin .201 .010 5 101 .036Simetryn .189 .009 5 94 .033Ametryn .174 .009 5 87 .035Alachlor .215 .011 5 107 .042Prometryn .177 .017 10 88 .064Bromacil .375 .026 7 187 .096Metolachlor .244 .025 10 122 .093Cyanazine .282 .022 8 141 .082Diphenamid .260 .018 7 130 .066Butachlor .252 .021 8 126 .079Carboxin .260 .015 6 130 .056Hexazinone .279 .017 6 139 .062
Mean 0.206 0.015 8 103 0.057

21
Table 6.--Accuracy and precision data from seven determinations of themethod analytes at 2.0 micrograms per liter in surface water
(South Platte River)
[conc., concentration; µg/L, microgram per liter]
CompoundMean
observedconc.
Standarddeviation
Relativestandarddeviation
Meanaccuracy
(percent of(µg/L) (µg/L) (percent) true conc.)
Butylate 0.851 0.090 11 43Vernolate 1.139 .090 8 57Propachlor 1.498 .070 5 75Cycloate 1.258 .107 9 63Desisopropylatrazine .959 .107 11 48Desethylatrazine 1.365 .104 8 68Trifluralin .551 .046 8 28Simazine 1.253 .069 6 63Prometon 1.552 .081 5 78Atrazine 1.217 .072 6 61Propazine 1.207 .077 6 60Terbuthylazine 1.263 .068 5 63Terbacil 2.016 .065 3 101Metribuzin 1.602 .042 3 80Simetryn 1.394 .090 6 70Ametryn 1.361 .077 6 68Alachlor 1.433 .059 4 72Prometryn 1.333 .080 6 67Bromacil 1.590 .069 4 80Metolachlor 1.569 .066 4 78Cyanazine 1.579 .059 4 79Diphenamid 1.593 .084 5 80Butachlor 1.504 .084 6 75Carboxin 1.556 .111 7 78Hexazinone 1.745 .089 5 87
Mean 1.375 0.078 6 69

22
Table 7.--Accuracy and precision data from seven determinations of the methodanalytes at 0.2 microgram per liter in ground water
(Arvada Well No. 14)
[conc., concentration; µg/L, microgram per liter]
CompoundMean
observedconc.
Standarddeviation
Relativestandarddeviation
Meanaccuracy
(percent of
Methoddetection
limit(µg/L) (µg/L) (percent) true conc.) (µg/L)
Butylate 0.104 0.024 23 52 0.090Vernolate .141 .033 24 70 .123Propachlor .179 .026 14 90 .095Cycloate .151 .019 13 75 .072Desisopropylatrazine .145 .008 5 72 .028Desethylatrazine .153 .021 14 77 .078Trifluralin .111 .051 46 55 .188Simazine .169 .025 15 85 .093Prometon .188 .032 17 94 .118Atrazine .150 .026 17 75 .095Propazine .150 .024 16 75 .090Terbuthylazine .147 .027 18 74 .099Terbacil .252 .068 27 126 .252Metribuzin .194 .025 13 97 .095Simetryn .193 .030 16 97 .111Ametryn .190 .043 23 95 .159Alachlor .196 .024 12 98 .088Prometryn .188 .030 16 94 .112Bromacil .379 .056 15 189 .208Metolachlor .211 .028 13 106 .104Cyanazine .221 .018 8 111 .068Diphenamid .225 .041 18 113 .151Butachlor .197 .022 11 99 .082Carboxin .185 .027 15 93 .102Hexazinone .219 .033 15 109 .122
Mean 0.186 0.030 17 93 0.113

23
Table 8.--Accuracy and precision data from seven determinations of themethod analytes at 2.0 micrograms per liter in ground water
(Arvada Well No. 14)
[conc., concentration; µg/L, microgram per liter; --, not detected]
CompoundMean
observedconc.
Standarddeviation
Relativestandarddeviation
Meanaccuracy
(percent of(µg/L) (µg/L) (percent) true conc.)
Butylate 1.018 0.075 7 51Vernolate 1.159 .090 8 58Propachlor 1.518 .132 9 76Cycloate 1.330 .103 8 67Desisopropylatrazine .636 .060 9 32Desethylatrazine 1.337 .112 8 67Trifluralin .666 .112 17 33Simazine 1.331 .077 6 67Prometon 1.486 .124 8 74Atrazine 1.253 .070 6 63Propazine 1.305 .072 6 65Terbuthylazine -- -- -- --Terbacil 1.651 .101 6 83Metribuzin 1.451 .155 11 73Simetryn 1.427 .157 11 71Ametryn 1.348 .145 11 67Alachlor 1.433 .128 9 72Prometryn 1.350 .136 10 67Bromacil 1.378 .129 9 69Metolachlor 1.539 .146 10 77Cyanazine 1.219 .090 7 61Diphenamid 1.503 .160 11 75Butachlor 1.381 .150 11 69Carboxin 1.297 .141 11 65Hexazinone 1.647 .155 9 82
Mean 1.319 0.118 9 66

24
MDLs are sample-matrix and compound dependent. MDLs calculatedfor reagent water at the 0.2 µg/L concentration range from 0.015 to 0.213 µg/Land have a mean of 0.079 µg/L (table 3). For surface water (South PlatteRiver), MDLs calculated at the 0.2 µg/L concentration range from 0.020 to0.192 µg/L, and have a mean of 0.057 µg/L (table 5). For ground water(Arvada Well No. 14), MDLs calculated at the 0.2 µg/L concentration rangedfrom 0.028 to 0.252 µg/L, and have a mean of 0.113 µg/L (table 7).
The mean accuracies (recoveries) of the analytes were sample-matrix andconcentration dependent. The mean accuracy of the analytes determined at0.2 µg/L was 89 percent in reagent water (table 3), 103 percent in surface water(South Platte River) (table 5), and 93 percent in ground water (Arvada WellNo. 14) (table 7). The mean accuracies of the method analytes determined at2.0 µg/L were significantly less than at 0.2 µg/L (p < 0.001, Mann-Whitneynonparametric test for two groups). The lesser recoveries at higherconcentrations could be the result of problems with adding the 2.0 µg/Lconcentration solution mixture to the water samples. The relative con-centration of water-immiscible solvent in the 2.0-µg/L concentration solutionmixture was 69 percent, compared to 25 percent in the 0.2-µg/L samples.Solvent rinses of the sample bottles after the sample was pumped throughthe cartridge might help determine if sorption losses to the sample containerwas the cause of the lesser recoveries in the 2.0-µg/L concentration solutionmixture.
The method is ideally suited for using automated laboratory systems forsample preparation. Preliminary testing of the method, with minormodifications, has been conducted using a Waters Millilab Workstation. Themodifications included use of nitrogen, rather than carbon dioxide as a dryinggas, and use of Waters Sep-Pak cartridges, rather than the Analytichemcartridges. The results indicated no significant differences in recovery of the23 herbicides and 2 metabolites compared to the manual method described inthis report.
CONCLUSIONS
From the data presented, SPE with GC/MS in SIM is an efficient andaccurate method for determination of organonitrogen herbicides inenvironmental water samples. Recoveries averaged 80 to 115 percent for the23 herbicides and 2 metabolites in a reagent-water sample and 2 natural-watersamples fortified at levels of 0.2 and 2.0 micrograms per liter. The MDLs,based on a 100-mL sample size, range from 0.015 to 0.252 microgram per liter,and are dependent on sample matrix and specific herbicide.

25
REFERENCES CITED
Bagnati, R., Benfenati, E., Davoli, E., and Fanelli, R., 1988, Screening of 21pesticides in water by a single extraction with C-18 silica bonded phasecolumns and HRGC-MS: Chemosphere, v. 17, no. 1, p. 59-65.
Battista, Massimo, DiCorcia, Antonio, and Marchetti, Marcello, 1989,Extraction and isolation of triazine herbicides from water andvegetables by a double trap tandem system: Analytical Chemistry, v.61, no. 9, p. 935-939.
Bellar, T.A., and Budde, W.L., 1988, Determination of nonvolatile organiccompounds in aqueous environmental samples using liquidchromatography/mass spectrometry: Analytical Chemistry, v. 60,no. 19, p. 2076-2083.
Brooks, M.W., Jenkins, Jeffrey, Jimenez, Miguel, Quinn, Theresa, and Clark,J.M., 1989, Rapid method for the determination of alachlor, atrazineand metolachlor in groundwater by solid-phase extraction: Analyst, v.114, p. 405-406.
DiCorcia, Antonio, Marchetti, Marcello, and Samperi, Roberto, 1989,Extraction and isolation of phenoxy acid herbicides in environmentalwaters using two adsorbants in one minicartridge: AnalyticalChemistry, v. 61,no. 13, p. 1363-1367.
Edwards, T.K., Glysson, G.D., 1988, Field methods for measurement of fluvialsediment: U.S. Geological Survey Open-File Report 86-531, 118 p.
Eichelberger, J.W., Behymer, T.D., and Budde, W.L., 1988, Method 525--Determination of organic compounds in drinking water by liquid-solid extraction and capillary GC/MS in Methods for thedetermination of organic compounds in drinking water: Cincinnati,U.S. Environmental Protection Agency, Environmental Monitoringand Support Laboratory, p. 325-356.
Gianessi, L.P., Peskin, H.M., and Puffer, C.A., 1986, A national data base ofnonurban nonpoint source discharges and their effect on the Nation'swater quality: Report prepared for the U.S. Environmental ProtectionAgency, Office of Standards and Regulations under CooperativeAgreement CR 811858-01-0, 14 p.
Hallberg, G.R., 1989, Pesticide pollution of groundwater in the humid UnitedStates: Agriculture, Ecosystems and Environment, v. 26, p. 299-367.

26
Hardy, M.A., Leahy, P.P., and Alley, W.M., 1989, Well installation anddocumentation and ground-water sampling protocols for the pilotNational Water-Quality Assessment Program: U.S. Geological SurveyOpen-File Report 89-396, 36 p.
Junk, G.A., and Richard, J.J., 1988, Organics in water--Solid-phase extractionon a small scale: Analytical Chemistry, v. 60, no. 5, p. 451-454.
Leistra, M., and Boesten, J.J.T.I., 1989, Pesticide contamination of groundwaterin Western Europe: Agriculture, Ecosystems and Environment, v. 26,p. 369-389.
Sandstrom, M.W., 1989, Field method for isolation of herbicides in surfaceand ground water using solid-phase extraction, in Pederson, G.L. andSmith, M.M., eds., U.S. Geological Survey second national symposiumon water quality--Abstracts of the technical sessions, Orlando, Florida,November 12-17, 1989: U.S. Geological Survey Open-File Report 89-409, p. 82.
Thurman, E.M., Meyer, M.M., Pomes, M., Perry, C.E., and Schwab, A.P., 1990,Enzyme-linked immunosorbent assay compared with GC/MS for thedetermination of herbicides in water: Analytical Chemistry,v. 62, no. 18, p. 2043-2048.
Ward, J.R., and Harr, C.A., eds., in press, Methods for collection andprocessing of surface-water and bed-material samples for physical andchemical analyses: U.S. Geological Survey Techniques of Water-Resources Investigations, book 1, chap. D3.
Wershaw, R.L., Fishman, M.J., Grabbe, R.R., and Lowe, L.E., eds., 1987,Methods for the determination of organic substances in water andfluvial sediments: U.S. Geological Survey Techniques of Water-Resources Investigations, book 5, chap. A3, 80 p.