Methods for the measurement of ferrite content in ...
12
RESEARCH PAPER Methods for the measurement of ferrite content in multipass duplex stainless steel welds A. Putz 1 & M. Althuber 1 & A. Zelić 1 & E. M. Westin 2 & T. Willidal 2 & N. Enzinger 1 Received: 26 September 2018 /Accepted: 27 February 2019 /Published online: 10 April 2019 # The Author(s) 2019 Abstract The phase balance is commonly determined as a part of the duplex stainless steel (DSS) welding procedure qualification. In this work, the aim was to find a reliable, but still fast method to measure the ferrite content of DSS welds. Four methods were compared: image analysis with light optical metallography, magnetic measurements with Feritscope and Magne-Gage, and X-ray diffractometry (XRD). Image analysis with a magnification of ×500 was concluded to be most accurate on condition that the image quality was sufficiently high. The best contrast for image analysis was achieved by covering all surfaces apart from the part of interest with adhesive tape and etching the sample in a modified Beraha II solution. The Feritscope systematically underestimated the average ferrite volume fraction compared with image analysis, and a correction factor of 1.1 is suggested. Magne-Gage in turn resulted in considerably higher ferrite numbers as compared with the Feritscope and would require a correction factor of 1.18. Besides the long duration of XRD measurements, the method proved unsuitable for ferrite measurement due to the coarse texture of the microstructure. Keywords Duplex stainless steel . Ferrite measurement . Ferrite content . Image analysis . Feritscope 1 Introduction Duplex stainless steels (DSSs) combine the advantages of ferritic and austenitic stainless steels. The properties are being determined by the chemical composition and the phase bal- ance. The high chromium content and alloying with nitrogen contribute to high strength and the resistance to intergranular corrosion, and stress-corrosion cracking is better than for most austenitic grades. As compared with ferritic alloys, DSSs are more ductile, less sensitive to hydrogen embrittlement and more resistant to localized and general corrosion. The corro- sion resistance increases with the chromium, molybdenum, and nitrogen content, but high levels of chromium and molybdenum also increase the risk of formation of intermetal- lic phases at an elevated temperature [1]. While the base metal consists of approximately equal proportions of ferrite and aus- tenite, the weld metal can show a significantly wider range. When welding, the solidification is normally fully ferritic and austenite forms upon cooling [2]. The microstructure of welds can be influenced by the heat input and cooling rate, mainly by adjusting the arc energy and limit the inter-pass temperature to 100–150 °C. Although preheating is rarely applied for welding DSS, it might be necessary if the plates are very thick and/or heavily restrained to reduce cooling rates and stress levels. If the temperature is lower than room temperature, preheating up to 50–80 °C can be performed to guarantee dry joint surfaces. The weld metal chemical composition, however, has the largest influence on the final microstructure. This is in turn a function of the composition of the steel grade, filler metal, and shielding gas. The joint preparation affects the dilution from the base material. A final post-weld heat treat- ment dissolves intermetallic phases, and the austenite content increases, but is for practical reasons rarely used in practice [3]. Filler metals for DSS are mainly of matching composition or slightly over-alloyed compared with the base material to compensate element loss and segregation in the weld metal. Recommended for publication by Commission IX - Behaviour of Metals Subjected to Welding * A. Putz [email protected] 1 Institute of Materials Science Joining and Forming, Graz University of Technology, Kopernikusgasse, 24, 8010 Graz, Austria 2 voestalpine Böhler Welding Austria GmbH, Böhler-Welding-St. 1, 8605 Kapfenberg, Austria Welding in the World (2019) 63:1075–1086 https://doi.org/10.1007/s40194-019-00721-4
Transcript of Methods for the measurement of ferrite content in ...

RESEARCH PAPER
Methods for the measurement of ferrite content in multipass duplexstainless steel welds
A. Putz1 & M. Althuber1 & A. Zelić1 & E. M. Westin2& T. Willidal2 & N. Enzinger1
Received: 26 September 2018 /Accepted: 27 February 2019 /Published online: 10 April 2019# The Author(s) 2019
AbstractThe phase balance is commonly determined as a part of the duplex stainless steel (DSS) welding procedure qualification. In thiswork, the aim was to find a reliable, but still fast method to measure the ferrite content of DSS welds. Four methods werecompared: image analysis with light optical metallography, magnetic measurements with Feritscope andMagne-Gage, and X-raydiffractometry (XRD). Image analysis with a magnification of ×500 was concluded to be most accurate on condition that theimage quality was sufficiently high. The best contrast for image analysis was achieved by covering all surfaces apart from the partof interest with adhesive tape and etching the sample in a modified Beraha II solution. The Feritscope systematicallyunderestimated the average ferrite volume fraction compared with image analysis, and a correction factor of 1.1 is suggested.Magne-Gage in turn resulted in considerably higher ferrite numbers as compared with the Feritscope and would require acorrection factor of 1.18. Besides the long duration of XRDmeasurements, the method proved unsuitable for ferrite measurementdue to the coarse texture of the microstructure.
Keywords Duplex stainless steel . Ferrite measurement . Ferrite content . Image analysis . Feritscope
1 Introduction
Duplex stainless steels (DSSs) combine the advantages offerritic and austenitic stainless steels. The properties are beingdetermined by the chemical composition and the phase bal-ance. The high chromium content and alloying with nitrogencontribute to high strength and the resistance to intergranularcorrosion, and stress-corrosion cracking is better than for mostaustenitic grades. As compared with ferritic alloys, DSSs aremore ductile, less sensitive to hydrogen embrittlement andmore resistant to localized and general corrosion. The corro-sion resistance increases with the chromium, molybdenum,and nitrogen content, but high levels of chromium and
molybdenum also increase the risk of formation of intermetal-lic phases at an elevated temperature [1]. While the base metalconsists of approximately equal proportions of ferrite and aus-tenite, the weld metal can show a significantly wider range.When welding, the solidification is normally fully ferritic andaustenite forms upon cooling [2]. The microstructure of weldscan be influenced by the heat input and cooling rate, mainly byadjusting the arc energy and limit the inter-pass temperature to100–150 °C. Although preheating is rarely applied forwelding DSS, it might be necessary if the plates are very thickand/or heavily restrained to reduce cooling rates and stresslevels. If the temperature is lower than room temperature,preheating up to 50–80 °C can be performed to guaranteedry joint surfaces. The weld metal chemical composition,however, has the largest influence on the final microstructure.This is in turn a function of the composition of the steel grade,filler metal, and shielding gas. The joint preparation affects thedilution from the base material. A final post-weld heat treat-ment dissolves intermetallic phases, and the austenite contentincreases, but is for practical reasons rarely used in practice[3].
Filler metals for DSS are mainly of matching compositionor slightly over-alloyed compared with the base material tocompensate element loss and segregation in the weld metal.
Recommended for publication by Commission IX - Behaviour of MetalsSubjected to Welding
* A. [email protected]
1 Institute of Materials Science Joining and Forming, Graz Universityof Technology, Kopernikusgasse, 24, 8010 Graz, Austria
2 voestalpine Böhler Welding Austria GmbH, Böhler-Welding-St. 1,8605 Kapfenberg, Austria
Welding in the World (2019) 63:1075–1086https://doi.org/10.1007/s40194-019-00721-4

To ensure sufficient austenite formation, however, the speciallydeveloped fillers are over-alloyed by 2–4% with nickel [4]. Inthe case of multilayer welding, this means that the nickel con-tent in the subsequent weld beads increases and more austenitecan be formed. Another effect of multilayer welding is theformation of secondary austenite due to reheating by deposi-tion of subsequent beads [5]. Welding without filler material isnot recommended as this can lead to a primarily ferritic weldmetal with lower pitting resistance and impact toughness [6].The use of austenitic fillers, on the other hand, can change thesolidification mode to ferritic-austenitic, which can lead tolower strength and resistance to stress-corrosion cracking [7].Duplex alloys are not often subject to any form of cracking, butwith partly austenitic solidification or very high austenitelevels, there is an increased risk of solidification cracking [8].
The mechanical properties and corrosion resistance are re-lated to the duplex microstructure, and therefore, the ferritecontent is important and sometimes specified. Some industryspecifications, such as NORSOK M-601 [9], set the limit forthe base material at 40–60% ferrite and 35–65% for welds,while others state 30–70%. The microstructure is not a prop-erty itself, but an unbalanced ferrite/austenite ratio may causeinadequate mechanical and corrosion properties, and there-fore, requires further investigations.
Based on the base material and filler metal composition, itis possible to make a rough estimation of the ferrite content inthe weld metal. Alongside with the somewhat outdatedSchaeffler diagram [10] and DeLong diagram [11], theWRC1992 diagram [12] is considered to be most appropriateto predict the amount of ferrite in DSSs [13]. The calculatedchemical composition of the weld deposit is divided into theCr and Ni equivalents, and the ferrite number FN can be foundin the diagram. Since the nickel contents in the base materialand filler metal differ, the amount of diluted base material iscrucial for the final weld metal composition. Another weak-ness is that element loss due to evaporation from the filler andweld metal, depending on the arc energy and shielding gascomposition, is not taken into account. Both cases would re-quire an analysis of the actual weld metal deposit to get theexact composition. In addition, important factors such ascooling rate and reheating of passes are not taken into accountand the prediction may not be accurate.
The ferrite content can be measured by magnetic methods,quantitative metallography like for example planimetry, linealanalysis, or differential point counting [14] or by differentmethods using electron diffraction such as X-ray diffractom-etry (XRD) or electron backscatter diffraction (EBSD). AsXRD, EBSD and manual counting in accordance withASTM E 562 [6] are rather time-consuming and thus fairlyexpensive; image analysis and magnetic measurements withFeritscope are more frequently used.
In image analysis, the fraction of each phase ismeasured onetched samples in high magnification using a light optical
microscope with special software. This is considered to beone of the most accurate techniques [15, 16] and together withpoint counting, usually the only method accepted when devel-oping welding procedure specifications. The precision, how-ever, is dependent on the surface quality of the sample;scratches and limited etch quality are influencing the finalresult. As mentioned in ASTM E 562, the magnificationshould be sufficiently high to clearly resolve the microstruc-ture. As the magnification is increased, the field area de-creases, and the field-to-field variability increases. This re-quires a greater number of fields, but at the same time, higherresolution means that small fractions of, for instance, second-ary austenite is included in the measurement for better accu-racy. For duplex welds, the magnification is often set to ×500and small welds may even require ×1000. When examininglarge amounts of specimens, this is a rather a time-consumingoperation.
Image analysis requires skilled operators and highly devel-oped microscopes and software, and the special polishing andetching procedure make the method quite ineffective.Magnetic measurements are thus often an attractive alterna-tive. A Feritscope uses the principle of magnetic induction forferrite measurement and measures all magnetic components inthe otherwise non-magnetic structure. On the field, Feritscopemay be the only practical possibility of being a non-destructive method.Magne-Gagemeasures, by use of a spiralspring, the force which is necessary to remove a permanentmagnet from the surface of a specimen. The ferrite numbercan be calculated according to the previous calibration using aprimary set of standards [17]. The Magne-Gage instrumenthas in many laboratories been replaced by the Feritscope buthas historically played an important role for ferrite measure-ments. Many of the weld metal standards used today to cali-brate instruments such as the Feritscope have been producedand assigned an FN using a Magne-Gage. Another quantita-tive method to determine the relative amounts of ferrite inDSS is X-ray diffractometry (XRD) by measuring the peakpositions and intensity of deflected X-rays which are particu-lar for a specific crystalline phase and its weight fraction [18].
The aim of this work was to find a reliable method tomeasure the ferrite content of multipass 22Cr duplex welds,which is fast but still as accurate as possible. Different ways todetermine the ferrite fraction are evaluated.
2 Experimental
The base material was 30-mm-thick 22Cr duplex stainless1.4462/UNS S32205 with the composition given in Table 1.Double fillet welds were welded with the flux-cored arcwelding (FCAW) process in PB/2F position. The vertical platehad a bevel angle of 55° and 50° and both plates got clampedfirmly. The T-joint preparation is shown in Fig. 1.
1076 Weld World (2019) 63:1075–1086

The filler metal was a flux-cored wire of T 22 9 3 N L R/E2209T0 type (Table 2). The welding parameters were set toachieve spray arc transfer and to keep the arc energy at 1 5 kJ/mm (Table 3). One hundred percent CO2 was used asshielding gas and the inter-pass temperature was kept below150 °C.
For this work, three specimens with one, two, and threelayers were investigated. To be able to study these separately,the experimental setup was selected to vary the weld length.The first pass, the root, was as long as the base plate(320 mm). Every following layer was shortened by a quarterof the previous layer.
Cross-sections were cut and embedded with epoxy hotmounting resin. The detailed procedure for grinding andpolishing is summarized in Table 4.
As the most important factor for image analysis is highcontrast, different etchants such as Beraha II, Murakami,V2A, Lichtenegger+Bloech, oxalic acid, sodium hydroxidesolution, and KOH were applied on polished base metalcross-sections. The selection of these etchants was based onthe work by Petzow [19].
Ferrite measurement of welds was performed at a magnifi-cation of ×500 as recommended for point counting method in
ASTM E562 [20]. Each weld bead was divided intofive areas, and for each area, five pictures were takenin a light optical microscope—a total of 25 images perweld bead. The ferrite content was measured based onthe phase fractions using the software AxioVision fromZeiss. The software counts all Bdark^ pixels, which areferrite when etched with Beraha II. If the polishing andetching are not perfect, the threshold can be adjustedmanually or scratches can be painted over with the cor-rect color. Hence, there might be an influence of theuser’s judgment. To investigate such possible influenceof different users, two different operators were indepen-dently examining the same samples.
Measurements by Feritscope were performed on the cross-sections prepared for image analysis using a FischerFeritscope FMP30. For each bead, five different points weremeasured and reported as percent ferrite (% ferrite) as well asferrite number (FN).
Measurements by Magne-Gage were also made indi-vidually for each bead. These measurements were re-peated five times at the same point. Since the size ofthe probe was about the size of the bead itself, theentire bead is measured at once and not a specific areawithin a bead. Measurements were performed for thesample with one layer/one bead and two layers/threebeads. As the second layer of the sample with threelayers/six beads was somehow too small for the rela-tively large size of the probe, it was not possible toinvestigate the single-weld beads for this sampleseparately.
X-ray diffraction analysis was performed on five differentmeasuring points only on the cross-section with one layer/onebead and made on XRD data from a Discover (Bruker), Cu-Kα radiation (1.54 Å) with a LynxEye position-sensitive de-tector. Data was analyzed with the Rietveld method using theprogram Topas version 4 (Bruker). The data was collectedbetween 47.5–93° 2θ. In this range, austenite Bragg peakswith hkl 200, 220, and 311 and Bragg peaks with 200 and211 can be found if present.
Fig. 1 Joint preparation
Table 1 Chemical composition of DSS base material 1.4462/UNSS32205, wt%
C Si Mn Cr Ni Mo N
0.022 0.3 1.8 22.8 4.6 2.5 0.20
Table 2 Chemical composition of DSS flux-cored wire all-weld metal,wt%
C Si Mn Cr Ni Mo N
0.030 0.9 0.6 22.7 9.0 3.15 0.135
Table 3 Welding parameters
VoltageV
CurrentA
Welding speedm/min
Arc energykJ/mm
Wire feedingm/min
Polarity
29 230 0.27 1.48 14 DC+
Weld World (2019) 63:1075–1086 1077

3 Results
Although all applied etchants revealed the microstructure(Fig. 2), the best contrast was achieved using Beraha II, and
therefore, this etchant was selected to be used for all weldedspecimens in this work.
Without elucidating the microstructure properly, it was notpossible to make reliable measurements. Despite the high
Table 4 Preparation of stainlesssteel for image analysis Step Grinding 1 Grinding 2 Polishing 1 Polishing 1
Surface SiC paper 1200 MD – Largo MD – Dac MD – Chem
Suspension Water Dia Pro Largo 9 Dia Pro Dac 3 OPS
Rotation speed, rpm 300 150 150 150
Force/specimen, N 25 40 20 15
Time, min As needed 5 4 3
g
a
c
e
b
d
f
Fig. 2 Base material DSS etchedusing. a Beraha II: Ferrite dark,austenite bright. b Murakami:Ferrite brown, austenite white. cV2A: Ferrite light gray, austenitedark gray. d Lichtenegger+Bloech: Ferrite light blue,austenite white. e Oxalic acid:Ferrite dark gray, austenite lightgray. f NaOH: Ferrite blue,austenite yellow. g KOH: Ferritedark, austenite bright
1078 Weld World (2019) 63:1075–1086

contrast on the base material, the surface quality of weldsusing Beraha II was not satisfactory (Fig. 3a). When two dif-ferent operators measured the average ferrite content of sam-ples with improper etching, unevenly etched parts were falselycounted as austenite and the scatter was fairly large.Comparing the results for Fig. 3a, user 1 measured a ferritecontent of 42%, while user 2 measured only 33%. For thisreason, the etching procedure needed to be improved. The firstadjustment was to reduce the amount of potassiummetabisulfite to max. 0.5 g per 100 ml stock solution(Table 5). The second improvement was to etch the layersseparately by covering all the unobserved areas with adhesivetape. This increased the image quality substantially (Fig. 3b).The difference in average value and standard deviation withimproper and proper etching can be seen in Fig. 4.
With proper etching, the images could be evaluated by thesoftware, the average ferrite content and the standard devia-tion for each area (Fig. 5), each weld bead, and the total weldcan be calculated. Figure 6 shows the average ferrite contentand standard deviation for the specimen with two layers/threebeads for each local area (Fig. 6a), weld bead (Fig. 6b), andtotal weld (Fig. 6c).
As 25 images for every weld bead is fairly time-consumingfor multipass welds, attempts were made to optimize the mea-surements. A first effort by reducing the magnification to ×50and taking fewer pictures was not effective as the resolutionwas insufficient to capture the small details. As shown in Fig.6, the values deviated and there was an inconsistency betweenthe two operators. Using a magnification of ×50 the first op-erator systematically underestimated the ferrite content, whilethe second consistently overestimated the ferrite content com-pared with the results using a magnification of ×500 (Fig. 7).
Since the high magnification must be maintained, the sec-ond variable, the number of images, was reduced. One image
was randomly picked out of each area, and the average ferritecontent was calculated again. This procedure was repeatedfive times to generate one image per area. Figure 8 showsthe results from the optimized procedure as compared withthe original method. The average ferrite content and standarddeviation indicate that the results with the optimized methodwere within the standard deviation of the original method.
With the chosen procedure of image analysis, the evolutionof ferrite content per weld bead can be viewed in detail in Fig. 9.
The results of the measurements by Feritscope are shownas ferrite content in percentage (% ferrite) in Fig. 10 and asferrite number (FN) in Fig. 11. The standard deviation for thesingle beads was 1–4% ferrite when measurements were per-formed in percent ferrite and 2–5 FNwhen ferrite number wasmeasured.
Figure 12 shows the results from the Magne-Gage mea-surements in FN. The standard deviation of the repeated mea-surements for the single beads was about 1–8 FN.
Table 6 summarizes the measurements performed withXRD. The diffraction patterns showed heavy texturation,and this was accounted for using a spherical harmonics func-tion when refining the data. Very little or no ferrite was mea-sured for the first four samples (0–7%), while the last sampleshowed 43%.
4 Discussion
The difference in etching quality between the base materialand the welded joints can possibly be explained by the differ-ence in element distribution and variation in microstructure[8].Most etching procedures have been developed for the basemetal where the ferrite stabilizing elements are more concen-trated in the ferrite and the austenite stabilizing elements in theaustenite. In the weld metal, the nickel content is significantlyhigher due to the addition of filler metal, and the microstruc-ture is primarily controlled by the distribution of nitrogen [21].When etching the base material, there is only one type ofmicrostructure present, while a welded sample contains basematerial, weld metal, and the heat-affected zone. In addition,there may be oxides and slag present in the weld cross-section.When etching a cross-section consisting of the base material,
a bFig. 3 a Inadequate and badequate etching for imageanalysis after changing theetching procedure
Table 5 Modified Beraha II
Stock solution Distilled water 800 ml
Hydrochloride acid 400 ml
Ammonium bifluoride 48 g
Add to 100 ml of stock solution Potassium metabisulfite 0.5 g
Weld World (2019) 63:1075–1086 1079

heat-affected zone, and weld metal, the result may thus beuneven as preferential etching may take place in the basematerial first and change the redox potential in the chemical
solution. This problem can be solved by sealing off all otherareas using adhesive tape. Then, only the area in focus will beetched and hence the quality increases.
Fig. 4 Average ferrite contentusing image analysis on sampleswith inadequate and adequateetching
Fig. 5 Average ferrite content per local area with five images per area for all cross-sections
a b c
Fig. 6 Average ferrite content and standard deviation for each a local area, b weld bead, and c total weld
1080 Weld World (2019) 63:1075–1086

0
10
20
30
40
50
60
70
80
90
100
Bead 1 Bead 2 Bead 3 WeldF
errite c
onte
nt
in %
500x User 1 50x User 2 50x
Fig. 7 Comparison of ferritecontent for a specimen with twolayers = three beads ofmagnification ×500 vs. ×50 fortwo different operators, user 1 vs.user 2
0
10
20
30
40
50
60
70
80
90
100
1 layer = 1 bead 2 layers = 3 beads 3 layers = 6 beads
Ferrite c
onte
nt
in %
25 images randomly chosen 5 images
Fig. 8 Comparison of measuredaverage ferrite content between25 images vs. randomlydistributed five images per bead
Fig. 9 Evolution of ferrite contentmeasured using image analysis
Weld World (2019) 63:1075–1086 1081

The main advantage of image analysis is that there is addi-tional photo evidence of themicrostructure that can easily givea rough impression of the phase balance and be used in re-ports. On the other hand, the ferrite fraction might beoverestimated since possible secondary austenite, which is
finely distributed in the ferritic matrix of previous beads andforms during multipass welding, will not be etched properlyand therefore not detected. This disadvantage could possiblybe counteracted by using a higher magnification, but thiswould also mean a higher effort.
1 layer = 1 bead
2 layers = 3 beads
3 layers = 6 beads0
10
20
30
40
50
60
70
80
90
100
12
34
56
5348
4349
4642
4138
36
47
Ferrite c
onte
nt
in %
Weld bead
1 layer = 1 bead 2 layers = 3 beads 3 layers = 6 beads
Fig. 10 Evolution of ferritecontent in % ferrite measuredusing Feritscope
1 layer = 1 bead
2 layers = 3 beads
3 layers = 6 beads0
20
40
60
80
100
120
140
12
34
56
74 61
55 63
5853
4944 45
62
Fe
rrite
Nu
mb
er F
N
Weld bead
1 layer = 1 bead 2 layers = 3 beads 3 layers = 6 beads
Fig. 11 Evolution of ferritecontent in FN measured usingFeritscope
1 layer = 1 bead
2 layers = 3 beads
0
20
40
60
80
100
120
140
1
2
3
8774
66 73
Ferrite n
um
ber F
N
Weld bead
1 layer = 1 bead 2 layers = 3 beads
Fig. 12 Evolution of ferritecontent in FN measured usingMagne-Gage
1082 Weld World (2019) 63:1075–1086

Figure 13 shows the ferrite content in % ferrite of all threespecimens measured by image analysis as compared with theFeritscope readings. The Feritscope values were systematical-ly lower than that in image analysis. Multiplying theFeritscope results with a factor of 1.1, however, gives roughlythe same result as with image analysis. This is in agreementwith the work by Hosseini et al. [22] on superduplex stainlesssteel welds. The highest deviation can be observed for thesample with three layers/six beads which is up to 20%. Thisis possibly related to the higher fraction of secondary austeniteformed in multipass welds.
Another possible explanation for this deviation might bethe internal calculation of the device from ferrite number to %ferrite (Fig. 14). The measurement is determined in ferritenumber (FN), then computed according to Fischer’s in-house conversion relationship and displayed as percent ferrite.It is known that this converted ferrite measurement shows anuncertainty of ± 16% of the measurement, as indicated by thegray area above and below the conversion curve [23].
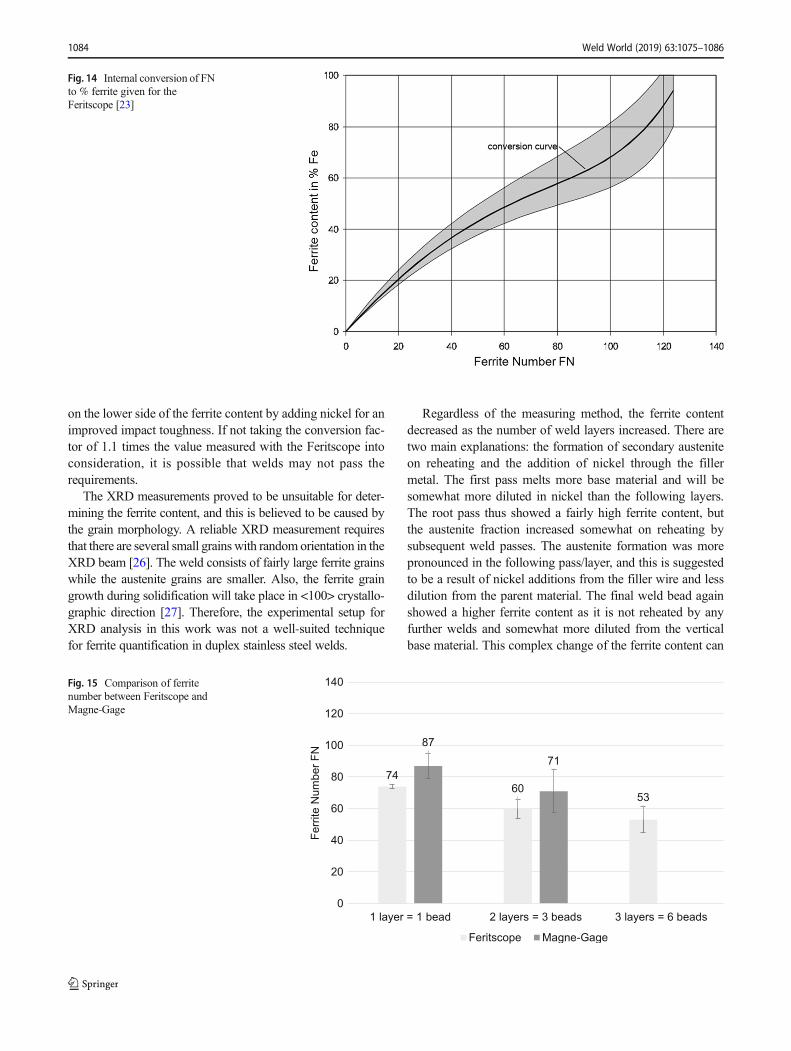
The ferrite number FNmeasured by Feritscope andMagne-Gage is shown in Fig. 15. In terms of ferrite number, theMagne-Gage instrument showed higher results comparedwithmeasurements with Feritscope for the samples with one layer/one bead and two layers/three beads. Multiplying the ferritenumber using the Feritscope by a factor of 1.18 gives roughlythe same values as with Magne-Gage. The ferrite number
measured by Magne-Gage of the sample with three layers/six beads is not considered as the probe size was too largefor the size of the single-weld beads.
The deviation may be explained by the calibration of theMagne-Gage. The calibration curve for FN > 60 showed someslight bend for higher dial readings. Hence, the assigned linearregression equation resulted in somewhat too high ferritenumbers and also a higher standard deviation. Apart fromthe difficulty to properly calibrate the particular instrumentused in this investigation and finding an experienced operator,another problem is that the size, shape, and orientation offerrite particles affect the readings of the Magne-Gage [24].Although Magne-Gage is the only instrument which can becalibrated to primary standards, another disadvantage is therelatively large size of the probe and therefore its limited spa-tial resolution compared with other methods. While the stan-dard deviation of image analysis and Feritscope is a matter ofthe different ferrite contents within a single bead, the standarddeviation of the Magne-Gage measurements is due to its poorreproducibility. Here, the absence of an experienced operatorprobably played a significant role. Although there are plentyof results showing that a well-calibratedMagne-Gage, used byan experienced operator does not give a large standard devia-tion, the instrument is not the quickest and easiest method touse.
The best agreement in the results was observed for theimage analysis and the Feritscope for the samples with onelayer/one bead and two layers/three beads. Still, the Feritscopevalues are systematically lower than the results of image anal-ysis. The Feritscope analyzes approximately a volume of10 mm3. Therefore, a minimum dimension of the sampleand a certain distance from the probe to the edge of the sampleis necessary. If this requirement is not given, a drop in themeasured FN values will occur. This is known as the edgeeffect [25]. Manufacturers of duplex filler metals prefer to be
Table 6 Results of theXRD measurements forthe sample with onelayer/one bead
Measurement % ferrite
01 0
02 1
03 0
04 7
05 43
59
50 49
53
4641
0
10
20
30
40
50
60
70
80
90
100
1 layer = 1 bead 2 layers = 3 beads 3 layers = 6 beads
Ferrite c
onte
nt
in %
image analysis Feritscope
Fig. 13 Comparison of ferritecontent between image analysis(magnification ×500) andFeritscope
Weld World (2019) 63:1075–1086 1083
on the lower side of the ferrite content by adding nickel for animproved impact toughness. If not taking the conversion fac-tor of 1.1 times the value measured with the Feritscope intoconsideration, it is possible that welds may not pass therequirements.
The XRD measurements proved to be unsuitable for deter-mining the ferrite content, and this is believed to be caused bythe grain morphology. A reliable XRD measurement requiresthat there are several small grains with random orientation in theXRD beam [26]. The weld consists of fairly large ferrite grainswhile the austenite grains are smaller. Also, the ferrite graingrowth during solidification will take place in <100> crystallo-graphic direction [27]. Therefore, the experimental setup forXRD analysis in this work was not a well-suited techniquefor ferrite quantification in duplex stainless steel welds.
Regardless of the measuring method, the ferrite contentdecreased as the number of weld layers increased. There aretwo main explanations: the formation of secondary austeniteon reheating and the addition of nickel through the fillermetal. The first pass melts more base material and will besomewhat more diluted in nickel than the following layers.The root pass thus showed a fairly high ferrite content, butthe austenite fraction increased somewhat on reheating bysubsequent weld passes. The austenite formation was morepronounced in the following pass/layer, and this is suggestedto be a result of nickel additions from the filler wire and lessdilution from the parent material. The final weld bead againshowed a higher ferrite content as it is not reheated by anyfurther welds and somewhat more diluted from the verticalbase material. This complex change of the ferrite content can
Fig. 14 Internal conversion of FNto % ferrite given for theFeritscope [23]
74
6053
87
71
0
20
40
60
80
100
120
140
1 layer = 1 bead 2 layers = 3 beads 3 layers = 6 beads
Fe
rrite
Nu
mbe
r F
N
Feritscope Magne-Gage
Fig. 15 Comparison of ferritenumber between Feritscope andMagne-Gage
1084 Weld World (2019) 63:1075–1086

be observed in Fig. 5. The variation of ferrite content withineach bead can be significant.
It is known that the use of pure CO2 as shielding gas maylead to somewhat higher weld metal austenite content [28].Worst case, this can lead to a phase balance outside the spec-ification and affects the mechanical properties. For the partic-ular flux-cored wire in the examined multipass welds, theaverage ferrite content was 54 ± 5% according to image anal-ysis. This is within the stricter 35–65% limit set for the phaseanalysis in NORSOK M-601 [9] and thus fulfills most indus-try specifications.
5 Conclusions
The effect of multipass welding on the ferrite content wasinvestigated for a 22Cr duplex stainless steel welded with amatching flux-cored arc wire over-alloyed in nickel. Four dif-ferent methods were used to determine the phase balance:image analysis, Feritscope, Magne-Gage, and XRD. The fol-lowing conclusions could be drawn:
– Among the typically recommended etchants, modifiedBeraha II proved most suitable for this material combina-tion for image analysis.
– In addition to the advantage of having an actual image forreporting and for comparison, image analysis is consid-ered to be the most accurate method for measuring theweld metal ferrite content.
– The highest surface quality with most uniform etchingwas obtained when covering all surfaces that were notexamined with an adhesive tape.
– It was possible to optimize the time for determining theferrite content by reducing the number of measurementsfrom five images to one per area of interest and still hav-ing a comparable mean value and standard deviation.
– The Feritscope is designed to measure ferrite numbers,and a conversion curve is used to change the values intopercent ferrite. Compared with image analysis, the per-cent ferrite will be approximately 10% lower comparedwith image analysis and a correction factor of 1.1 issuggested.
– Although the XRD technique is a well-knownmethod formeasurement of different fractions in structures, theacclaimed method was not suitable for measuring the fer-rite content of these DSS welds.
– In this study, the Magne-Gage instrument showed higherferrite numbers and a larger standard deviation than theFeritscope and a correction factor of 1.18 is suggested.
– The limitations of the individual methods should be con-sidered carefully if the measured ferrite content is close tothe limit of the specification and especially whenmultipass welding.
Acknowledgments Open access funding provided by Graz University ofTechnology. The authors would like to thank Ing. Andrea Maderthoner(voestalpine Böhler Welding Austria GmbH) for her provided knowledgeabout welding of DSS and the chemical analysis, Prof. Leif Karlsson(University West) and Martin Jernberg (ESAB AB) for providing theMagne-Gage device, and Dr. Sten Wessman and Dr. Fredrik Lindberg(Swerim AB) for performing the XRD measurements.
Funding information Recommended for publication by Commission IX- Behaviour of Metals Subjected to Welding.
Open Access This article is distributed under the terms of the CreativeCommons At t r ibut ion 4 .0 In te rna t ional License (h t tp : / /creativecommons.org/licenses/by/4.0/), which permits unrestricted use,distribution, and reproduction in any medium, provided you give appro-priate credit to the original author(s) and the source, provide a link to theCreative Commons license, and indicate if changes were made.
References
1. Gunn RN (1997) Duplex stainless steels: microstructure, propertiesand applications. Woodhead Publishing Ltd., Cambridge, England.216pp
2. Knyazeva M, Pohl M (2013) Duplex steels: part I: genesis, forma-tion, structure. Metallography, Microstrucutre and Analysis 2:113–121. https://doi.org/10.1007/s13632-013-0066-8
3. Karlsson L (2000) Welding of stainless steels. Duplex andsuperduplex steels. Weld Int 14:5–11. https://doi.org/10.1080/09507110009549131
4. Holmberg (1997) How to performwelding in duplex stainless steelsto obtain optimumweld metal properties. Stainless SteelWorld 9:2:28–33 / ACOM 13:3:1–7
5. Valiente Bermejo MA, Eyzop D, Karlsson L, Svensson L-E, HurtigK (2017) Influence of multi-pass welding on the microstructure andproperties of superduplex stainless steels. IIW Doc IX-2607-17 /IX-H-844-17. 43pp
6. Tamaki K, Yasuda K, Kimura M (1989) Corrosion performance ofgirth weld joints of duplex stainless steels. Corrosion 45:764–770
7. Verma J, Taiwade RV, Sonkusare R (2017) Effects of austenitic andduplex electrodes on microstructure, mechanical properties, pitting,and galvanic corrosion resistance of ferritic and dual-phase stainlesssteel dissimilar joints. J Mater Res 32:3066–3077. https://doi.org/10.1557/jmr.2017.269
8. Varol I, Baeslack WA, Lippold JC (1989) Characterization of weldsolidification cracking in a duplex stainless steel. Metallography 23:1–19. https://doi.org/10.1016/0026-0800(89)90037-2
9. Standards Norway (2008) Norsok standard M-601 welding andinspection of piping. Lysaker, Norway. 24pp
10. Schaeffler A (1949) Constitution diagram for stainless steel weldmetal. Metal Progress 56:680
11. Delong WT (1974) Ferrite in austenitic stainless steel weld metal.Weld J 53(7):273s–286s
12. Kotecki DJ, Siewert TA (1992) WRC-1992 constitution diagramfor stainless steel weld metals: a modification of the WRC-1988diagram. Welding Research Supplement:171–178. https://doi.org/10.1007/978-1-61779-582-4
13. Kotecki D, Siewert TA (1993) A new constitution diagram forpredicting ferrite content of stainless steel weld metals. Mater Des14:345–348. https://doi.org/10.1016/0261-3069(93)90110-H
14. Vander Voort G.F. (1999) Metallography: principles and practice.ASM International, Materials Park, United States of America.425pp
Weld World (2019) 63:1075–1086 1085

15. Forgas Júnior A, Otubo J, Magnabosco R (2016) Ferrite quantifi-cation methodologies for duplex stainless steel. J Aerosp TechnolManag 8:357–362. https://doi.org/10.5028/jatm.v8i3.653
16. Niagaj J, Mazur Ł (2014) Review of methods for measurement offerrite content in high alloyed steels and their welded joints. WeldInt 28:345–353. https://doi.org/10.1080/09507116.2012.708490
17. Behal VG, Melilli AS (1982) Stainless steel castings. AmericanSociety for Testing and Materials. American Society for Testingand Materials. Committee A-1 on Steel, Stainless Steel 11pp
18. Leng Y (2008) Materials characterization: introduction to micro-scopic and spectroscopic methods. John Wiley & Sons Ltd.,Singapore. 384pp
19. Petzow G (2015) Metallographisches, Keramographisches,Plastographisches Ätzen. Borntraeger Gebrueder. 298pp
20. ASTM E562-11 (2002) Standard test method for determining vol-ume fraction by systematic manual point count. ASTM B Stand 1–7. https://doi.org/10.1520/E0562-11.2
21. Westin EM, Herzman S (2014) Element distribution in lean duplexstainless steel welds. Welding in the World 58:143–160
22. Hosseini VA, Hurtig K, Eyzop D, Östberg A, Janiak P, Karlsson L(2018) Ferrite content measurement in super duplex stainless steel
welds In press: Weld World 13pp. DOI: https://doi.org/10.1007/s40194-018-00681-1
23. Operating Manual (2001) Feritscope® MP30. 30:1–21224. ANSI / AWS A4.2M / A4.2 (1997) Standard procedures for cali-
brating magnetic instruments to measure the delta ferrite content ofaustenitic and duplex ferritic-austenitic stainless steel weld metal,31pp
25. Valiente BermejoMA (2012) Predictive and measurement methodsfor delta ferrite determination. Weld J 91:113–121
26. ASTM E975–13 (2009) Standard practice for X-ray determinationof retained austenite in steel with near random crystallographicorientation. ASTM 03:1–7. https://doi.org/10.1520/E0975-13
27. Stefanescu D, Ruxanda R (2004) Fundamentals of solidification.In: ASM handbook - metallography and microstuctures, Georgevan. ASM International, pp 71–92
28. Kah P, Martikainen J (2013) Influence of shielding gases in thewelding of metals. Int J Adv Manuf Technol 64:1411–1421.https://doi.org/10.1007/s00170-012-4111-6
Publisher’s note Springer Nature remains neutral with regard tojurisdictional claims in published maps and institutional affiliations.
1086 Weld World (2019) 63:1075–1086