Methodologyforthe measurementofentrainment Edition2 … · 2015-04-16 · Methodologyforthe...
30
British Energy Estuarine & Marine Studies Scientific Advisory Report Series 2010 No 005 Ed 2 Methodology for the measurement of entrainment Edition 2 Production Date: May 2011 UK Protect; Commercial Expert Panel
Transcript of Methodologyforthe measurementofentrainment Edition2 … · 2015-04-16 · Methodologyforthe...
British Energy Estuarine & Marine Studies
Scientific Advisory Report Series 2010 No 005 Ed 2
Methodology for themeasurement of entrainmentEdition 2
Production Date: May 2011UK Protect; Commercial
Expert Panel


31/05/11 BPE Accessibility amended to 'Free Access'; Appendix B added
07/03/11 BEEMS EP
BPE
ADVISORY, NOT FOR COMMENT '
This document contains expert advice originating from the BEEMS Expert Panel, and
is thus subject to peer review processes associated with that expert group alone, and not those of Cefas in delivering other items of
work within the BEEMS programme.
Revision Date Prepared
by Checked
by Status Reasons for revision
Approved by
EDF
DIRECTION PRODUCTION INGENIERIE
UNIQUE REFERENCE NUMBER
BEEMS Science Advisory Report Series (2010) No 005 Ed 2 (BEEMS Expert Panel)
SUPPLIER WBS CODE
SUPPLIER COMPANY TRADE NAME
Cefas
CONTRACT EDF/DC-024
ELEMENTARY SYSTEM
SCALE NUCL/REP/EPR/UKEPR/ IPS
Yes No x
FORMAT CROSS-SITE
Methodology for the measurement of entrainment Edition 2
DOCUMENT TYPE : DOCUMENT CLASSIFICATION CODE PAGE
01 P00
SUBCONTRACTOR COMPANY TRADE NAME
N/A
SUBCONTRACTOR INTERNAL IDENTIFICATION NR
N/A
ACCESSIBILITY Confidential
Name list of addressees is established by the initiator. Each recipient receives one numbered exemplary and is not allowed to extend the distribution without initiator authorization
Restricted Name list of addresses is established by the initiator. Each recipient may extend the
distribution under his/her own responsibility EDF access Must not be distributed outside of EDF except by a Section Manager X Free access Unrestricted distribution
COPYRIGHT EDF 2008

UK Protect; Commercial
SAR 005 XS EP entrainment method Ed2 Final
UK Protect; Commercial
Science Advisory Report No 005
Methodology for the measurement of entrainment
Edition 2
This Science Advisory Report represents the opinion of the BEEMS Expert Panel, and is based upon its members' own expertise, the scientific literature, the support of the Technical Secretariat, the BEEMS Data Centre and inputs from named
invited scientists with relevant specialist knowledge. It reflects current science, and is not necessarily the view of EDF Energy or any organisation with which the members are connected.
The Science Advisory Report is subject to review and update as necessary.

UK Protect; Commercial
SAR 005 XS EP entrainment method Ed2 Final ii
UK Protect; Commercial
SAR 005 XS EP entrainment method Ed2 Final iii
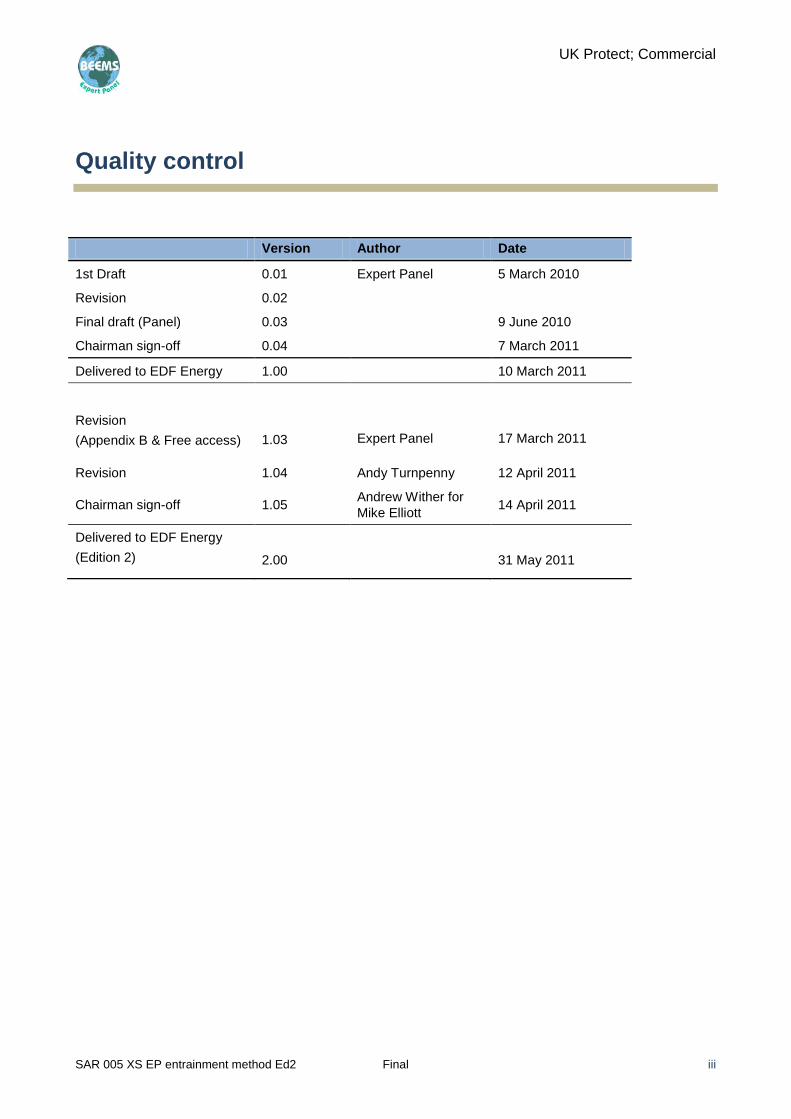
Quality control
Version Author Date
1st Draft 0.01 Expert Panel 5 March 2010
Revision 0.02
Final draft (Panel) 0.03 9 June 2010
Chairman sign-off 0.04 7 March 2011
Delivered to EDF Energy 1.00 10 March 2011
Revision
(Appendix B & Free access)
1.03
Expert Panel
17 March 2011
Revision 1.04 Andy Turnpenny 12 April 2011
Chairman sign-off 1.05 Andrew Wither for
Mike Elliott 14 April 2011
Delivered to EDF Energy
(Edition 2)
2.00
31 May 2011

UK Protect; Commercial
SAR 005 XS EP entrainment method Ed2 Final iv
Expert Panel membership
Professor Mike Elliott (Chair) Institute of Estuarine & Coastal Studies, University of Hull
Dr Roger Bamber ARTOO Marine Biology Consultants
Steve Colclough Environment Agency
Professor Keith Dyer Independent Consultant
Peter Holmes Independent Consultant
Henk Jenner Aquator BV (KEMA to the end of July 2010)
Dr Andy Turnpenny Turnpenny Horsfield Associates
Andrew Wither Visiting Research Scientist, National Oceanography Centre Liverpool
(Environment Agency to the end of October 2010)

UK Protect; Commercial
SAR 005 XS EP entrainment method Ed2 Final v
Table of contents
Executive summary ......................................................................................................................................... 1
1 Introduction ................................................................................................................................................ 2
2 The key questions ..................................................................................................................................... 3
2.1 Scientific .......................................................................................................................................... 3
2.2 Methodological ................................................................................................................................ 3
3 Importance and context ............................................................................................................................ 4
3.1 Importance ...................................................................................................................................... 4
3.2 Context ............................................................................................................................................ 4
4 Component methods ................................................................................................................................. 6
4.1 What species are available? ........................................................................................................... 6
4.1.1 Consult local sources of science ........................................................................................... 6
4.1.2 Consult NGOs and their publications .................................................................................... 6
4.1.3 Consult regulatory authorities ................................................................................................ 6
4.1.4 Consult fisheries managers ................................................................................................... 6
4.1.5 Sample from the CW flow of an existing power station or similar ......................................... 6
4.1.6 Undertake local plankton-sampling ....................................................................................... 6
4.2 What species might be affected? .................................................................................................... 7
4.2.1 Consult published literature ................................................................................................... 7
4.2.2 Undertake experiments .......................................................................................................... 7
4.2.3 Monitor survival of post-entrainment individuals .................................................................... 7
5 Analysis ...................................................................................................................................................... 8
5.1 Results ............................................................................................................................................ 8
5.1.1 Prediction of organisms to be entrained ................................................................................ 8
5.1.2 How many will survive? ......................................................................................................... 8
6 Conclusions – using the output ............................................................................................................... 9
6.1 Significance: mortality of organisms (cross-reference to impingement and natural populations).. 9
6.1.1 Context ................................................................................................................................... 9
6.2 Significance: Damage to organisms................................................................................................ 9
6.2.1 Context ................................................................................................................................... 9
7 ‘Answers’ to key questions .................................................................................................................... 10
8 Summary opinion .................................................................................................................................... 11
References ..................................................................................................................................................... 12
References ........................................................................................................... Error! Bookmark not defined.
Acknowledgments ......................................................................................................................................... 13

UK Protect; Commercial
SAR 005 XS EP entrainment method Ed2 Final vi
Appendix A Definitions .......................................................................................................................... 14
A.1 Methodology .................................................................................................................................. 14
A.2 Methods ......................................................................................................................................... 14
A.3 Entrainment ................................................................................................................................... 14
Appendix B Sampling to estimate annual entrainment amounts, types and rates in active cooling
water systems .................................................................................................................... 15
B.1 Purpose ......................................................................................................................................... 15
B.2 Entrainment sampling practicalities ............................................................................................... 15
B.2.1 Where to sample and sampling equipment ......................................................................... 15
B.3 Entrainment survey design ............................................................................................................ 16
B.3.1 Sampling intensity ................................................................................................................ 16
B.3.2 Sample rate and duration .................................................................................................... 16
B.3.3 Sample processing .............................................................................................................. 16

UK Protect; Commercial
SAR 005 XS EP entrainment method Ed2 Final vii
List of figures
Figures
Figure 1 Schematic figure of direct-cooled cooling water system .................................................................... 15

UK Protect; Commercial
SAR 005 XS EP entrainment method Ed2 Final 1
Executive summary
This report is one of a series that examines the methods and methodologies used and/or required for
examining the effects of power stations, specifically new nuclear build (NNB), on the marine environment in
terms of regulatory compliance. This report deals with entrainment of organisms into cooling-water systems.
Definitions and context are provided, as is a commentary on the methods and results.
The methodology provided formalises the processes required to understand (in qualitative or quantitative
terms) the nature and significance of entrainment to a degree sufficient for the purposes of the Operator and
Regulator.
Methods are described for base-data collection and supplementary field studies to provide the necessary
information on the diversity and abundance of the species and lifestages entrained.
The use of the outputs is examined to ensure the conclusions are scientifically valid in terms of significance
with respect to station operation and ecological and social issues.
There is no universal technique that will provide a comprehensive understanding of entrainment at all sites
and under all conditions. However, this report critically reviews a wide range of techniques and methods,
which will allow a suitable monitoring and assessment programme to be designed for all potential new
nuclear build (NNB) sites. Effects of entrainment should always be considered in combination with effects of
impingement to provide an integrated assessment of abstraction effects.
This sequence of component methods, identified as a methodology for measuring entrainment, adds to the
UK suite of methods and methodologies as well as providing a formalised approach to the specifics of
estimating the effects of direct-cooled power stations on the biota in the marine environment.
At the time of writing, before the full methodology can be completed1, the Entrainment Mimic Unit (EMU)
experiments need to be implemented. These are to provide additional estimates of entrainment survival rates
for representative species and lifestages, and their sensitivity to different cooling-water (CW) system
characteristics, carried out using the purpose-built EMU2 experimental rig.
1 This is not necessarily a time limitation as the methodology covers activities throughout the operational lifetime of the
station

UK Protect; Commercial
SAR 005 XS EP entrainment method Ed2 Final 2
1 Introduction
Since the last cycle of NNB in the UK, there have been many developments in techniques, technology,
understanding of ecology, and legislation. These include the adoption of the Ecosystem Approach, the
introduction of new, primarily EU-led, legislation and increases in public and regulatory expectations (all
within a background of climate change).
The large volumes of cooling water abstracted by direct-cooled power stations inevitably draw in quantities of
marine fauna and flora, including temporary and permanent plankton and early life-stage fish, which
subsequently pass through the plant cooling system and back out to the sea or estuary. Good intake siting
can reduce the quantity of material entrained. Significant proportions of these organisms survive entrainment
passage, although this is highly species-/lifestage-specific, and it is important therefore that detailed
quantitative assessments are carried out for the level of impact to be understood. The processes involved in
making such an assessment are considered in BEEMS Science Advisory Report No 006 on impingement.
A methodology is considered to be a combination and sequence of methods (see Appendix A for definitions).
This report comes from a workshop held by the Expert Panel on Methodologies and is one of a series. The
workshop adopted a who, what, why, where, when and how? approach, which is partially retained in the
Reports. It also used argument-mapping to clarify ideas and relationships.

UK Protect; Commercial
SAR 005 XS EP entrainment method Ed2 Final 3
2 The key questions
2.1 Scientific
a) Can entrainment be detected as a signal against a background of noise that is particularly large in the pelagic components2?
Entrainment can be tackled in two ways:
What is the difference in densities between the inlet and outlet; and/or
Can the removal of organisms from the pool in the receiving waters be detected?
b) What species are in the area?
c) What time of year are they present?
Holoplankton are likely to be present all year (although showing seasonal peaks in abundance).
Meroplankton and juveniles of natant species are likely to be highly seasonal in their presence.
d) What are the adverse effects of entrainment on these species?
What is the ecological (or statistical) significance of these effects?
What aspects of the entrainment have a deleterious impact on the organisms concerned?
What proportions of the entrained organisms suffer from the deleterious impact?
Are any such losses significant to the acceptable survival and functioning of the local populations of the
organisms concerned?
Probably both mero- and holoplankton will suffer some mortality due to physical damage in the CW
system in combination with a ΔT of 7–10ºC. A relatively high mortality can be expected.
The effect on the holoplankton population will probably be low owing to high reproduction rates in the
surface water.
Mesocosm studies in freshwater with entrained holoplankton showed a rapid recovery of the
population within two to three weeks showing that the recovery power is high.3
However, meroplankton, with the emphasis on fish larvae, may show high mortality, which cannot be
compensated immediately.4
Mount Hope Bay (USA) is an example where mortality resulting from entrainment of larval
winter flounder (Pseudopleuronectes americanus) severely reduced the local population
size. Therefore, siting power stations in or close to known fish spawning areas should be
avoided.
2.2 Methodological
Can the methodology and associated methods answer the key scientific questions to the required
degree for use by the Operator and Regulators?
Are the methods described in this methodology in existence? If so, where are they?
If the methods are not available are they amenable to rapid assembly for completion of the methodology
and submission to the relevant Regulators if required?
2 This is not addressed here as the focus is on methodologies, although it is a fundamental question for regulators,
operators and marine scientists 3 A closed system is needed to detect this – the main point about an open tidal system, in which the tidal excursion is
constantly delivering a new supply of planktons, is that detection of change becomes almost impossible 4 Invertebrate larvae are present in such huge numbers that any power station removal cannot be detected
UK Protect; Commercial
SAR 005 XS EP entrainment method Ed2 Final 4
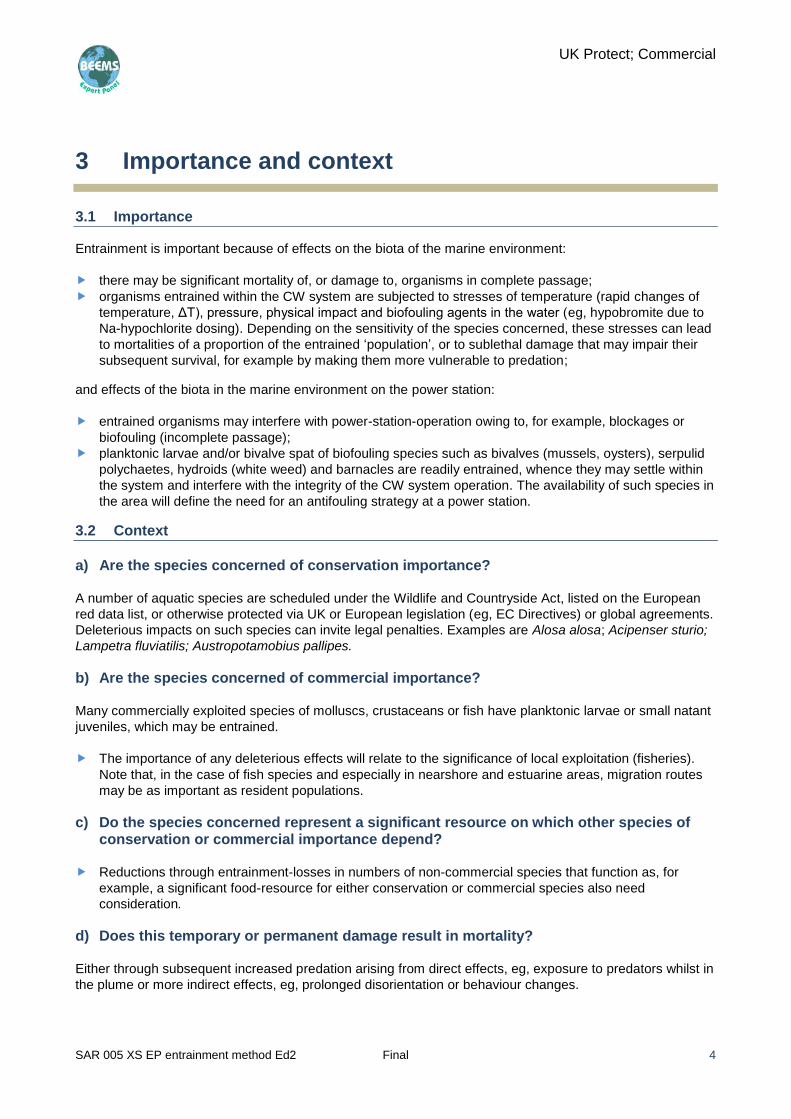
3 Importance and context
3.1 Importance
Entrainment is important because of effects on the biota of the marine environment:
there may be significant mortality of, or damage to, organisms in complete passage;
organisms entrained within the CW system are subjected to stresses of temperature (rapid changes of
temperature, ΔT), pressure, physical impact and biofouling agents in the water (eg, hypobromite due to
Na-hypochlorite dosing). Depending on the sensitivity of the species concerned, these stresses can lead
to mortalities of a proportion of the entrained ‘population’, or to sublethal damage that may impair their
subsequent survival, for example by making them more vulnerable to predation;
and effects of the biota in the marine environment on the power station:
entrained organisms may interfere with power-station-operation owing to, for example, blockages or
biofouling (incomplete passage);
planktonic larvae and/or bivalve spat of biofouling species such as bivalves (mussels, oysters), serpulid
polychaetes, hydroids (white weed) and barnacles are readily entrained, whence they may settle within
the system and interfere with the integrity of the CW system operation. The availability of such species in
the area will define the need for an antifouling strategy at a power station.
3.2 Context
a) Are the species concerned of conservation importance?
A number of aquatic species are scheduled under the Wildlife and Countryside Act, listed on the European
red data list, or otherwise protected via UK or European legislation (eg, EC Directives) or global agreements.
Deleterious impacts on such species can invite legal penalties. Examples are Alosa alosa; Acipenser sturio;
Lampetra fluviatilis; Austropotamobius pallipes.
b) Are the species concerned of commercial importance?
Many commercially exploited species of molluscs, crustaceans or fish have planktonic larvae or small natant
juveniles, which may be entrained.
The importance of any deleterious effects will relate to the significance of local exploitation (fisheries).
Note that, in the case of fish species and especially in nearshore and estuarine areas, migration routes
may be as important as resident populations.
c) Do the species concerned represent a significant resource on which other species of conservation or commercial importance depend?
Reductions through entrainment-losses in numbers of non-commercial species that function as, for
example, a significant food-resource for either conservation or commercial species also need
consideration.
d) Does this temporary or permanent damage result in mortality?
Either through subsequent increased predation arising from direct effects, eg, exposure to predators whilst in
the plume or more indirect effects, eg, prolonged disorientation or behaviour changes.

UK Protect; Commercial
SAR 005 XS EP entrainment method Ed2 Final 5
While survival through entrainment may be demonstrated, it is necessary to determine whether
physical damage, or impairment of behaviour or sensory function, makes the surviving organisms
more susceptible to predation after leaving the system, and whether any such concomitant losses
are significant.
e) Do the species concerned represent a biofouling risk to plant operation?
Planktonic larvae and spat of biofouling species such as mussels, serpulid polychaetes and
barnacles are readily entrained, whence they may settle within the system and interfere with the
integrity of the CW system operation; the presence of such species in the area will define the need
for an antifouling strategy at a power station.

UK Protect; Commercial
SAR 005 XS EP entrainment method Ed2 Final 6
4 Component methods
4.1 What species are available?
4.1.1 Consult local sources of science
Any local information/data on planktonic species or populations in the ambient water are likely to reside only
with scientific institutions (aquatic laboratories; research establishments; academia; Cefas); published
literature may also be available. Consultation with the various sources listed below is most likely only to
ascertain the presence of adults of those species contributing significantly to the meroplankton. Local
scientific institutions will also have data on adults of relevance.
4.1.2 Consult NGOs and their publications
Wildlife Trusts, the RSPB, biodiversity data centres, the Industry Nature Conservation Association.
Local Wildlife Trusts and other NGO wildlife organisations with regional networks often have unpublished or
anecdotal data of relevance, and are likely to include (or know of) local experts in various taxa. They are also
most likely to have recent data, including information of changes.
4.1.3 Consult regulatory authorities
The national regulatory nature conservation and environmental protection authorities, such as Natural
England and the Environment Agency, accumulate knowledge on species and habitats of conservation
importance at a local level (through their local offices), including collated data from a range of sources. They
should also be aware of the context of any local populations of species of conservation importance.
4.1.4 Consult fisheries managers
Local knowledge on commercial fisheries species of the region of concern, including access to relevant
landings statistics, resides with local fisheries managers, including Sea Fisheries Committees or, as relevant,
the Environment Agency, the Marine Management Organisation and Cefas. Note that, in the case of fish
species, migration routes may be as important as resident populations.
4.1.5 Sample from the CW flow of an existing power station or similar
Sampling of the plankton/small nekton from an existing industrial-water flow will give qualitative or
quantitative information on species susceptible to entrainment. It is prohibitively difficult to obtain quantitative
data from such sampling except in the smallest of flows (ie, those not comparable to a power-station CW
system). If no other data exist from consulted sources, this will be an invaluable data source.
Power station sampling methods are described in Appendix B.
4.1.6 Undertake local plankton-sampling
Note that, depending on local hydrographic conditions and the intake position within the water column, this is
not necessarily the same as what will be entrained.
In the absence of an existing CW flow, plankton sampling of the ambient water-body will indicate which
species are present, in what proportions, at what time of year and with what distribution (eg, vertical
stratification). As planktonic species show seasonality, stratification and interaction, sophisticated modelling
would be necessary to relate the ambient species and populations to their likely entrainment risk, assuming
that a comprehensive sampling strategy can be undertaken at all. In this context, careful site-specific
planning of the sampling strategy must be undertaken in order to gather representative data or relevance.
For example, in a tidal system, any vertical stratification of the ambient water from which abstraction occurs
will move up and down (tidally) in relation to the intake structure itself.
UK Protect; Commercial
SAR 005 XS EP entrainment method Ed2 Final 7
4.2 What species might be affected?
4.2.1 Consult published literature
There has been much published on entrainment, on experimental entrainment and on in situ monitoring of
perceived entrainment effects, as well as on plankton in a more general (but relevant) sense. Much of the
older entrainment information is now outdated and should be viewed critically. Equally, there are recent
reviews on the subject (eg, Turnpenny et al., 2010), and new higher-quality data will emerge from
comprehensive entrainment experimentation under BEEMS Work Package 3 (EMU2: Entrainment Mimic
Unit, MkII). Presumption is to be avoided, but some degree of extrapolation will probably always be
necessary.
Species not prone to entrainment (because of behaviour, localised distribution or position in the water
column) or not occurring adjacent to the proposed intake will not be affected.
4.2.2 Undertake experiments
Where valid and locally relevant field data are unavailable, either for certain species or certain (susceptible)
life-stages, new experimentation is necessary to determine whether and to what degree of significance
organisms may be affected deleteriously by entrainment. A comprehensive EMU has been found to be the
only way to obtain valid results to such questions.
Relevant experiments should be based on the design parameters of the CW system being proposed, and
undertaken on the species of concern to the specific development. It is necessary to try to distinguish
between the effects of the different stressors, eg, heat, pressure and specific biofouling measures, as it may
become necessary to suggest design modifications to reduce any predicted entrainment losses that are
considered to be unacceptable.
Results to date (Turnpenny et al., 2010) have indicated that extrapolation from one species to another is
unlikely to be valid (although those experiments have covered a wide range of substantially unrelated taxa:
extrapolation may become possible in the future given a more comprehensive data-set on more-closely-
related species).
4.2.3 Monitor survival of post-entrainment individuals
An aspect that has received little attention historically is that of the longer-term survival of organisms post-
entrainment (after discharge into the receiving environment). While survival through entrainment may be
demonstrated, it is necessary to determine whether physical damage or impairment of behaviour or sensory
function makes the surviving organisms more susceptible to predation after leaving the system, and whether
any such concomitant losses are significant. Given the high levels of natural mortality of planktonic
organisms (and especially meroplankters) then this level of mortality may be impossible to detect.
This will require longer-term experiments/monitoring; while the ideal time-span for such monitoring is from
entrainment to the successful reproduction of offspring of the entrained organism, this is unlikely ever to be
possible, either in terms of experimental integrity or of logistics/economics. Some compromise will be
necessary but, in their current absence, any data will be of value.

UK Protect; Commercial
SAR 005 XS EP entrainment method Ed2 Final 8
5 Analysis
5.1 Results
What results will these methods elicit?
5.1.1 Prediction of organisms to be entrained
The gathering of relevant data on local organisms susceptible to entrainment to the proposed power
station CW system will allow prediction of the species and lifestages of concern, in terms of
conservation, commercial or biofouling significance, as well as in terms of which species may require
analysis of their vulnerability to entrainment stresses (eg, through EMU experimentation).
5.1.2 How many will survive?
Interpretation of any (valid) existing results on entrainment survival/mortality, together with results from
newly-conducted EMU experimentation, will allow prediction of the significance of any entrainment-
related losses. Knowledge of the entrained levels in relation to natural abundances in the receiving
waters will be required to determine significance.

UK Protect; Commercial
SAR 005 XS EP entrainment method Ed2 Final 9
6 Conclusions – using the output
6.1 Significance: mortality of organisms (cross-reference to impingement and natural populations)
6.1.1 Context
Are the species of conservation importance?
Are the species concerned of commercial importance?
Do the species concerned represent a significant resource on which other species of conservation or
commercial importance depend?
Can the ‘signal’ (of losses due to entrainment) be detected against a background of ‘noise’ (inherent
natural variability)?
The significance of any losses at the population and assemblage level through entrainment (including post-
entrainment mortalities) will relate to:
the overall perceived importance of the local population;
the natural levels of mortality, especially in the juvenile stages that suffer natural high levels of predation
and other mortality; Hirst & Kiørboe (2002) suggest planktonic mortality rates from copepods to larval
fishes of 0.005 to 0.4 day-1
, ie, up to 40% per day;
the context of the likely survival of those individuals lost through entrainment mortality, were they not to
have been entrained (cf. adult-equivalence);
the context of any other mortalities associated with the CW system operation (eg, impingement) that
could substantially override entrainment losses;
the ability of the local population to replace (through reproduction or possibly immigration) those losses.
Most holoplanktonic species will reproduce at such a rate that entrainment losses are hardly likely to be
significant, although reproduction is seasonal. Equally, local populations controlled by density-
dependence are unlikely to be affected (eg, Henderson et al., 1984). Immigration of the plankton into the
source-water area though tidal excursion will both replace any lost individuals and make the detection of
entrainment losses difficult to quantify.
Method
Refer to SAR 006 ‘Methodology for the measurement of impingement’, Section 4, for methods
appropriate for combined assessment of entrainment and impingement.
6.2 Significance: Damage to organisms
6.2.1 Context
Does this temporary or permanent damage to organisms result in subsequent mortality through
predation?

UK Protect; Commercial
SAR 005 XS EP entrainment method Ed2 Final 10
7 ‘Answers’ to key questions
The adequacy of the answers will depend upon the geographic extent, species coverage, life stage
coverage, frequency and duration of the sampling regime initiated. As indicated in the BEEMS Inception
Report (BEEMS Technical Report No 001), a 'deterministic' approach to sampling to address all of the above
is neither time- or cost-effective and also uncertain as to the extent of understanding it will produce.
Consultation of local sources and the published literature, with a gap analysis and subsequent specifically-
aimed field activity, are the main ways forward.
EMU experiments are part of the BEEMS remit and an EMU was under construction at the time of writing
and is in operation at the time of publication of this work as a Science Advisory Report.
Acceptable limits of entrainment mortality are to be negotiated between the Operator and the Regulator.
NB: The ability to distinguish meaningfully between CW-abstraction-induced mortality and natural
mortality/predation is a complex subject outside of the remit of this report. However, if we do not have good
data on natural mortality rates or natural population levels or annual variabilities thereof, then detecting
power station-induced mortalities is not possible.

UK Protect; Commercial
SAR 005 XS EP entrainment method Ed2 Final 11
8 Summary opinion
The methodology provided formalises the processes required to understand (in qualitative or quantitative
terms) the nature and significance of entrainment to a degree sufficient for the purposes of the Operator and
Regulator.
At the time of writing, before the full methodology can be completed5, the EMU experiments need to be
implemented. These are to provide additional estimates of entrainment survival rates for representative
species and lifestages, and their sensitivity to different CW system characteristics, carried out using the
purpose-built EMU2 experimental rig.
5 This is not necessarily a time limitation as the methodology covers activities throughout the operational lifetime of the
station

UK Protect; Commercial
SAR 005 XS EP entrainment method Ed2 Final 12
References
BEEMS Scientific Advisory Report No 006. Expert Panel. 2011. Methodology for the measurement of
impingement. Cefas
BEEMS Scientific Advisory Report No 008. Expert Panel. 2011. Methodology for the measurement of
plumes. Cefas
BEEMS Technical Report No 001 (WP1): British Energy Power Station Studies. Cefas.
BEEMS Technical Report No 004 (WP3): A review of the available data for impingement and entrainment at
Hinkley, Sizewell, Dungeness and Bradwell Power Stations. Pisces Conservation Ltd.
BEEMS Technical Report No 005 (WP3): Sampling to estimate annual impingement and entrainment
amounts, types and rates. A Turnpenny, S Colclough, M Elliott.
BEEMS Technical Report No 018 (WP3): Critical review of fish impingement and entrainment data at
Sizewell, Bradwell, Hinkley Point and Dungeness Power Stations. Jacobs UK Ltd.
BEEMS Technical Report No 025 (WP3): Impingement sampling for fish and crustaceans at Sizewell B.
Pisces Conservation Ltd.
Coughlan, J. and Fleming, J.M. 1978. A versatile pump sampler for live zooplankton. Chesapeake Scci., 19
(2).
Hemingway, K.L. and Elliott, M. 2002. Chapter 8: Field Methods. In: Elliott, M and KL Hemingway (Eds)
Fishes in Estuaries. Blackwell Science, Oxford, p410-509
Henderson, P.A., Turnpenny, A.W.H and Bamber, R.N. 1984. Long-term stability of a sand smelt (Atherina
presbyter Cuvier) population subject to power station cropping. Journal of Applied Ecology, 21: 1–10.
Hirst, A.G, and Kiørboe, T. 2002. Mortality of marine planktonic copepods: global rates and patterns.
Marine Ecology Progress Series, 230: 195–209.
Murarka, I. P. and Bodeau, D. J. 1977. Sampling designs and methods for estimating fish impingement
losses at cooling-water intakes. Argonne, Ill.: Argonne National Laboratory.
Robin, J.P. 1991. Assessment of juvenile flounder catches at the Cordemais power station water intake in
the Loire estuary. Netherlands Journal of Sea Research, 24(3/4), 317–323.
Turnpenny, A.W.H., Coughlan, J., Ng, B., Crews, P. and Rowles, P. 2010. Cooling water options for the new
generation of nuclear power stations in the UK. Environment Agency Science Report SC070015/SR,
Environment Agency, Bristol.

UK Protect; Commercial
SAR 005 XS EP entrainment method Ed2 Final 13
Acknowledgments
Prepared by Dr Roger Bamber, Dr Henk Jenner, Dr Andy Turnpenny, Steve Colclough, Andrew Wither and
Professor Mike Elliott on behalf of the BEEMS Expert Panel.

UK Protect; Commercial
SAR 005 XS EP entrainment method Ed2 Final 14
Appendix A Definitions
A.1 Methodology
In this case a methodology is a structured compilation of the activities (defined by a set of methods) required
to achieve an understanding of the particular subject with respect to NNB.
A.2 Methods
Methods, in this case, refer to activities and ways of doing them. They range from accepted field
measurement protocols to consultation through to experimentation.
A.3 Entrainment
Entrainment is used here in the biological sense with direct application/relevance to NNB. We note that
‘entrainment’ is used in the physical oceanographic world to describe the effects of one fluid moving inside
another (see BEEMS Science Advisory Report No 008 on methodologies to measure plumes).
Entrainment is the passage of organisms (and other material) through the power station CW filter screens,
through the CW system, and usually out with the discharged effluent.
Effectively this includes all the organisms taken in with the CW flow that are not trapped by the filter screens
(impinged).
Entrained organisms include:
holoplankton (species spending their entire, or their adult, life as members of the plankton)
meroplankton (species spending their larval life as members of the plankton)
small swimming species and juveniles (natant species small enough to pass the filter screen, such as
juvenile (0+) fish)
UK Protect; Commercial
SAR 005 XS EP entrainment method Ed2 Final 15
Appendix B Sampling to estimate annual entrainment
amounts, types and rates in active cooling water
systems
B.1 Purpose
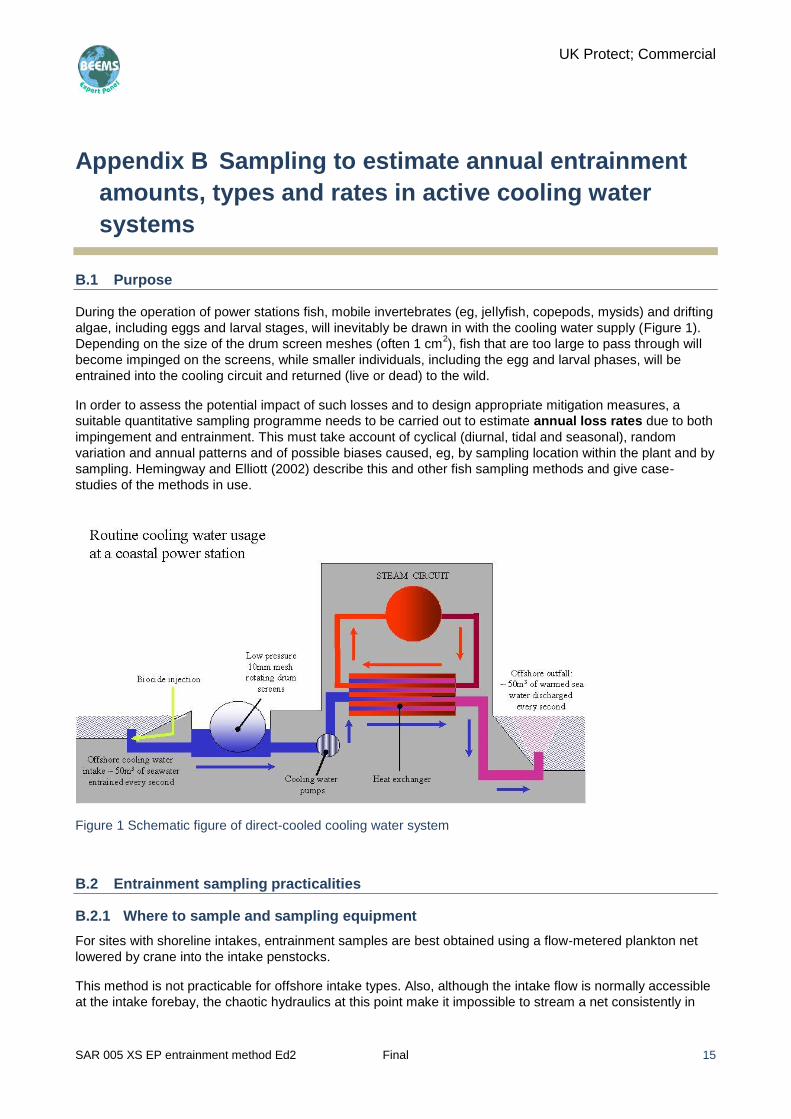
During the operation of power stations fish, mobile invertebrates (eg, jellyfish, copepods, mysids) and drifting
algae, including eggs and larval stages, will inevitably be drawn in with the cooling water supply (Figure 1).
Depending on the size of the drum screen meshes (often 1 cm2), fish that are too large to pass through will
become impinged on the screens, while smaller individuals, including the egg and larval phases, will be
entrained into the cooling circuit and returned (live or dead) to the wild.
In order to assess the potential impact of such losses and to design appropriate mitigation measures, a
suitable quantitative sampling programme needs to be carried out to estimate annual loss rates due to both
impingement and entrainment. This must take account of cyclical (diurnal, tidal and seasonal), random
variation and annual patterns and of possible biases caused, eg, by sampling location within the plant and by
sampling. Hemingway and Elliott (2002) describe this and other fish sampling methods and give case-
studies of the methods in use.
Figure 1 Schematic figure of direct-cooled cooling water system
B.2 Entrainment sampling practicalities
B.2.1 Where to sample and sampling equipment
For sites with shoreline intakes, entrainment samples are best obtained using a flow-metered plankton net
lowered by crane into the intake penstocks.
This method is not practicable for offshore intake types. Also, although the intake flow is normally accessible
at the intake forebay, the chaotic hydraulics at this point make it impossible to stream a net consistently in

UK Protect; Commercial
SAR 005 XS EP entrainment method Ed2 Final 16
the flow, so this approach must be rejected. Alternatives are to use a plankton pump-sampler lowered into
the forebay, which forces water through the plankton sock (Coughlan and Fleming, 1978), to pump water
from the forebay into a suspended plankton net, or to draw off samples of cooling water under positive
pressure from downstream of the CW pumps. This depends on the existence of a suitable tapping within the
CW pipework. There are also drawbacks to this method, since unless designed for the purpose, the tapping
may not take an unbiased nor undamaged plankton sample. On balance, therefore, the pump-sampler or
pumping methods are most suitable for offshore intake types.
When using a stand-alone pump, it should be of a positive displacement ‘solids-handling’ type rather than
centrifugal type, or a Hidrostal fish pump. These pumps can pass small fish undamaged. Airlift pumps may
also achieve the same aim.
B.3 Entrainment survey design
B.3.1 Sampling intensity
Sampling on 40 dates per year (~11%) has been common practice, based on US power plant impingement
studies (Murarka and Bodeau, 1977). It is suggested that this intensity of sampling (ie, around one day per
week) is retained as a minimum, for entrainment monitoring, although it may not be necessary to sample all
year round.
Various data-sets containing 24-hour sample data are available for different UK power plant sites. It would
be beneficial to apply statistical power analysis techniques to some of these data-sets to assess the
adequacy of this sampling intensity against specific project objectives. Again, depending upon the area and
species composition and survey objectives, some periods will require better resolution and hence shorter
intervals between samples. Conversely, less active periods such as winter months could be efficiently and
effectively covered with fewer samples.
B.3.2 Sample rate and duration
For ichthyoplankton (and other small planktonic fauna) sampling, a pump flow rate of at least 10 litres s-1
and
preferably 25 litres s-1
is recommended. Samples should be collected over a 24-hour period to avoid tidal
and diurnal bias. Nets will need to be emptied at intervals during this period to avoid damage to
ichthyoplankton. This operational constraint could be used to separate the catch into discrete time slots with
the added benefit of gaining understanding of diel changes in impingement rates.
B.3.3 Sample processing
Samples should be fixed and returned to the laboratory for taxonomic analysis and counting as per standard
ichthyoplankton methods; if necessary, this is using a rafter counting cell or a marked and measured rotating
groove under a binocular microscope. Often density of the different items will make necessary some sort of
calibrated subsampling. A standard plankton splitter is often used. However, the whole sample must be
inspected and less abundant taxa sorted before subsampling.
The following observations should be recorded for each species in all cases:

UK Protect; Commercial
SAR 005 XS EP entrainment method Ed2 Final 17
date of capture.
species name.
total number of specimens over the 24-hour period (raised from subsamples if necessary).
standard length (snout to caudal peduncle – preferred measurement since fins may be damaged) for all
fish or a subsample of 200 fish if more than 200 present. However, if a sample of fish is homogeneous
and contains uniform sizes, for example a shoal of herring, then such a large subsample may not be
needed.
As an example, in order to study the by-catches of flounder and smelt juveniles, various techniques have
been used at the Cordemais Power Station in the Loire estuary (Robin, 1991). Larvae drawn through the
cooling system were sampled using a plankton net 0.6 m in diameter with 0.5 mm mesh in the discharge
stream of the power plant. A flowmeter was additionally fitted to the net, and each sample lasted 5 minutes
thereby filtering a volume of 68 m3. To sample juveniles that were trapped on the drum screen and
subsequently flushed away by a row of cleaning pumps, a special sampling device was constructed. This
took the form of a drain by which fish were returned to the estuary, and had a mesh size of 3 mm. This
device was used to sample three times over a 1-min period. Both plankton net and drumscreen sampling
were carried out on the same day every 1.5 hours during a tidal cycle (Hemingway and Elliott, 2002).

British Energy Estuarine and Marine Studies(BEEMS) is a research programme funded byEDF Energy to provide scientific backgroundfor the marine issues surrounding newnuclear build.