Methodology to Identify Small Businesses and Their … of Tax Analysis . Department of the Treasury...
42
Office of Tax Analysis Department of the Treasury Technical Paper 4 August 2011 Methodology to Identify Small Businesses and Their Owners Matthew Knittel, Susan Nelson, Jason DeBacker, John Kitchen, James Pearce, and Richard Prisinzano The OTA Technical Papers Series presents documentation of the models, methods, and datasets developed by staff and used for Treasury’s policy analysis. The papers are intended to generate discussion and critical comment while informing and improving the quality of the analysis conducted by the Office. The papers are works in progress and subject to revision. Views and opinions expressed are those of the authors and do not necessarily represent official Treasury positions or policy. Comments are welcome and should be directed to the authors. OTA Papers may be quoted without additional permission.
Transcript of Methodology to Identify Small Businesses and Their … of Tax Analysis . Department of the Treasury...
Office of Tax Analysis
Department of the Treasury Technical Paper 4
August 2011
Methodology to Identify Small Businesses and Their Owners
Matthew Knittel, Susan Nelson, Jason DeBacker, John Kitchen, James Pearce, and Richard Prisinzano
The OTA Technical Papers Series presents documentation of the models, methods, and datasets developed by staff and used for Treasury’s policy analysis. The papers are intended to generate discussion and critical comment while informing and improving the quality of the analysis conducted by the Office. The papers are works in progress and subject to revision. Views and opinions expressed are those of the authors and do not necessarily represent official Treasury positions or policy. Comments are welcome and should be directed to the authors. OTA Papers may be quoted without additional permission.
METHODOLOGY TO IDENTIFY SMALL BUSINESSES AND THEIR OWNERS
by
Matthew Knittel, Susan Nelson, Jason DeBacker, John Kitchen, James Pearce, and Richard Prisinzano
Office of Tax Analysis, US Department of Treasury
OTA Technical Paper 4 August 2011
Due to data constraints and the lack of clear definitions, prior analyses of the tax code’s impact on small business owners were flawed. In this paper, we develop a methodology to define and identify small businesses. We then apply that methodology to a new data source to identify the individual owners of those small businesses. Having matched owners to their small business entities, we present tabulations that detail various tax characteristics of small businesses and their owners for tax year 2007.
Office of Tax Analysis US Department of the Treasury 1500 Pennsylvania Avenue NW
Washington, DC 20220 The authors are grateful to Nick Bull, Geraldine Gerardi, Scott Jaquette, Jay Mackie, John McClelland, Janet McCubbin, and participants in the Tax Economists Forum for their helpful comments, and to Portia DeFilippes and Michael Cooper for programming support. Additional comments can be sent to [email protected] and [email protected].
1
EXECUTIVE SUMMARY
Although “small business owners” are often the subject of tax policy debate, a consensus does not exist regarding the specific attributes that distinguish small businesses from other firms. Previously, the Office of Tax Analysis had counted a small business owner as any individual who receives flow-through income from a sole proprietorship, partnership, S corporation, farming operation or miscellaneous rental activity. This overly broad definition was used because, for the majority of flow-through business income (partnerships and S corporations), it was not possible to trace income from the business entity to the respective owner(s). Due to newly accessible tax data, this technical constraint has been overcome. In this paper, we present a methodology that utilizes these new tax data, thereby allowing a more nuanced definition of small business owner. Our revised methodology begins with the characteristics that define a “business.” We look at the six tax forms and schedules filed by individuals or firms that could potentially represent business activity: Form 1040 Schedules C, E and F, Forms 1065, 1120 and 1120S. We develop two tests based on income and deductions reported on those forms and schedules to separate filers into business and non-business groups. We then further sub-divide our business group into small and other businesses. Drawing from various tax code provisions that provide preferential treatment to certain filers, we set the small business threshold at $10 million of income or deductions. Using these criteria, we find that 54 percent of taxpayers who file one of the six forms or schedules we consider qualify as both a business and a small business for tax year 2007. Those small businesses reported approximately 17 percent of total and net business income. We also find that slightly more than one-fifth of small businesses conform to our definition of an employer. Once we set the parameters that define a small business, we then use newly accessible tax data to separate small business income reported on the individual income tax return from other (i.e., non-small) business income. In this manner, we identify relevant characteristics of small business owners such as reported Adjusted Gross Income (AGI) and applicable marginal tax rates. For tax year 2007, our previous methodology counted 34.7 million filers reporting $662 billion of net flow-through business income as small business owners. Using our revised methodology, we count 20.0 million filers reporting $376 billion of net business income as small business owners under a broad measure of small business owner. Under our narrow definition, we count 9.4 million filers reporting $335 billion of net business income as small business owners. Because it excludes large businesses, our revised methodology also affects the distribution of net business income across AGI classes for small business owners. Using our previous methodology, eight percent of small business owners reporting 75 percent of net flow-through business income had AGI above $200,000. Using our revised methodology and our broad definition of small business owner, those shares are 11 and 64 percent respectively. Under our narrow definition, those shares are eight and 57 percent respectively. We note that our revised methodology is but one reasonable approach that could be used to identify small businesses and their owners. However, we believe it represents a significant improvement over previous methodologies that were constrained by data limitations.
2
I. Introduction Policymakers often inquire about the tax code’s impact on “small business” and “small business owners.” Although many factors motivate their concerns, two factors seem especially relevant. First, it is widely believed that many small businesses operate at a competitive disadvantage relative to their larger counterparts. For example, small firms might have greater difficulty raising the capital necessary for investment and expansion. They might also realize thinner profit margins if their sales volume is insufficient to exploit economies of scale. Second, despite any inherent disadvantages, small businesses are perceived to generate a disproportionate share of overall economic and employment growth. For these reasons, policymakers are concerned that the tax code not excessively burden small businesses or their owners. Currently, a consensus does not exist regarding the specific attributes that distinguish small businesses from other firms. Previous analyses by the Office of Tax Analysis (OTA) and others (e.g., Joint Committee on Taxation, Tax Policy Center) counted a small business owner as any individual who reports flow-through income from a sole proprietorship, partnership, S corporation, farming operation or miscellaneous rental activities. Although this approach is easily implemented and understood, it is at once too broad and too narrow. The approach is too broad because it includes owners of large firms as well as individuals whose business income is negligible or who might not be engaged in canonical business activities. The approach is too narrow because it excludes owners of small C corporations. Due to these shortcomings, previous analyses of how tax law changes impact “small businesses” or “small business owners” have not been as informative as they might have been – the analysis might not address the true underlying concerns of policymakers. For example, should we count all misclassified employees and independent contractors who file a Schedule C (sole proprietorship) as small business owners? Should we count partners of large hedge funds as small business owners? Although issues such as these have been noted in the past, to date there has been no effort to address them in a satisfactory manner. In this paper, we describe a methodology to define a business, a small business, and a small business owner using tax return data. The methodology begins with the six tax forms and schedules filed by individuals or firms that could potentially represent business activity. We separate those returns into business and non-business groups, and then further sub-divide the business group into small and other businesses. The final part of our methodology uses newly accessible tax data to link income reported by small businesses to the individual income tax return of their respective owners. In this manner, we identify relevant characteristics of small business owners such as adjusted gross income (AGI) and marginal tax rates. This technical paper has a narrow focus, so it does not discuss the myriad tax-related issues that affect small businesses and their owners.1
1 For a discussion of these issues, see, for example, Gary Guenther, CRS Report, February 26, 2010, “Distribution of Small Business Ownership and Income by Individual Rates and Selected Policy Issues”; Jane Gravelle, CRS Report, September 3, 2010, “Small Business and the Expiration of the 2001 Tax Rate Reductions: Economic Issues”; Alan Viard & Kevin Hassett, “The Small Business Tax Hike and the 97% Fallacy,” Wall Street Journal, September 3, 2010; Haltwinger, Jarmin & Miranda, “Who Creates Jobs? Small vs. Large vs. Young,” NBER Working Paper No. 16300, August 2010.
Nor does it compare the definitions used in this paper to those used by other governmental agencies, such as the Small Business Administration (SBA). In general, the small business definition used by Treasury and the SBA will differ because they are based on different
3
data sources and concepts and are used for different purposes. The definitions used by SBA identify firms that are eligible to receive certain government grants and assistance and is generally considered to be a relatively broad measure.2
By contrast, the small business definition we employ draws on tax code provisions that provide favorable treatment to firms that fall under various size thresholds.
Although we identify certain taxpayers as small business owners, we do not assert that those individuals are necessarily engaged in entrepreneurial activity. The Meriam-Webster dictionary defines an entrepreneur as a person who organizes, manages and assumes the risk of a business or enterprise. The individuals we identify as small business owners may or may not actively participate in an enterprise, and may incur little or no risk. We also note that our methodology likely excludes some individuals who might be viewed as entrepreneurs because their business tax return does not conform to our definition of a small business. Finally, we note that our methodology is but one approach that could be used to identify small businesses and their owners. Although many different approaches could be used for this purpose, the issues we discuss would remain pertinent and must be addressed (either implicitly or explicitly) regardless of the methodology employed. Hence, this technical paper serves a dual purpose: (1) to correct known shortcomings of previous methodologies and (2) to discuss issues that policymakers should clarify to ensure that analysts use appropriate data to evaluate current and proposed tax policy. This technical paper proceeds as follows. Section II discusses the criteria we use to distinguish business from non-business entities. In Section III, we further sub-divide businesses into small and other entities and provide tabulations for small businesses based on total income, net income, industry, and employer status. Section IV discusses the methodology we use to identify the individual income tax returns of small business owners. It presents tabulations of small business owners based on AGI and marginal tax rate. Section V concludes our analysis with a review and summary of our findings. II. Business versus Non-Business Filers Our analysis begins with all entities that file one or more of the following business tax returns: Form 1040 Schedules C, E-Part I, and F (sole proprietor, miscellaneous rental real estate income, and farmers), Form 1065 (partnership), Form 1120 (C corporation), and Form 1120S (S corporation).3
2 To identify small firms eligible for its programs, the SBA uses industry-specific size standards that are based on sales or number of employees. If based on sales, the threshold ranges from just under $1 million to $35.5 million, but most industries employ the $7 million benchmark level. If based on number of employees (capital intensive industries), employment levels range from 50 to 1,500 employees, but most industries employ the 500 employee benchmark level. For research purposes, the SBA generally uses firms with fewer than 500 employees. See http://www.sba.gov/advo/research..
Although we refer to these forms and schedules as “business” returns, closer inspection reveals that many filers are not engaged in business activity as it is traditionally understood. Some examples of non-business activity include the following:
3 If an individual reports income that is attributable to multiple types of business entities, then we do not combine the activity to form a single business entity. For example, it is not uncommon for taxpayers to report income from an S corporation and a sole proprietorship. However, we do combine multiple filings of Schedule C or Schedule F by an individual to form a single entity of each type. In general, the combination of activity reported on multiple Schedule C filings increases the likelihood that an individual will be classified as a small business owner.

4
• Many Schedule C filers work for one or more firms and receive 1099-MISC forms that report their “non-employee compensation” instead of W-2s that report wages. These individuals report this compensation as gross receipts (per the instructions) and often report no deductions, or very minimal deductions that reflect elements of personal and business use, such as transportation, travel or meal expenses. Some of these filers are technically misclassified employees; others are correctly treated as independent contractors.4
• Individuals or entities might form partnerships to re-distribute earnings that are passed through from other partnerships. These entities are conduits that merely redistribute funds. Other partnerships might solely hold financial assets and receive interest, dividends or capital gains but conduct no business activity. These partnerships could be considered “passive investment vehicles.”
In many instances, these individuals are not substantially different than employees of the firm to whom they provide labor services.
• Certain C corporations could also be viewed as investment vehicles if they merely hold investments and conduct little or no business activity. Individuals could benefit from the graduated corporate rate structure (such as 15 or 25 percent) and minimize tax liability by remitting tax at the lower corporate rate and then retaining earnings in the corporation.5
• Certain individuals who file Form 1040 Schedule E, Part 1 might report minimal income due to the incidental rental of a vacation home.
• Individuals might attempt to claim a tax loss for activity that is properly characterized as a hobby, not a business.
The first step in our revised methodology is the development of criteria to separate business from non-business entities. To do this, we look to the tax code. Despite the stylized examples above, the distinction between business and non-business activity is not always clear, and the Internal Revenue Code (IRC) fails to provide explicit guidance because it does not define the term “trade or business.” In general, the IRC characterizes most activities carried on for a livelihood or for profit as a trade or business. If a taxpayer is engaged in a trade or business, then the taxpayer may deduct from gross income all “ordinary and necessary” expenses of carrying on the trade or business that are paid or incurred during the tax year.6 If there is uncertainty about whether an activity qualifies as a trade or business, then tax authorities will apply certain tests and consider the relevant facts and circumstances of individual taxpayers. This approach is referred to as the “hobby loss rules.” If an activity is deemed a hobby, and not a trade or business, then expense deductions are limited to the income produced by the activity so that hobby losses cannot offset other income. By contrast, there are no restrictions on active trade or business losses; they may be used to offset all other types of income, regardless of its source.7
4 For discussion of legal distinctions between misclassified employees and independent contractors, see, for example, the Administration’s FY12 Budget proposal, “Increase Certainty with Respect to Worker Classification.” “Worker classification generally is based on a common-law test for determining whether an employment relationship exists. The main determinant is whether the service recipient (employer) has the right to control not only the result of the worker’s services but also the means by which the worker accomplishes that result.” Department of the Treasury, February 2011, “General Explanations of the Administration’s Fiscal Year 2012 Revenue Proposals,” p. 107. See http://www.treasury.gov/resource-center/tax-policy/Documents/Final%20Greenbook%20Feb%202012.pdf . 5 Some such corporations might be subject to the personal holding company tax. 6 An expense is “necessary” if it is appropriate and helpful to the taxpayer’s business. An expense is “ordinary” if it is one that is common and accepted in the particular business activity. 7 Because of the passive activity loss rules, some taxpayers may not be able to deduct certain losses from trade or business activities in which they do not “materially participate.”
5
In order to distinguish hobby from business (i.e, for-profit) activities, tax authorities rely first on the historical profits test from IRC Section 183(d). This test states that, in general, an activity is presumed to be engaged in for profit if gross income from the activity exceeds the deductions attributable to such activity in any three of five consecutive tax years, including the current tax year. If an activity fails the historical profits test or the test is not applicable, then Section 1.183-2 of the Income Tax Regulations lists nine specific factors that may be used to distinguish business from hobby activity. They are as follows:
• The manner in which the taxpayer carries on the activity. o Was it a businesslike manner? Did the taxpayer keep accurate books and records?
• The expertise of the taxpayer. o Did the taxpayer prepare for the activity through the study of accepted business,
economic, and scientific practices? Did the taxpayer consult with experts? • The time and effort expended by the taxpayer in carrying on the activity. Was it “substantial”? • An expectation that assets used in the activity may appreciate in value. • The success of the taxpayer in carrying on other similar or dissimilar activities. • The taxpayer’s history of income or losses with respect to the activity. • The amount of occasional profits, if any, which are earned.
o The amount of profits in relation to the amount of losses incurred, and in relation to the amount of the taxpayer’s investment and the value of the assets used in the activity, may provide useful criteria in determining the taxpayer’s intent.
• The financial status of the taxpayer. Does the taxpayer have other sources of income? • Elements of personal pleasure or recreation.
We condense these nine factors into two general principles that we use to determine whether activity reported on business tax returns reflects “substantial” operations that are carried out in a “businesslike” manner. They are as follows:
• De Minimis Activity. Does the activity generate, or have the potential to generate, income that is non-negligible to the business owner(s)? Under this principle, very small entities would not qualify as a business, even though they may report income and deductions on the business return. For example, an individual who reports small amounts of rental income and expense on Schedule E from a two-month rental of a vacation home might not qualify as a business.
• Businesslike Activity. If the income is non-negligible, do the owners undertake actions that demonstrate “businesslike” activity? If they do, then they should report expenses related to employees, inventories, investment, office supplies, utilities, insurance or rent. Under this principle, Form 1040 Schedule C filers who report only their own labor compensation as gross receipts (e.g., certain service providers), but little or no expenses, would not qualify as business entities because most of those filers are not substantially different than employees of the firm who earn and report wage income. Entities that merely redistribute income or function as investment vehicles would also not qualify as business entities.
We convert these principles into two tests that we apply to all potential business returns. If an entity passes both tests, then we deem the entity a business. The two tests are as follows: De Minimis Test: Total income or total deductions exceed $10,000, or their sum exceeds $15,000.
6
Receiving income and incurring expenses can signal business activity. We apply our first test to income and deductions (or their sum) reported on the tax return to allow symmetric treatment of business activity. We eliminate entities that fail this test because the reported activity, regardless of its form or nature, does not generate substantial income to the owner(s) and it is unlikely that the activity required significant time and effort on the part of the owner(s). This test also eliminates many filers who are likely engaged in hobby activities. We define total income as the sum of all income reported on the business return including gross receipts, rents, dividends, capital gains, royalties, and interest.8 9
If an income source can be negative (e.g., a loss from the sale of business assets), then we use the absolute value so that it does not offset other types of income and because negative amounts also represent business activity. The definition of total deductions is discussed below.
Business Activity Test: Total deductions exceed $5,000. Our second test eliminates entities that only report income, with minimal or no deductions, such as pure labor providers or investment vehicles. The deduction floor we impose ensures that entities deemed a business operate in a "businesslike" manner through minimal outlays for investment (depreciation expenses), the carrying of inventories (cost of goods sold), employment of individuals, rents for buildings or equipment, or payments to other firms for goods or services. More broadly, the deduction floor generally requires that business income reflect more than a pure return to labor services provided by the owner(s). This requirement seems to reflect the intention of policymakers. When tax code provisions provide preferential treatment to small businesses, the provisions usually target expenses such as equipment investment (e.g., Section 179 expensing), cost of goods sold (e.g., exceptions to inventory accounting), and start-up costs. Preferential treatment is not targeted towards individuals who provide only labor services. Those individuals generally do not benefit from provisions targeted to small businesses in the tax code. For the purposes of our tests, we define total deductions as the sum of wages-salaries, interest paid, payments for goods and services purchased from other firms, rents, repairs, taxes, advertising, bad debts, depletion, depreciation, and other miscellaneous deductions reported by the entity. For corporations, we do not include payments for “compensation of officers” (line 12, Form 1120 or 1120S) because it is likely that those deductions represent the “reasonable compensation” that owners are required to pay themselves for labor services provided to the firm.10 11
8 For partnerships and S corporations, we include any gross rents reported on Form 8825, which partnerships and S corporations engaged primarily in rental real estate activity must file. Firms report gross rents plus any associated deductions on that form. Any net income is then carried over to the Schedule K submitted with Form 1065 (partnership) or 1120S (S corporation). We also include all other income and deduction items reported by those entities on Schedule K.
By excluding those deductions, we place corporations on equal footing with partnerships and sole proprietors. (General partners and sole proprietors do not report payments to themselves for services provided to the firm as a wage expense. All returns to labor and capital are included in residual profits and are subject to self-employment taxes.)
9 For the income test, we exclude any miscellaneous "other income" reported on the front page of business returns because that field may include amounts that are not properly viewed as income, such as refunds of federal and state fuel taxes (farmers and sole proprietors) or income passed through from partnerships that we already count (corporations). 10 If a corporation reports only payments for compensation of officers and no wages paid to employees, then we also disregard any deductions for employee benefit plans (generally health) and pension-profit sharing plans since those benefits likely accrue to the owner(s). 11 For partnerships, we exclude guaranteed payments to partners (line 10, Form 1065) for similar reasons.
7
We must observe deductions besides wage payments to corporate owners to consider an entity a business. We make one further adjustment to this test in cases where the sum of gross receipts and rents comprise less than ten percent of total income. In those cases, the entity essentially reports investment income only. To ensure those entities are not merely passive investment vehicles, we exclude interest expense from total deductions. Our tests would deem an entity that reports $50,000 of interest income and $20,000 of interest expense as a "non-business." For entities that primarily report investment income, we must observe other deductions besides interest expense to deem the entity a business. Note on Self-Employed Individuals Due to the thresholds we apply for our business tests, we include some and exclude other self-employed individuals from our business group. While it seems clear that individuals who report only income and no deductions might not be engaged in business activity as typically conceived (e.g., misclassified employees, certain independent contractors), it is less clear at what point those same individuals engage in sufficient ”businesslike” activity as evidenced by deductions and become business entities. For the purposes of this paper, we have set that threshold at $5,000. As we discuss in the next section, lowering that threshold does not alter our basic results and conclusions; it merely increases the number of very small business entities, most of whom are self-employed individuals. We apply the same business tests to self-employed individuals as applied to other businesses that employ individuals and have a separate business identity. Under our tests, an individual who earns a livelihood as a painter and reports $40,000 of income and $6,000 of supplies would qualify as a business entity and small business owner. An individual who sub-contracts as a consultant and reports $80,000 of income and $9,000 of related expenses would also qualify as a business entity. However, in either case, if reported deductions fell below $5,000, then our tests would not deem the self-employed individual a business entity. Results: Business vs. Non-Business Entities by Return Type The data used for this analysis are from the IRS Statistics of Income (SOI) individual and business tax files for tax year 2007. All tax files are stratified random samples weighted to represent national totals. For Schedules C, E, and F, the file contains roughly 325,000 individual income tax returns. Data for partnerships are from a sample of roughly 39,900 tax returns, while the S corporation sample includes 34,000 returns and the C corporation sample includes 61,600 returns.12
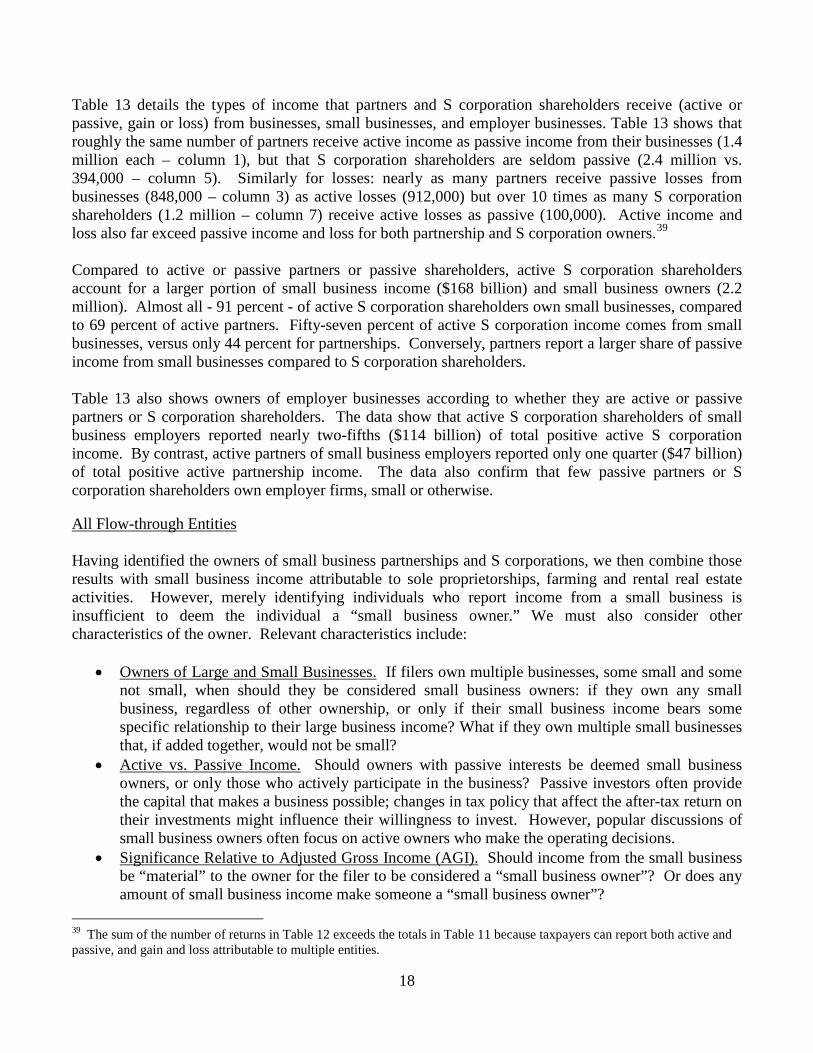
Table 1 presents data for all filers across the six business returns we examine, and results from the application of our two business tests. Results are as follows:
Form 1040, Schedule C: Sole Proprietors
12 For detailed discussion of the data and sample characteristics for individual tax returns, see Statistics of Income: Individual Income Tax Returns 2007, Publication 1304 (Rev. 07-2009), Internal Revenue Service, Department of the Treasury. Because of the sample construction, varying degrees of representation and potential error (relative to the population) are present across sample strata. For example, for Schedule C filers the sample fully represents the population for the highest income strata (for “$5 million under $10 million” and “$10 million or more”); at the lower income levels of under $30,000, a sample of 12,426 represents nearly 10 million returns of the population.

8
Individuals who file Schedule C may be engaged in a wide range of activities. While some filers operate businesses that provide their sole means of support, other filers report incidental activity in which they are engaged on a part-time or seasonal basis. Many filers do not operate a business, but rather supply labor or services to a firm in exchange for remuneration on an hourly or per-job basis. For this final group, the deductions they report may not represent outlays that need to be recouped via future sales of goods and services, but rather are expenses that will be quickly reimbursed by the firm that employs the individual. For example, a firm might pay a service provider a higher hourly wage than a comparable employee as reimbursement for travel expenses. Alternatively, a firm might directly reimburse a service provider if an itemized bill is presented for the same expenses. Regardless of the reimbursement method, the individual would report all remuneration as gross receipts on Schedule C, as well as any deductions associated with the provision of labor services. Common deductions for these filers are transportation and travel-meal expenses. In the situation just described, the individual may not be substantially different than an employee of the firm from which he or she receives compensation. Yet, at some point, these same individuals could also be considered a small business entity to the extent they do more than merely supply labor services. For example, the individual might also incur expenses related to inventories, advertising, office supplies, and the payment of utilities or rent. Those types of deductions provide a strong signal that the individual engages in businesslike activities such as itemizing and tracking expenses, the development of a business plan or the maintenance of a separate business address. Because many Schedule C filers could be viewed as quasi-employees of the firms to whom they provide labor or services, we discount, but do not disregard, certain deductions that are claimed intensively by those individuals: car-truck expenses (line 9, includes the standard mileage deduction) and travel, meals and entertainment (line 24).13 We discount those deductions by 50 percent because (1) they are claimed intensively by misclassified employees and independent contractors, (2) they are potentially a weaker signal of business activity and (3) it is likely that many of those deductions contain both personal and business elements. Therefore, if a Schedule C filer reports $3,000 of advertising expenses and $8,000 of car-truck expenses, then we set total deductions equal to $7,000.14
For tax year 2007, 23.2 million individuals filed a Schedule C, and 10.7 million (46 percent of total) qualify as a business based on our tests (see Table 1). Although we deem less than one-half of filers a business, those entities reported the vast majority of total income (94 percent, average income of $120,200) and net income (80 percent, average profit of $20,900). The proportion of filers that were profitable is the same for our business group (74 percent) compared to all Schedule C filers. The application of our two business tests eliminates 12.5 million Schedule C filers from our business group. Of the filers we exclude: 10.2 million filers failed the de minimis test and 2.3 million filers reported insufficient deductions to pass our second business test. The filers we exclude reported an average of $7,000 of total income and $4,600 of net income.15
13 For detailed instructions regarding the amounts that filers may claim for these expenses, see IRS Publication 463: Travel, Entertainment, Gift and Car Expenses.
14 This additional restriction eliminates approximately 700,000 Schedule C filers from our business group. Those filers reported average Schedule C total income of $15,800 and average net income of $7,900. 15 There is substantial overlap between our two business tests. Many filers eliminated under the de minimis test would also be eliminated under our second business test.
9
Table 2 provides additional detail regarding the sole proprietors we exclude from our business group based on total income reported on Schedule C. Most of these filers (81 percent) reported less than $10,000 of total income on Schedule C. Across all filers, Schedule C net income comprised only seven percent of Adjusted Gross Income (AGI) reported on Form 1040 (final column), suggesting that Schedule C business income was not significant for most filers we exclude. By comparison, wages and salaries comprised two-thirds of AGI and investment income comprised 22 percent of AGI (interest, dividends or capital gains, not shown in table). Although we exclude filers based on Schedule C income and deductions, 1.1 million filers reported $45 billion of rental, partnership or S corporation income on Schedule E. Given the average level of Schedule E income reported by these filers ($39,500), it is likely that most of the rental operations, partnerships or S corporations owned by those individuals will be included in our small business group, and their owners will ultimately be included in our tabulations of small business owners. Form 1040, Schedule E: Supplemental Income and Loss (Part 1), Rental Income Taxpayers report rental real estate activity on Part 1 of Form 1040, Schedule E.16
Unless the owner provides “substantial” services to the tenants or qualifies as a real estate professional, the IRS generally considers activity reported in Part 1 of Schedule E as a passive activity for the purposes of the passive activity loss rules. Therefore, taxpayers might face limitations on their use of losses attributable to such activity. Despite this treatment, we deem rental activity a business if it passes our tests because, much like a traditional business, the owners provide services (housing) to consumers (tenants). In that capacity, owners incur and report various business expenses, such as advertising, insurance, interest, repairs, and cleaning and maintenance.
However, in many cases, rental activity may not denote the conduct of an active trade or business. The rental activity may be incidental to personal use, or may not differ substantially from an investment in a financial asset, such as when an owner reports no expenses besides those associated with holding title to the property (i.e., mortgage interest, property taxes, and depreciation). Similar to our treatment of partnerships and corporations that invest in financial assets, we require that Schedule E rental filers evidence at least minimal active management of the property beyond deductions for mortgage interest, property taxes and depreciation. To ensure that individuals reporting rental income engage in minimal businesslike activity, we exclude depreciation and mortgage interest expenses from computed deductions.17
We require that owners report other types of expenses such as cleaning, advertising, maintenance or repairs that suggest active management of the properties.
For tax year 2007, 9.6 million individuals reported rental income on Part 1 of Schedule E, and reported total income of $255 billion (average income of $26,500) and net income of -$18 billion (average loss of -$1,800). The 4.6 million (48 percent of total) filers we deem a business reported total income of $212 billion (average income of $46,200) and net income of -$22 billion (average loss of -$4,800). The proportion of filers that were profitable is slightly lower for our business group (35 percent) compared to all filers (42 percent).
16 Royalty payments are also reported on Schedule E, Part 1. We do not include royalty income in our analysis because the income could represent compensation attributable to activity many years removed. 17 The data do not itemize property taxes separately.

10
The application of our two business tests eliminates 5.0 million Schedule E rental filers from our business group. Of the filers we exclude: 3.9 million filers failed our first de minimis business test and 1.1 million filers reported insufficient deductions. The filers we exclude reported an average of $8,400 of total income and $800 of net income. Form 1040, Schedule F: Profit or Loss from Farming When applying our business tests to farm income, we include income and expenses reported on Form 1040, Schedule F and Form 4835, Farm Rental Income and Expenses. Individuals use Form 4835 to report farm rental income based on crops or livestock produced by a tenant if they were the landowner (or sub-lessor) and did not materially participate in the operation or management of the farm. For the purpose of our business tests, we include any income from cooperative distributions, commodity credit corporation loans, and crop insurance proceeds in our definition of total income. For tax year 2007, 2.5 million individuals filed a Schedule F, a Form 4835, or both. Those filers reported total income of $134 billion (average income of $53,300, predominately sales of livestock or agricultural products) and -$13 billion of net income (average loss of -$5,300). The 1.4 million filers (56 percent of total) we deem a business reported total income of $130 billion (average income of $92,200) and net income of -$13 billion (average loss of -$9,200). The proportion of filers that were profitable is slightly lower for our business group (34 percent) compared to all filers (38 percent). The application of our two business tests eliminates 1.1 million Schedule F filers from our business group. Nearly all of those filers failed our first de minimis business test. The filers we exclude reported an average of $2,900 of total income and -$200 of net income. Form 1065: Partnerships For partnerships, we make two modifications to our business tests. We exclude any ordinary income received from another partnership, estate or trust (line 4, Form 1065) to eliminate double counting of income. As noted in the previous section, we also exclude any guaranteed payments to partners from our analysis. Both the deductions (line 10) and income amounts (Schedule K, line 4) reflect a return to partners for services provided and so are similar to distributions that partners receive. For partnership and S corporation tests and tabulations, we include all investment income and deductions reported separately on the Schedule K (except for guaranteed payments to partners).18
We also include gross rents and any deductions reported on Form 8825 (Rental Real Estate Income and Expenses of a Partnership or S Corporation). Partnerships and S corporations report rental income and associated deductions on Form 8825. The resultant net income is then transferred to Schedule K.
For tax year 2007, 3.1 million partnerships filed Form 1065. Those partnerships reported gross receipts of $3.9 trillion, gross rents of $424 billion (Form 8825), investment income of $1.8 trillion (Schedule K), and net income of $1.5 trillion (includes ordinary and investment income, average profit of
18 Partnerships and S corporations report investment (i.e., capital gains, dividends, and interest), royalty and rental income on Schedule K and not on the front page of the main form (Form 1065 or Form 1120S). Those amounts are reported separately because the apportionment rules for the owners may differ compared to the apportionment of ordinary business income. Income reported on the Schedule K retains its character when passed through to the partner or shareholder, and so might face different tax rates or limitations than distributions of ordinary business income. Deductions reported on the Schedule K include investment interest expense, the Section 179 expensing deduction and miscellaneous “other” deductions.
11
$488,300). The 2.3 million partnerships (74 percent of total) we deem a business reported gross receipts of $3.9 trillion, gross rents of $417 billion, investment income of $1.7 trillion and net income of $1.4 trillion (average profit of $615,300). The proportion of partnerships that were profitable is higher for our business group (61 percent) compared to all partnerships (57 percent). The application of our two business tests eliminates 0.8 million partnerships from our business group. Of the partnerships we exclude: 0.6 million failed our first de minimis business test, 0.1 million were deemed an investment vehicle and 0.1 million reported insufficient deductions. The partnerships we exclude reported an average of $155,700 of total income and $121,800 of net income. Form 1120S: S Corporations For tax year 2007, 4.0 million S corporations filed Form 1120S. Those corporations reported gross receipts of $6.0 trillion, gross rents of $39 billion (Form 8825), investment income of $290 billion (Schedule K), and net income of $424 billion (includes ordinary and investment income, average profit of $106,400). The 3.6 million corporations (89 percent of total) we deem a business reported gross receipts of $6.0 trillion, gross rents of $38 billion, investment income of $284 billion and net income of $419 billion (average profit of $117,900). The proportion of corporations that were profitable is higher for our business group (68 percent) compared to all corporations (64 percent). The application of our two business tests eliminates 0.4 million S corporations from our business group. Most of the corporations we exclude failed our first de minimis business test. The corporations we exclude reported an average of $17,700 of total income and $12,200 of net income. Form 1120: C Corporations For tax year 2007, 1.9 million C corporations filed Form 1120. Those corporations reported gross receipts of $18.2 trillion, gross rents of $102 billion, investment income of $3.7 trillion (mostly interest) and net income of $1.1 trillion (average profit of $568,700). The 1.6 million corporations (88 percent of total) we deem a business reported gross receipts of $18.2 trillion, gross rents of $102 billion, investment income of $3.7 trillion and net income of $1.1 trillion (average profit of $646,100). The proportion of corporations that were profitable is higher for our business group (54 percent) compared to all corporations (51 percent). The application of our two business tests eliminates 0.2 million C corporations from our business group. Most of the corporations we exclude failed our first de minimis business test. The corporations we exclude reported an average of $24,500 of total income and $10,600 of net income. At the bottom of Table 1, we show totals for all filers that qualify as a business based on the two tests we apply. We retain more than one half (55 percent) of all entities that file a business return. Those entities reported nearly all total income and net income of the full population of filers. On average, the entities we exclude reported $13,500 of total income and $8,200 of net income. Sensitivity to Business Tests In Table 3, we adjust the thresholds used for our two business tests to examine the sensitivity of our thresholds (labeled as Test 3). If we reduce our de minimis income and deduction threshold to $5,000 and reduce the deduction floor to $1,000 (Test 1), this does increase the number of business entities, but the additional entities are generally quite small. The greatest impact is for Schedule C filers. Using Test
12
1 thresholds, the number of Schedule C filers increases by 3.2 million relative to the thresholds we employ (Test 3). Those 3.2 million filers reported average total income of $11,200 and average net income of $5,400. Based on these results, our thresholds appear to serve their intended purpose: the elimination of small entities that are less likely to be engaged in businesslike activity, if at all. III. Identification of Small Businesses In the previous section, we applied two tests to separate filers into business and non-business groups. Those tests represent one possible method to distinguish businesses from other taxpayers, and we recognize that any such attempt must rely on subjective criteria. Similarly, there is no single definition or unique set of characteristics that should always be used to distinguish small businesses from their larger counterparts; an appropriate definition in one context might be inappropriate for other purposes. The tax code reflects this ambiguity because it contains no explicit definition of small business. Rather, various code sections grant favorable tax treatment to certain filers based on their level of investment, taxable income, or gross receipts. Some examples are as follows19
:
• Expensing of Investment. Under IRC Section 179, for qualified investment placed in service during tax year 2007 (the year from which our data are drawn), eligible firms could expense up to $125,000 of qualified investment (generally machinery, equipment and software); if firms had qualifying investment that exceeded $500,000, then the expensing deduction was phased-out dollar-for-dollar for investment above that limit. For 2008 and 2009, the limits were raised to $250,000 (expensing) and $800,000 (beginning of phase out); for 2010 and 2011, the limits were raised to $500,000 and $2 million, respectively. For 2012, the expensing limits decline to $125,000 and $500,000 (indexed for inflation from 2006). For 2013, the limits revert to $25,000 and $200,000.20
• Graduated Corporate Rates. C corporations face a graduated rate schedule based on their reported taxable income: 15 percent (taxable income less than $50,000), 25 percent ($50,000 to $75,000), 34 percent ($75,000 to $18.3 million, but certain income faces surcharges within that range to eliminate the benefit of lower rates) and 35 percent (greater than $18.3 million).
• Business Start-Up Costs. Under IRC Section 195, a business can elect to deduct up to $5,000 ($10,000 for 2010) of start-up expenditures in the taxable year in which the active trade or business begins. The $5,000/$10,000 amount is reduced dollar-for-dollar by the amount that cumulative start-up expenditures exceed $50,000 ($60,000 for 2010). Start-up expenditures that are not deductible in the year the active trade or business begins are, at the taxpayer's election, amortized over a 15-year period. Otherwise, taxpayers must capitalize those expenses.
• Cash Method Accounting. Under IRC Section 446, firms must use the same method of accounting for financial and tax purposes. In general, firms that maintain inventories must use the accrual method to compute taxable income. Section 448 prohibits corporations and partnerships with corporate partners from using cash method accounting. However, an exception
19 For descriptions of these and other tax code provisions that provide favorable tax treatment to businesses based on size, see Gary Guenther, “Small Business Tax Benefits: Overview of Current Law and Economic Justification,” CRS Report, April 19, 2010. 20 These limits reflect changes enacted by various acts, including The Small Business and Work Opportunity Tax Act of 2007, The Economic Stimulus Act of 2008, The American Recovery and Reinvestment Act of 2009, The Small Business Jobs Act of 2010, and The Tax Relief and Unemployment Insurance Reauthorization and Job Creation Act of 2010.
13
is made if average annual gross receipts from the prior three years is less than $5 million. IRS Revenue Procedure 2002-28 extends cash method accounting to firms in “non-inventory intensive” industries if they have average annual gross receipts that are less than $10 million.
• Simplified Dollar-Value LIFO. Businesses that maintain inventories generally use “first-in-first-out” (FIFO) or “last-in-first-out” (LIFO) inventory valuation methods. Under IRC Section 474, firms with average annual gross receipts of $5 million or less in the previous three years may use a simplified version dollar-value LIFO.
Because many tax code provisions use gross receipts to identify firms eligible for preferential treatment and because filers do not report the number of employees on their tax returns, we use a total income threshold to separate small businesses from their larger counterparts. We define total income as the sum of gross receipts, rents and any portfolio income reported by the firm.21 We set the small business threshold at $10 million of total income. Because deductions can reflect the scale of operations, we also require that total deductions not exceed $10 million.22
Table 4 presents results from the application of the $10 million total income and deduction threshold to all entities deemed a business in Table 1. The vast majority of entities deemed a business also qualify as a small business. However, small businesses reported less than one-fifth of gross receipts, approximately two-thirds of gross rental income, less than one-tenth of gross investment income and less than one-fifth of net income reported by all business entities. Not unexpectedly, small businesses reported a larger share of business losses (48 percent) than profits (23 percent). Tables 5 through 8 present small business tabulations based on total income, net income, industry, and employer/non-employer status. As shown by Table 5, slightly more than one-half of small businesses reported less than $50,000 of total income each; half of those businesses reported a tax loss for the year (not shown in table). At the other end of the spectrum, approximately 1.4 million small businesses (6 percent) reported more than $1 million of total income each. Only one-quarter of these larger firms reported a tax loss for the year. Table 6 presents small business tabulations based on net income. Approximately two-fifths of all small businesses reported a tax loss; another one-half reported a profit less than $50,000. For those businesses, gross receipts comprised the vast majority of their reported income. By comparison, only 0.5 percent of small businesses reported a profit in excess of $1 million. For those businesses, investment and rental income comprised roughly half of their reported income. Table 7 presents small business tabulations based on industry. One-half of small businesses are in the construction, real estate-rental or professional-technical sectors. Businesses in those sectors reported nearly two-fifths of total income and one-half of net income. Only the agriculture sector reported a tax loss, which was caused by Form 1040 Schedule F filers.
21 For these purposes, we include “other income” reported by the firm on the front page of the tax form or schedule. We continue to use absolute values for income fields that can be negative, such as sales of business assets. 22 If we double the small business threshold from $10 to $20 million, then we add approximately 110,000 entities that report average total income of $13.2 million and average net income of $1.1 million.
14
In Table 8, we separate small businesses into employer and non-employer groups. We classify a business as an “employer” if labor deductions exceed $10,000.23 For corporations, we continue to exclude payments to officers from labor expenses. For sole proprietors, we include expenses for “contract labor” (line 11, Schedule C) because much of those expenses relate to the employment of independent contractors who are similar to employees of the business.24 (Other business filers do not separately itemize expenses for contract labor.) To the extent that payments for contract labor are also reported as gross receipts on a business tax return by the recipients and the recipients are included in our small business group and counted as an employer, then the number of employers will be overstated. Finally, we count all Schedule E Rental Real Estate Income filers as non-employers, although it is possible that a small proportion have labor expenses in excess of our $10,000 threshold.25
Based on these criteria, we find that slightly more than one-fifth of small businesses qualify as an employer. Employers were considerably larger than non-employers, reporting average total income of $922,100, compared to $99,900 for non-employers, and average net income of $45,300, compared to $15,500 for non-employers. Table 9 presents small business tabulations for wage and depreciation deductions based on total income. Approximately three-fifths of corporations, one-quarter of partnerships and one-fifth of sole proprietors (excludes payments to contract labor) made any wage payment to labor employed directly by the firm. Total wages paid were $945 billion, an average of $174,200 per small business that reported any wage expense. Relative to all business entities regardless of size, small businesses reported 23 percent of total labor payments made to employees who were not owners/officers of the firm (not shown in table). Small corporations also made substantial wage payments to owners/officers of the firm ($278 billion) who should receive “reasonable compensation” for any services they provide.26 For the purposes of this analysis, we have not included those wage payments in our definition of net business income. Rather, we define business income as the residual income that accrues to owners after all expenses have been paid, including any wage payments to owners. For small corporate business owners, the distinction between returns to labor (wages or compensation of officers) and returns to capital (distributions or dividends) is somewhat arbitrary and will vary with the type of business entity.27 For example, C corporation owners have a greater incentive to pay themselves higher levels of reasonable wage compensation in order to avoid the double tax levied on corporate profits and dividend distributions. By contrast, S corporation owners likely minimize their overall tax liability by maximizing distributions from the corporation, thereby avoiding payroll taxes.28
23 For this purpose, we include deductions for wages-salaries reported on the front page of business returns, cost of labor (Schedule A, Cost of Goods Sold) and any wages-salaries reported by partnerships and S corporations on Form 8825.
Future analysis might explore the implications of
24 Per the Schedule C instructions: “Contract labor includes payments to persons you do not treat as employees (for example, independent contractors) for services performed for your trade or business. Do not include contract labor deducted elsewhere on your return, such as contract labor that is includible on line 17 (legal and professional services), 21 (repairs and maintenance), 26 (wages) or 37 (cost of labor, Schedule A).” 25 For Schedule E filers, we do not have the information necessary to make this computation. 26 The data do not perfectly distinguish between owners and non-owners. Some owners may receive payments classified as wages, while officers who are not owners may receive officer compensation. 27 For a more complete discussion of this issue, see Bull and Burnham, “Taxation of Capital and Labor: The Diverse Landscape by Entity Type,” National Tax Journal, September 2010, p. 397-412. 28 These different incentives appear to be borne out by tax data. Small S corporations report a much higher profit margin on sales compared to their C corporation counterparts, and most of the difference can be explained by payments for labor services, especially for officers/owners. This result holds generally even when we control for firm size and industry.

15
a more expansive definition of business income that includes wage compensation paid to corporate owners. The final columns of Table 9 show depreciation deductions reported by small businesses. Across all entities, depreciation deductions totaled $142 billion, an average of $15,100 per firm for firms that report a depreciation deduction. That total includes $47 billion of Section 179 expensing deductions, comprising nearly one-third of total depreciation deductions. Relative to all business entities regardless of size, small businesses reported 19 percent of total depreciation deductions (not shown in table). It is likely that the small business share of total investment is roughly similar. IV. Identifying Small Business Owners Having identified entities that meet our small business and employer criteria, the final step in our methodology is identifying the individuals who own those businesses. To do this, we link individual taxpayers to the businesses they own. This task is straightforward for Form 1040 Schedule C, E (rentals) and F filers because those schedules are filed with the individual’s income tax return. It is more complicated for individuals who report partnership and/or S corporation income because we must link the Form 1040 individual income tax return to the business return of the entities they own to ensure that the income is attributable to a small business. This linkage is made possible with newly accessible data from IRS’s Compliance Data Warehouse (CDW). The CDW stores unedited data from all tax returns – business, individual, and information – filed with the IRS. In the sections below, we first describe how we match partners and S corporation shareholders to the small business entities they own. Those matches are then combined with the data from Schedules C, E rental and F to show distributions of small business income and their owners by AGI and marginal tax rate groupings.29
Note on Owners of Small C Corporations In the tables from the previous section, we included C corporations in all small business tabulations. Using data from the CDW, it would be possible to link individuals to some of the C corporations they own by tracing dividends paid by those firms through to the individual income tax returns of their owners. However, the receipt of dividends is the only indicator of C corporation ownership in the data. In practice, many individuals do not receive dividends from the C corporations they own, making dividends a poor indicator of C corporation ownership. Many C corporations are unable to pay dividends because they report losses, which cannot be passed through to owners. Unlike S corporations, C corporations need not allocate for tax purposes all earnings to their owners. Tax data show that only a portion of their after-tax earnings are paid out to owners as dividends. Rather than pay dividends, owners might retain after-tax profits in the corporation and smooth their taxable income by distributing retained earnings when funds are needed most, such as when the business suffers a loss.30
29 Bull, Nelson, and Fisher, “Characteristics of Business Ownership: Overview for Passthrough Entities and Evidence on S Corporate Ownership from Linked Data,” forthcoming National Tax Journal, used similar IRS data linking S corporations to the individual Form 1040 and estate and trust Form 1041 tax returns of their owners. B-N-F started with the entity return and then found the return of the owner, whereas in this paper we start with the return of the individual and find the partnership and S corporation returns owned by those individuals.
In this manner, owners could minimize tax liability by making distributions during years they face lower
30 For example, small C corporations reporting a tax loss distributed more than $1.5 billion in cash distributions to owners in 2007.
16
marginal tax rates. Owners might also retain earnings to finance future capital outlays. Finally, if owners elect to distribute earnings to themselves as wage compensation rather than dividends, then the data generally do not allow us to readily distinguish employees who are owners from those who are not. For these reasons, the receipt of dividends is an imperfect indicator of C corporation ownership, and owners who report dividend distributions in any given year will not be representative of all C corporation owners. We therefore exclude small C corporation owners from the tabulations presented in this section. Identification of Small Business Partners and S Corporation Shareholders Individuals report their income or loss from partnerships and S corporations on Part II of Form 1040, Schedule E. Specifically, for each partnership or S corporation, they report the entity’s Employer Identification Number (EIN), the amount of ordinary business income or loss (including any net rental income), and whether the income is passive or active. They also report any Section 179 expense deductions that flowed through from their partnership or S corporation interests. We start with a list of Schedule E EINs prepared by SOI for the 2007 Individual Sole Proprietorship (INSOLE) tax file.31 For the 126,344 (unweighted) individuals who reported partnership or S corporation income on the 2007 INSOLE file, SOI recorded 1.14 million total EINs, an average of nine EINs per individual.32 (See Table 10, column 1.) Because many individuals were partners or shareholders in multiple entities, there were 526,511 distinct EINs; 377,609 reported as partnerships, 146,271 reported S corporations, and 2,631 reported sometimes as partnerships, sometimes as S corporations.33
We looked for the Partnership Form 1065 and S Corporation Form 1120S returns associated with these 526,511 unique EINs on the CDW and found 93 percent of the partnership EINs and 96 percent of the S corporation EINs. (Table 10, column 3.) We use these matches to identify the owners of entities that meet our small business definition.
Table 11 presents additional detail on the success of matching EINs reported on INSOLE to CDW entities. It shows the returns and income for partnership and S corporation gains and losses, according to whether the individual reported it as active or passive income. Unlike Table 10, these data are weighted to yield population totals.34
Overall, the EINs found on the CDW reflect 94 percent of partnership and 97 percent of S corporation net income or loss reported on the INSOLE Schedule E. Ninety-two percent of individuals reporting partnership income or loss, and 94 percent of those reporting S corporation income or loss have at least one of their partnership or S corporation EINs found on the CDW.
31 INSOLE is the primary file of individual income tax returns that SOI prepares annually and that the Treasury Department uses for tax analysis. The file is a nationally representative, stratified random sample of individual income tax returns filed during calendar year 2008. For more information on the sample, see “Description of the Sample,” Statistics of Income 2007, Individual Income Tax Returns, IRS 2009. 32 This unweighted average is high because high-income taxpayers, who typically have more holdings, are disproportionately represented in this unweighted data set. 33 These could reflect taxpayer error or they could be explained by partners or shareholders not being aware that entities had changed their form of organization. In particular, limited liability companies, which usually file partnership returns, can “check the box” to be treated as a corporation and then elect to be treated as an S corporation. 34 In general, we were somewhat more successful in finding the entity tax returns of (1) S corporation shareholders than partners, and (2) gains versus losses. With passive losses, this outcome might be attributable to reported losses that were previously disallowed from entities that no longer exist.
17
For the entity returns of the 493,993 EINs found on the CDW (Table 10), we applied our “business,” “small business,” and “employer” criteria described in Part II of this paper.35 Table 12 displays the (weighted) results from applying these criteria at the entity level and then following those designations through to business owners who file individual income tax returns.36 Overall, 99 percent of partnership and S corporation net income reported on Schedule E comes from firms meeting our “business” definition, and 49 percent comes from “small businesses.” (See column 2.) For partners, 84 percent of returns reporting 101 percent of net income are deemed a business entity based on our tests. (Columns 4 and 5.) Application of our small business thresholds reduces those figures to 71 percent and 46 percent, respectively. For S corporation shareholders, 89 percent of returns and 98 percent of net income were attributable to a business entity, while 85 percent of returns and 52 percent of net income were attributable to small businesses.37
Table 12 also highlights the partners and shareholders of entities that meet our business test, but are not small (generally gross receipts in excess of $10 million). Thirteen percent of partners and S corporation shareholders own businesses that are not small, but the net income they receive from those businesses represents half of all net partnership and S corporation income reported by individuals. (Individuals may own both small and not small businesses.38
) The tabulations show that a larger share of partners (18 percent) than S corporation shareholders (6 percent) own firms that are not small, and a somewhat larger share of partnership net income (55 percent) than S corporation net income (46 percent) comes from these larger businesses. However, the average net income for owners of larger S corporations is nearly $500,000, compared to $114,000 for partners in the larger partnerships.
The bottom of Table 12 shows results from applying our employer business definition to partnerships and S corporations. As shown, many more S corporation shareholders than partners own businesses that are employers – 2.0 million vs. 958,000 – representing 49 percent of S corporation shareholders, but only 23 percent of partners. For both forms of business, most income (76 and 79 percent) is attributable to employer firms. Although most employers are also small businesses (2.4 million, or 85 percent), small business employers account for less than half of the net income reported by employer firms ($132 billion, or 40 percent) and are roughly half as large based on average net income.
35 Because CDW data lack certain detail, we approximate the definitions using the variables available. The main gaps in the CDW data are (1) the absence of expense itemization from Form 8825 (Rental Real Estate Income and Expenses, only total available), (2) lack of separate itemization of labor costs embedded in cost of goods sold, (3) investment interest expense from the Schedule K, (4) certain Schedule D detail (Capital Gains and Losses, only net amounts are available), and (5) certain Form 4797 detail (Sales of Business Property, only net amounts are available). Because these fields are generally minimal for small businesses, this lack of detail has minor implications for our results. 36 The income figures reported on individual income tax returns differ from amounts reported by the entities and discussed in the earlier section of this paper for several reasons besides missing returns. Most importantly, for both partnerships and S corporations, the data here are only what is reported on Schedule E, ordinary trade or business and rental income. It does not include capital gains, interest, dividends and other portfolio income. In addition, not all owners are individuals, which is particularly true for partnerships. 37 The total number of returns exceeds the sum of the number of partners and S corporation shareholders in Table 11 because many taxpayers are both partners and S corporation shareholders. Indeed, while most partners or shareholders (70 percent) report only one EIN of either type on their Schedule E, 13 percent report both S corporation and partnership income or loss. Taxpayers with only one EIN account for 40 percent of partnership and S corporation net income; those with both an S corporation and a partnership EIN account for another 37 percent of net income. 38 Individuals may appear in both categories but business income appears only once, in its appropriate size category.
18
Table 13 details the types of income that partners and S corporation shareholders receive (active or passive, gain or loss) from businesses, small businesses, and employer businesses. Table 13 shows that roughly the same number of partners receive active income as passive income from their businesses (1.4 million each – column 1), but that S corporation shareholders are seldom passive (2.4 million vs. 394,000 – column 5). Similarly for losses: nearly as many partners receive passive losses from businesses (848,000 – column 3) as active losses (912,000) but over 10 times as many S corporation shareholders (1.2 million – column 7) receive active losses as passive (100,000). Active income and loss also far exceed passive income and loss for both partnership and S corporation owners.39
Compared to active or passive partners or passive shareholders, active S corporation shareholders account for a larger portion of small business income ($168 billion) and small business owners (2.2 million). Almost all - 91 percent - of active S corporation shareholders own small businesses, compared to 69 percent of active partners. Fifty-seven percent of active S corporation income comes from small businesses, versus only 44 percent for partnerships. Conversely, partners report a larger share of passive income from small businesses compared to S corporation shareholders. Table 13 also shows owners of employer businesses according to whether they are active or passive partners or S corporation shareholders. The data show that active S corporation shareholders of small business employers reported nearly two-fifths ($114 billion) of total positive active S corporation income. By contrast, active partners of small business employers reported only one quarter ($47 billion) of total positive active partnership income. The data also confirm that few passive partners or S corporation shareholders own employer firms, small or otherwise. All Flow-through Entities Having identified the owners of small business partnerships and S corporations, we then combine those results with small business income attributable to sole proprietorships, farming and rental real estate activities. However, merely identifying individuals who report income from a small business is insufficient to deem the individual a “small business owner.” We must also consider other characteristics of the owner. Relevant characteristics include:
• Owners of Large and Small Businesses. If filers own multiple businesses, some small and some not small, when should they be considered small business owners: if they own any small business, regardless of other ownership, or only if their small business income bears some specific relationship to their large business income? What if they own multiple small businesses that, if added together, would not be small?
• Active vs. Passive Income. Should owners with passive interests be deemed small business owners, or only those who actively participate in the business? Passive investors often provide the capital that makes a business possible; changes in tax policy that affect the after-tax return on their investments might influence their willingness to invest. However, popular discussions of small business owners often focus on active owners who make the operating decisions.
• Significance Relative to Adjusted Gross Income (AGI). Should income from the small business be “material” to the owner for the filer to be considered a “small business owner”? Or does any amount of small business income make someone a “small business owner”?
39 The sum of the number of returns in Table 12 exceeds the totals in Table 11 because taxpayers can report both active and passive, and gain and loss attributable to multiple entities.
19
Because there are no obvious answers to these questions, we use two possible definitions of small business owner. Under our “broad” definition, we include anyone who reports income or loss from an entity that meets our definition of small business. Under our “narrow” definition, we only include individuals whose active income or loss from small business represents at least 25 percent of their AGI; all passive income and losses are disregarded. Under both definitions, small business owners may also own large or even very large businesses. Results for Small Business Owners Tables 14 through 16 present our results by AGI class while Tables 17 and 18 use statutory marginal tax rates. Table 14 compares distributions of tax returns across six groups: all returns; returns with any flow-through net income; all business owners; small business owners under our broad and narrow definitions; and business owners with income or loss from businesses too big to be considered small under our definition. (Note that business owners in the last group – those with businesses too big to be considered small – may also own small businesses and be counted as small business owners.) For tax year 2007, three percent of all returns and 33 percent of AGI were reported by taxpayers with AGI over $200,000 (mean AGI of $625,000, median of $300,000). For taxpayers reporting any flow-through income, eight percent of taxpayers reporting 75 percent of net flow-through income reported AGI over $200,000 (mean AGI of $760,000, median of $325,000). If we restrict our focus to small business owners (broad definition), then 11 percent of returns reporting 64 percent of small business income reported AGI over $200,000 (mean AGI of $800,000, median of $335,000). Using the narrow definition of small business owner, eight percent of returns and 57 percent of narrowly defined small business income were reported by taxpayers in the upper income classes (mean AGI of $480,000, median of $315,000). Taxpayers owning any business too big to meet the broad definition of small business -- here called “owners of any larger business” – are more concentrated in the upper income groups (49 percent reported AGI over $200,000, with mean AGI of $1.7 million and median over $500,000) and reported more than 100 percent of the net income from larger businesses (because of net losses and small amounts of positive income reported by lower AGI classes). Table 15 compares recipients of any flow-through income to employer owners – owners of businesses that meet our definition of employer or small business employer (under the broad definition of small business owner). Of the 34.7 million taxpayers with flow-through income, 4.3 million own a business that is an employer, and 3.8 million of those taxpayers own small businesses. Overall, owners of small business employers and the income from those businesses are more concentrated in the upper income ranges than is true for small businesses in general. (Compare with Table 14.) Table 16 presents the sources of income by AGI class for small business owners under three definitions: broad, narrow, and small business employer. The right-hand columns show other sources of income for small business owners, such as wages and capital gains. The table highlights the importance of wages and other forms of income for all three sets of small business owners.40
This is less true under the narrow definition of small business owner because small business income must comprise at least 25 percent of AGI for those taxpayers.
40 Wages and salaries could include officer compensation for S corporation owners.

20
Tables 17 and 18 present statutory marginal tax rates faced by small business owners. They show the distribution of returns and net income for various types of taxpayers and small business owners with positive taxable income by their statutory marginal tax rate.41 42
We note that the tabulations in Tables 17 and 18 include all business losses passed through to taxpayers, as long as taxable income remains positive. It is appropriate to include both positive and negative sources of income – as long as the taxpayer reports positive taxable income -- because the tax value of losses varies with the taxpayer’s marginal tax rate. Tables 17 and 18 also separately break out taxpayers who have AMT liability and face marginal rates of 26 percent or 28 percent.
Table 17 shows that one percent of all taxpayers with positive taxable income faced the 33- or 35-percent marginal rate for tax year 2007. That share increases to three or four percent for taxpayers with any flow-through income and owners of small businesses (broad and narrow definitions). The share rises to 20 percent for owners of non-small businesses. In terms of income, a smaller share of net small business income went to taxpayers in the top brackets – 32 and 29 percent under the broad and narrow definitions, respectively – compared to 50 percent of all flow-through income. For owners of larger businesses, 86 percent of net income from those businesses went to taxpayers in the top two rate brackets.43
Table 18 shows similar distributions for owners of employer businesses. Owners of employer businesses are more concentrated in the top rate brackets than are recipients of flow-through income in general: 12 percent for all employers and 10 percent for small business employers, compared to three percent for all taxpayers with flow-through income. A larger share of net income from employer businesses goes to top-bracket taxpayers – 61 percent – than to either small business employers – 38 percent – or taxpayers with flow-through income in general – 50 percent. Comparison with Other Analyses To the extent that our analysis is similar to methodologies used by other studies, we find that the results are generally comparable. Specifically, the Joint Committee on Taxation (JCT) and the Urban-Brookings Tax Policy Center (TPC) have published estimates of taxpayers with any flow-through income who would fall into the 36 or 39.6 percent rate brackets in 2011 under the Administration’s FY11 Budget proposal to let the tax cuts expire for taxpayers with income over $200,000 (single returns) or $250,000 (joint returns):
41 The statutory marginal tax rate is the rate applicable to the last dollar of taxable income. That rate may or may not equal the “effective marginal tax rate” depending on certain phase-outs and credits. The effective marginal tax rate is equal to the change in tax liability associated with the last dollar of taxable income, divided by 100. The approach used by this technical paper is similar to that used by IRS’ Statistics of Income Division in their various individual income tax publications. 42 Tables 17 and 18 exclude filers who fail to report any positive taxable income (i.e., a zero percent statutory tax rate). For small business owners, zero taxable income could result from business losses that cannot be used to offset taxable income. Inclusion of those filers would effectively double count the impact of unused business losses for small business owners because our tabulations also reflect unused business losses carried forward from prior years that are used to offset current year taxable income. For all filers, this omission excludes 32.3 million filers reporting $198 billion of AGI. For our broad (narrow) definition of small business owner, 4.9 million (3.6 million) owners are excluded who reported -$37 billion (-$21 billion) of small business income. 43 For tax year 2007, the mean and median AGI for taxpayers in the top two tax brackets was $1.2 million and $500,000, respectively. For small business owners who faced the 33 or 35 percent tax rates, the mean and median AGI were $1.4 million and $600,000 (broad definition) or $750,000 and $475,000 (narrow definition). Top bracket taxpayers owning any larger businesses had mean AGI of $2.8 million and mean of $1.1 million.
21
• The staff of the Joint Committee on Taxation estimates that in 2011 just under 750,000 taxpayers
with net positive business income (3 percent of all taxpayers with net positive business income) will have marginal rates of 36 or 39.6 percent under the President’s proposal, and that 50 percent of the approximately $1 trillion of aggregate net positive business income will be reported on returns that have a marginal rate of 36 or 39.6 percent. 44
• The Tax Policy Center estimates that 3.2 percent of tax units reporting net positive business income would be affected by the “Administration’s upper-income tax proposals,” and those taxpayers would report 44 percent of positive business income (net negative business income is not included).45
Although the precise number of taxpayers with flow-through income (business income to the JCT or TPC) and the dollar amount of that income in the top rate brackets varies among the three analyses, the conclusions are broadly consistent: about three percent of taxpayers with flow-through income fall into the top rate brackets, either in 2007 or under proposed 2011 law, and they report a substantial share of all flow-through income (45 – 50 percent). Our analysis goes a step further and separates taxpayers who receive flow-through income into small business owners and others. We find that using flow-through income as a proxy for “small business owner” slightly understates the share of owners in the top rate brackets (4.3 percent of small business owners vs. 3.2 percent of all flow-through recipients) but considerably overstates the share of small business income under our broad definition (32 percent vs. 50 percent). Our analysis can also identify taxpayers who own employer and small employer businesses. We find that 14 percent of taxpayers reporting flow-through income or loss and positive taxable income own at least one business that meets our definition of “employer.” However, that figure increases to 51 percent for individuals in the two top rate brackets.46
For small business employers, the comparable figures are 12 and 37 percent.
V. Conclusion This technical paper presents a revised methodology to improve the identification of small businesses and their owners for the purpose of tax policy analysis. In the first section, we identify small businesses. We apply two tests to separate business from non-business entities. We then further sub-divide filers we identify as business entities into small and other businesses based on a $10 million gross income and deduction test. Overall, approximately 54 percent of filers across the six tax forms and schedules we consider meet the criteria we use to define a small business. Those entities reported 18 percent of total business income (average of $270,000) and 16 percent of net business income (average of $21,600) for tax year 2007. Approximately half of our small businesses reported total income less than $50,000, and almost 90 percent reported net income less than $50,000. Roughly half are in the real estate-rental,
44 Joint Committee on Taxation, Description of Revenue Provisions Contained in the President’s Fiscal Year 2011 Budget Proposal. JCS-2-10, August 16, 2010, p. 25. The measure of business income is the same as our measure of individual’s flow-through income, except that the JCT includes royalties, trusts and estates, and real estate mortgage investment conduits. 45 TPC includes non-filers and returns with zero taxable income in its base. Business income is defined as those who report an income or loss on Schedules C, E or F. Source: http://taxpolicycenter.org/numbers/Content/Excel/T10-0186.xls. 46 Calculations based on Table 18: column 5 divided by column 1.

22
construction or professional-scientific sectors. Based on our definition of employer (direct labor compensation exceeds $10,000), we find that slightly more than one-fifth of small businesses were also employers. In the second section, we apply our small business criteria to newly accessible tax data to link income reported by small businesses to their respective owner(s). We present results for two definitions of small business owner. Under our broad definition, we include any individual who reports flow-through income from a small business regardless of the relative significance of that income to the owner or its nature (active or passive). Under our narrow definition, we only count individuals as small business owners if their active net small business income comprises at least one quarter of their AGI. Due to data constraints, our prior methodology counted all taxpayers reporting flow-through income as small business owners. Using that approach, there are 34.7 million small business owners reporting $662 billion of net business income (average of $19,100) for tax year 2007. (See Table 14.) Eight percent of those filers (with three-quarters of the net business income) reported AGI over $200,000. Using our revised methodology and our broad definition of small business owner, we identify 20.0 million small business owners reporting $376 billion of net small business income (average of $18,800). Eleven percent of those filers (with nearly two-thirds of net small business income) reported AGI over $200,000. Using our narrow definition of small business owner, we identify 9.4 million filers reporting $335 billion of net small business income (average of $35,600) as small business owners. Eight percent of those filers (with 57 percent of net small business income) reported AGI over $200,000. Finally, we identify 1.2 million filers who owned businesses too large to be considered small; they reported $205 billion in net income from those businesses. (Many of those filers also own small businesses and are counted as small business owners using either our broad or narrow definition of owner.) In Table 17, we present tabulations based on the statutory marginal tax rate faced by filers we identify as small business owners. For those purposes, we only consider filers who report positive taxable income (but might report business losses). For tax year 2007, approximately one percent of all filers reporting sixteen percent of total AGI faced one of the two top statutory tax rates. If we only consider individuals who report any flow-through income, then three percent of filers reporting half of flow-through net income faced the top two tax rates. Using our broad definition of small business owner, four percent of filers reporting one-third of small business net income faced the top two tax rates. Using our narrow definition, those figures are four and 29 percent respectively. Our revised methodology reduces the relative share of small business income subject to the highest tax rate brackets because it excludes income passed through from business entities that reported income or deductions in excess of $10 million. Table 17 also shows that 20 percent of taxpayers owning any larger businesses, and $190 billion of net income, fall into the top two tax rate brackets. Although our methodology is but one approach that could be used to more accurately identify small business owners, we find that our basic conclusions are not sensitive to the tests we apply. Our analysis highlights the need for policymakers to more explicitly define the characteristics that distinguish a small business so that the impact of targeted tax provisions can be modeled appropriately.
Table 1: Business Versus Non-Business Filerstax year 2007, billions of dollars, thousands of filers
Total Income Detail Net Income DetailNumber Gross Gross Other Total Avg Total Pos Net Neg Net Net Avg Netof Filers Receipts Rents 1/ Income 2/ Income Income Income Income Income Income
Schedule C: Sole ProprietorsAll Filers 23,175 1,351 na 20 1,371 59,177 335 -55 280 12,069Business 10,684 1,266 na 18 1,284 120,209 268 -45 223 20,854Non-Business 12,491 85 na 2 87 6,974 66 -10 57 4,555
Schedule E: RentAll Filers 9,636 na 255 na 255 26,456 57 -74 -18 -1,825Business 4,593 na 212 na 212 46,238 38 -60 -22 -4,755Non-Business 5,043 na 43 na 43 8,442 18 -14 4 844
Schedule F: FarmersAll Filers 2,511 107 na 26 134 53,254 14 -27 -13 -5,295Business 1,415 106 na 25 130 92,194 12 -25 -13 -9,208Non-Business 1,095 2 na 1 3 2,940 2 -2 0 -239
Form 1065: PartnershipsAll Filers 3,096 3,900 424 1,848 6,172 1,993,325 1,857 -345 1,512 488,319Business 2,300 3,888 417 1,743 6,048 2,629,841 1,732 -317 1,415 615,282Non-Business 797 12 7 105 124 155,666 125 -28 97 121,771
Form 1120-S: S CorporationsAll Filers 3,990 5,974 39 290 6,302 1,579,574 509 -84 424 106,369Business 3,554 5,973 38 284 6,295 1,770,991 501 -82 419 117,914Non-Business 436 2 0 6 8 17,745 8 -2 5 12,167
Form 1120: C CorporationsAll Filers 1,865 18,243 102 3,666 22,011 11,800,554 1,308 -247 1,061 568,723Business 1,638 18,242 102 3,661 22,005 13,433,466 1,305 -247 1,058 646,119Non-Business 227 1 0 4 6 24,478 3 -1 2 10,566
TOTALAll Filers 44,273 29,576 819 5,850 36,245 818,678 4,079 -833 3,246 73,319Business 24,184 29,474 769 5,731 35,975 1,487,559 3,857 -776 3,080 127,375Non-Business 20,089 102 50 118 270 13,450 222 -56 166 8,243
1/ For partnerships and S corporations, includes any gross rents reported on Form 8825.2/ For partnerships and S corporations, includes all income reported on Schedule K, except net rental real estate income. For partnerships and all corporations, includes net capital gains, dividends, royalties, interest and miscellaneous other income.
23
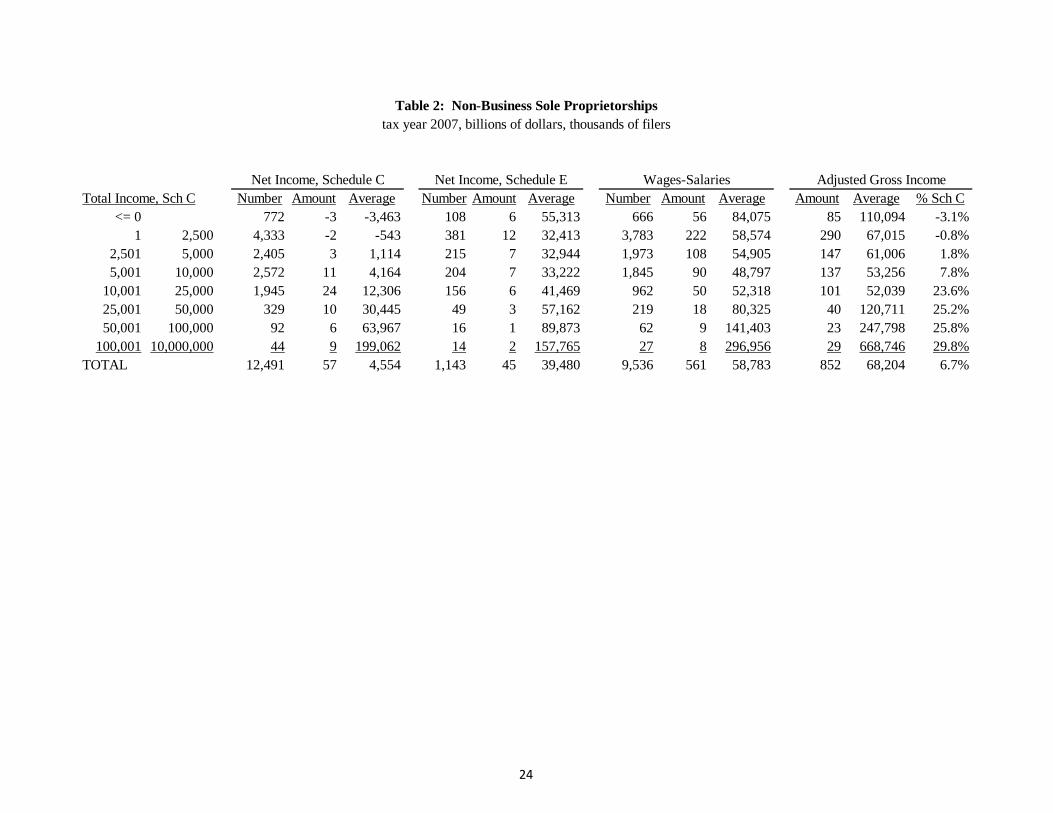
Table 2: Non-Business Sole Proprietorshipstax year 2007, billions of dollars, thousands of filers
Net Income, Schedule C Net Income, Schedule E Wages-Salaries Adjusted Gross IncomeTotal Income, Sch C Number Amount Average Number Amount Average Number Amount Average Amount Average % Sch C
<= 0 772 -3 -3,463 108 6 55,313 666 56 84,075 85 110,094 -3.1%1 2,500 4,333 -2 -543 381 12 32,413 3,783 222 58,574 290 67,015 -0.8%
2,501 5,000 2,405 3 1,114 215 7 32,944 1,973 108 54,905 147 61,006 1.8%5,001 10,000 2,572 11 4,164 204 7 33,222 1,845 90 48,797 137 53,256 7.8%
10,001 25,000 1,945 24 12,306 156 6 41,469 962 50 52,318 101 52,039 23.6%25,001 50,000 329 10 30,445 49 3 57,162 219 18 80,325 40 120,711 25.2%50,001 100,000 92 6 63,967 16 1 89,873 62 9 141,403 23 247,798 25.8%
100,001 10,000,000 44 9 199,062 14 2 157,765 27 8 296,956 29 668,746 29.8%TOTAL 12,491 57 4,554 1,143 45 39,480 9,536 561 58,783 852 68,204 6.7%
24

Table 3: Sensitivity to Business Thresholdstax year 2007, billions of dollars, thousands of filers
All Filers Test 1 Test 2 Test 3 Test 4
1. Income or Deductions > 5,000 10,000 10,000 20,0002. Sum of Income and Deductions > 7,500 15,000 15,000 30,0003. Deduction Floor 1,000 1,000 5,000 5,000
Schedule C: Sole ProprietorsNumber of Returns 23,175 13,856 11,667 10,684 8,643 Share of Total Returns 100% 60% 50% 46% 37%Total Income 1,371 1,320 1,309 1,284 1,259 Share of Total Income 100% 96% 95% 94% 92%
Schedule E: RentNumber of Returns 9,636 7,151 5,374 4,593 2,752 Share of Total Returns 100% 74% 56% 48% 29%Total Income 255 239 228 212 191 Share of Total Income 100% 94% 89% 83% 75%
Schedule F: FarmersNumber of Returns 2,511 1,794 1,448 1,415 1,017 Share of Total Returns 100% 71% 58% 56% 40%Total Income 132 130 129 128 126 Share of Total Income 100% 99% 98% 97% 95%
Form 1065: PartnershipsNumber of Returns 3,096 2,463 2,375 2,300 2,166 Share of Total Returns 100% 80% 77% 74% 70%Total Income 6,172 6,066 6,065 6,048 6,046 Share of Total Income 100% 98% 98% 98% 98%
Form 1120-S: S CorporationsNumber of Returns 3,990 3,689 3,591 3,554 3,408 Share of Total Returns 100% 92% 90% 89% 85%Total Income 6,302 6,298 6,298 6,295 6,293 Share of Total Income 100% 100% 100% 100% 100%
Form 1120: C CorporationsNumber of Returns 1,865 1,666 1,652 1,638 1,577 Share of Total Returns 100% 89% 89% 88% 85%Total Income 22,011 22,005 22,005 22,005 22,005 Share of Total Income 100% 100% 100% 100% 100%
TOTALNumber of Returns 44,273 30,619 26,108 24,184 19,563 Share of Total Returns 100% 69% 59% 55% 44%Total Income 36,243 36,059 36,034 35,975 35,919 Share of Total Income 100% 99% 99% 99% 99%
25
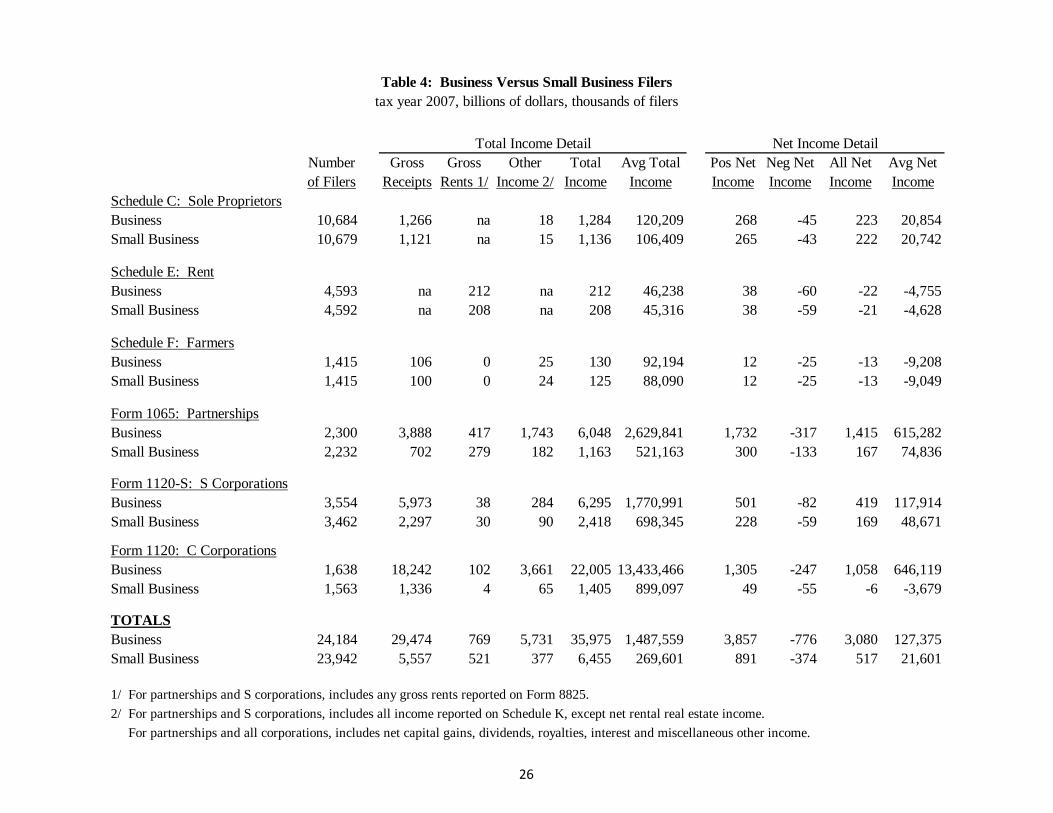
Table 4: Business Versus Small Business Filerstax year 2007, billions of dollars, thousands of filers
Total Income Detail Net Income DetailNumber Gross Gross Other Total Avg Total Pos Net Neg Net All Net Avg Netof Filers Receipts Rents 1/ Income 2/ Income Income Income Income Income Income
Schedule C: Sole ProprietorsBusiness 10,684 1,266 na 18 1,284 120,209 268 -45 223 20,854Small Business 10,679 1,121 na 15 1,136 106,409 265 -43 222 20,742
Schedule E: RentBusiness 4,593 na 212 na 212 46,238 38 -60 -22 -4,755Small Business 4,592 na 208 na 208 45,316 38 -59 -21 -4,628
Schedule F: FarmersBusiness 1,415 106 0 25 130 92,194 12 -25 -13 -9,208Small Business 1,415 100 0 24 125 88,090 12 -25 -13 -9,049
Form 1065: PartnershipsBusiness 2,300 3,888 417 1,743 6,048 2,629,841 1,732 -317 1,415 615,282Small Business 2,232 702 279 182 1,163 521,163 300 -133 167 74,836
Form 1120-S: S CorporationsBusiness 3,554 5,973 38 284 6,295 1,770,991 501 -82 419 117,914Small Business 3,462 2,297 30 90 2,418 698,345 228 -59 169 48,671
Form 1120: C CorporationsBusiness 1,638 18,242 102 3,661 22,005 13,433,466 1,305 -247 1,058 646,119Small Business 1,563 1,336 4 65 1,405 899,097 49 -55 -6 -3,679
TOTALSBusiness 24,184 29,474 769 5,731 35,975 1,487,559 3,857 -776 3,080 127,375Small Business 23,942 5,557 521 377 6,455 269,601 891 -374 517 21,601
1/ For partnerships and S corporations, includes any gross rents reported on Form 8825.2/ For partnerships and S corporations, includes all income reported on Schedule K, except net rental real estate income. For partnerships and all corporations, includes net capital gains, dividends, royalties, interest and miscellaneous other income.
26

Table 5: Small Business Detail by Total Incometax year 2007, billions of dollars, thousands of filers
Total Income Detail Net Income DetailNumber Gross Gross Other Total Avg Total Pos Net Neg Net All Net Avg Net
Reported Total Income Firms Receipts Rents 1/ Income 2/ Income Income Income Income Income Income< 0 132 1 0 -19 -18 -138,765 0 -31 -30 -230,692
0 25,000 8,178 68 38 5 111 13,591 17 -99 -82 -9,98525,001 50,000 4,220 107 41 5 153 36,204 41 -27 13 3,14450,001 75,000 2,134 97 31 5 133 62,199 36 -17 18 8,57175,001 100,000 1,519 113 21 10 144 94,539 36 -14 23 14,858
100,001 250,000 3,432 455 76 27 557 162,353 125 -38 86 25,201250,001 500,000 1,722 526 64 31 620 360,134 108 -31 77 44,865500,001 1,000,000 1,173 724 68 43 835 711,842 107 -35 73 61,982
1,000,001 5,000,000 1,244 2,301 150 173 2,623 2,108,715 288 -69 219 175,7475,000,001 10,000,000 188 1,164 33 99 1,297 6,890,590 133 -13 120 637,992
TOTAL 23,942 5,556 521 377 6,455 269,590 891 -373 517 21,601
1/ For partnerships and S corporations, includes any gross rents reported on Form 8825.2/ For partnerships and S corporations, includes all income reported on Schedule K, except net rental real estate income. For partnerships and all corporations, includes net capital gains, dividends, royalties, interest and miscellaneous other income.
27

Table 6: Small Business Detail by Reported Net Incometax year 2007, billions of dollars, thousands of filers
Total Income Detail Net Income DetailNumber Gross Gross Other Total Avg Total Pos Net Neg Net All Net Avg Net
Reported Net Income Firms Receipts Rents 1/ Income 2/ Income Income Income Income Income Income-10,000,000 -1,000,001 44 44 12 -6 50 1,129,172 0 -102 -102 -2,300,062-1,000,000 -100,001 484 368 58 12 437 904,098 0 -124 -124 -256,042
-100,000 -50,001 589 187 25 5 216 367,586 0 -41 -41 -68,874-50,000 -1 7,982 705 97 19 822 102,933 0 -107 -107 -13,383
0 25,000 9,315 1,156 70 31 1,258 135,073 85 0 85 9,09225,001 50,000 2,347 628 35 16 678 288,996 83 0 83 35,43750,001 100,000 1,578 715 46 19 779 493,652 111 0 111 70,191
100,001 250,000 1,029 818 64 33 914 888,971 159 0 159 154,159250,001 500,000 327 442 46 34 522 1,596,634 113 0 113 346,191500,001 1,000,000 139 281 34 35 351 2,530,207 96 0 96 694,560
1,000,001 10,000,000 109 212 35 179 427 3,919,741 244 0 244 2,240,228
TOTAL 23,942 5,556 521 377 6,455 269,606 891 -373 517 21,607
1/ For partnerships and S corporations, includes any gross rents reported on Form 8825.2/ For partnerships and S corporations, includes all income reported on Schedule K, except net rental real estate income. For partnerships and all corporations, includes net capital gains, dividends, royalties, interest and miscellaneous other income.
28

Table 7: Small Business Detail by Industrytax year 2007, billions of dollars, thousands of filers
Total Income Detail Net Income DetailNumber Gross Gross Other Total Avg Total Pos Net Neg Net All Net Avg NetFirms Receipts Rents 1/ Income 2/ Income Income Income Income Income Income
Agriculture 1,786 189 2 42 233 130,448 27 -33 -6 -3,487Mining-Utilities 133 55 0 9 64 483,952 16 -8 8 59,740Construction 2,609 923 3 13 939 359,866 77 -26 51 19,504Manufacturing 451 366 0 8 375 831,351 25 -16 9 19,785Wholesale 538 476 0 9 485 902,227 27 -9 19 34,386Retail 1,738 859 1 14 874 502,699 38 -20 17 9,835Transportation 1,019 230 1 7 238 233,676 20 -7 13 12,490Information 237 79 0 4 83 350,856 10 -10 0 715Financial 755 184 2 113 299 395,952 121 -31 90 119,527Real Estate and Rental 7,067 246 509 99 855 120,979 223 -139 84 11,880Professional and Technical 2,266 619 1 20 639 282,229 133 -25 107 47,287Administrative and Support 1,010 234 0 5 239 236,764 25 -7 18 18,039Educational Services 177 22 0 0 23 128,972 3 -1 2 10,108Health Care and Social Service 1,250 452 1 15 468 374,209 83 -9 74 59,096Arts and Entertainment 562 83 0 5 88 156,740 14 -8 6 9,950Accommodation and Food 627 297 1 7 306 487,774 21 -14 7 10,685All Other Services 1,718 239 0 7 247 143,529 28 -8 20 11,436
TOTAL 23,942 5,556 522 377 6,455 269,602 891 -373 517 21,600
1/ For partnerships and S corporations, includes any gross rents reported on Form 8825.2/ For partnerships and S corporations, includes all income reported on Schedule K, except net rental real estate income. For partnerships and all corporations, includes net capital gains, dividends, royalties, interest and miscellaneous other income.
29

Table 8: Small Business Employerstax year 2007, billions of dollars, thousands of filers
Total Income Detail Net Income DetailNumber Gross Gross Other Total Avg Total Pos Net Neg Net All Net Avg NetFirms Receipts Rents 1/ Income 2/ Income Income Income Income Income Income
Schedule C: Sole ProprietorsEmployers 1,659 572 0 6 579 348,739 91 -12 79 47,838Non-Employers 9,020 549 0 9 558 61,833 174 -32 142 15,760
Schedule E: Rent /3Employers 0 0 0 0 0 0 0 0 0 0Non-Employers 4,592 0 208 0 208 45,316 38 -59 -21 -4,628
Schedule F: FarmersEmployers 126 42 0 10 52 413,932 3 -6 -3 -20,734Non-Employers 1,289 58 0 15 73 56,342 8 -19 -10 -7,911
Form 1065: PartnershipsEmployers 533 514 102 32 648 1,215,281 92 -47 45 84,395Non-Employers 1,698 188 177 150 515 303,265 208 -86 122 71,834
Form 1120-S: S CorporationsEmployers 1,760 1,988 11 48 2,047 1,163,103 151 -41 110 62,672Non-Employers 1,702 309 19 43 371 217,803 77 -18 58 34,178
Form 1120: C CorporationsEmployers 864 1,186 3 42 1,232 1,424,937 33 -41 -8 -9,604Non-Employers 699 150 1 23 174 248,571 16 -13 3 3,636
TOTALEmployers 4,942 4,303 116 138 4,557 922,108 370 -146 224 45,276Non-Employers 19,000 1,253 406 239 1,898 99,887 520 -227 293 15,442
1/ For partnerships and S corporations, includes any gross rents reported on Form 8825.2/ For partnerships and S corporations, includes all income reported on Schedule K, except net rental real estate income. For partnerships and all corporations, includes net capital gains, dividends, royalties, interest and miscellaneous other income.3/ Schedule E Rental Income filers do not itemize expenses related to the employment of individuals. For the purposes of this table, we count all Schedule E filers as non-employers.
30
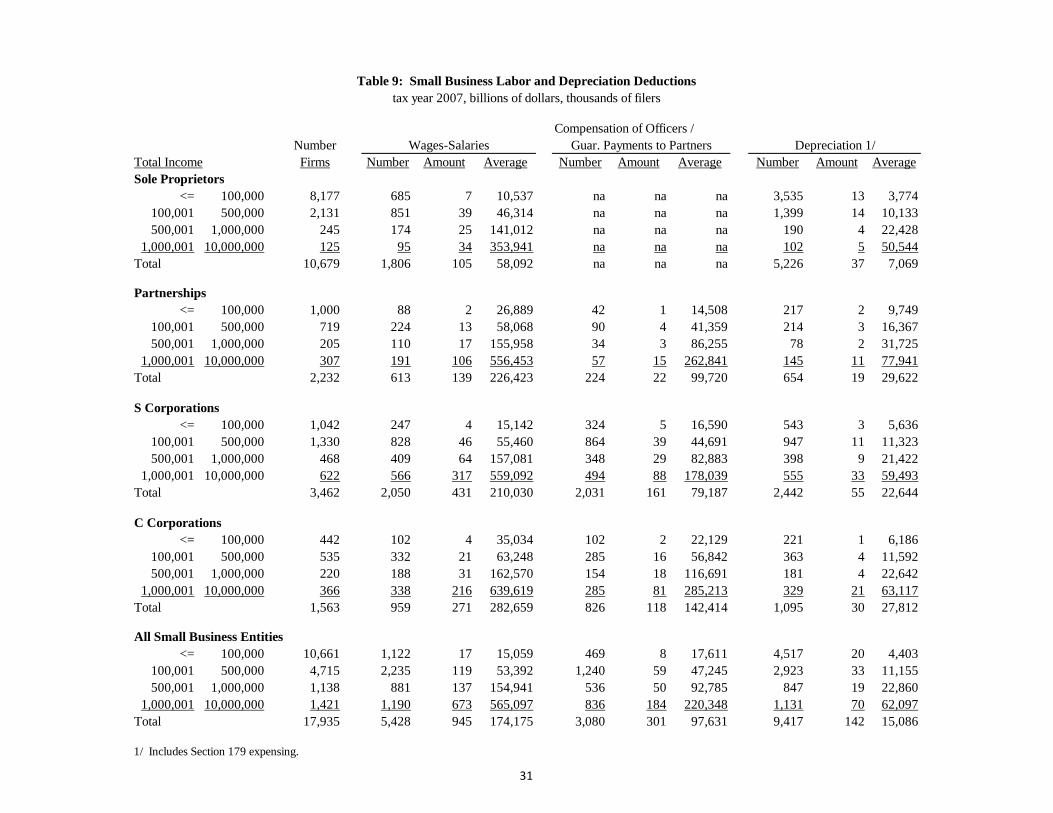
Table 9: Small Business Labor and Depreciation Deductionstax year 2007, billions of dollars, thousands of filers
Compensation of Officers /Number Wages-Salaries Guar. Payments to Partners Depreciation 1/
Total Income Firms Number Amount Average Number Amount Average Number Amount AverageSole Proprietors
<= 100,000 8,177 685 7 10,537 na na na 3,535 13 3,774100,001 500,000 2,131 851 39 46,314 na na na 1,399 14 10,133500,001 1,000,000 245 174 25 141,012 na na na 190 4 22,428
1,000,001 10,000,000 125 95 34 353,941 na na na 102 5 50,544Total 10,679 1,806 105 58,092 na na na 5,226 37 7,069
Partnerships<= 100,000 1,000 88 2 26,889 42 1 14,508 217 2 9,749
100,001 500,000 719 224 13 58,068 90 4 41,359 214 3 16,367500,001 1,000,000 205 110 17 155,958 34 3 86,255 78 2 31,725
1,000,001 10,000,000 307 191 106 556,453 57 15 262,841 145 11 77,941Total 2,232 613 139 226,423 224 22 99,720 654 19 29,622
S Corporations<= 100,000 1,042 247 4 15,142 324 5 16,590 543 3 5,636
100,001 500,000 1,330 828 46 55,460 864 39 44,691 947 11 11,323500,001 1,000,000 468 409 64 157,081 348 29 82,883 398 9 21,422
1,000,001 10,000,000 622 566 317 559,092 494 88 178,039 555 33 59,493Total 3,462 2,050 431 210,030 2,031 161 79,187 2,442 55 22,644
C Corporations<= 100,000 442 102 4 35,034 102 2 22,129 221 1 6,186
100,001 500,000 535 332 21 63,248 285 16 56,842 363 4 11,592500,001 1,000,000 220 188 31 162,570 154 18 116,691 181 4 22,642
1,000,001 10,000,000 366 338 216 639,619 285 81 285,213 329 21 63,117Total 1,563 959 271 282,659 826 118 142,414 1,095 30 27,812
All Small Business Entities<= 100,000 10,661 1,122 17 15,059 469 8 17,611 4,517 20 4,403
100,001 500,000 4,715 2,235 119 53,392 1,240 59 47,245 2,923 33 11,155500,001 1,000,000 1,138 881 137 154,941 536 50 92,785 847 19 22,860
1,000,001 10,000,000 1,421 1,190 673 565,097 836 184 220,348 1,131 70 62,097Total 17,935 5,428 945 174,175 3,080 301 97,631 9,417 142 15,086
1/ Includes Section 179 expensing.
31

Table 10: Overview of Matches - Number of EINs on INSOLE Schedule E Matched to Partnership and S Corporation Entity Returns on CDWtax year 2007, unweighted counts
From the Special Schedule E List of EINS
All, Returns or EINS All Matches Matches by Type of Entity
Non-matches: EINs not Found on CDW
Number Number Percent Partnership S Corp. Both Number Percent(1) (2) (3) (4) (5) (6) (7) (8)
1040 Returns 126,344
EINs EIN Listings - Total 1,141,963 Distinct EINS – Total 526,511 493,993 94% 349,403 144,385 205 32,518 6% EINs Reported on Sch. E as: Partnerships 377,609 351,861 93% 347,930 3,857 74 25,748 7% S Corporations 146,271 139,698 96% 679 138,902 117 6,573 5% Both 2,631 2,434 93% 794 1,626 14 197 8%
Notes: EIN = Employer Identification Number CDW = Compliance Data Warehouse INSOLE = Individual and Sole Proprietor file
32

Table 11: Ordinary Income of Partners and S Corporation Shareholders - on INSOLE, Schedule E EIN List, and CDW Matchestax year 2007, billions of dollars, thousands of returns
Active, Gross Gain Active, Gross Loss Passive, Gross Gain Passive, Gross Loss Net Income/LossReturns Amount Returns Amount Returns Amount Returns Amount Returns Amount
Individuals with Partnership Income or Loss 1/ 2/
INSOLE Returns 1,808 213 1,489 90 1,750 67 1,138 24 4,594 165CDW match 1,615 193 1,290 77 1,624 61 1,060 21 4,221 156
Match Rate 89% 91% 87% 86% 93% 92% 93% 89% 92% 94%
Individuals with S Corporation Income or Loss 1/ 2/
INSOLE Returns 2,615 309 1,577 73 578 42 203 5 4,429 273CDW match 2,473 296 1,439 67 538 40 184 5 4,152 265
Match Rate 95% 96% 91% 92% 93% 94% 91% 89% 94% 97%
1/ Includes returns with any partnership or S corporation EIN with any non-zero amounts in 4 types of income/loss. Exclude EINs where all income/loss pieces = 0.2/ Total Net Income/Loss is calculated before any deductions for section 179 expensing.
33
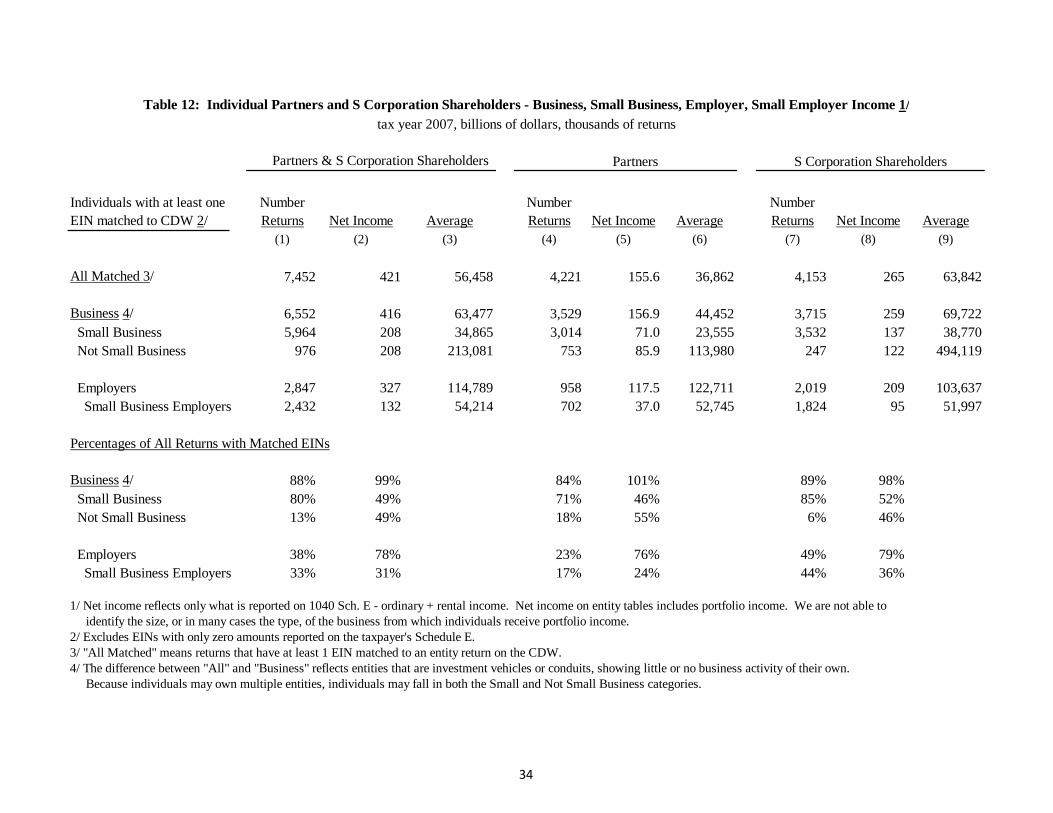
Table 12: Individual Partners and S Corporation Shareholders - Business, Small Business, Employer, Small Employer Income 1/tax year 2007, billions of dollars, thousands of returns
Partners & S Corporation Shareholders Partners S Corporation Shareholders
Individuals with at least one EIN matched to CDW 2/
Number Returns Net Income Average
Number Returns Net Income Average
Number Returns Net Income Average
(1) (2) (3) (4) (5) (6) (7) (8) (9)
All Matched 3/ 7,452 421 56,458 4,221 155.6 36,862 4,153 265 63,842
Business 4/ 6,552 416 63,477 3,529 156.9 44,452 3,715 259 69,722 Small Business 5,964 208 34,865 3,014 71.0 23,555 3,532 137 38,770 Not Small Business 976 208 213,081 753 85.9 113,980 247 122 494,119
Employers 2,847 327 114,789 958 117.5 122,711 2,019 209 103,637 Small Business Employers 2,432 132 54,214 702 37.0 52,745 1,824 95 51,997
Percentages of All Returns with Matched EINs
Business 4/ 88% 99% 84% 101% 89% 98% Small Business 80% 49% 71% 46% 85% 52% Not Small Business 13% 49% 18% 55% 6% 46%
Employers 38% 78% 23% 76% 49% 79% Small Business Employers 33% 31% 17% 24% 44% 36%
1/ Net income reflects only what is reported on 1040 Sch. E - ordinary + rental income. Net income on entity tables includes portfolio income. We are not able to identify the size, or in many cases the type, of the business from which individuals receive portfolio income.2/ Excludes EINs with only zero amounts reported on the taxpayer's Schedule E.3/ "All Matched" means returns that have at least 1 EIN matched to an entity return on the CDW.4/ The difference between "All" and "Business" reflects entities that are investment vehicles or conduits, showing little or no business activity of their own. Because individuals may own multiple entities, individuals may fall in both the Small and Not Small Business categories.
34
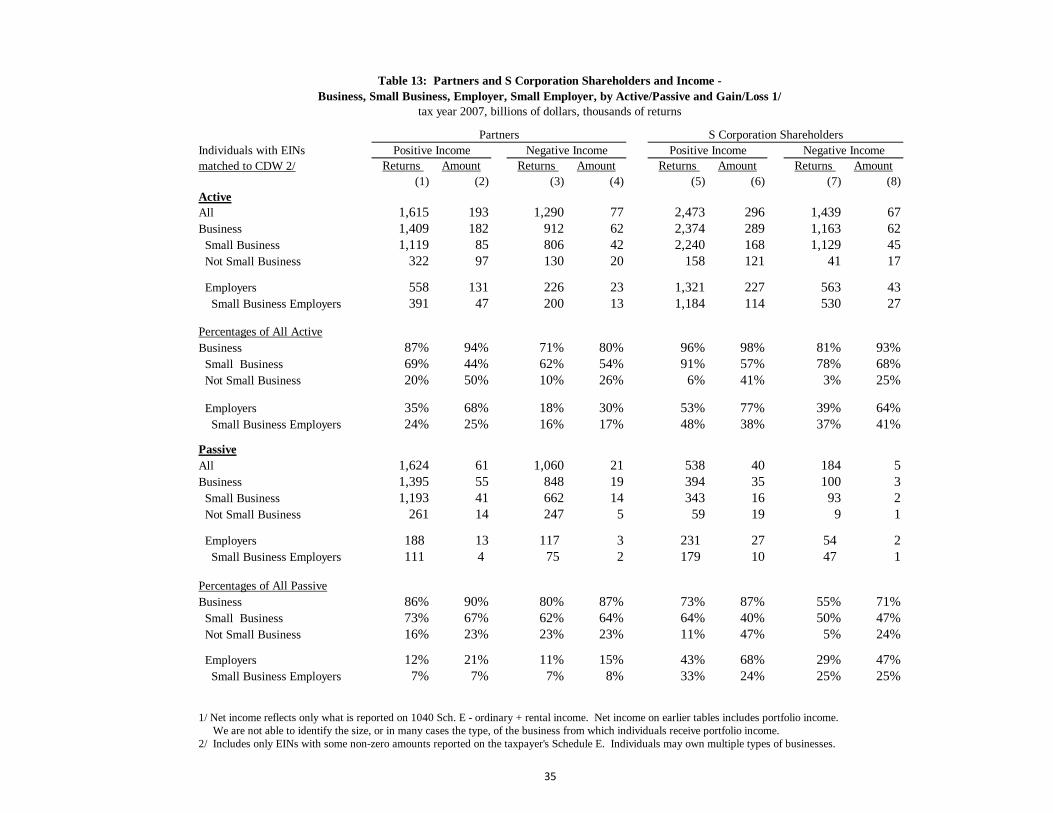
Individuals with EINs matched to CDW 2/ Returns Amount Returns Amount Returns Amount Returns Amount
(1) (2) (3) (4) (5) (6) (7) (8)ActiveAll 1,615 193 1,290 77 2,473 296 1,439 67Business 1,409 182 912 62 2,374 289 1,163 62 Small Business 1,119 85 806 42 2,240 168 1,129 45 Not Small Business 322 97 130 20 158 121 41 17
Employers 558 131 226 23 1,321 227 563 43 Small Business Employers 391 47 200 13 1,184 114 530 27
Percentages of All ActiveBusiness 87% 94% 71% 80% 96% 98% 81% 93% Small Business 69% 44% 62% 54% 91% 57% 78% 68% Not Small Business 20% 50% 10% 26% 6% 41% 3% 25%
Employers 35% 68% 18% 30% 53% 77% 39% 64% Small Business Employers 24% 25% 16% 17% 48% 38% 37% 41%
PassiveAll 1,624 61 1,060 21 538 40 184 5Business 1,395 55 848 19 394 35 100 3 Small Business 1,193 41 662 14 343 16 93 2 Not Small Business 261 14 247 5 59 19 9 1
Employers 188 13 117 3 231 27 54 2 Small Business Employers 111 4 75 2 179 10 47 1
Percentages of All PassiveBusiness 86% 90% 80% 87% 73% 87% 55% 71% Small Business 73% 67% 62% 64% 64% 40% 50% 47% Not Small Business 16% 23% 23% 23% 11% 47% 5% 24%
Employers 12% 21% 11% 15% 43% 68% 29% 47% Small Business Employers 7% 7% 7% 8% 33% 24% 25% 25%
1/ Net income reflects only what is reported on 1040 Sch. E - ordinary + rental income. Net income on earlier tables includes portfolio income. We are not able to identify the size, or in many cases the type, of the business from which individuals receive portfolio income.2/ Includes only EINs with some non-zero amounts reported on the taxpayer's Schedule E. Individuals may own multiple types of businesses.
Table 13: Partners and S Corporation Shareholders and Income -
Partners S Corporation ShareholdersPositive Income Negative Income Positive Income Negative Income
tax year 2007, billions of dollars, thousands of returnsBusiness, Small Business, Employer, Small Employer, by Active/Passive and Gain/Loss 1/
35
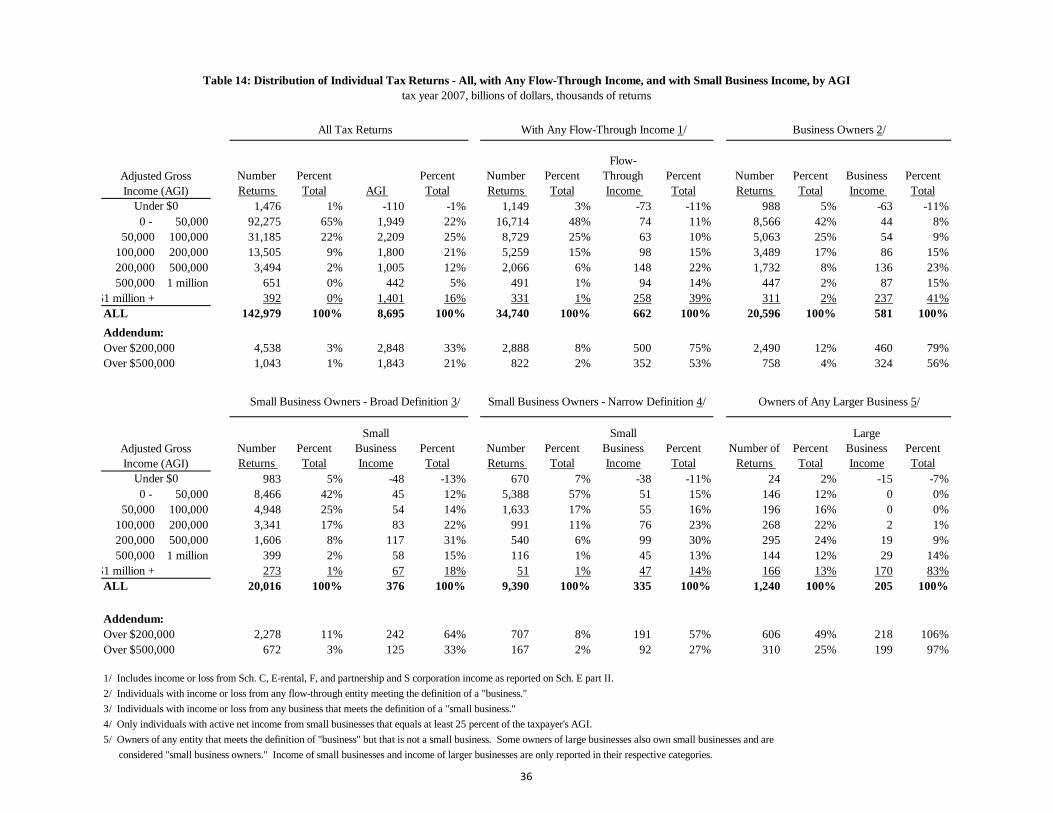
Table 14: Distribution of Individual Tax Returns - All, with Any Flow-Through Income, and with Small Business Income, by AGItax year 2007, billions of dollars, thousands of returns
All Tax Returns With Any Flow-Through Income 1/ Business Owners 2/
Number Returns
Percent Total AGI
Percent Total
Number Returns
Percent Total
Flow-Through Income
Percent Total
Number Returns
Percent Total
Business Income
Percent Total
Under $0 1,476 1% -110 -1% 1,149 3% -73 -11% 988 5% -63 -11%0 - 50,000 92,275 65% 1,949 22% 16,714 48% 74 11% 8,566 42% 44 8%
50,000 100,000 31,185 22% 2,209 25% 8,729 25% 63 10% 5,063 25% 54 9%100,000 200,000 13,505 9% 1,800 21% 5,259 15% 98 15% 3,489 17% 86 15%200,000 500,000 3,494 2% 1,005 12% 2,066 6% 148 22% 1,732 8% 136 23%500,000 1 million 651 0% 442 5% 491 1% 94 14% 447 2% 87 15%
$1 million + 392 0% 1,401 16% 331 1% 258 39% 311 2% 237 41%ALL 142,979 100% 8,695 100% 34,740 100% 662 100% 20,596 100% 581 100%Addendum:Over $200,000 4,538 3% 2,848 33% 2,888 8% 500 75% 2,490 12% 460 79%Over $500,000 1,043 1% 1,843 21% 822 2% 352 53% 758 4% 324 56%
Small Business Owners - Broad Definition 3/ Small Business Owners - Narrow Definition 4/ Owners of Any Larger Business 5/
Number Returns
Percent Total
Small Business Income
Percent Total
Number Returns
Percent Total
Small Business Income
Percent Total
Number of Returns
Percent Total
Large Business Income
Percent Total
Under $0 983 5% -48 -13% 670 7% -38 -11% 24 2% -15 -7%0 - 50,000 8,466 42% 45 12% 5,388 57% 51 15% 146 12% 0 0%
50,000 100,000 4,948 25% 54 14% 1,633 17% 55 16% 196 16% 0 0%100,000 200,000 3,341 17% 83 22% 991 11% 76 23% 268 22% 2 1%200,000 500,000 1,606 8% 117 31% 540 6% 99 30% 295 24% 19 9%500,000 1 million 399 2% 58 15% 116 1% 45 13% 144 12% 29 14%
$1 million + 273 1% 67 18% 51 1% 47 14% 166 13% 170 83%ALL 20,016 100% 376 100% 9,390 100% 335 100% 1,240 100% 205 100%
Addendum:Over $200,000 2,278 11% 242 64% 707 8% 191 57% 606 49% 218 106%Over $500,000 672 3% 125 33% 167 2% 92 27% 310 25% 199 97%
1/ Includes income or loss from Sch. C, E-rental, F, and partnership and S corporation income as reported on Sch. E part II.2/ Individuals with income or loss from any flow-through entity meeting the definition of a "business."3/ Individuals with income or loss from any business that meets the definition of a "small business."4/ Only individuals with active net income from small businesses that equals at least 25 percent of the taxpayer's AGI.5/ Owners of any entity that meets the definition of "business" but that is not a small business. Some owners of large businesses also own small businesses and are considered "small business owners." Income of small businesses and income of larger businesses are only reported in their respective categories.
Adjusted Gross Income (AGI)
Adjusted Gross Income (AGI)
36
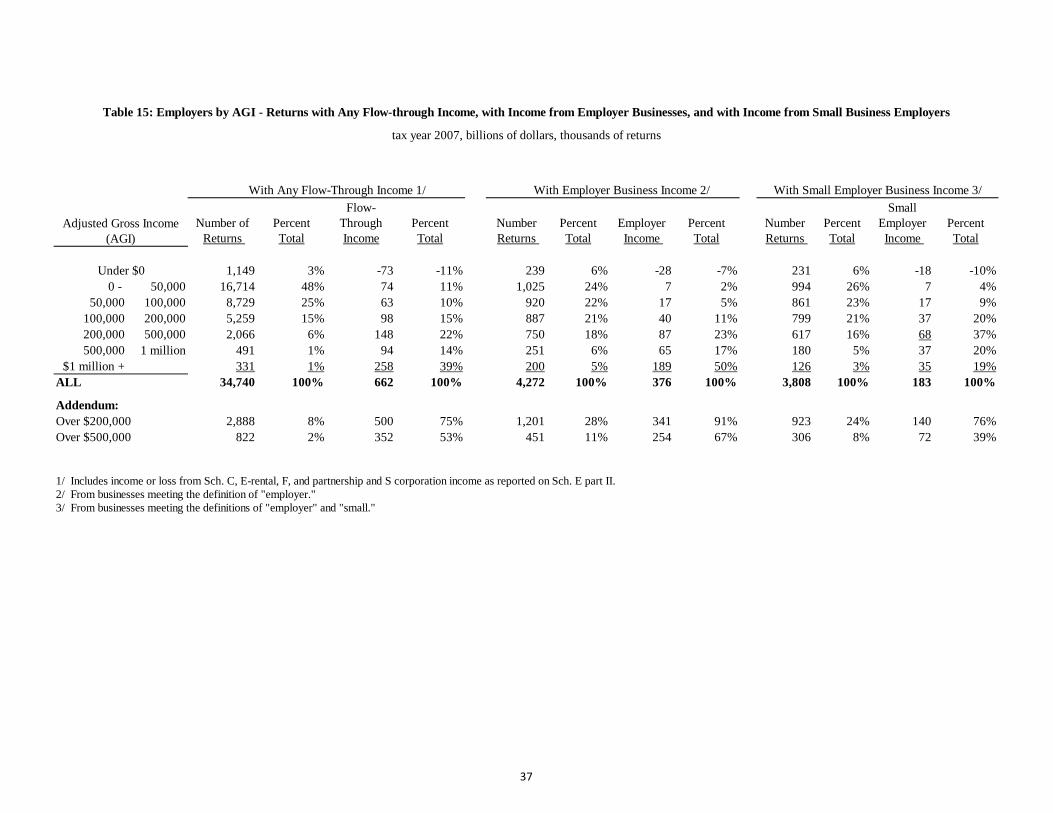
Table 15: Employers by AGI - Returns with Any Flow-through Income, with Income from Employer Businesses, and with Income from Small Business Employers
tax year 2007, billions of dollars, thousands of returns
With Any Flow-Through Income 1/ With Employer Business Income 2/ With Small Employer Business Income 3/
Number of Returns
Percent Total
Flow-Through Income
Percent Total
Number Returns
Percent Total
Employer Income
Percent Total
Number Returns
Percent Total
Small Employer Income
Percent Total
Under $0 1,149 3% -73 -11% 239 6% -28 -7% 231 6% -18 -10%0 - 50,000 16,714 48% 74 11% 1,025 24% 7 2% 994 26% 7 4%
50,000 100,000 8,729 25% 63 10% 920 22% 17 5% 861 23% 17 9%100,000 200,000 5,259 15% 98 15% 887 21% 40 11% 799 21% 37 20%200,000 500,000 2,066 6% 148 22% 750 18% 87 23% 617 16% 68 37%500,000 1 million 491 1% 94 14% 251 6% 65 17% 180 5% 37 20%
$1 million + 331 1% 258 39% 200 5% 189 50% 126 3% 35 19%ALL 34,740 100% 662 100% 4,272 100% 376 100% 3,808 100% 183 100%
Addendum:Over $200,000 2,888 8% 500 75% 1,201 28% 341 91% 923 24% 140 76%Over $500,000 822 2% 352 53% 451 11% 254 67% 306 8% 72 39%
1/ Includes income or loss from Sch. C, E-rental, F, and partnership and S corporation income as reported on Sch. E part II.2/ From businesses meeting the definition of "employer."3/ From businesses meeting the definitions of "employer" and "small."
Adjusted Gross Income (AGI)
37
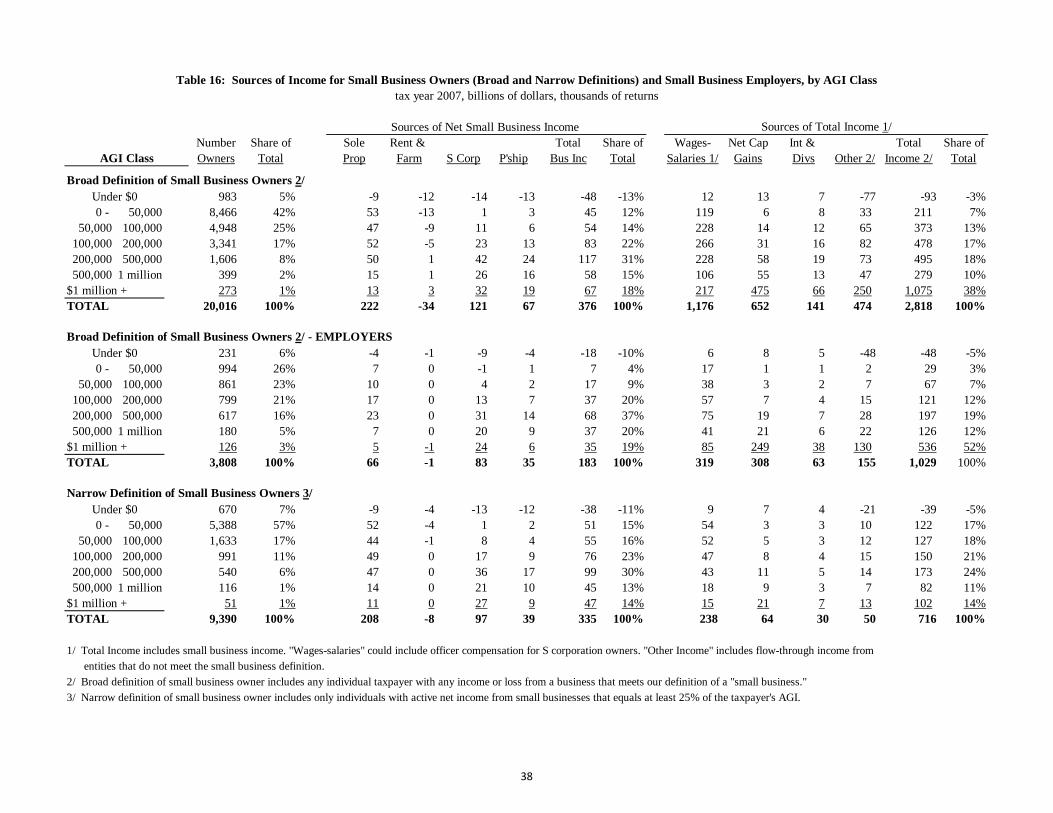
Table 16: Sources of Income for Small Business Owners (Broad and Narrow Definitions) and Small Business Employers, by AGI Classtax year 2007, billions of dollars, thousands of returns
Sources of Net Small Business Income Sources of Total Income 1/Number Share of Sole Rent & Total Share of Wages- Net Cap Int & Total Share of
AGI Class Owners Total Prop Farm S Corp P'ship Bus Inc Total Salaries 1/ Gains Divs Other 2/ Income 2/ Total
Broad Definition of Small Business Owners 2/Under $0 983 5% -9 -12 -14 -13 -48 -13% 12 13 7 -77 -93 -3%0 - 50,000 8,466 42% 53 -13 1 3 45 12% 119 6 8 33 211 7%
50,000 100,000 4,948 25% 47 -9 11 6 54 14% 228 14 12 65 373 13%100,000 200,000 3,341 17% 52 -5 23 13 83 22% 266 31 16 82 478 17%200,000 500,000 1,606 8% 50 1 42 24 117 31% 228 58 19 73 495 18%500,000 1 million 399 2% 15 1 26 16 58 15% 106 55 13 47 279 10%
$1 million + 273 1% 13 3 32 19 67 18% 217 475 66 250 1,075 38%TOTAL 20,016 100% 222 -34 121 67 376 100% 1,176 652 141 474 2,818 100%
Broad Definition of Small Business Owners 2/ - EMPLOYERSUnder $0 231 6% -4 -1 -9 -4 -18 -10% 6 8 5 -48 -48 -5%0 - 50,000 994 26% 7 0 -1 1 7 4% 17 1 1 2 29 3%
50,000 100,000 861 23% 10 0 4 2 17 9% 38 3 2 7 67 7%100,000 200,000 799 21% 17 0 13 7 37 20% 57 7 4 15 121 12%200,000 500,000 617 16% 23 0 31 14 68 37% 75 19 7 28 197 19%500,000 1 million 180 5% 7 0 20 9 37 20% 41 21 6 22 126 12%
$1 million + 126 3% 5 -1 24 6 35 19% 85 249 38 130 536 52%TOTAL 3,808 100% 66 -1 83 35 183 100% 319 308 63 155 1,029 100%
Narrow Definition of Small Business Owners 3/ Under $0 670 7% -9 -4 -13 -12 -38 -11% 9 7 4 -21 -39 -5%0 - 50,000 5,388 57% 52 -4 1 2 51 15% 54 3 3 10 122 17%
50,000 100,000 1,633 17% 44 -1 8 4 55 16% 52 5 3 12 127 18%100,000 200,000 991 11% 49 0 17 9 76 23% 47 8 4 15 150 21%200,000 500,000 540 6% 47 0 36 17 99 30% 43 11 5 14 173 24%500,000 1 million 116 1% 14 0 21 10 45 13% 18 9 3 7 82 11%
$1 million + 51 1% 11 0 27 9 47 14% 15 21 7 13 102 14%TOTAL 9,390 100% 208 -8 97 39 335 100% 238 64 30 50 716 100%
1/ Total Income includes small business income. "Wages-salaries" could include officer compensation for S corporation owners. "Other Income" includes flow-through income from entities that do not meet the small business definition.2/ Broad definition of small business owner includes any individual taxpayer with any income or loss from a business that meets our definition of a "small business."3/ Narrow definition of small business owner includes only individuals with active net income from small businesses that equals at least 25% of the taxpayer's AGI.
38

Table 17: Distribution of Individual Tax Returns with Positive Taxable Income by Statutory Marginal Tax Rate 1/ and Type of Income
tax year 2007, billions of dollars, thousands of returns
All Tax Returns With Any Flow-Through Inc.1/ Business Owners 2/
Statutory Marginal Tax Rate 1/
Number Returns
Percent Total AGI
Percent Total
Number Returns
Percent Total
Flow-Through Income
Percent Total
Number Returns
Percent Total
Business Income
Percent Total
10% 27,575 25% 554 7% 4,676 18% 22 3% 2,628 17% 16 2%15% 50,542 46% 2,362 28% 10,498 41% 63 9% 5,759 37% 53 8%25% 23,547 21% 2,109 25% 6,144 24% 78 11% 3,639 23% 67 11%28% 3,692 3% 565 7% 1,408 5% 44 6% 1,008 6% 39 6%33% 512 0% 134 2% 302 1% 25 4% 249 2% 22 4%35% 679 1% 1,242 15% 521 2% 329 47% 481 3% 301 48%AMT 26% 1,164 1% 154 2% 486 2% 9 1% 357 2% 8 1%AMT 28% 2,996 3% 1,376 16% 1,849 7% 136 19% 1,580 10% 127 20%ALL 110,707 100% 8,497 100% 25,884 100% 705 100% 15,701 100% 632 100%Addendum:33 & 35% rates 1,191 1% 1,376 16% 823 3% 353 50% 730 5% 323 51%
Small Bus. Owners - Broad 3/ Small Bus. Owners-Narrow 4/ Owners of Any Larger Business 5/Statutory Marginal Tax Rate 1/
Number Returns
Percent Total
Small Business Income
Percent Total
Percent Total
Percent Total
Small Business Income
Percent Total
Number Returns
Percent Total
Larger Business Income
Percent Total
10% 2,604 17% 16 4% 1,522 26% 17 5% 40 3% 0 0%15% 5,659 37% 53 13% 2,236 38% 55 15% 165 14% 0 0%25% 3,494 23% 67 16% 1,027 18% 62 17% 234 20% 1 0%28% 947 6% 37 9% 304 5% 33 9% 108 9% 2 1%33% 237 2% 20 5% 103 2% 18 5% 32 3% 2 1%35% 422 3% 113 27% 136 2% 86 24% 198 17% 188 85%AMT 26% 344 2% 7 2% 96 2% 6 2% 34 3% 1 0%AMT 28% 1,441 10% 100 24% 403 7% 78 22% 360 31% 27 12%ALL 15,148 100% 412 100% 5,828 100% 356 100% 1,171 100% 220 100%Addendum:33 & 35% rates 659 4% 133 32% 239 4% 105 29% 230 20% 190 86%
1/ The statutory marginal tax rate is the statutory rate applicable to the last dollar of taxable income.2/ Includes income or loss from Sch. C, E-rental, F, and partnership and S corporation income as reported on Sch. E part II.3/ Any individuals with income or loss from any business that meets the definition of a "small business."4/ Only individuals with active net income from small businesses that equals at least 25% of taxpayer's AGI.5/ Owners of any entities that meet the definition of "business" but that are not small businesses. Some also own small business and are considered "small business owners." Income of small businesses and income of larger businesses are only reported in their respective categories.
39
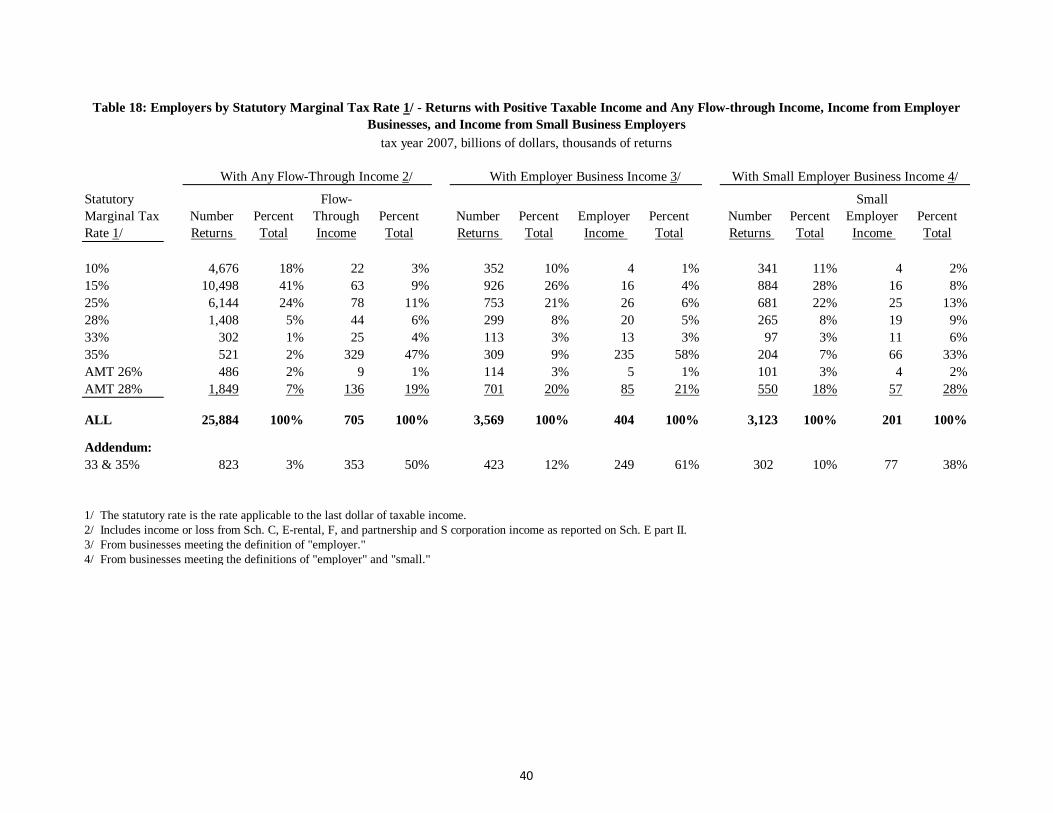
Table 18: Employers by Statutory Marginal Tax Rate 1/ - Returns with Positive Taxable Income and Any Flow-through Income, Income from Employer Businesses, and Income from Small Business Employers
tax year 2007, billions of dollars, thousands of returns
With Any Flow-Through Income 2/ With Employer Business Income 3/ With Small Employer Business Income 4/
Statutory Marginal Tax Rate 1/
Number Returns
Percent Total
Flow-Through Income
Percent Total
Number Returns
Percent Total
Employer Income
Percent Total
Number Returns
Percent Total
Small Employer Income
Percent Total
10% 4,676 18% 22 3% 352 10% 4 1% 341 11% 4 2%15% 10,498 41% 63 9% 926 26% 16 4% 884 28% 16 8%25% 6,144 24% 78 11% 753 21% 26 6% 681 22% 25 13%28% 1,408 5% 44 6% 299 8% 20 5% 265 8% 19 9%33% 302 1% 25 4% 113 3% 13 3% 97 3% 11 6%35% 521 2% 329 47% 309 9% 235 58% 204 7% 66 33%AMT 26% 486 2% 9 1% 114 3% 5 1% 101 3% 4 2%AMT 28% 1,849 7% 136 19% 701 20% 85 21% 550 18% 57 28%
ALL 25,884 100% 705 100% 3,569 100% 404 100% 3,123 100% 201 100%
Addendum:33 & 35% 823 3% 353 50% 423 12% 249 61% 302 10% 77 38%
1/ The statutory rate is the rate applicable to the last dollar of taxable income.2/ Includes income or loss from Sch. C, E-rental, F, and partnership and S corporation income as reported on Sch. E part II.3/ From businesses meeting the definition of "employer."4/ From businesses meeting the definitions of "employer" and "small."
40