Methodology report for Novo Nordisk's environmental profit and loss
51
Methodology report for Novo Nordisk’s environmental profit and loss account 2014
Transcript of Methodology report for Novo Nordisk's environmental profit and loss

Methodology report for Novo Nordisk’s environmental profit and loss account 2014

Title:
Methodology report for Novo Nordisk’s environmental profit and loss account
Editing:
Niels Karim Høst-Madsen, NIRAS Camilla K. Damgaaard, NIRAS Anna Szeler, NIRASRune Jørgensen, NIRAS Dana McManamon, Trucost Steven Bullock, Trucost Jessica Taylor, Trucost Alice Sireyjol , Trucost Jannick Schmidt, 2.-0 LCA consultants
Published by:
The Danish Environmental Protection Agency Strandgade 29 1401 Copenhagen K Denmark www.mst.dk/english
Year:
2014
ISBN no.
978-87-93178-03-8
Disclaimer:
When the occasion arises, the Danish Environmental Protection Agency will publish reports and papers concerning research and development projects within the environmental sector, financed by study grants provided by the Danish Environmental Protection Agency. It should be noted that such publications do not necessarily reflect the position or opinion of the Danish Environmental Protection Agency. However, publication does indicate that, in the opinion of the Danish Environmental Protection Agency, the content represents an important contribution to the debate surrounding Danish environmental policy. Sources must be acknowledged.
2 Methodology report for Novo Nordisk’s environmental profit and loss account

Project
This E P&L is sponsored by the Danish Ministry of Environment, conducted for the pharmaceutical company Novo Nordisk A/S and conducted by the consultants; NIRAS A/S, Trucost PLC and 2.-0 LCA consultants.
Methodology report for Novo Nordisk’s environmental profit and loss account 3

Contents
Project....................................................................................................................... 3
Terms ........................................................................................................................ 6
Abbreviations ............................................................................................................ 8
1. Introduction ....................................................................................................... 9 1.1 Contributions to the E P&L model ....................................................................................... 10
1.1.1 E P&L project approach: ........................................................................................ 10 1.1.2 Application of the E P&L: ...................................................................................... 10 1.1.3 Multiregional EIO tables: ...................................................................................... 10 1.1.4 Hybridization: ........................................................................................................ 11
1.2 Quantification of eKPIs ........................................................................................................ 11 1.2.1 Database ................................................................................................................. 11 1.2.2 Quantification method ........................................................................................... 16
1.3 Processing of Novo Nordisk data ......................................................................................... 17 1.3.1 Operational Data .................................................................................................... 17 1.3.2 Distribution Data ................................................................................................... 18 1.3.3 Indirect Spend ........................................................................................................ 19 1.3.4 Direct Spend .......................................................................................................... 20
1.4 Hybridizing and detailing of the data .................................................................................. 21 1.4.1 Selecting high impact spend categories: ............................................................... 21 1.4.2 Improving the data granularity ............................................................................. 21
2. Valuation of environmental impacts ................................................................. 25 2.1.1 Greenhouse gas emissions .................................................................................... 26
2.2 Other air pollutants ............................................................................................................. 26 2.2.1 Particulate Matter (PM10) .................................................................................... 27 2.2.2 Sulphur dioxide (SO2) .......................................................................................... 27 2.2.3 Ammonia (NH3) ................................................................................................... 27 2.2.4 Nitrogen oxides (NOx) .......................................................................................... 27 2.2.5 Volatile Organic Compounds (VOCs) ................................................................... 28 2.2.6 Ozone (O3) ............................................................................................................ 28
2.3 Impact Pathway Approach .................................................................................................. 28 2.4 Trucost approach ................................................................................................................. 28 2.5 Danish guidelines ................................................................................................................. 30 2.6 Water footprint; Trucost approach ...................................................................................... 31
2.6.1 Blue Water Valuation ............................................................................................. 31 2.6.2 Description of the methodology ........................................................................... 32 2.6.3 Green water valuation ........................................................................................... 33
2.7 Land use change (iLUC) ...................................................................................................... 34 2.7.1 Ecosystem services generated by the environment ............................................. 35 2.7.2 Land use change general approach ...................................................................... 35 2.7.3 Application of Trucost methodology to the cultivation of corn in France .......... 35
2.8 Comparison of valuation estimates ......................................................................................37 2.9 Sensitivity analysis ............................................................................................................... 39
4 Methodology report for Novo Nordisk’s environmental profit and loss account

2.9.1 Modelling assumptions ......................................................................................... 40 2.9.2 Hybridisation assumptions................................................................................... 40 2.9.3 Valuation assumptions .......................................................................................... 41
3. Scenario analysis of water footprint for glucose ................................................ 43
4. References ....................................................................................................... 44
Methodology report for Novo Nordisk’s environmental profit and loss account 5

Terms
Term Definition
Air Pollutants Emissions released to air by NOx, SO2, Ammonia, Particulates and Volatile Organic Compounds (VOCs).
Carbon dioxide equivalent (CO2e) or greenhouse gas (GHG)
Carbon dioxide equivalents - standardisation of all greenhouse gas emissions to reflect the global warming potential (GWP) relative to carbon dioxide. The analysis includes the six GHGs covered by the UN Kyoto Protocol: carbon dioxide (CO2), methane (CH4), nitrous oxide (N2O), sulphur hexafluoride (SF6), hydrofluorocarbons (HFCs) and perfluorocarbons (PFCs). Each gas has a global warming potential measured as the ratio of heat trapped by one metric tonne of the gas to that of one tonne of CO2 over a specified time period. The emission of a GHG is multiplied by its GWP to calculate the equivalent level of CO2 emissions. For example, one tonne of SF6 equates to 23,900 tonnes of CO2. Conversions of greenhouse gas emissions to CO2e are based on the GWP index published by the Intergovernmental Panel on Climate Change (IPCC) which assesses the effect of the emissions of different gases over a 100-year time period relative to the emission of an equal mass of CO2.
Ecosystem services Ecosystem services are the benefits that people and businesses derive from nature, like food, fibre, fuel, regulation of climate, assimilation of waste, opportunities for recreation, protection from extreme events, and cultural and spiritual enrichment.
Supply chain From production of raw materials to transport to stores, the total impact of bringing products to market. Consumer in-use and end-of-life disposal are not included in this analysis.
6 Methodology report for Novo Nordisk’s environmental profit and loss account

Environmental impact A change in the make-up, functions, or appearance of the environment. For example, GHG emissions contribute to climate change which is associated with a range of environmental impacts such as reduced crop yields, changes in water availability and increases in extreme weather. Some impacts have a more direct influence on the environmental such as affected water courses and local disamenity impacts caused by dust, noise and odour.
Environmental Key Performance Indicator - eKPI
An Environmental Key Performance Indicator (eKPI) categorises one or more emissions into one group. GHG emissions are an example of such a group.
Input-Output Model An economic model used to capture the monetary flow between business sectors and how each sector inter-depends on its own and other sectors for the flow of goods and services.
(Environmental) Loss Activities that adversely impact the environment.
(Environmental) Profit Activities that benefit the environment.
The partners A reference to NIRAS, Trucost and 2.-0 LCA as an entity.
Methodology report for Novo Nordisk’s environmental profit and loss account 7

Abbreviations
Abbreviation Definition
E P&L Environmental Profit & Loss
EIO Environmental Input Output
eKPI Environmental Key Performance Indicators
iLUC Indirect Land Use Change
EPA Environmental Protection Agency
LCA Life Cycle Assessment
GHG Green House Gas
R&D Research & Development
8 Methodology report for Novo Nordisk’s environmental profit and loss account

1. Introduction
The Novo Nordisk Environmental Profit and Loss Account (E P&L) is a response to PUMA’s call for contributions to the E P&L methodology and the expert review of PUMA’s E P&L. The Novo Nordisk E P&L is reported in two parts; the main report, which focuses on the results and the application of these in a Novo Nordisk context, and the methodology report which focuses on the methodology applied for establishing the E P&L results. The following methodology report:
1. Summarises the methodological contributions and deviations from PUMA’s original E P&L methodology.
2. Provides a detailed explanation of the data sets, quantification methods, and valuation methodologies used to complete the E P&L.
Not all of the points from the review have been addressed in this E P&L, but those that have are listed in section 1.1. These are the main conclusions and contributions to the E P&L methodology from this analysis.
Methodology report for Novo Nordisk’s environmental profit and loss account 9
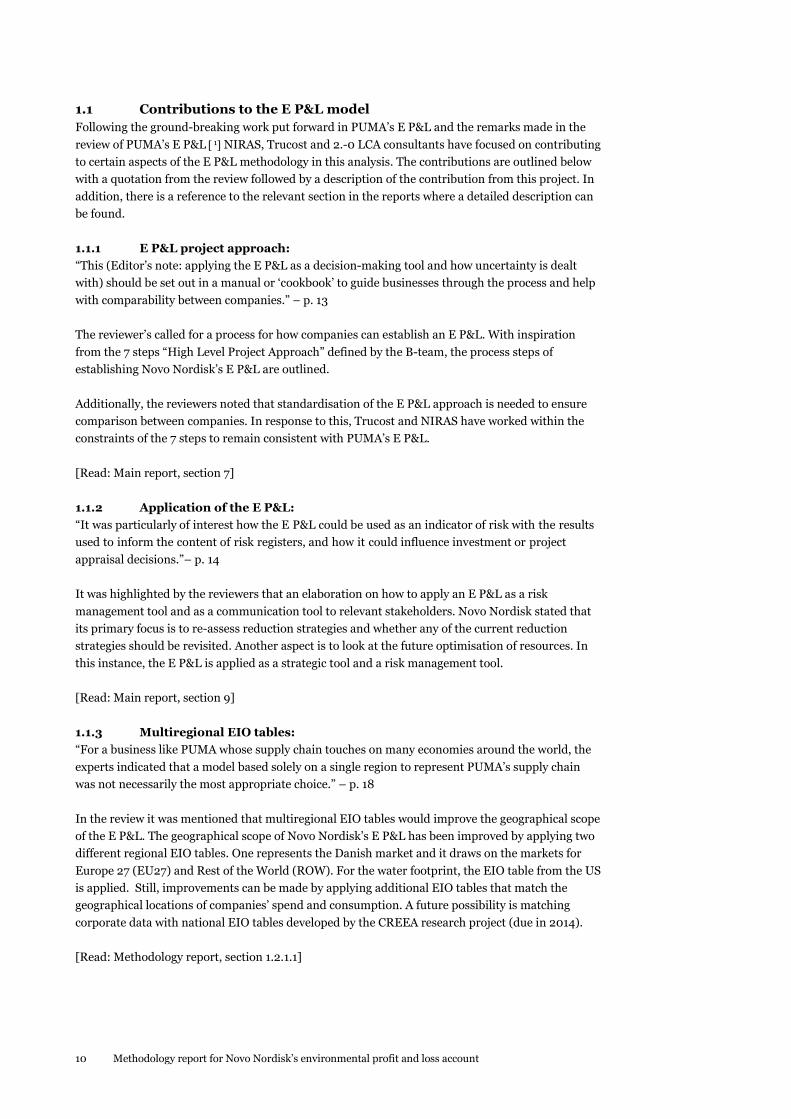
1.1 Contributions to the E P&L model Following the ground-breaking work put forward in PUMA’s E P&L and the remarks made in the review of PUMA’s E P&L [1] NIRAS, Trucost and 2.-0 LCA consultants have focused on contributing to certain aspects of the E P&L methodology in this analysis. The contributions are outlined below with a quotation from the review followed by a description of the contribution from this project. In addition, there is a reference to the relevant section in the reports where a detailed description can be found. 1.1.1 E P&L project approach: “This (Editor’s note: applying the E P&L as a decision-making tool and how uncertainty is dealt with) should be set out in a manual or ‘cookbook’ to guide businesses through the process and help with comparability between companies.” – p. 13 The reviewer’s called for a process for how companies can establish an E P&L. With inspiration from the 7 steps “High Level Project Approach” defined by the B-team, the process steps of establishing Novo Nordisk’s E P&L are outlined. Additionally, the reviewers noted that standardisation of the E P&L approach is needed to ensure comparison between companies. In response to this, Trucost and NIRAS have worked within the constraints of the 7 steps to remain consistent with PUMA’s E P&L. [Read: Main report, section 7] 1.1.2 Application of the E P&L: “It was particularly of interest how the E P&L could be used as an indicator of risk with the results used to inform the content of risk registers, and how it could influence investment or project appraisal decisions.”– p. 14 It was highlighted by the reviewers that an elaboration on how to apply an E P&L as a risk management tool and as a communication tool to relevant stakeholders. Novo Nordisk stated that its primary focus is to re-assess reduction strategies and whether any of the current reduction strategies should be revisited. Another aspect is to look at the future optimisation of resources. In this instance, the E P&L is applied as a strategic tool and a risk management tool. [Read: Main report, section 9] 1.1.3 Multiregional EIO tables: “For a business like PUMA whose supply chain touches on many economies around the world, the experts indicated that a model based solely on a single region to represent PUMA’s supply chain was not necessarily the most appropriate choice.” – p. 18 In the review it was mentioned that multiregional EIO tables would improve the geographical scope of the E P&L. The geographical scope of Novo Nordisk’s E P&L has been improved by applying two different regional EIO tables. One represents the Danish market and it draws on the markets for Europe 27 (EU27) and Rest of the World (ROW). For the water footprint, the EIO table from the US is applied. Still, improvements can be made by applying additional EIO tables that match the geographical locations of companies’ spend and consumption. A future possibility is matching corporate data with national EIO tables developed by the CREEA research project (due in 2014). [Read: Methodology report, section 1.2.1.1]
10 Methodology report for Novo Nordisk’s environmental profit and loss account

1.1.4 Hybridization: ”… the results can be improved by hybridising the results with data collected directly from suppliers or from specific secondary sources such as Life Cycle Assessment (LCA) databases.” – p. 7 A potential improvement mentioned in the review was to hybridise the EIO tables with LCA databases. In Novo Nordisk’s E P&L the largest purchase category, glucose, was assessed using a hybridised approach which incorporated tradi-tional LCA data from the EcoInvent database. [Read: Methodology report, section 1.4.2.1] Modelling Novo Nordisk’s E P&L This chapter describes the methodological approach of the E P&L, including the quantification of eKPIs and the application of valuations. The quantification method applied by the partners to quantify the eKPIs is an essential part of understanding the methodological approach of the Novo Nordisk E P&L. 1.2 Quantification of eKPIs In the E P&L for Novo Nordisk, NIRAS and Trucost partnered with the EPA to choose three eKPIs to be analysed. These are:
• Greenhouse gas (GHG) emissions • Air pollution (Ammonia, NOx, Particulates, SO2, Non-methane volatile organic
compounds (NMVOC)) • Water
Also, as a case study, the eKPI indirect Land Use Change (iLUC) has been included for the hybridised process of glucose.
• Land Use Change (Only for Glucose)
The eKPIs have been chosen because of their relevance to the Novo Nordisk business. GHG emissions are already a focus area and are being monitored and reported by Novo Nordisk. Air pollution is particularly relevant for logistics activities, which in the case of Novo Nordisk covers product distribution, sales activity in cars, travel and general distribution. Water and iLUC is especially relevant for agricultural services, and since Novo Nordisk has a big volume purchase of glucose and other chemicals that originate in agricultural services, the indirect impacts relating to these activities should be considered. The eKPIs are quantified using databases called Environmentally Extended Input-Output (EIO) tables. In the section below the concept of EIO tables are described in more detail together with a description of the application. 1.2.1 Database
1.2.1.1 EIO tables EIO models calculate environmental impacts through supply chains by combining economic flows and environmental data. An IO table represents all economic transactions between all sectors in a specific country during a year. For each sector, the table includes data for direct emissions and consumption of products from other sectors. With EIO tables, one can calculate the life cycle emissions per Danish Krone (DKK) or USD for each sector in the table.
Methodology report for Novo Nordisk’s environmental profit and loss account 11

The EIO methodology is consistent with how emissions are calculated in a traditional life cycle assessment. The only difference is that the transactions between the activities are measured in DKK or USD, instead of physical units such as kilograms or kWh. An advantage of the EIO analysis is that impacts associated with every economical transaction are accounted for; while a traditional life cycle assessment applies a ‘cut-off’, meaning that some impacts are outside of the boundaries of the analysis. Presumably, a traditional life cycle assessment can underestimate actual emissions by up to 50% [2]. The disadvantage of EIO tables is that they are often very high level relative to traditional life cycle assessments i.e. the granularity of analysis is limited by the number of sectors in the economic matrix, leading to more general results for each product. The table below summarises advantages and disadvantages of applying EIO tables. Advantages Disadvantages
Completeness, avoids truncation error1
Often limited environmental extensions available
Good starting point Generic nature of sectors
Fast, practical and relatively inexpensive
Inventories are not always current
Helps identify ‘hotspots’ Difficult to model capital investments
Used by governments for similar purposes
Static models don’t take account of changing cost and pricing structures of sectors and impact of technological change
Possibility of applying multi-regional tables
Limited country-specific EIO tables are available
TABLE 1.1: ADVANTAGES AND DISADVANTAGES OF THE EIO TABLES [1].
EIO tables provide a ’top-down’ approach that is easy to apply by any company that wishes to conduct a total mapping of environmental impacts. The EIO tables provide an overview of all impacts, whether they occur locally or globally. The main disadvantage related to the high level results can be offset by the possibility of conducting detailed analyses (hybridisation) of certain spend categories and thereby combining the strengths of both practices; the completeness of the EIO tables and the preciseness of LCA modelling. One of the key disadvantages of EIO tables however, is the varying quality of available country EIO tables. For global businesses whose supply chains operate in many economies around the world, interacting multi-regional tables with aligned sectors and uniform data quality would be ideal. While not currently available, these tables are in the process of being built in the form of a new project called CREEA.
1Truncation error refers to the impacts excluded from LCA results as a result of the system boundaries set for LCA.
12 Methodology report for Novo Nordisk’s environmental profit and loss account

The main goal of CREEA is to refine and elaborate economic and environmental accounting principles as discussed in the London Group and consolidated in the future SEEA 2012, to test the application of the principles in practical data gathering, to troubleshoot and refine approaches, and to show added value of having such harmonized data available via case studies. This will be done in priority areas mentioned in the call, i.e. waste and natural resources, water, forest and climate change / Kyoto accounting. In this, the project will include work and experiences from major previous projects focused on developing harmonized data sets for integrated economic and environmental accounting (most notably EXIOPOL, FORWAST and a series of EUROSTAT projects in Environmental Accounting). Most data gathered in CREEA will be consolidated in the form of Environmentally Extended Supply and Use tables (EE SUT) and update and expand the EXIOPOL database. In this way, CREEA will produce a global Multi-Regional EE SUT with a unique detail of 130 sectors and products, 30 emissions, 80 natural resources, and 43 countries plus a rest of world. A unique contribution of CREEA is that also SUT in physical terms will be created. Partners are:
• Nederlandse Organisatie Voor Toegepast Natuurwetenschappelijk Onderzoek (TNO), Netherlands (co-ordinator)
• JRC -Joint Research Centre- European Commission (DG JRC IPTS), Belgium /Spain • Universiteit Leiden (Unileiden), Netherlands • Centraal Bureau voor de Statistiek (CBS), Netherlands • Norges Teknisk-Naturvitenskapelige Universitet (NTNU), Norway • Statistiska Centralbyran (SCB), Sweden • Universiteit Twente (TU Twente), Netherlands • Eidgenössische Technische Hochschule Zürich (ETH) Switzerland • 2.-0 LCA Consultants Aps (2.-0 LCA), Denmark • Wuppertal Institut Fur Klima, Umwelt, Energie Gmbh. (WI), Germany • SERI - Nachhaltigkeitsforschungs Und –Kommunikations Gmbh (SERI) Austria • European Forest Institute (EFI), Finland / Spain
For more information see http://creea.eu/ or contact the co-ordinator at: [email protected] (TNO, the Netherlands) or the work package leader for the physical supply-use tables and waste accounts at [email protected] (2.-0 LCA consultants, Denmark) For the quantification of the Novo Nordisk E P&L the partners have applied two EIO models. The partners have chosen to use the FORWAST EIO matrix for the quantification of the eKPIs: GHG, Air pollution and Land use. For the quantification of water, the Trucost US EIO matrix has been used. 1.2.1.2 FORWAST environmental input-output (EIO) table
FIGURE 1.1: THE THREE DIFFERENT REGIONAL EIO TABLES APPLIED IN FORWAST EIO MODEL
Methodology report for Novo Nordisk’s environmental profit and loss account 13

The method used to establish Novo Nordisk’s E P&L is a new type of EIO table called FORWAST [3], [4], [5], [6], [7], [8], [9].The new table differs from a traditional EIO by using both monetary and physical units. Novo Nordisk’s emissions are therefore calculated either per DKK spent on products or services, or from Novo Nordisk’s physical consumption such as energy use, fuel use and prefabricated materials use in physical units (kWh, kg etc.). The table can calculate the emissions of more than 130 sectors and differs from other EIO tables as follows:
• Computing from monetary units (DKK) and physical units such as kg and kWh. • The database distinguishes between different waste fractions and various methods of
waste treatments; recycling, incineration and landfilling etc. • The EIO table is based on a complete mass flow analysis, Denmark's and EU27’s economy
divided into more than 100 products and services and over 40 waste fractions, and inputs of resources and outputs of emissions. Waste streams are determined by mass balances for each sector.
The EIO table is developed by 2.-0 LCA consultants and refined in collaboration with NIRAS for environmental and climate accounting. The geographical scope The FORWAST EIO table is made for the Danish market (DK market) which contains three EIO tables which each represent three different non-overlapping geographical regions.
• DK Market – An EIO table that collects data from the three main EIO tables for Denmark (DK), the countries within the European Union (EU27) and the rest of the world (ROW) thereby representing the Danish market. DK Market reflects the average transactions between sectors nationally in DK, and international transaction with sectors in EU27and ROW. This also means that the model takes into consideration trade between the three regions as a result of exports and imports. This particular
• DK – An EIO table representing the Danish production reflecting the transactions between sectors within the country.
• EU27 – An EIO table representing the market for the member states of the European Union reflecting the transactions between sectors within the countries and with the rest of the world (ROW). The table is a merge of national EIO tables representing each member state.
• ROW – An EIO table representing the market of the rest of the world. The table is a modification of EU27 to represent the American, Indian and Chinese markets. The modification made is an adjustment of the electricity mix so that it resembles the electricity mixes in the USA, India and China.
14 Methodology report for Novo Nordisk’s environmental profit and loss account
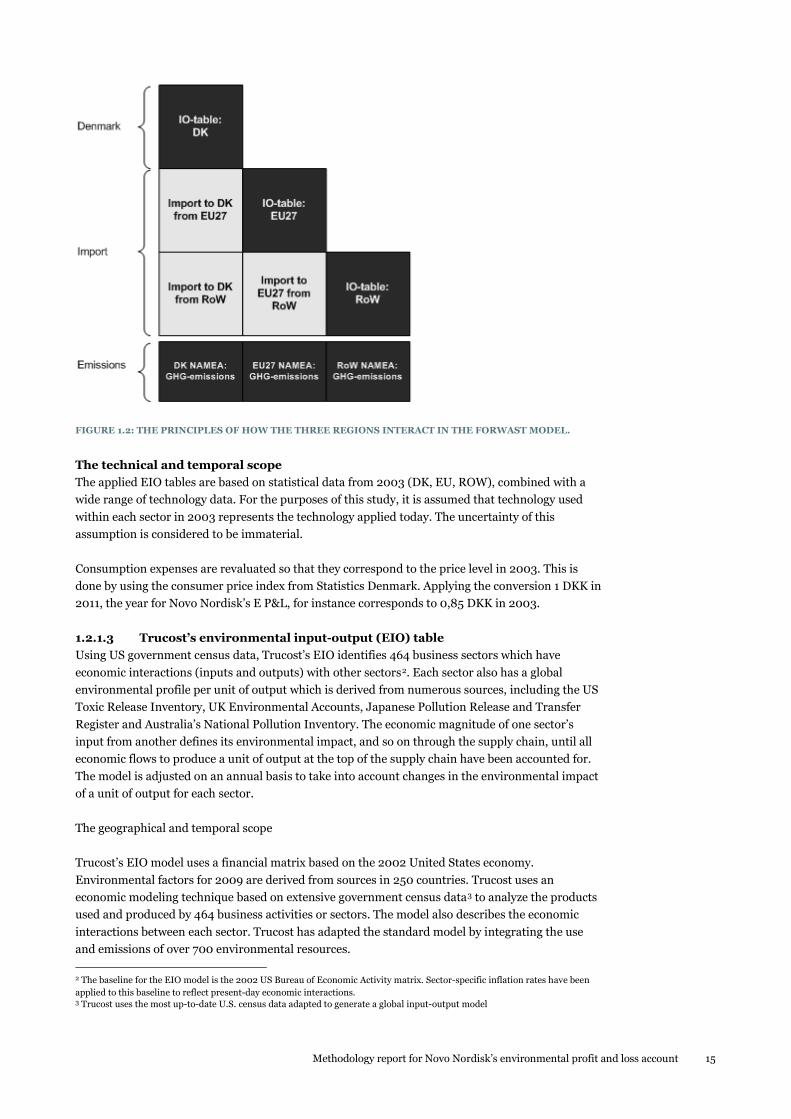
FIGURE 1.2: THE PRINCIPLES OF HOW THE THREE REGIONS INTERACT IN THE FORWAST MODEL.
The technical and temporal scope The applied EIO tables are based on statistical data from 2003 (DK, EU, ROW), combined with a wide range of technology data. For the purposes of this study, it is assumed that technology used within each sector in 2003 represents the technology applied today. The uncertainty of this assumption is considered to be immaterial. Consumption expenses are revaluated so that they correspond to the price level in 2003. This is done by using the consumer price index from Statistics Denmark. Applying the conversion 1 DKK in 2011, the year for Novo Nordisk’s E P&L, for instance corresponds to 0,85 DKK in 2003. 1.2.1.3 Trucost’s environmental input-output (EIO) table Using US government census data, Trucost’s EIO identifies 464 business sectors which have economic interactions (inputs and outputs) with other sectors2. Each sector also has a global environmental profile per unit of output which is derived from numerous sources, including the US Toxic Release Inventory, UK Environmental Accounts, Japanese Pollution Release and Transfer Register and Australia’s National Pollution Inventory. The economic magnitude of one sector’s input from another defines its environmental impact, and so on through the supply chain, until all economic flows to produce a unit of output at the top of the supply chain have been accounted for. The model is adjusted on an annual basis to take into account changes in the environmental impact of a unit of output for each sector. The geographical and temporal scope Trucost’s EIO model uses a financial matrix based on the 2002 United States economy. Environmental factors for 2009 are derived from sources in 250 countries. Trucost uses an economic modeling technique based on extensive government census data3 to analyze the products used and produced by 464 business activities or sectors. The model also describes the economic interactions between each sector. Trucost has adapted the standard model by integrating the use and emissions of over 700 environmental resources.
2 The baseline for the EIO model is the 2002 US Bureau of Economic Activity matrix. Sector-specific inflation rates have been applied to this baseline to reflect present-day economic interactions. 3 Trucost uses the most up-to-date U.S. census data adapted to generate a global input-output model
Methodology report for Novo Nordisk’s environmental profit and loss account 15

1.2.1.4 The applied EIO model The three eKPIs (GHG, air pollution and iLUC) are quantified using the FORWAST EIO model. Since it is not possible to quantify water using the FORWAST EIO model, the Trucost EIO model is applied to quantify water consumption. For means of consistency, Novo Nordisk’s spend categories were mapped to the appropriate FORWAST sectors and Trucost sectors and reviewed to ensure the most consistent match, as shown in the table below.
Novo Nordisk Spend Category
Trucost Sector FORWAST Sector
Cardboard Paperboard container manufacturing
Paper and paper products
Sodium hydroxide All other basic inorganic chemical manufacturing
Manufacturing of industrial gases and inorganic basic chemicals
POM (Polyoxymethylene)
Plastics material and resin manufacturing
Plastics basic, virgin
TABLE 1.2: EXAMPLE OF LINKS BETWEEN THE TWO EIO MODELS
1.2.2 Quantification method 1.2.2.1 Software tool Calculations using the EIO tables are performed in SimaPro, software developed to assist carbon footprinting. SimaPro facilitates analysis with both the EIO tables, and other large LCA databases, allowing for hybridisation. (see section 2.3.2). For water, the analysis was completing using Trucost’s footprint calculator. 1.2.2.2 Stepwise The applied quantification method is called Stepwise, a leading method to convert single emissions like N2O and CH4 into environmental indicators such as GHG emissions (denoted in kgCO2e). Greenhouse Gases IPCC’s global warming potentials (GWP100) for different emissions are applied to convert single emissions such as CO2, CO, CH4 and N2O into a single unit: greenhouse gases measured in CO2e. Air Pollutants The single emissions for SO2, NMVOC, NH3, PM2.5 (< 2,5 µm) and NOx are summarised without conversion. iLUC iLUC is measured in terms of occupation (ha yr). iLUC is applied as a rough proxy indicator for biodiversity and ecosystem services. No distinction between land use types is made. It should be noted that GHG emissions related to land use are reported under GHG emissions and not land use. Further, it should be noted that the indicator covers significant differences in impacts on biodiversity and ecosystem services. With additional time and resources, more granular indicators for these impact categories could be included instead. Furthermore, it should be noted that quantification and valuation of iLUC was only conducted for glucose. Because of the scope and timeframe of the project, it was assessed that iLUC associated with corn farming in France would be the main contributor of iLUC in Novo Nordisk’s value chain.
16 Methodology report for Novo Nordisk’s environmental profit and loss account

The total iLUC cost reported in this E P&L is only representative of the farming of corn and is not representative of all goods and services in the supply chain. Water Water quantities (m3) are summarised without conversion. 1.3 Processing of Novo Nordisk data Novo Nordisk supplied the partners with various forms of data including expenditure data, a bill of materials, utility data and distribution data. Fejl! Henvisningskilde ikke fundet. visualises the various data sets and sources.
FIGURE 1.3: NOVO NORDISK DATA.
Each of the four data sets is described below together with a description of how the data was processed to fit the E P&L. 1.3.1 Operational Data Novo Nordisk provided data for the energy use and water consumption for the 14 sites that are owned by Novo Nordisk. Included in the 14 sites are factories which produce pharmaceuticals and devices, as well as filling, assembly and packaging operations. Additionally, there are office buildings for managerial functions such as R&D, sales, and management. The energy and water data were disclossed for the entire site and not divided between the production functions and the
Methodology report for Novo Nordisk’s environmental profit and loss account 17

managerial functions. Energy use data was disclosed in giga joules (GJ) and water consumption in m3. This data was sourced from Novo Nordisk’s internal reporting systems. Energy use and water consumption for Novo Nordisk outsourced factories are not captured by the operational data and have been estimated using the Novo Nordisk site in Hillerød, Denmark, as a benchmark. Hillerød is the only Novo Nordisk site that produces devices. Hillerød represents approximately 9 % of total device production. According to Novo Nordisk, roughly 100 % of the energy consumption at the Hillerød site is used for device manufacture. Based on the assumption that all outsourced production facilities have the same production profile as the Hillerød site, the energy consumption covering the production of the remaining 91 % of all devices has been estimated. Water consumption for Novo Nordisk owned facilities are captured by Novo Nordisk internal reporting systems. Water consumption used in outsourced facilities is estimated through the quantification of the material flow. Novo Nordisk purchases, for example, plastic and aluminium on behalf of the outsourced facilities, providing them with the exact amount of material purchased in kg. The water consumption is then estimated using the EIO modelling of these purchased quantities. 1.3.2 Distribution Data Novo Nordisk disclosed detailed data for their worldwide distribution of semi-finished and finished products, raw materials and components by air, sea and road between production sites and from production sites to affiliates, direct customers and importing distributors. Distribution from affiliates to pharmacies, hospitals and wholesalers was not included. The detailed data was provided by six companies distributing by truck and by two companies distributing by ship and air. The general data included distribution distances in kilometres (km), the amount of freighted kilograms (kg), consumption of diesel (l) and the emissions calculated by the distribution companies for NOx, HC, CO, Particulates and CO2. The eight companies report differently, meaning that the amount and level of data differs from company to company. A few of the companies did not disclose integral data such as distribution distances and the weight of freighted. When compared to total spend on distribution, the detailed data provided by the eight companies only covered a fraction of total spend. Because of the lack of consistent coverage from logistics data, it was decided to use spendto estimate environmental impacts. Distribution expenditures can be found in both Indirect spend and Direct spend. All spend relating to the transportation of semi-finished and finished products are allocated to Direct spend, and all other distribution expenditures not directly related to the Novo Nordisk products (i.e. freight of laboratory tests) to Indirect spend. In the figure below, the division between spend is shown.
18 Methodology report for Novo Nordisk’s environmental profit and loss account

FIGURE 1.4: DISTRIBUTION DATA ALLOCATED BETWEEN DIRECT SPEND AND INDIRECT SPEND
1.3.3 Indirect Spend Indirect spend covers all products and services which are not part of the final consumer product. Indirect spend includes, for example, IT, office furniture but also production equipment and machinery. Novo Nordisk provided indirect expenditure data for transactions in FY2011. This dataset contained over 500,000 transactions which consisted of 310 individual spend categories. These 310 spend categories were divided into 16 top level categories, which were provided by Novo Nordisk. Where relevant, the categories were joined together to form 11 top level categories. Furthermore these 11 top level categories have been divided into three purchase areas which are listed in Table 1.3 below.
Purchase areas % of Total Spend
High impact purchase area 42%
Medium impact purchase area 52%
Low impact purchase area 6%
Total 100 %
TABLE 1.3: INDIRECT EXPENDITURES ALLOCATED ON PURCHASE AREAS.
The purchase areas are an aggregate of the 11 top level categories. The division is as follow: The high impact purchase area contains spend relating to Consultancy services, production equipment and travel. The medium impact purchase area contains spend relating to clinical and laboratory equipment, distribution of products, management of facilities, marketing and meetings and events. The last group, The low impact purchase area, contains spend relating to IT & telecommunication and office supply and print.
Methodology report for Novo Nordisk’s environmental profit and loss account 19

1.3.4 Direct Spend Direct spend relates to the production of Novo Nordisk pharmaceuticals and devises and covers processed raw materials. Direct spend includes, for example, glucose for insulin production and plastic granulate for pen components production. Novo Nordisk provided the partners with a unique list of 74 purchased materials, disclosed by weight (kg). The 74 production materials were allocated to one of four application areas.
• Pharmaceutical production (i.e. glucose and chemicals) • Parts for devices (i.e. processed plastic) • Materials for maintenance (i.e. detergents and lubricants) • Packaging materials (i.e. cardboard and paper)4.
The distribution of spend across the 74 materials, by category, are summarised in the table below. The data provided by Novo Nordisk also includes the materials used at the outsourced factories. The outsourced factories produce 91 % of Novo Nordisk pen devices.
Top level categories % of Total weight
Pharmaceuticals 62 %
Devices 9 %
Packaging 16 %
Maintenance 12 %
Total 100 %
TABLE 1.4: NOVO NORDISK DIRECT SPEND
Each of the four top level categories is described in more detail below.
• Pharmaceuticals includes a wide range of ingredients used for the production of pharmaceutical products.
• Maintenance includes materials used for cleaning and maintenance of the machines
used for production.
• Devices includes materials used for production of devices. The category contains mainly different types of plastic in addition to metals.
• Packaging includes a wide range of materials, from glass for pharmaceuticals, to
cardboard and paper for individual product packaging, to wood pallets. The FORWAST EIO model can use both financial and quantitative inputs, but Trucost EIO model requires financial inputs. Kilograms were thus converted to a financial metric using FORWAST dry weight commodity prices for 2011.
4 The file accounted for 99.5 % of the total weight of ‘Direct Spend’. The remaining 0,5% consists of purchases which accounted for less than 1 kg of materials during FY2011.
20 Methodology report for Novo Nordisk’s environmental profit and loss account

1.4 Hybridizing and detailing of the data As discussed in section 1.2.1, the product categories in the EIO model are generally aggregated and not very granular. Therefore, the mapping of specific products used by Novo Nordisk to aggregated product category in the model creates some uncertainties. It was therefore decided to detail one category within direct spend to illustrate that the applied approach can be refined to reflect more detailed product categories. 1.4.1 Selecting high impact spend categories: Within Novo Nordisk’s direct spend glucose was the most significant category, both in monetary terms and in weight. Glucose was thus selected to create a hybrid process that better reflects the production of glucose than the current aggregated activity, which is the Flour industry. Within Direct spend, six other categories were identified as potential high impact areas -
Spend Category Sourcing Country
Glucose Primarily France
Ethanol Primarily Germany
Glass Switzerland, Brazil, Mexico
Nitric acid Finland, Norway
POM Ireland, Germany, Brazil
PP Primarily Belgium
Aluminium foil Portugal
TABLE 1.5 DIRECT SPEND, POTENTIAL HIGH IMPACT AREAS
With additional time and resources, it is recommended that Novo Nordisk consider looking further into the remaining top categories. 1.4.2 Improving the data granularity The EIO sector most appropriate for glucose was identified and assessed. Where required, data from EcoInvent was merged into the EIO model to make a new and more robust profile for the glucose sector. EcoInvent is the world's leading database for traditional life cycle assessments and contains specific data for more than 4,000 processes. The combination of EIO tables and EcoInvent
a) Compensate for EcoInvent cut-off limitations b) Allow for granularity in otherwise aggregated EIO tables
1.4.2.1 Detailing of input-output data on glucose production The starting point of the detailing was to make a copy of the original ’Flour’ sector in the EIO model. If no additional information was available, this would be the best estimate of glucose production. This rule is applied for all the inputs to the activity for which we have not identified more glucose specific data. One example is the use of various services as well as production capital (machinery and buildings). For these inputs it was assumed that the use per kg glucose is the same as per kg flour. Detailed production data on glucose were obtained from an LCA study commissioned by DuPont [10]. Within the ’Flour’ industry the production of glucose involves two processes:
• Wet-milling • Starch to syrup conversion
Methodology report for Novo Nordisk’s environmental profit and loss account 21

The wet milling process uses corn as raw material. With inputs of energy, this is converted to corn starch (this is used as raw material in the starch to syrup conversion), corn oil (by-product), and other by-products which are used as animal feed (corn gluten feed, corn gluten meal and steep liquor). The starch to syrup conversion uses corn starch as raw material. With inputs of enzymes, energy and water, this is processed into glucose and dextrose syrup greens (by-product which is used as animal feed). All inputs to the created IO-process ’Glucose production’ were modeled using the existing product flows in the IO-model:
• Electricity and heat was modeled by using the FORWAST IO-flow: Electricity, steam and hot water
• Corn was modeled using the FORWAST IO-flow: Grain crops • Corn oil by-product was modeled using the FORWAST IO-flow: Vegetable and animal oils
and fats • Animal by-products were modeled using the FORWAST IO-flows: ’Grain crops’ and
’Vegetable and animal oils and fats’
When creating the IO-process all by-products were entered as negative inputs, i.e. the so-called product technology model was used. This is consistent with the way the FORWAST IO model has been created. Further, the product technology assumption is equivalent to avoiding allocation by substitution in LCA [11 ]. This is in accordance with the ISO standards on LCA [12 ]. When by-products are used as animal feed, it is taken into account that this substitutes a combination of the marginal sources of protein animal feed (soybean meal) and energy feed (barley) [13 ]. The protein and energy content of the by-products are obtained from Møller et al.[14 ], and the calculated substituted soybean meal and barley is calculated using the methodology described in Schmidt and Weidema (2007) [15]. The modified input and output flows of the created IO-process representing glucose production are shown in the figure below. Notice that the flows in the figure are converted to 100% dry matter to fit with the units in the FORWAST hybrid IO-model. Dry matter contents are obtained from Møller et al. (2005) [14].
Starch to syrup conversion, France
By-product: 0.176 kg dextrose syrup greens
1 kg glucose/dextrose syrup
0.947 kg maize starch0.10 kg decarb. water
Wet milling, France
1.68 kg corn = 1.43 kg dm ‘EU27 __4 Grain crops’
*
0.542 kg corn gluten feed, corn gluten meal and steep liquor
*
0.048 kg corn oil
* -0.048 kg ‘RoW _22 Vegetable and animal oils and fats’
-0.362 kg barley = -0.308 kg dm ‘EU27 __4 Grain crops’
-0.250 kg soybean meal = -0.225 kg dm ‘RoW _22 Vegetable and animal oils and fats’
Modified: ‘EU27 _23 Flour’
0.210 kWh electricity
0.210 kWh ‘EU27 _75 Electricity, steam and hot water’
FIGURE 1.5: DETAILED LCA-DATA USED TO CREATE AN INPUT-OUTPUT PROCESS FOR GLUCOSE PRODUCTION THAT LINKS TO THE FORWAST HYBRID IO-MODEL.
22 Methodology report for Novo Nordisk’s environmental profit and loss account

The grey boxes in the figure above represent the detailed LCA data, and the large white box represents the created IO-process with its inputs and outputs. Notice that the product flows from the grey boxes are converted to IO-categories when crossing the system boundary of the large white box. The stars indicate the point of substitution where the by-product substitute animal feed. The GHG-emissions related to the original ‘EU27 _23 Flour’ process and the modified one representing glucose production are shown in the figure below. The results are shown with and without the inclusion of indirect land use changes (iLUC). The iLUC model described in Schmidt et al. (2012) [16 ] is linked with the FORWAST database, and thereby iLUC can be switched on and off.
FIGURE 1.6: GHG-EMISSIONS PER KG GLUCOSE. RESULTS ARE COMPARED FOR THE ORIGINAL IO-PROCESS ‘EU27 _23 FLOUR’ AND THE MODIFIED ONE REPRESENTING GLUCOSE PRODUCTION. FURTHER THE RESULTS ARE SHOWN WITH AS WELL AS WITHOUT INDIRECT LAND USE CHANGES (ILUC).
In the figure below, the process contribution from the most important IO-processes are shown. The results are shown for the modified flour process representing glucose production. iLUC is included.
Methodology report for Novo Nordisk’s environmental profit and loss account 23

FIGURE 1.7: GHG-EMISSIONS: PROCESS CONTRIBUTION FOR THE MODIFIED FLOUR IO-PROCESS THAT REPRESENTS GLUCOSE PRODUCTION. THE RESULTS ARE SHOWN WITH ILUC. NOTICE THAT THE VIEW USES A CUT-OFF RULE SO THAT ONLY THE PROCESSES THAT TOGETHER CONTRIBUTE WITH 90% OF THE GHG-EMISSIONS ARE SHOWN. RED ARROWS REPRESENT POSITIVE FLOWS, AND GREEN ARROWS REPRESENT NEGATIVE FLOWS, I.E. SUBSTITUTIONS CAUSED BY UTILISATION OF BY-PRODUCTS.
For water, Trucost hybridised Hoekstra [17] water data for the production of maize grain in France and overwrote the existing E IO water quantities from “grain farming” with the country level water quantity based on the amount of glucose purchased in the Novo Nordisk supply chain.
24 Methodology report for Novo Nordisk’s environmental profit and loss account

2. Valuation of environmental impacts
After the quantification of each eKPI, valuations were applied. This converts all impacts into a single monetary unit (EUR). Converting environmental impacts into financial units allows for comparison between impacts and a better understanding of overall supply chain impacts relative to spend, turnover, and profit. This document presents valuation methodologies based on the recommendations in the Danish Guidelines in socioeconomic analyses and by Trucost. The benefit of presenting both methodologies is to be able to compare their results and test sensibility of different valuation estimates. The valuation of the emissions quantified through this EP&L will be based on the approach developed by Trucost, as this is more in line with the global approach in the E P&L. The table below summarises the eKPIs concerned by these methodologies. As presented in the table below, water and land use are only valued by Trucost methodology as no “Danish” methodology has been developed.
Emission type
Presented in the methodology report
Used in the final report
Danish EPA Trucost Danish EPA
Trucost
Greenhouse Gases yes yes no yes
Other air pollutants yes yes no yes
Water no yes no yes
Land use change no yes no yes
TABLE 2.1:EKPIS AND VALUATION SOURCES
Both valuation approaches are based on welfare economic theory and attempt to quantify in monetary terms the changes in human welfare which result from environmental impacts. This reflects a ‘cost to society’ from the environmental impacts across Novo Nordisk’s supply chain. The Danish guidelines are mainly targeted at national studies and therefore national environmental impacts5, while the Trucost approach has a global perspective. When the Danish guidelines have been used in studies which include pollution outside Denmark, the Danish unit prices have been used to value the effects of the pollution in those countries. This has been done in spite of the fact that willingness-to-pay of the Danish population probably is not the same as willingness-to-pay of
5 And regarding air pollution the cost of Danish emissions in other countries.
Methodology report for Novo Nordisk’s environmental profit and loss account 25

populations in other countries. The Trucost approach, however, deviates from the Danish model to provide insight on how to apply valuation estimates on a global scale. Trucost’s approach accounts for how WTP can vary from one country to another. Further development is needed on the Danish Guidelines on how to integrate an approach to analyses with a global scope as an E P&L which differs from a traditional national socio economic analyses. An E P&L attempts to value effects in the entire value chain and is therefore not restricted to a national approach. In the following section both valuation approaches will be described and in the end of the section the specific valuation estimates are presented along with a discussion of differences. 2.1.1 Greenhouse gas emissions Greenhouse gas emissions include carbon dioxide (CO2), nitrous oxide (N2O) and methane (CH3). Increased emissions from industrial processes of greenhouse gases increases the overall average temperature of the Earth, which could lead to an increase in natural disasters, droughts, rise in sea level, and more. 2.1.1.1 Trucost approach Trucost uses a forward-looking price to calculate the global annual external costs of greenhouse gases emitted by Novo Nordisk operations and supply chain. This represents the present day value of future climate change impacts and is based on the social cost of carbon from the Stern Review on the Economics of Climate Change [18]. Stern’s estimate of the social cost of carbon is based on business-as-usual (BAU) emissions with low per capita economic growth. The study estimates that GHG emissions would lead to damages equivalent to 5-20% of global GDP. Stern provides a central estimate of the cost of likely climate change impacts from emissions over 200 years (2001-2200), based on the IPCC’s Third Assessment Report (2001) [48] and an average 5°C temperature rise. The resulting marginal cost of damages, discounted to 2000 prices, results in a social cost of carbon of US$85 per tonne. The study uses a relatively low implied discount rate of 1.4% [19] derived from a per capita consumption growth rate of 1.3% and a time preference rate of 0.1% [20]. The carbon cost has been inflated from US$85 in 2000 to US$113 in 2011 based on the World Bank of Consumer Price Inflation[21]. 2.1.1.2 Danish guidelines In Danish analyses, the prices of CO2 quotas in the EU ETS are used. This price reflects the marginal cost of reaching the CO2 emission target and not the damage cost of carbon. If the majority of emissions from the Novo Nordisk supply chain are assumed to be emitted in Europe, using the quota price is more robust than using the damage cost, which has more uncertainty. The estimated average price for the next 20 years is 20 EUR/tonne based on predictions from the Danish Energy Agency (DEA). The actual quota in 2011 was approx. 18 EUR/tonne [22]. 2.2 Other air pollutants Air pollutants can cause acid rain, smog and ground-level ozone, which can damage human health and ecosystems. Health effects can include chronic bronchitis and respiratory problems, while acidification can damage plant and animal life. Ozone, a secondary pollutant can also effect crop and timber growth.
26 Methodology report for Novo Nordisk’s environmental profit and loss account

Six air pollutants are included in the valuation:
1. Particulate matter (PM10) 2. Ammonia (NH3) 3. Sulphur dioxide (SO2) 4. Nitrogen oxides (NOx) 5. Volatile organic compounds (VOCs)6 6. Ozone (O3)
Each pollutant is associated with different but overlapping types of external costs. Some effects are caused directly by the primary pollutant emitted (e.g. health impacts of particulates) and some are caused by secondary pollutants formed in the atmosphere from pollutants that act as precursors (e.g. sulphur dioxide forming sulphuric acid as well as sulphate compounds which contribute to smog). As each pollutant has a unique set of effects, each pollutant is valued using an individual methodology (although there is overlap between methodologies). Air pollutants undergo chemical transformations in the atmosphere and the secondary pollutants formed can be the main driver of negative impacts. For example, after transport and chemical transformation, SO2 and NOx form secondary particulates that can cause lung and heart damage. The primary emissions of NOx and SO2 have relatively few individual effects[23]. Below is a brief overview of each pollutant. 2.2.1 Particulate Matter (PM10) Particulate matter, also known as particle pollution or PM, is a complex mixture of extremely small particles and liquid droplets from sources including fuel combustion in power plants, industry, road transport and construction sites. Particulates can cause cardiac problems, respiratory disease and premature death. Particle pollution is made up of a number of components, including acids (such as nitrates and sulphates), organic chemicals, metals, and soil or dust particles. The size of particles is directly linked to their potential to cause health problems. Governments are generally concerned about particles that are 10 micrometres (µm) in diameter or smaller because these can pass through the throat and nose and enter lungs. Once inhaled, these particles can affect the heart and lungs and cause serious health effects [24]. Particles smaller than 10µm in diameter are generally referred to as PM107. 2.2.2 Sulphur dioxide (SO2) Sulphur dioxide (SO2) can form sulphuric acid deposition (acid rain) and sulphate particulates (which form part of PM). Almost 90% of SO2 in the atmosphere stems from fossil fuel combustion at power plants and industrial facilities [25]. 2.2.3 Ammonia (NH3) Agriculture is the main source of anthropogenic emissions of ammonia (NH3), which can react with nitric and sulphuric acids in the atmosphere to form fine particulate matter. Ammonia can also contribute significantly to acid rain and acidification of ecosystems[26]. 2.2.4 Nitrogen oxides (NOx) Nitrogen oxides (NOx) refer primarily to nitric oxide (NO) and nitrogen dioxide (NO2)[27]. NOx is emitted largely from road transport, power plants and off-road equipment. It can react with volatile
6 Only outdoor air pollution effects are included in this valuation methodology. VOCs can also have indoor effects on health which would require a separate valuation methodology. 7 Evidence is emerging that suggests PM2.5 could be a better predictor for PM-driven acute and chronic health effects. However, most studies still focus on PM10 due to availability of data7. This valuation therefore focuses on PM10 (encompassing all particles smaller than 10µm in diameter – including particles less than 2.5µm).
Methodology report for Novo Nordisk’s environmental profit and loss account 27

organic compounds (VOCs), sunlight and heat in the atmosphere to form tropospheric (ground-level) ozone (see below). NOx can also react with ammonia to form particulates. 2.2.5 Volatile Organic Compounds (VOCs) Volatile organic compounds (VOCs) are emitted as gases from certain solids or liquids. VOCs include a variety of chemicals, some of which may have short and long-term adverse health effects[28]. VOCs also play a role in ozone formation (see below). 2.2.6 Ozone (O3) Tropospheric (ground-level) ozone is the primary constituent of smog. It is not usually emitted directly into the air, but can be created by a chemical reaction between NOx and VOCs [29]. Tropospheric ozone is a complex pollutant and consequently difficult to control. Often the "precursor" gases are emitted in one area, but the actual chemical reactions, stimulated by sunlight and temperature, take place in another. Combined emissions from motor vehicles and stationary sources can be carried hundreds of miles, forming high ozone concentrations over large regions[30]. Ozone can cause respiratory problems and reduce crop production. 2.3 Impact Pathway Approach Studies into the damage costs of air pollution use Impact Pathway Analysis (IPA) to follow the analysis from identification of burdens (e.g. emissions) through to impact assessment and then apply valuations in monetary terms[31]. These studies translate exposures into physical effects using dose–response functions (DRFs). The relationships embodied in the DRFs are established in peer-reviewed studies. The IPA measures the relationship between a unit concentration of a pollutant (dose) and its impact on an affected receptor (population, crops, buildings, water, etc.) based on scientific data, and then assigns a financial value to those impacts.
Source: Adapted from EXIOPOL (2009) [49]
FIGURE 2.1: IMPACT PATHWAY ANALYSIS
2.4 Trucost approach Literature reviews were carried out for each air pollutant. The bottom-up, IPA approach was used to assess air pollution impacts. Data on the number of effected end points per tonne were compiled to derive an average number of each type of effect per tonne (for example the number of cases of chronic bronchitis per tonne of particulate emissions). The general approach taken when performing function transfer for air pollution is to scale the number of effect end points from the literature based on the receptor density. Therefore the number of effect end points per tonne is adjusted based on relevant factors (e.g. population density for health impacts, crop ratios for crop effects). Due to the function transfer approach, Trucost’s air pollution methodology is global and country specific. Disaggregating data from studies enables more effects than might have been included in each particular study. It also enables a disaggregation of the costs of the effects (e.g. health costs) from
28 Methodology report for Novo Nordisk’s environmental profit and loss account
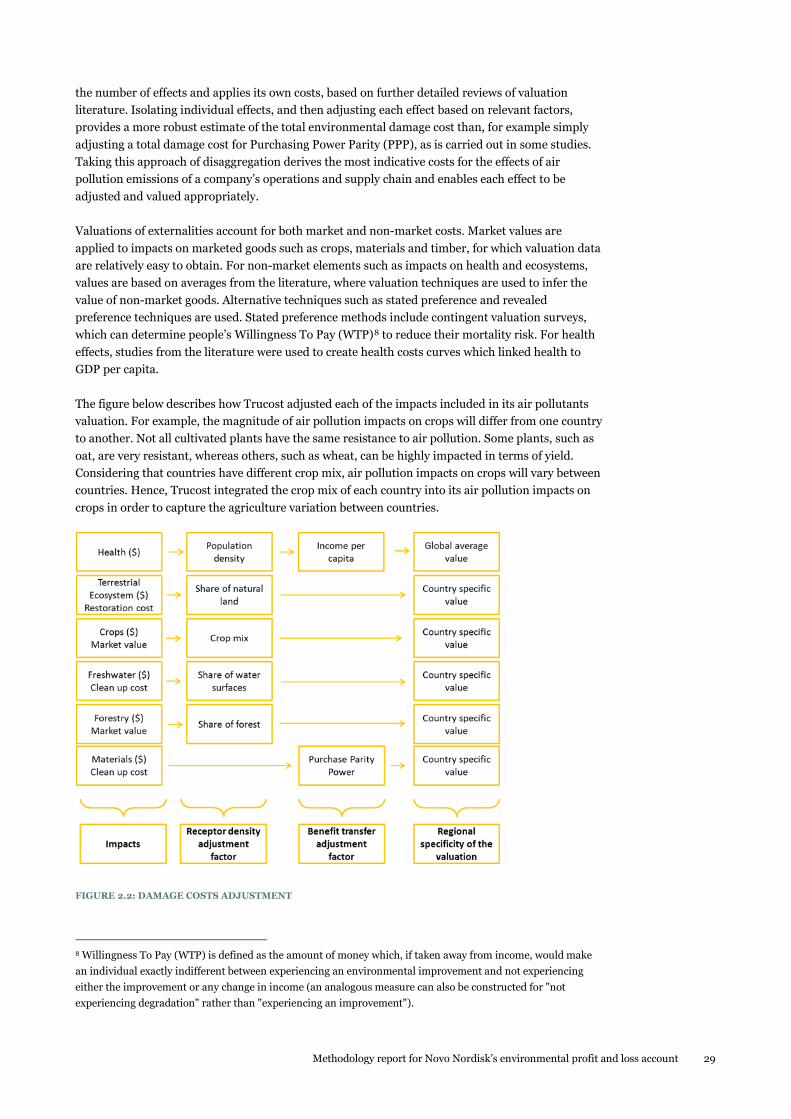
the number of effects and applies its own costs, based on further detailed reviews of valuation literature. Isolating individual effects, and then adjusting each effect based on relevant factors, provides a more robust estimate of the total environmental damage cost than, for example simply adjusting a total damage cost for Purchasing Power Parity (PPP), as is carried out in some studies. Taking this approach of disaggregation derives the most indicative costs for the effects of air pollution emissions of a company’s operations and supply chain and enables each effect to be adjusted and valued appropriately. Valuations of externalities account for both market and non-market costs. Market values are applied to impacts on marketed goods such as crops, materials and timber, for which valuation data are relatively easy to obtain. For non-market elements such as impacts on health and ecosystems, values are based on averages from the literature, where valuation techniques are used to infer the value of non-market goods. Alternative techniques such as stated preference and revealed preference techniques are used. Stated preference methods include contingent valuation surveys, which can determine people’s Willingness To Pay (WTP)8 to reduce their mortality risk. For health effects, studies from the literature were used to create health costs curves which linked health to GDP per capita. The figure below describes how Trucost adjusted each of the impacts included in its air pollutants valuation. For example, the magnitude of air pollution impacts on crops will differ from one country to another. Not all cultivated plants have the same resistance to air pollution. Some plants, such as oat, are very resistant, whereas others, such as wheat, can be highly impacted in terms of yield. Considering that countries have different crop mix, air pollution impacts on crops will vary between countries. Hence, Trucost integrated the crop mix of each country into its air pollution impacts on crops in order to capture the agriculture variation between countries.
FIGURE 2.2: DAMAGE COSTS ADJUSTMENT
8 Willingness To Pay (WTP) is defined as the amount of money which, if taken away from income, would make an individual exactly indifferent between experiencing an environmental improvement and not experiencing either the improvement or any change in income (an analogous measure can also be constructed for "not experiencing degradation" rather than "experiencing an improvement").
Methodology report for Novo Nordisk’s environmental profit and loss account 29
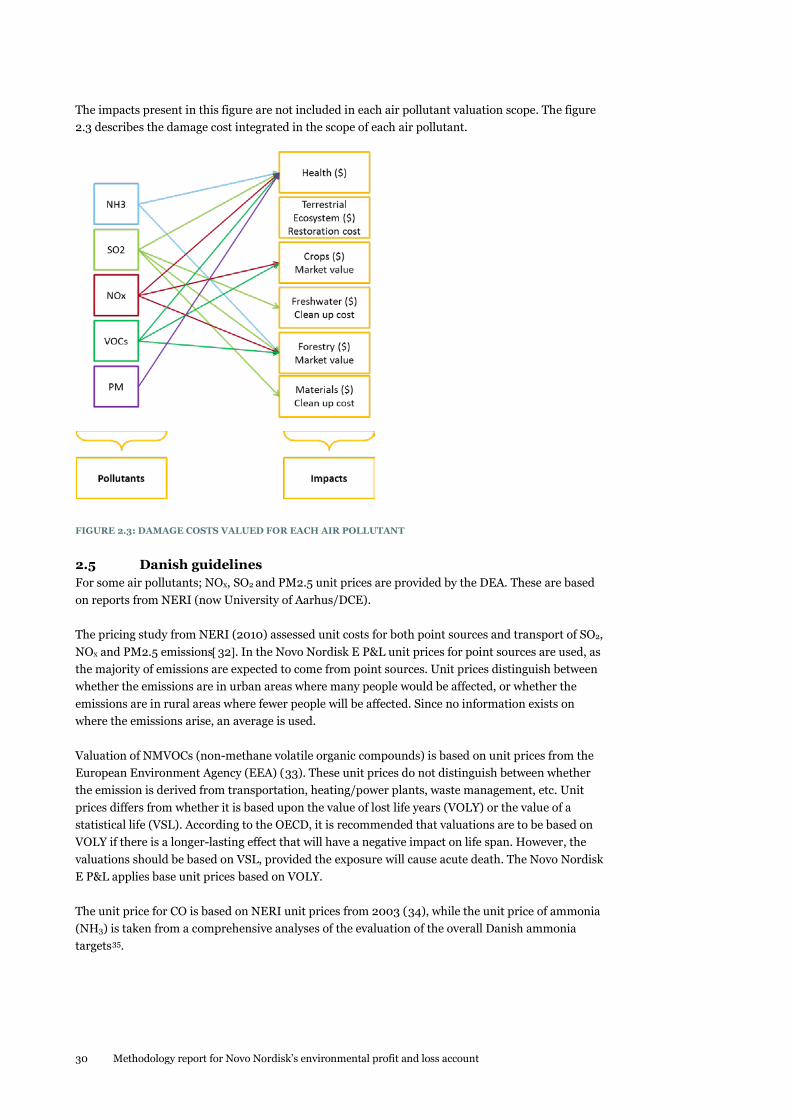
The impacts present in this figure are not included in each air pollutant valuation scope. The figure 2.3 describes the damage cost integrated in the scope of each air pollutant.
FIGURE 2.3: DAMAGE COSTS VALUED FOR EACH AIR POLLUTANT
2.5 Danish guidelines For some air pollutants; NOx, SO2 and PM2.5 unit prices are provided by the DEA. These are based on reports from NERI (now University of Aarhus/DCE). The pricing study from NERI (2010) assessed unit costs for both point sources and transport of SO2, NOx and PM2.5 emissions[32]. In the Novo Nordisk E P&L unit prices for point sources are used, as the majority of emissions are expected to come from point sources. Unit prices distinguish between whether the emissions are in urban areas where many people would be affected, or whether the emissions are in rural areas where fewer people will be affected. Since no information exists on where the emissions arise, an average is used. Valuation of NMVOCs (non-methane volatile organic compounds) is based on unit prices from the European Environment Agency (EEA) (33). These unit prices do not distinguish between whether the emission is derived from transportation, heating/power plants, waste management, etc. Unit prices differs from whether it is based upon the value of lost life years (VOLY) or the value of a statistical life (VSL). According to the OECD, it is recommended that valuations are to be based on VOLY if there is a longer-lasting effect that will have a negative impact on life span. However, the valuations should be based on VSL, provided the exposure will cause acute death. The Novo Nordisk E P&L applies base unit prices based on VOLY. The unit price for CO is based on NERI unit prices from 2003 (34), while the unit price of ammonia (NH3) is taken from a comprehensive analyses of the evaluation of the overall Danish ammonia targets35.
30 Methodology report for Novo Nordisk’s environmental profit and loss account

2.6 Water footprint; Trucost approach
2.6.1 Blue Water Valuation System of Environmental-Economic Accounting for Water (SEEAW)[36] defines three categories of water services:
Environmental services of water. The environmental services can be assimilated to the instream services of water, which are the services provided by the water in its natural environmental.
Water as an intermediate input to production in
agriculture and manufacturing;
Water as a final consumer good;
The Trucost water valuation only includes the value of the environmental services of water. The table lists the environmental services included in Trucost methodology:
Environmental service Definition Reference
Wildlife habitat and recreational activities
Recreation benefits provided by water included activities such as fishing, boating, rafting and swimming as well as activities such as picnicking and hiking that are enhanced by their proximity to water resources.
[52] [53] [54]
Waste assimilation
Merrit and Mar [37] define the marginal value of dilution water as equivalent to the marginal cost of treatment. According to Gray and Young[38], this marginal cost of treatment increases in region where low flow of water and high level of discharge are combined.
[55] [56]
Groundwater services
Groundwater generates several environmental services such as water purification or wetland maintenance.
[57] [58] [59]
Other Other instream services (example: salt dilution)
[60]
TABLE 2.2:ENVIRONMENTAL SERVICES INCLUDED IN WATER METHODOLOGY
Included in Trucost’s water valuation
Not included in Trucost’s water valuation
Methodology report for Novo Nordisk’s environmental profit and loss account 31

2.6.2 Description of the methodology Trucost has developed a methodology linking the environmental services of water to its scarcity in the considered region. As defined by the Food and Agriculture Organisation (FAO), water scarcity is the freshwater withdrawal as a percentage of total renewable resources[39]. The methodology employed by Trucost to calculate the environmental services value of water follows two steps. The first step involved proving the statistical relationship between the environmental services (or instream) value of water and water scarcity. The second step consists of building a mathematical relationship between the values of each environmental service and water scarcity. 2.6.2.1 Step 1 Trucost reviewed academic literature that applied a homogenous framework to valuing instream water use in different locations across the US (New England, Mid-Atlantic, South Atalantic – Gulf, Great Lakes, Ohio, Tennesse, Upper MI, Lower MI, AK-White-Red, Missouri, Texas-Gulf, Rio Grande, Uppert CO, Lower CO, Great Basin, Pacific NW, California, Souris-Red-Rainy) [40]. The instream value calculated in this study includes waste assimilation, wildlife habitat and recreation values. Trucost has plotted the different instream values according to the water scarcity of the considered US regions cited previously Water scarcity data was provided by the US Geological Survey. Trucost has then modelled the relationship between the instream values and water scarcity thanks to the software R[41]. This relationship is a quadratic function of water scarcity. 2.6.2.2 Step 2 The value curve obtained in the first step has been adjusted in order to build the mathematical relationship between water scarcity and each of the water environmental services. Trucost conducted a literature review in order to calculate weighted average values for each of these services. All valuation estimates were standardised to year 2012 in U.S. dollar equivalents per m3 per year to provide a consistent basis for comparison. Then, Trucost calculated the weighted average water scarcity of the study sites. The results are illustrated in the figure below:
32 Methodology report for Novo Nordisk’s environmental profit and loss account

FIGURE 2.4: VALUE OF WATER AND WATER SCARCITY (DOLLARS2012/M3)
As a result, the model built by Trucost is driven by the water scarcity of a particular region. In the context of this project, water scarcity has been calculated at a country level using the Aquastat database. To calculate the value of one cubic meter of water in one specific region, the Trucost follows the following steps:
• Calculation of the country’s water scarcity; • Calculation of the four dimensions of the environmental value of water:
o Wildlife habitat and recreation; o Waste assimilation; o Groundwater recharge; o Other;
• Purchase Parity Power adjustment of the dimensions based on willingness studies (wildlife habitat and recreation and groundwater recharge);
• Sum of the four dimensions: the result is the environmental services value of one cubic meter of water in the considered country.
2.6.3 Green water valuation According to the ‘Total Economic Value’ (TEV) framework [42], the value of water can be broken down into ‘use’ values and ‘non-use’ values.
Methodology report for Novo Nordisk’s environmental profit and loss account 33

FIGURE 2.5: TOTAL ECONOMIC VALUE
The Global Footprint Network defines green water as the “precipitation on land that does not run off or recharge the groundwater but is stored in the soil or temporarily stays on top of the soil or vegetation. Eventually, this part of precipitation evaporates or transpires through plants. Green water can be made productive for crop growth (although not all green water can be taken up by crops, because there will always be evaporation from the soil and because not all periods of the year or areas are suitable for crop growth)” [43]. To understand the value of green water, the question that needs to be answered is: What are the ecosystem services lost through green water consumption? According to this definition, the value of green water is generated when it is stored in the soil or situated on top of the soil or vegetation. In this state, the ecosystem services generated by water are very low compared to the other water related ecosystem services (example: waste assimilation, wildlife habitat, recreation activities…). Furthermore, the quantity of green water in Novo Nordisk’s EP&L is immaterial compared to the quantity of blue water. Since both the value of one cubic meter of green water is smaller than the value of one cubic meter of blue water and the quantity of green water calculated in this EP&L is very small compared to the quantity of blue water consumed, we can assume that the total value of green water will be immaterial compared to the total value of blue water. Hence, Trucost suggests applying a value of zero to the quantity of green water consumed through Novo Nordisk’s operations and supply chain. 2.7 Land use change (iLUC) Land generates value through ecosystem services, defined as the benefit people obtain from the ecosystems. According to the type of land or ecosystems, the ecosystem services generated and the value of these ecosystems are different.
34 Methodology report for Novo Nordisk’s environmental profit and loss account

2.7.1 Ecosystem services generated by the environment The framework used in this methodology is the Millennium Ecosystem Assessment [44]. This is an international program of evaluation under the United Nations Environment Program (UNEP), active from 2001 to 2005. The aim is to demonstrate the importance of conservation of biodiversity for stakeholders, by showing them how ecosystem services affect human well-being and economic expansion. The MEA suggests the following classification of ecosystem services:
• Cultural services providing recreational, aesthetic, and psychological benefits; • Regulating services affecting climate, flooding, disease, wastes, and water quality,
obtained through regulation of ecosystem processes; • Provisioning services such as food, water, timber, and fibre, obtained from direct
exploitation of resources by humans; • Supporting services such as soil formation, photosynthesis, and nutrient cycling, which
correspond to basic ecological functions at the root of biotic processes;
This paper does not address supporting services: quantifying such processes, which we know and understand insufficiently, seems to be impossible and attempting to evaluate them seems undesirable and likely to raise ethical questions [45]. In the context of this EP&L which is focused on environmental externalities, Trucost will not take into account the ecosystem services which are part of the market (example: provisioning of maize or timber). 2.7.2 Land use change general approach To calculate the value gained or lost through land use change, Trucost recommends comparing the value generated by the current ecosystem to the value generated by the natural ecosystem (the most probable ecosystem before the land use change). Trucost recognizes that there are various land use change valuation methodologies. Figure 2. describes the general approach.
Figure 2.6: Land use change general approach 2.7.3 Application of Trucost methodology to the cultivation of corn in France As the methodology is under development the objective isto value land change of the cultivation of corn in France as a case study. According to a 2009 report[46], the main non-urban or non-cultivated ecosystem in France is temperate forest. Hence, Trucost will compare the value of one hectare of corn cultivated in France to the value of one hectare of French forest. In order to have a consistent comparison, the scope of the ecosystem services valued must be the same for the two ecosystems considered. The most material ecosystem services valued in the literature for these two ecosystems are described below:
Forest Cultivated corn
Direct, use value Provisioning services
Wood forest product (Timber, firewood)* Non wood forest product (honey,
Corn*
Methodology report for Novo Nordisk’s environmental profit and loss account 35

berries, mushrooms…)
Direct, non-use value
Recreational activities
Hunting, promenades, collecting… Promenades
Indirect value Carbon sequestration
Soil Vegetation and leafs Trunks and roots
Corn
Indirect value Pollination Process by which pollen is transferred in the reproduction of plants, thereby enabling fertilization
*Ecosystem services included in market (hence, excluded from the scope)
TABLE 2.3: ECOSYSTEM SERVICES GENERATED BY FOREST AND CULTIVATED CORN
Valuation of 1 hectare of French forest • Provisioning services
The provisioning services included in the scope only concern externalities, which means that the provisioning services such as timber which are part of an existing market are not included. According to Montagne et al. [47], the “non market” provisioning services generated by French forests equal 33.2 million Euros 2001. Trucost divided this number by number of hectares of French forest (FAO STAT) and inflated this number to 2011.
• Recreational activities
Based on six studies from European countries, Trucost calculated the median European recreational value by forests adjusted to French PPP.
• Carbon sequestration
The data used to calculate the quantity of carbon sequestrated in 1 hectare of forest come from Montagne et al (2001) [43]:
• Soil: 70 tC • Vegetation and leafs: 4.4 tC • Wood and roots: 0.7 tC.
The cost applied follows the carbon cost methodology developed by Trucost (86 Euros 2011 per tonne).
• Pollination
According to Brenner-Guillermo [48], the pollination value generated by 1 hectare of forest equals 400 USD 2004 per year. This number has been inflated to 2011 and converted into euros. Valuation of 1 hectare of cultivated corn
• Recreational activities
According to Brenner-Guillermo (2007) [44], the recreational value generated in Spain by 1 hectare of forest equals 37 USD 2004 per year. This number has been adjusted according to French PP, inflated to 2011 and converted into euros.
36 Methodology report for Novo Nordisk’s environmental profit and loss account

• Carbon sequestration
1 kg of corn contains around 367g of carbon[49]. According to the French corn yield (FAO STAT, 2011) [51]; this implies that 1 ha of cultivated corn contains 3.7 tonnes of carbon. The table below summarizes the results of the land use change of 1 hectare of forest into corn.
Temperate French forest
Corn cultivated in France
Euros 2011 per ha Euros 2011 per ha
Direct, use value
Provisioning services
2.56
Direct, non-use value
Recreational activities
2,940.18
22.87
Indirect Carbon sequestration
6,457.50
321.62
Indirect Pollination 304.74
15.24
Total 9,702.42
359.72
Net loss (9,342.70)
TABLE 2.4: LAND USE CHANGE VALUE OF CORN IN FRANCE
The table below summarizes the land use change value for Novo Nordisk glucose sector:
Novo Nordisk glucose land use (ha)
Land use change value (Euros 2011)
3,940 (36,810,229)
TABLE 2.5: GLUCOSE LAND USE CHANGE RESULTS
2.8 Comparison of valuation estimates The table below compares the scope between the methodologies recommended in the Danish guidelines and by Trucost.
Emission type
Damage scope Geographical scope
Danish guidelines Trucost Danish guidelines Trucost
Greenhouse Gas emissions
Marginal abatement cost
Social and environmental costs
Denmark World, country specific
SO2 Health Health, timber, material, water acidification
Total cost of Danish emissions
World, country specific
Methodology report for Novo Nordisk’s environmental profit and loss account 37

NOx Health Health, timber, crops Total cost of Danish emissions
World, country specific
Particulate matter*
Health
Health Total cost of Danish emissions
World, country specific
CO Health - Denmark -
VOC Health, crops ecosystem risks
Health, timber, crops Total cost of Danish emissions
World, country specific
NH3 Health Health, timber Denmark World, country specific
Water -
Wildlife and recreation, waste assimilation, groundwater recharge and other
- World, country specific
Land use change - yes & France
TABLE 2.6: COMPARING OF SCOPES BETWEEN VALUATION METHODS *THE DANISH ESTIMATES COVER PM2.5 WHEREAS TRUCOST ESTIMATES COVER PM9
As shown in this table, the results of the methodologies recommended in the Danish guidelines and by Trucost cannot be directly compared, as the scope of their environmental impacts is different. However, even if Trucost air pollutant methodologies are less focused on health impacts compared to Danish Guidelines, this dimension still remains the highest contributor in terms of value. In the table below, Danish and Trucost estimates for GHG emissions and other air pollutants are shown. Using the Trucost methodology, it is possible to calculate country specific estimates on air pollutants. Global averages as well as estimates for Denmark are shown.
Trucost’s valuations are country specific. The global average has been weighted by population
Emission type
Danish Guidelines
Trucost global average
Trucost Estimates for Denmark
Ratio Danish guidelines/TRUCOST global
Ratio Danish guidelines/TRUCOST Denmark
€/t €/t €/t
SO2 9,891 972 1,530 1017% 647%
NOx 6,330 1,300 577 487% 1098%
PM* 11,869 12,539 7,754 95% 153%
NMVOC 8,440 875 374 964% 2256%
38 Methodology report for Novo Nordisk’s environmental profit and loss account

CO 1
GHGs 21 86 86 24% 24%
NH3 14,507 632 400 2296% 3624%
TABLE 2.7: ESTIMATES FOR GHGS AND OTHER AIR POLLUTANTS (IN EUROS 2011 PER TONNE)
Estimates from Danish Guidelines are in general significantly higher than Trucost estimates except for those relating to GHGs. That is mostly likely due to difference in cost of the value of life which is an important dimension of air pollution. The Statistical Value of Life varies from one country to another and is positively linked to GDP. Hence, the value of life in Denmark is higher compared to poorer countries or to a global average. Trucost decided to have a value of life constant among countries and decided to apply a global average statistical value of life for each country. This average global value weighted by population is approximately 420,000 euros 2011. The studies recommended in the Danish Guidelines use a value of statistical life at app. 2,300,000 euros 2011(50) Hence, the value included in Danish valuation is much higher compared to the value of life included in Trucost valuation. Regarding GHG emissions however, using a damage cost as proposed by Trucost implies a significantly higher value of GHGs than using a marginal abatement cost as proposed in the Danish Guidelines. 2.9 Sensitivity analysis To examine the differences between the two valuation methods, a sensitivity analysis was conducted. The sensitivity analysis only includes the two eKPIs GHG emissions and air pollution. However, they include all the different emission types from Table 2.7.
Methodology eKPI Indirect spend Direct spend Total (EUR million)
Trucost GHG 130.840.364 40.404.764 171
Trucost Air pollution 15.842.834 3.195.126 19
190
Danish EPA GHG 31.949.391 9.866.280 42
Danish EPA Air pollution 75.322.168 18.879.019 94
136
TABLE 2.8:SENSITIVITY ANALYSIS
The Trucost valuation method yields results that are 40% higher than the Danish method. However, based on the differences in the approaches taken and the assumptions made, this variation is to be expected. While valuations may vary from one method to another, it is important
Methodology report for Novo Nordisk’s environmental profit and loss account 39

to maintain transparency on the assumptions used to determine the scope and boundary of each method. Assumptions in the E P&L Model Using EIO tables, and other E P&L approaches implies a number of assumptions and limitations. The assumptions and their influence on the E P&L are summarised below. Assumptions are divided into three areas:
1. Assumptions with regards to the general modelling of the EIO model 2. Assumptions regarding the detailed hybridisation processes 3. Assumptions regarding the valuation
2.9.1 Modelling assumptions Assumption Influence on results
DATA
Average data from EIO tables are applied for purchased products and services.
The level of aggregation in the EIO tables are not 100% aligned with the aggregation level in the financial accounts. That entails a level of uncertainty in emission calculations.
Purchased products and services are divided into three geographical regions, Denmark, Europe and Rest of the World (ROW), depending on the geographical origin of the supplier. The supplier is assumed to follow the general transaction pattern of the respective sector and region.
Location of suppliers is for first tier indirect impacts only – location of suppliers’ supply chains are unknown and results could improve if countries along each tier were disclosed.
For Trucost EIO – converted Direct Spend (kg) into USD using wet to dry weight conversions.
Could potentially over or under estimate results since price per kg was unknown and estimations of total spend were made
TABLE 2.9: ASSUMPTIONS REGARDING THE GENERAL MODELLING
2.9.2 Hybridisation assumptions Assumption Influence on results
DATA
40 Methodology report for Novo Nordisk’s environmental profit and loss account

Assumed all glucose was sourced from France
Impact on energy mix, water footprint, and overall environmental impact
Assumed glucose undergoes 2 processes: o Wet-milling
o Starch to syrup conversion
TABLE 2.10: ASSUMPTIONS REGARDING HYBRIDISATION
2.9.3 Valuation assumptions Assumption Influence on results
DATA
Greenhouse Gas emissions
The social cost of carbon reflects the costs of the environmental damages generated by the increase of carbon in the atmosphere which assumptions are an average 5 degrees and a discount rate of 1.4% Trucost used Stern's estimation of social cost of carbon and adjusted it to 2011.
Other air pollutants
Health cost: use of a global average Terrestrial ecosystem costs: adjustment based on share of natural land Crop costs: adjustment based on crop mix Freshwater acidification cost: adjustment based on share of water surfaces Forestry: adjustment based on share of forest Material costs: adjustment based on purchase parity power
Blue water The main ecosystem services impacted by the abstraction of water are recreation activities and wildlife habitat, waste assimilation and groundwater recharge.
Methodology report for Novo Nordisk’s environmental profit and loss account 41

Green water The value of green water is zero
Land use change The land use change value of glucose equals to the difference between the ecosystem services value generated by cultivated corn and temperate forest in France.
TABLE 2.11: ASSUMPTIONS REGARDING VALUATION
42 Methodology report for Novo Nordisk’s environmental profit and loss account

3. Scenario analysis of water footprint for glucose
For the scenario analysis of water use in the production of glucose, water data from Mekonnen and Hoekstra [51] was used to derive various water intensities per tonne of corn starch produced in various countries. The data set comes from the Water Footprint Network, which has data on water consumption per country per crop for 1999-2005. The data quantifies water intensities for the farming of corn starch inputs for both green and blue water quantities. Within the scope of this project, green water is given a value of EUR0 and blue water is valued on a country level as described in section 2.4.3.3 A comparison was then made between water intensities in France (the country of origin for the glucose used in the Novo Nordisk supply chain), the USA, and China, both of which produce most of the world’s corn. The various water intensities and costs are shown in the table below.
Crop Type Country Water Type Country Average Water Footprint (m3 /tonne of crop)
Cost/tonne (EUR)
Maize (corn) starch
France
Green water 528 -
Blue water 114 29
Total water 643 29
USA
Green water 648 -
Blue water 78 19
Total water 726 19
China
Green water 981 -
Blue water 91 21
Total water 1,073 21
TABLE 3.1: COMPARISON OF WATER INTENSITIES
Methodology report for Novo Nordisk’s environmental profit and loss account 43

4. References
1 PPR (2012), An expert review of the environmental profit and loss account - What the Experts say: the Way Forward. 2 Schmidt J H Weidema B P (2009), Carbon footprint labelling – how to have high data quality and to maximize utilization. Presentation at Joint Actions on Climate Change : 8-10 June 2009, Aalborg, Denmark. 3 Dalgaard R and Schmidt J H (2010), Input-output modelling of the Danish Agricultural Sector - Update of the FORWAST Danish Input-Output Database. Appendix to the report documenting the project 'Pilotprojekt - effektvurdering af forskningsmæssig indsats' (English: Pilot project - assessment of the effect of research) funded by the Danish Ministry of Food, Agriculture and Fishery. The report is currently under publication.
4 Schmidt J H (2010), Documentation of the data consolidation, calibration, and scenario parameterisation. Deliverable 6-1 of the EU FP6- project FORWAST. http://forwast.brgm.fr/
5 Schmidt J H (2010), 25 year forecast of physical stocks, waste, and environmental impact of 9 scenarios. Deliverable 6-2 of the EU FP6-project FORWAST. http://forwast.brgm.fr/
6 Schmidt J H (2010), Contribution analysis, uncertainty assessment, and policy recommendation. Deliverable 6-3 of the EU FP6-project FORWAST. http://forwast.brgm.fr/
7 FORWAST D3.1 (2010), Report describing data processing and validation (Denmark, Austria, France, Germany). Deliverable 3-1 of the EU FP6-project FORWAST. http://forwast.brgm.fr/. The report is currently under publication.
8 FORWAST D4.1 (2010), Report describing data processing and validation (All EU27 countries not covered in deliverable 3.1). Deliverable 4-1 of the EU FP6-project FORWAST. http://forwast.brgm.fr/. The report is currently under publication.
9 Schmidt J H, Weidema B P, and Suh S (2010), Documentation of the final model used for the scenario analyses. Deliverable 6-4 of the EU FP6-project FORWAST. http://forwast.brgm.fr/
10 Dalgaard R (2011), Life Cycle Inventory of DuPont’s key feedstocks. Developed by Randi Dalgaard, 2.-0 LCA consultant. DuPont. For further information contact Mikkel Thrane ([email protected])
11 Suh S, Weidema B P, Schmidt J H, Heijungs R (2010), Generalized Make and Use Framework for Allocation in Life Cycle Assessment. Journal of Industrial Ecology 14(2):335-353
12 ISO 14044 (2006), Environmental management - Life cycle assessment – Requirements and guidelines. International Standard Organization (ISO), Geneve
44 Methodology report for Novo Nordisk’s environmental profit and loss account

13 Schmidt J H and Dalgaard R (2012), National and farm level carbon footprint of milk - Methodology and results for Danish and Swedish milk 2005 at farm gate. Arla Foods, Aarhus, Denmark. http://www.lca-net.com/ArlaMain
14 Møller J, Thøgersen R, Helleshøj M E, Weisbjerg M R, Søegaard K and Hvelplund T (2005), Fodermiddel-tabel 2005 (English: Feed tables 2005). Rapport nr. 112. Dansk Kvæg. Dansk Landbrugsrådgivning
15 Schmidt J H, Weidema B P (2007), Shift in the Marginal Supply of Vegetable Oil. International Journal of Life Cycle Assessment 13(3):235-239
16 Schmidt J H, Reinhard J, and Weidema B P (2012), A Model of Indirect Land Use Change. Paper presented at the 8th International Conference on LCA in the Agri-Food Sector, Rennes, France, 2-4 October 2012
17 Mekonnen, M.M. and Hoekstra, A.Y. (2010) The green, blue and grey water footprint of crops and derived crop products, Value of Water Research Report Series No. 47, UNESCO-IHE, Delft, the Netherlands. http://www.waterfootprint.org/Reports/Report47-WaterFootprintCrops-Vol1.pdf
48 United Nation Environment Programme, Climate Change (2001) Contribution of Working Groups I, II and III to
the Third Assessment Report of the Intergovernmental Panel on Climate Change.
49 Exiopol (2009), Report of the Exiopol project, Dose response function paper, National Environmental Research Institute.
51 FAO STAT, Food and Agriculture Organization of the United Nations, http://faostat.fao.org/site/291/default.aspx
18 Stern, N. (2006) Stern Review: The Economics of Climate Change, HM Treasury, UK.
19 Ackerman and Stanton (2012), Climate Risks and Carbon Prices: Revising the Social Cost of Carbon, Economics: The Open-Access, Open-Assessment E-Journal, Vol. 6, 2012-10.
20 Sterner E. and Persson M. (2007) An Even Sterner Review: Introducing Relative Prices into the Discounting Debate
21 http://data.worldbank.org/indicator/FP.CPI.TOTL.ZG/countries?page=1&display=default
22 World Bank(2012): State and trend of the carbon market 2012.
23 Andersen et al (2008) A Non-linear Eulerian approach for assessment of health-cost externalities of air pollution
24 US EPA http://www.epa.gov/air/particlepollution/ (Accessed 9.7.11)
25 Fiedler et al (2009) East Asian SO2 pollution plume over Europe – Part 1: Airborne trace gas measurements and source identification by particle dispersion model simulations.
26 Steinfeld , Gerber et al (2006) Livestock’s Long Shadow: Environmental Issues and Options.
27 World Bank Group (1998) Nitrogen oxides, Pollution Prevention and Abatement Handbook, July 1998.
28 US EPA http://www.epa.gov/iaq/voc.html (Accessed 12.10.11)
Methodology report for Novo Nordisk’s environmental profit and loss account 45
29 US EPA http://www.epa.gov/air/ozonepollution/ (Accessed 9.7.11)
30 US EPA http://www.epa.gov/region7/air/quality/health.htm (Accessed 9.7.11)
31 ExternE Project (2003) Research result on socio-environmental damages due to electricity and transports, European Commission Community Researvh. Available at URL: http://www.externe.info/externe_2006/externpr.pdf
32 Andersen, M.S. (2010): Miljøøkonomiske beregningspriser for emissioner, Faglig rapport fra DMU nr. 783
33 EEA (2011): Revealing the cost of air pollution from industrial facilities in Europe. EEA Technical report no. 15
34 Andersen, M.S. & N. Strange (2003): Miljøøkonomiske beregningspriser, Forprojekt, Faglig rapport fra DMU, nr. 459
35 Dansk Landbrug et al. (2008): Evaluering af det generelle ammoniakkrav.
36 System of Environmental-Economic Accounting for Water, prepared by United Nations Statistics Division upon recommendation by the UN Committee of Experts on Environmental-Economic Accounting, March 2007
37 Merrit, Mart, “Marginal values of dilution of water”, 1969.
38 Gray, Young, “The economic value of water for waste dilution: regional forecasts to 1980”, 1974.
39 http://www.fao.org/nr/water/aquastat/data/glossary/search.html?lang=en
40 FREDERICJ, VANDEBBERG, HANSON, Economic values of freshwater in the United States, 1997. Instream value refers to water in the environment and is counter to withdrawal value.
41 http://www.r-project.org/
42 Eftec (2010), Scoping Study on the Economic (or Non-Market) Valuation Issues and the Implementation of the Water Framework Directive – Final Report, Prepared for the European Commission Directorate- General Environment, September 2010.
43 http://www.waterfootprint.org/?page=files/Glossary
44 Millennium Ecosystem Assessment (2005) Ecosystem and Human Well-being: Synthesis. Island Press, Washington, DC
45 Tomam, M (1998) Why not to calculate the value of the world’s ecosystem services and natural capital. Ecol. Eco. 25 (1), 57-60.
46 Etude exploratoire pour une evaluation des services rendus par les ecosystems en France, Application du Millenium Ecosystem Assessment a la France, Credoc, 2009.
47 Montagne C., Peyron J.L. (2001), La valeur economique totale de la foret mediterraneenne francaise.
48 Brenner-Guillermo J (2007) Valuation of ecosystem services in the Catalan coastal zone, Marine Sciences, Polytechnic University of Catalonia.
46 Methodology report for Novo Nordisk’s environmental profit and loss account

49 http://lcacenter.org/lcaxi/final/356.pdf
50 AEA Technology Environment (2005): Methodology for the Cost-Benefit analysis for CAFE: Volume 2: Health Impact Assessment.
51 Mekonnen, M.M. and Hoekstra, A.Y. (2010) The green, blue and grey water footprint of crops and derived crop products, Value of Water Research Report Series No. 47, UNESCO-IHE, Delft, the Netherlands. http://www.waterfootprint.org/Reports/Report47-WaterFootprintCrops-Vol1.pdf
48 United Nation Environment Programme, Climate Change (2001) Contribution of Working Groups I, II and III to
the Third Assessment Report of the Intergovernmental Panel on Climate Change.
49 Exiopol (2009), Report of the Exiopol project, Dose response function paper, National Environmental Research Institute.
51 FAO STAT, Food and Agriculture Organization of the United Nations, http://faostat.fao.org/site/291/default.aspx
52 BROWN, HARDIN, PAYTON, The Marginal economic value of stream flow, p.56, 2000.
53 LANDRY, In-stream Flow Marketing in the Pacific Northwest Regional Economic Conference: Conflict and Collaboration: How Government, Business, and Academia Shape the Pacific Northwest Economy, 1998.
54 LOOMIS, The Economic Value of Instream Flow: Methodology and Benefit Estimates for Optimum Flows, 1987.
55 FREDERICJ, VANDEBBERG, HANSON, Economic values of freshwater in the United States, 1997.
56 MORAN, DANN, The economic value of water use: Implications for implementing the Water Framework Directive in Scotland, Journal of Environmental Management, 87 (3), pp. 484-496, 2008.
57 TORELL, LIBBIN, MILLER, The Market Value of Water in the Ogallala Aquifer, Land Economics, 1990.
58 POLLOCK, Scarcity Rents for Water: A Valuation and Pricing Model, Land Economics 64(1): 62-72.
59 BUREC, Farm Profitability and BUREC Water Subsidies: An LP Look at a Region, Contemporary Economic Policy 16(4): 442-45.
60 POSTLE, CARPENTER, Freshwater Ecosystem Services, Nature’s Services, Dailey, G. (ed.), Island Press.
Methodology report for Novo Nordisk’s environmental profit and loss account 47

48 Methodology report for Novo Nordisk’s environmental profit and loss account

Methodology report for Novo Nordisk’s environmental profit and loss account The Novo Nordisk Environmental Profit and Loss Account (E P&L) is a response to PUMA’s call for contributions to the E P&L methodology and the expert review of PUMA’s E P&L. The Novo Nordisk E P&L is reported in two parts; the main report, which focuses on the results and the application of these in a Novo Nordisk context, and the methodology report which focuses on the methodology applied for establishing the E P&L results. This methodology report 1) summarises the methodological contributions and deviations from PUMA’s original E P&L methodology, and 2) provides a detailed explanation of the data sets, quantification methods, and valuation methodologies used to complete the E P&L.
Strandgade 29 1401 Copenhagen K, Denmark Tel.: (+45) 72 54 40 00
www.mst.dk

Strandgade 29 DK - 1401 København K Tlf.: (+45) 72 54 40 00
www. mst.dk