Methodology for Rating General Trading and Investment Companies
23
Warning: S&P.com will be conducting routine maintenance Friday at 5pm through Sunday at 5pm, EST. Site performance may not be optimal during this time. In addition, there will be a period of time when there will be no ratings updates. We apologize for the inconvenience and thank you for your patience. Criteria | Corporates | Industrials: Methodology For Rating General Trading And Investment Companies 10-Jun-2015 01:50 EDT View Analyst Contact Information Table of Contents I. SCOPE OF THE CRITERIA II. SUMMARY OF THE CRITERIA III. CHANGES FROM REQUEST FOR COMMENT IV. IMPACT ON OUTSTANDING RATINGS V. EFFECTIVE DATE AND TRANSITION VI. METHODOLOGY A. Framework B. Industry Risk Assessment C. Country Risk Assessment D. Competitive Position Assessment E. Capital Adequacy Assessment F. Profitability Assessment G. Risk Position And Asset Risk Management Capabilities Assessment H. Modifiers VII. APPENDIXES Appendix I Appendix II Appendix III Appendix IV VIII. RELATED CRITERIA AND RESEARCH Related Criteria Related Research 1. Standard & Poor's Ratings Services is publishing its criteria for rating general trading and investment companies. The criteria articulate the steps in developing a stand-alone credit profile (SACP) and issuer credit rating (ICR) for general trading and investment companies (see " Stand-Alone Credit Profiles: One Component Of A Rating," published Oct. 1, 2010, for the definition of an SACP). This article follows our " Request For Comment: Methodology For Rating General Trading And Investment Companies ," published Dec. 18, 2014, and is related to the criteria article " Principles Of Credit Ratings," published Feb. 16, 2011. I. SCOPE OF THE CRITERIA 2. These criteria apply to general trading and investment companies. We define these as companies that have significantly diversified business trading portfolios and exposure to various risks through long-term investments in multiple businesses. 3. In their trading business, general trading and investment companies act as intermediaries or wholesalers for their customers, with whom they typically have long-term contractual relationships that may encompass providing procurement and distribution services, trading finance and logistics, trade market intelligence, and consulting for a large variety of goods and markets. 4. Key characteristics of the sector's investment business are to maintain a broadly diversified portfolio of businesses across many different industries, as well as to establish vertical integration within each industry. The investment business does not aim for short-term capital gains from equity investments. Rather, it focuses more on creating value chains in various industries over the long term and is tied to customers' needs. General trading and investment companies must operate across at least three different industries to fall under the scope of these criteria. 5. While the criteria apply to Japanese general trading and investment companies (typically called "general trading companies" or "sogo- shosha"), companies with similar characteristics outside Japan would fall under the scope of these criteria. We intend to apply the same analytical framework to such non-Japanese general trading and investment companies that meet the characteristics described in these criteria. 6. These criteria do not apply to commodity traders (see " Commodities Trading Industry Methodology," published Jan. 29, 2015). Although general trading and investment companies engage in commodity trading activities to some degree, their trading business extends well beyond commodities and is aimed at providing customers with wholesale services rather than at exploiting short-term arbitrage opportunities, and is more contractual in nature than transactional. These criteria also do not apply to investment holding companies, which manage portfolios of equity securities, typically as financial investors and often without pursuing synergies among investments (see " Request For Comment: Methodology: Investment Holding Companies," published Nov. 26, 2014). II. SUMMARY OF THE CRITERIA 7. In the criteria, we describe the methodology and assumptions we use to determine SACPs and ICRs for general trading and investment companies (see " Stand-Alone Credit Profiles: One Component Of A Rating," published Oct. 1, 2010, for the definition of an SACP). We arrive at a company's SACP by taking into account its: (1) Corporate Industry and Country Risk Assessment (CICRA), (2) competitive position, (3) capital adequacy, (4) profitability, (5) risk position and asset risk management capabilities, and (6) modifiers, as displayed in chart 1. If a group company or government body could exert extraordinary influence on the company we are rating, we determine the ICR by applying " Group Rating Methodology," published Nov. 19, 2013, and/or " Rating Government-Related Entities: Methodology And Assumptions," published March 25, 2015. Otherwise, we determine the ICR without further adjusting the SACP, while taking into account the limitations for
-
Upload
ahmad-so-mad -
Category
Documents
-
view
251 -
download
4
description
Request for comment: methodology for rating general Trading and Investment Companies.
Transcript of Methodology for Rating General Trading and Investment Companies
Warning: S&P.com will be conducting routine maintenance Friday at 5pm through Sunday at 5pm, EST. Site performance may not be optimalduring this time. In addition, there will be a period of time when there will be no ratings updates. We apologize for the inconvenience andthank you for your patience.
Criteria | Corporates | Industrials: Methodology For Rating General TradingAnd Investment Companies10-Jun-2015 01:50 EDTView Analyst Contact InformationTable of ContentsI. SCOPE OF THE CRITERIAII. SUMMARY OF THE CRITERIAIII. CHANGES FROM REQUEST FOR COMMENTIV. IMPACT ON OUTSTANDING RATINGSV. EFFECTIVE DATE AND TRANSITIONVI. METHODOLOGYA. FrameworkB. Industry Risk AssessmentC. Country Risk AssessmentD. Competitive Position AssessmentE. Capital Adequacy AssessmentF. Profitability AssessmentG. Risk Position And Asset Risk Management Capabilities AssessmentH. ModifiersVII. APPENDIXESAppendix IAppendix IIAppendix IIIAppendix IVVIII. RELATED CRITERIA AND RESEARCHRelated CriteriaRelated Research1. Standard & Poor's Ratings Services is publishing its criteria for rating general trading and investment companies. The criteria articulatethe steps in developing a stand-alone credit profile (SACP) and issuer credit rating (ICR) for general trading and investment companies (see"Stand-Alone Credit Profiles: One Component Of A Rating," published Oct. 1, 2010, for the definition of an SACP). This article follows our"Request For Comment: Methodology For Rating General Trading And Investment Companies," published Dec. 18, 2014, and is related to thecriteria article "Principles Of Credit Ratings," published Feb. 16, 2011.
I. SCOPE OF THE CRITERIA2. These criteria apply to general trading and investment companies. We define these as companies that have significantly diversifiedbusiness trading portfolios and exposure to various risks through long-term investments in multiple businesses.
3. In their trading business, general trading and investment companies act as intermediaries or wholesalers for their customers, with whomthey typically have long-term contractual relationships that may encompass providing procurement and distribution services, trading financeand logistics, trade market intelligence, and consulting for a large variety of goods and markets.
4. Key characteristics of the sector's investment business are to maintain a broadly diversified portfolio of businesses across many differentindustries, as well as to establish vertical integration within each industry. The investment business does not aim for short-term capital gainsfrom equity investments. Rather, it focuses more on creating value chains in various industries over the long term and is tied to customers'needs. General trading and investment companies must operate across at least three different industries to fall under the scope of thesecriteria.
5. While the criteria apply to Japanese general trading and investment companies (typically called "general trading companies" or "sogo-shosha"), companies with similar characteristics outside Japan would fall under the scope of these criteria. We intend to apply the sameanalytical framework to such non-Japanese general trading and investment companies that meet the characteristics described in thesecriteria.
6. These criteria do not apply to commodity traders (see "Commodities Trading Industry Methodology," published Jan. 29, 2015). Althoughgeneral trading and investment companies engage in commodity trading activities to some degree, their trading business extends wellbeyond commodities and is aimed at providing customers with wholesale services rather than at exploiting short-term arbitrageopportunities, and is more contractual in nature than transactional. These criteria also do not apply to investment holding companies, whichmanage portfolios of equity securities, typically as financial investors and often without pursuing synergies among investments (see"Request For Comment: Methodology: Investment Holding Companies," published Nov. 26, 2014).
II. SUMMARY OF THE CRITERIA7. In the criteria, we describe the methodology and assumptions we use to determine SACPs and ICRs for general trading and investmentcompanies (see "Stand-Alone Credit Profiles: One Component Of A Rating," published Oct. 1, 2010, for the definition of an SACP). We arriveat a company's SACP by taking into account its: (1) Corporate Industry and Country Risk Assessment (CICRA), (2) competitive position, (3)capital adequacy, (4) profitability, (5) risk position and asset risk management capabilities, and (6) modifiers, as displayed in chart 1. If agroup company or government body could exert extraordinary influence on the company we are rating, we determine the ICR by applying"Group Rating Methodology," published Nov. 19, 2013, and/or "Rating Government-Related Entities: Methodology And Assumptions,"published March 25, 2015. Otherwise, we determine the ICR without further adjusting the SACP, while taking into account the limitations for

assigning an ICR that is above the relevant sovereign rating, according to "Ratings Above The Sovereign--Corporate And GovernmentRatings: Methodology And Assumptions," published Nov. 19, 2013.
8. The criteria partially supersede paragraph 8 of "Group Rating Methodology," published Nov. 19, 2013, so that general trading andinvestment companies then fall under the scope of the "Group Rating Methodology". If a general trading and investment company is theultimate parent of a group or is the subsidiary of a corporate group, section IX for analyzing corporate groups in the "Group RatingMethodology" apply. Likewise, when assessing hybrid capital issues for general trading and investment companies, we follow the corporateapproach (see "Hybrid Capital Handbook: September 2008 Edition," published Sept. 15, 2008, and "Methodology And Assumptions:Assigning Equity Content To Corporate Entity And North American Insurance Holding Company Hybrid Capital Instruments," published April1, 2013).
9. General trading and investment companies have significant exposure to investments and their varied risks. Thus, we believe the key creditfactors in the sector--like those for financial institutions and in addition to those for other industrial companies--include: (1) thediversification of a company's business portfolio, (2) its strategic investment capability, (3) its risk buffer (capital and profitability) to absorblosses from investments, (4) its risk position and asset risk management capabilities, and (5) funding and liquidity.
Chart 1
III. CHANGES FROM REQUEST FOR COMMENT10. See "Standard & Poor's Summarizes Feedback On Methodology For Rating General Trading And Investment Companies Request ForComment," which is being published in conjunction with these criteria.
IV. IMPACT ON OUTSTANDING RATINGS11. We expect a one-notch upward rating impact on one issuer as a result of implementation of these criteria.
V. EFFECTIVE DATE AND TRANSITION12. The criteria described in this article are effective immediately, except in markets that require prior notification to, or registration by, thelocal regulator. In these markets, the criteria will become effective when so notified by Standard & Poor's or registered by the regulator.
VI. METHODOLOGYA. Framework13. We view general trading and investment companies as a hybrid of other industrial companies and financial institutions. This is becausethey conduct two distinctly different businesses--trading and investment. Their trading activities make them similar to industrial companies.However, their investment activities resemble those of financial institutions that make long-term investments. Accordingly, we apply a hybridmethodology as indicated in chart 1. Some parts of this methodology use a framework that draws on elements of the "CorporateMethodology" criteria, published Nov. 19, 2013, such as determining the anchor from an assessment of the business risk profile andfinancial risk profile, and using modifiers to determine an SACP.
14. However, we differentiate general trading and investment companies from other industrial companies, in particular, by considering (1)the significant degree of diversification of their portfolios across their trading and investment businesses (see section B. Industry RiskAssessment) and (2) their ability to make strategic investments (see section D. Competitive Position Assessment) as key factors supportingtheir business risk profiles. The key credit factors for their financial risk profiles--like those for financial institutions and unlike those forother industrial companies--are (3) capital adequacy (see section E. Capital Adequacy Assessment), (4) profitability (see section F.Profitability Assessment), and (5) risk position and asset risk management capabilities (see section G. Risk Position And Asset RiskManagement Capabilities Assessment).
15. Unlike our methodology for other industrial companies, our assessment of competitive position for general trading and investmentcompanies does not take into account operating efficiency because we believe this is not a meaningful factor in determining a generaltrading and investment company's competitive position, particularly in its investment business.
16. Typically, such a company's fixed costs are not as material as those of manufacturers. Manufacturing processes and technology, which
are key elements in assessing other industrial companies, are less relevant for general trading and investment companies, in our view.Similarly, working capital management is a minor factor in running an investment business.
17. We assess a general trading and investment company's profitability not in the competitive position within the business risk profile but inthe financial risk profile because:
Fluctuations in general trading and investment companies' profits are largely attributable to their investment business, rather than theirtrading business. We have observed this from past defaults of general trading and investment companies.The profitability of the investment business is often directly related to the risk nature of the investment portfolio, including market trends ofnatural resources (including mining) and commodities, and may not be a direct function of the investment business' competitive position.18. The methodology combines the business risk profile and financial risk profile to form an "anchor" (see table 3 below).
19. We may then raise or lower the anchor based on an assessment of five modifiers: (1) capital structure, (2) financial policy, (3) fundingand liquidity, (4) management and governance, and (5) comparable ratings analysis. The result will be the final SACP. If we expect anyextraordinary influence from a group company or government body, we determine the ICR from the SACP by applying our "Group RatingMethodology," published Nov. 19, 2013, and/or "Rating Government-Related Entities: Methodology And Assumptions," published March 25,2015. Otherwise, we determine the ICR without further adjusting the SACP, while taking into account the potential limitations on an ICR dueto the application of "Ratings Above The Sovereign--Corporate And Government Ratings: Methodology And Assumptions," published Nov.19, 2013.
1. Determining the business risk profile assessment20. We assess a company's business risk profile using a six-point scale that defines 1 as excellent; 2, strong; 3, satisfactory; 4, fair; 5, weak;and 6, vulnerable.
21. The combined assessments for country risk, industry risk, and competitive position determine a company's business risk profile. Ageneral trading and investment company's strengths or weaknesses in both its trading business and investment business are keydeterminants of our assessment of its business risk profile.
22. Industry risk addresses the relative health and stability of the markets in which a company operates. The range of industry riskassessments is: 1, very low risk; 2, low risk; 3, intermediate risk; 4, moderately high risk; 5, high risk; and 6, very high risk. We establishindustry risk for general trading and investment companies by applying, in a modified manner, our industry risk criteria (see "Methodology:Industry Risk," published Nov. 19, 2013), and assigned an assessment of '3, intermediate risk' for the industry risk of all general trading andinvestment companies. Our methodology for industry risk is in section B.
23. Country risk addresses the economic risk, institutional and governance effectiveness risk, financial system risk, and payment culture orrule-of-law risk in the countries in which a company operates. The range of country risk assessments is: 1, very low risk; 2, low risk; 3,intermediate risk; 4, moderately high risk; 5, high risk; and 6, very high risk. Our methodology for country risk is in section C.
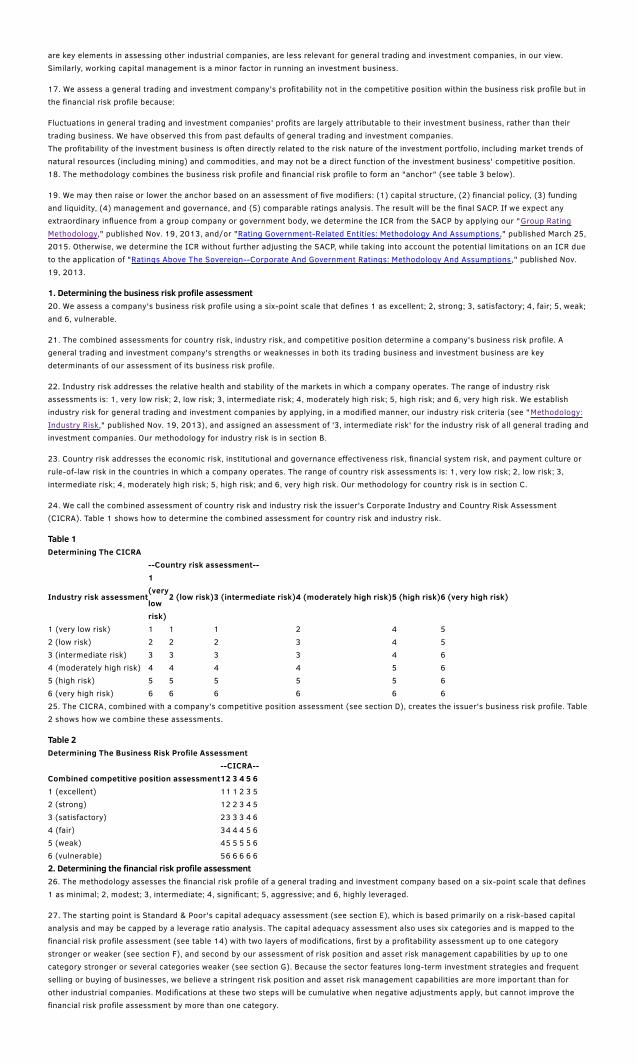
24. We call the combined assessment of country risk and industry risk the issuer's Corporate Industry and Country Risk Assessment(CICRA). Table 1 shows how to determine the combined assessment for country risk and industry risk.
Table 1Determining The CICRA
--Country risk assessment--
Industry risk assessment
1(verylowrisk)
2 (low risk)3 (intermediate risk)4 (moderately high risk)5 (high risk)6 (very high risk)
1 (very low risk) 1 1 1 2 4 52 (low risk) 2 2 2 3 4 53 (intermediate risk) 3 3 3 3 4 64 (moderately high risk) 4 4 4 4 5 65 (high risk) 5 5 5 5 5 66 (very high risk) 6 6 6 6 6 625. The CICRA, combined with a company's competitive position assessment (see section D), creates the issuer's business risk profile. Table2 shows how we combine these assessments.
Table 2Determining The Business Risk Profile Assessment
--CICRA--Combined competitive position assessment12 3 4 5 61 (excellent) 11 1 2 3 52 (strong) 12 2 3 4 53 (satisfactory) 23 3 3 4 64 (fair) 34 4 4 5 65 (weak) 45 5 5 5 66 (vulnerable) 56 6 6 6 62. Determining the financial risk profile assessment26. The methodology assesses the financial risk profile of a general trading and investment company based on a six-point scale that defines1 as minimal; 2, modest; 3, intermediate; 4, significant; 5, aggressive; and 6, highly leveraged.
27. The starting point is Standard & Poor's capital adequacy assessment (see section E), which is based primarily on a risk-based capitalanalysis and may be capped by a leverage ratio analysis. The capital adequacy assessment also uses six categories and is mapped to thefinancial risk profile assessment (see table 14) with two layers of modifications, first by a profitability assessment up to one categorystronger or weaker (see section F), and second by our assessment of risk position and asset risk management capabilities by up to onecategory stronger or several categories weaker (see section G). Because the sector features long-term investment strategies and frequentselling or buying of businesses, we believe a stringent risk position and asset risk management capabilities are more important than forother industrial companies. Modifications at these two steps will be cumulative when negative adjustments apply, but cannot improve thefinancial risk profile assessment by more than one category.

28. Through the capital adequacy assessment, we measure the amount of capital that a general trading and investment company needs toabsorb losses from disparate risks over defined stress scenarios. The methodology for assessing the financial risk profile differs from thatcovering other industrial companies in that it focuses on a company's capital adequacy rather than on cash flow adequacy. We do this forthe following reasons:
We believe general trading and investment companies' cash flow cannot be well captured by looking at funds from operations (FFO) orEBITDA. Unlike other industrial companies, general trading and investment companies have significant cash inflows or outflows frominvestment activities, in addition to cash flows from operations. Even if their FFO and/or EBITDA decreases, general trading and investmentcompanies may still be able to manage cash needs by reducing new investments and/or monetizing existing investments. In defaults ofJapanese general trading and investment companies in the late 1990s and early 2000s, we observed that the default trigger was generallylosses from investment businesses, not a decline in operating cash flow. A key default trigger was significant equity erosion frominvestments reported as nonrecurring losses, not losses from trading. In fact, most companies maintained positive FFO shortly beforedefaulting. Therefore, their operating cash flow parameters were not a good leading indicator of default, in our view.Cash flow measures cannot capture earnings of a company's unconsolidated equity affiliates, and general trading and investment companiestypically have sizable investments in such equity affiliates.3. Merging the business risk profile and financial risk profile assessments29. We combine our assessments of an issuer's business risk profile and its financial risk profile to determine an anchor for the issuer (seetable 3). If we view an issuer's capital structure as unsustainable or if its obligations are currently vulnerable to nonpayment, and if theobligor depends on favorable business, financial, and economic conditions to meet its obligations, we will determine the issuer's SACP using"Criteria For Assigning 'CCC+', 'CCC', 'CCC-', And 'CC' Ratings," published Oct. 1, 2012. If the issuer meets the conditions for assigning a'CCC+', 'CCC', 'CCC-', or 'CC' rating, we will not apply table 3.
Table 3Combining The Business And Financial Risk Profiles To Determine The Anchor
--Financial risk profile--
Business risk profile1(minimal)
2 (modest)3 (intermediate)4 (significant)5 (aggressive)6 (highly leveraged)
1 (excellent) aaa/aa+ aa a+/a a- bbb bbb-/bb+2 (strong) aa/aa- a+/a a-/bbb+ bbb bb+ bb3 (satisfactory) a/a- bbb+ bbb/bbb- bbb-/bb+ bb b+4 (fair) bbb/bbb- bbb- bb+ bb bb- b5 (weak) bb+ bb+ bb bb- b+ b/b-6 (vulnerable) bb- bb- bb-/b+ b+ b b-30. When two different anchor outcomes are possible for a given combination of business risk profile and financial risk profile, we determinean issuer's anchor as follows:
When a company's financial risk profile is 4 or stronger (meaning, 1-4), we base the anchor on the comparative strength of its business riskprofile. We consider our assessment of the business risk profile for general trading and investment companies to be points along a range.Each assessment that ultimately generates the business risk profile can be at the upper or lower end of the range. Issuers with strongerbusiness risk profiles for the range of anchor outcomes will have the higher anchor. Those with a weaker business risk profile for the rangeof outcomes will have the lower anchor.When a company's financial risk profile is 5 or 6, we base the anchor on the comparative strength of the company's financial risk profile.Issuers with stronger financial risk profiles for the range of anchor outcomes will have the higher anchor. Issuers with a weaker financial riskprofile for the range of anchor outcomes will have the lower anchor.4. Building on the anchor31. The analysis of capital structure, financial policy, funding and liquidity, and management and governance may raise or lower the anchorfor a company. Our assessment of each of these modifiers can raise or lower the anchor by one or more notches, or in some cases cap theSACP—or have no effect in other cases. However, this notching in aggregate can't lower an issuer's anchor below 'b-' (see "Criteria ForAssigning 'CCC+', 'CCC', 'CCC-', And 'CC' Ratings," published Oct. 1, 2012, for the methodology we use to assign 'CCC' and 'CC' categorySACPs and ICRs to issuers).
32. Table 4 below illustrates the impact of the first, second, and fourth modifier factors on the anchor. The impact of the third modifier,funding and liquidity, is shown in table 5.
Table 4Impact Of Three Modifier Factors On The Anchor
--Anchor range--a- andhigher
bbb+ to bbb- bb+ to bb- b+ and lower
Capital structure1 (neutral) 0 notches 0 notches 0 notches 0 notches2 (negative) -1 notch -1 notch -1 notch -1 notch
3 (very negative)-2 or morenotches
-2 or more notches -2 or more notches -2 notches
Financial policy
1 (positive)
+1 notch ifM&G is atleastsatisfactory
+1 notch if M&G is at leastsatisfactory
+1 notch if M&G is at leastsatisfactory
+1 notch if M&G is at leastsatisfactory
2 (neutral) 0 notches 0 notches 0 notches 0 notches
3 (negative)-1 to -3notches*
-1 to -3 notches* -1 to -2 notches* -1 notch
Management and governance (M&G)1 (strong) 0 notches 0 notches 0 notches, +1 notch§ 0 notches, +1 notch§2 (satisfactory) 0 notches 0 notches 0 notches 0 notches3 (fair) -1 notch 0 notches 0 notches 0 notches
4 (weak)-2 or morenotches†
-2 or more notches† -1 or more notches† -1 or more notches†
*The number of notches depends on potential incremental leverage. §This adjustment is one notch if we have not already captured thebenefits of strong management and governance in the analysis of the issuer's competitive position. †The number of notches depends uponthe degree of negative impact on the enterprise's risk profile.33. We apply the four modifiers in the order listed in paragraph 31. As we go down the list, a modifier may (or may not) change the anchorto a new range (one of the ranges in the four right-hand columns in table 4, except funding and liquidity, which is subject to table 5). Wechoose the appropriate value from the new range to determine the next modifier's effect on the anchor, and so on, until we get to the lastmodifier on the list--management and governance. For example, let's assume that the anchor is 'a'. If the capital structure assessment isvery negative, the indicated anchor drops two notches, to 'bbb+'. So, to determine the impact of the next modifier, financial policy, we go tothe column "bbb+ to bbb-" and find the appropriate assessment--in this theoretical example, positive. Applying that assessment moves theanchor up one notch, to the "a- and higher" category. In our example, funding and liquidity are both adequate while management andgovernance is satisfactory, and thus the anchor remains 'a-'. If the liquidity assessment caps the SACP, management and governance orcomparable ratings analysis does not result in any uplift.
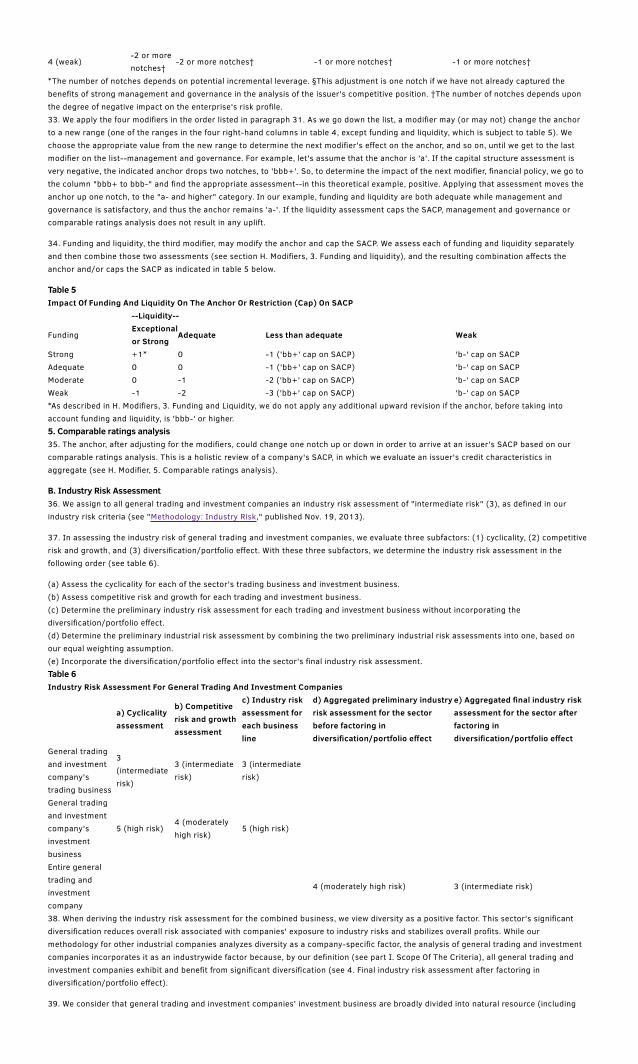
34. Funding and liquidity, the third modifier, may modify the anchor and cap the SACP. We assess each of funding and liquidity separatelyand then combine those two assessments (see section H. Modifiers, 3. Funding and liquidity), and the resulting combination affects theanchor and/or caps the SACP as indicated in table 5 below.
Table 5Impact Of Funding And Liquidity On The Anchor Or Restriction (Cap) On SACP
--Liquidity--
FundingExceptionalor Strong
Adequate Less than adequate Weak
Strong +1* 0 -1 ('bb+' cap on SACP) 'b-' cap on SACPAdequate 0 0 -1 ('bb+' cap on SACP) 'b-' cap on SACPModerate 0 -1 -2 ('bb+' cap on SACP) 'b-' cap on SACPWeak -1 -2 -3 ('bb+' cap on SACP) 'b-' cap on SACP*As described in H. Modifiers, 3. Funding and Liquidity, we do not apply any additional upward revision if the anchor, before taking intoaccount funding and liquidity, is 'bbb-' or higher.5. Comparable ratings analysis35. The anchor, after adjusting for the modifiers, could change one notch up or down in order to arrive at an issuer's SACP based on ourcomparable ratings analysis. This is a holistic review of a company's SACP, in which we evaluate an issuer's credit characteristics inaggregate (see H. Modifier, 5. Comparable ratings analysis).
B. Industry Risk Assessment36. We assign to all general trading and investment companies an industry risk assessment of "intermediate risk" (3), as defined in ourindustry risk criteria (see "Methodology: Industry Risk," published Nov. 19, 2013).
37. In assessing the industry risk of general trading and investment companies, we evaluate three subfactors: (1) cyclicality, (2) competitiverisk and growth, and (3) diversification/portfolio effect. With these three subfactors, we determine the industry risk assessment in thefollowing order (see table 6).
(a) Assess the cyclicality for each of the sector's trading business and investment business.(b) Assess competitive risk and growth for each trading and investment business.(c) Determine the preliminary industry risk assessment for each trading and investment business without incorporating thediversification/portfolio effect.(d) Determine the preliminary industrial risk assessment by combining the two preliminary industrial risk assessments into one, based onour equal weighting assumption.(e) Incorporate the diversification/portfolio effect into the sector's final industry risk assessment.Table 6Industry Risk Assessment For General Trading And Investment Companies
a) Cyclicalityassessment
b) Competitiverisk and growthassessment
c) Industry riskassessment foreach businessline
d) Aggregated preliminary industryrisk assessment for the sectorbefore factoring indiversification/portfolio effect
e) Aggregated final industry riskassessment for the sector afterfactoring indiversification/portfolio effect
General tradingand investmentcompany'strading business
3(intermediaterisk)
3 (intermediaterisk)
3 (intermediaterisk)
General tradingand investmentcompany'sinvestmentbusiness
5 (high risk)4 (moderatelyhigh risk)
5 (high risk)
Entire generaltrading andinvestmentcompany
4 (moderately high risk) 3 (intermediate risk)
38. When deriving the industry risk assessment for the combined business, we view diversity as a positive factor. This sector's significantdiversification reduces overall risk associated with companies' exposure to industry risks and stabilizes overall profits. While ourmethodology for other industrial companies analyzes diversity as a company-specific factor, the analysis of general trading and investmentcompanies incorporates it as an industrywide factor because, by our definition (see part I. Scope Of The Criteria), all general trading andinvestment companies exhibit and benefit from significant diversification (see 4. Final industry risk assessment after factoring indiversification/portfolio effect).
39. We consider that general trading and investment companies' investment business are broadly divided into natural resource (including

mining) investments and nonresource investments. The former usually accounts for a large portion of investment business profits and assetsbut the companies usually are not project operators or majority owners. The latter includes business management and equity investmentsthrough their subsidiaries and equity affiliates. Our industry risk assessment and competitive position assessment for the investmentbusiness focus on both types of investments.
1. Cyclicality assessment40. The cyclicality assessment differs from the one in our industry risk criteria, in that we assess the cyclicality of the general trading andinvestment company's industry by looking at pretax net income, instead of revenue and the EBITDA margin. We believe this approach bettercaptures the nature of general trading and investment companies, because they have some similarities to financial institutions.
41. The EBITDA margin does not fully capture a general trading and investment company's profitability because income statement itemsinclude noncash items such as capital gains or losses mainly in its investment business, and profits from its unconsolidated equity affiliates.Accordingly, we believe it is not useful to compare a general trading and investment company's volatility in revenues and EBITDA marginwith those of other industrial companies.
42. While we assess the cyclicality of companies' trading and investment businesses separately, pretax net income for each business is notavailable separately. Therefore, we examine the pretax net income for the combined business and then determine the cyclicality assessmentfor each business using a qualitative judgment. Our historical data observations show that the profitability (pretax net income) of generaltrading and investment companies is less volatile than that of other industrial companies with a cyclicality assessment of '5' and similar tothat of industries with cyclicality assessments of '4'. Accordingly, we assess the aggregated cyclicality assessment as "moderately high" (4).
43. At the business line level, we assess the cyclicality as "intermediate risk" (3) for the trading business. This is because general tradingand investment companies can often pass on price fluctuations to their clients under purchase agreements (fixed price or market-linkedprice formula), or enter into hedging contracts for the remaining portion. We assess the cyclicality of the investment business as "high risk"(5) because this business typically focuses on natural resources and/or equity investments.
2. Competitive risk and growth assessment44. We assess general trading and investment companies as warranting an "intermediate risk" (3) for their trading business and a"moderately high risk" (4) for their investment business, for the purpose of determining their competitive risk and growth assessments. Toassess competitive risk and growth for each business, we evaluate four subfactors as low, medium, or high risk. These subfactors are:
Effectiveness of barriers to entry;Level and trend of profit margins;Risk of secular change and substitution by functions, services, and technologies; andRisk in growth trends.Trading business:45. We assess the competitive risk and growth of general trading and investment companies' trading businesses as "intermediate risk" (3)because of the following factors (see Appendix I for details):
Effectiveness of barriers to entry--'medium risk'Level and trend of profit margins--'medium risk'Risk of secular change and substitution by functions, services, and technologies--'medium risk'Risk in growth trends--'medium risk'Investment business:46. We assess the competitive risk and growth of general trading and investment companies' investment businesses as "moderately high"(4) because of the following factors (see Appendix II for details):
Effectiveness of barriers to entry--'medium risk'Level and trend of profit margins--'high risk'Risk of secular change and substitution by functions, services, and technologies--'medium risk'Risk in growth trends--'high risk'3. Industry risk assessment for the trading and investment business47. After assessing cyclicality as well as competitive risk and growth, respectively, for each of the sector's trading business and investmentbusiness, we determine the preliminary industry risk assessment for each of the two businesses by applying table 1 of "Methodology:Industry Risk," published Nov. 19, 2013. This results in an "intermediate risk" (3) assessment for the trading business and a "high risk" (5)assessment for the investment business.
48. Based on our view of the average profile of rated industry participants, for the purpose of determining industry risk, we use an equalweighting of the trading and investment businesses to determine the preliminary industry risk assessment. As a result, we set thepreliminary industry risk assessment at "moderately high risk" (4). If a general trading and investment company exhibits a different mix oftrading and investment operations, we capture this in our assessment of the company's competitive position.
4. Final industry risk assessment after factoring in diversification/portfolio effect49. Based on the characteristics of the companies within the scope of the criteria, the diversification of general trading and investmentcompanies' assets and profits far exceeds that of other industrial companies in terms of both horizontal industrial diversification and verticalbusiness models.
50. Under our Corporate Methodology criteria, we assess the diversification/portfolio effect when evaluating conglomerates, which wedefine as companies that have at least three distinct business segments that each contribute materially to earnings and cash flow.
51. As an industrywide characteristic, all general trading and investment companies operate across quite many industries, which mayinclude food, chemicals, energy, metals, machinery, infrastructure, plant and equipment, information technology (IT), real estate, andlogistics. In addition, we believe that the degree of correlation between the various lines of business in these diversified companies ismedium or low.
52. Accordingly, within the criteria, the benefits of this diversification mitigate the sector's overall industry risk and we include it in ourindustry risk assessment. In our opinion, this diversification/portfolio effect supports a one-category improvement from the preliminaryindustry risk score of "moderately high risk" (4), resulting in a final industry risk assessment of "intermediate risk" (3).
C. Country Risk Assessment
53. We determine country risk for general trading and investment companies by applying the same methodology as for other industrialcompanies (see Section C of "Corporate Methodology," published Nov. 19, 2013, and "Country Risk Assessment Methodology AndAssumptions," published Nov. 19, 2013). General trading and investment companies typically have very diverse business franchises globallyand adjust their exposure to various countries as business conditions and the companies' strategies change. We thus use an assessment forcountry risk that is weighted by asset or profit (see the first bullet of paragraph 27 in "Corporate Methodology," published Nov. 19, 2013).
D. Competitive Position Assessment54. We determine the competitive position of general trading and investment companies by separately assessing the competitive strength ofa company in pursuing and executing trading business and its competitive strength in pursuing and executing investment businesses, andthen combining those two assessments.
55. For both businesses, we partially base our assessment of the competitive position on the methodology described in section D.Competitive Position of "Corporate Methodology," published Nov. 19, 2013. However, unlike our analysis of other industrial companies,profitability is not a subfactor for the competitive position assessment but is analyzed in the financial risk profile owing to the reasonsmentioned in paragraph 17.
56. For a trading business, our assessment of competitive position is based on: (1) competitive advantage; and (2) scale, scope, anddiversity.
57. For an investment business, our assessment of competitive position is based on: (1) strategic investment capability; and (2) scale andscope. Strategic investment capability is critical in determining the competitive position of general trading and investment companiesbecause they continually make investments. Diversity is not a subfactor for the competitive position of the investment business but isanalyzed as a subfactor for the Risk Position assessment (see paragraphs 126 and 127).
58. When assessing scale, scope, and diversity for trading business, and scale and scope for investment business, we compare generaltrading and investment companies among themselves, but not with companies in other industries. Focusing on the relativity within theindustry avoids double counting diversity, because the industry risk analysis already incorporates diversity as an industry characteristic.
59. In the first step, we assess each component of competitive position independently, as 1, strong; 2, strong/adequate; 3, adequate; 4,adequate/weak; or 5, weak. Where a component isn't clearly either strong or adequate, we may assess it as strong/adequate. A componentthat is not clearly adequate or weak may be assessed as adequate/weak.
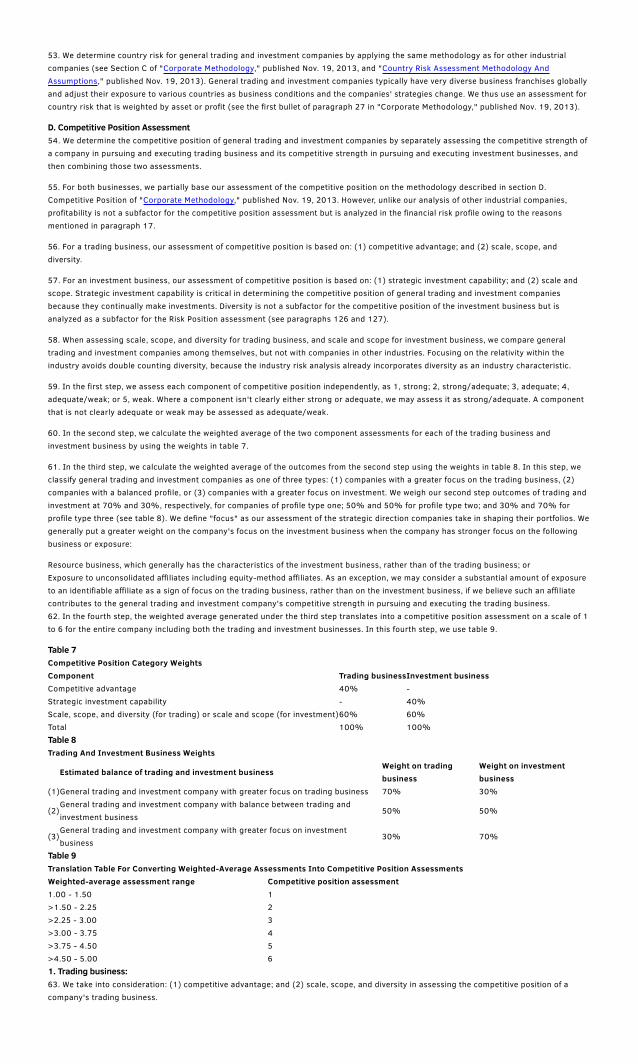
60. In the second step, we calculate the weighted average of the two component assessments for each of the trading business andinvestment business by using the weights in table 7.
61. In the third step, we calculate the weighted average of the outcomes from the second step using the weights in table 8. In this step, weclassify general trading and investment companies as one of three types: (1) companies with a greater focus on the trading business, (2)companies with a balanced profile, or (3) companies with a greater focus on investment. We weigh our second step outcomes of trading andinvestment at 70% and 30%, respectively, for companies of profile type one; 50% and 50% for profile type two; and 30% and 70% forprofile type three (see table 8). We define "focus" as our assessment of the strategic direction companies take in shaping their portfolios. Wegenerally put a greater weight on the company's focus on the investment business when the company has stronger focus on the followingbusiness or exposure:
Resource business, which generally has the characteristics of the investment business, rather than of the trading business; orExposure to unconsolidated affiliates including equity-method affiliates. As an exception, we may consider a substantial amount of exposureto an identifiable affiliate as a sign of focus on the trading business, rather than on the investment business, if we believe such an affiliatecontributes to the general trading and investment company's competitive strength in pursuing and executing the trading business.62. In the fourth step, the weighted average generated under the third step translates into a competitive position assessment on a scale of 1to 6 for the entire company including both the trading and investment businesses. In this fourth step, we use table 9.
Table 7Competitive Position Category WeightsComponent Trading businessInvestment businessCompetitive advantage 40% -Strategic investment capability - 40%Scale, scope, and diversity (for trading) or scale and scope (for investment)60% 60%Total 100% 100%Table 8Trading And Investment Business Weights
Estimated balance of trading and investment businessWeight on tradingbusiness
Weight on investmentbusiness
(1)General trading and investment company with greater focus on trading business 70% 30%
(2)General trading and investment company with balance between trading andinvestment business
50% 50%
(3)General trading and investment company with greater focus on investmentbusiness
30% 70%
Table 9Translation Table For Converting Weighted-Average Assessments Into Competitive Position AssessmentsWeighted-average assessment range Competitive position assessment1.00 - 1.50 1>1.50 - 2.25 2>2.25 - 3.00 3>3.00 - 3.75 4>3.75 - 4.50 5>4.50 - 5.00 61. Trading business:63. We take into consideration: (1) competitive advantage; and (2) scale, scope, and diversity in assessing the competitive position of acompany's trading business.
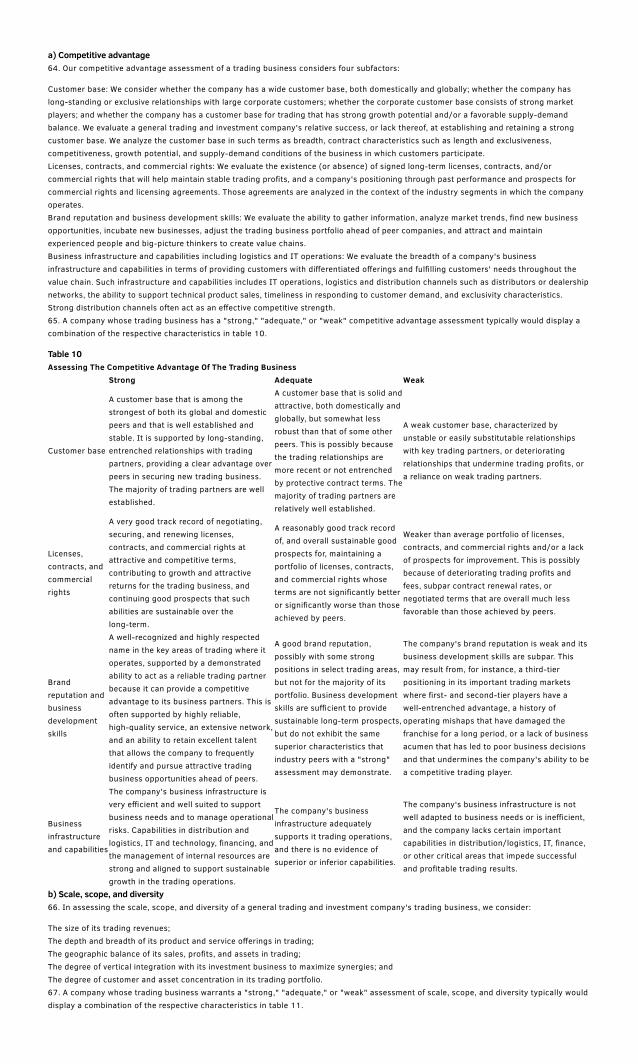
a) Competitive advantage64. Our competitive advantage assessment of a trading business considers four subfactors:
Customer base: We consider whether the company has a wide customer base, both domestically and globally; whether the company haslong-standing or exclusive relationships with large corporate customers; whether the corporate customer base consists of strong marketplayers; and whether the company has a customer base for trading that has strong growth potential and/or a favorable supply-demandbalance. We evaluate a general trading and investment company's relative success, or lack thereof, at establishing and retaining a strongcustomer base. We analyze the customer base in such terms as breadth, contract characteristics such as length and exclusiveness,competitiveness, growth potential, and supply-demand conditions of the business in which customers participate.Licenses, contracts, and commercial rights: We evaluate the existence (or absence) of signed long-term licenses, contracts, and/orcommercial rights that will help maintain stable trading profits, and a company's positioning through past performance and prospects forcommercial rights and licensing agreements. Those agreements are analyzed in the context of the industry segments in which the companyoperates.Brand reputation and business development skills: We evaluate the ability to gather information, analyze market trends, find new businessopportunities, incubate new businesses, adjust the trading business portfolio ahead of peer companies, and attract and maintainexperienced people and big-picture thinkers to create value chains.Business infrastructure and capabilities including logistics and IT operations: We evaluate the breadth of a company's businessinfrastructure and capabilities in terms of providing customers with differentiated offerings and fulfilling customers' needs throughout thevalue chain. Such infrastructure and capabilities includes IT operations, logistics and distribution channels such as distributors or dealershipnetworks, the ability to support technical product sales, timeliness in responding to customer demand, and exclusivity characteristics.Strong distribution channels often act as an effective competitive strength.65. A company whose trading business has a "strong," "adequate," or "weak" competitive advantage assessment typically would display acombination of the respective characteristics in table 10.
Table 10Assessing The Competitive Advantage Of The Trading Business
Strong Adequate Weak
Customer base
A customer base that is among thestrongest of both its global and domesticpeers and that is well established andstable. It is supported by long-standing,entrenched relationships with tradingpartners, providing a clear advantage overpeers in securing new trading business.The majority of trading partners are wellestablished.
A customer base that is solid andattractive, both domestically andglobally, but somewhat lessrobust than that of some otherpeers. This is possibly becausethe trading relationships aremore recent or not entrenchedby protective contract terms. Themajority of trading partners arerelatively well established.
A weak customer base, characterized byunstable or easily substitutable relationshipswith key trading partners, or deterioratingrelationships that undermine trading profits, ora reliance on weak trading partners.
Licenses,contracts, andcommercialrights
A very good track record of negotiating,securing, and renewing licenses,contracts, and commercial rights atattractive and competitive terms,contributing to growth and attractivereturns for the trading business, andcontinuing good prospects that suchabilities are sustainable over thelong-term.
A reasonably good track recordof, and overall sustainable goodprospects for, maintaining aportfolio of licenses, contracts,and commercial rights whoseterms are not significantly betteror significantly worse than thoseachieved by peers.
Weaker than average portfolio of licenses,contracts, and commercial rights and/or a lackof prospects for improvement. This is possiblybecause of deteriorating trading profits andfees, subpar contract renewal rates, ornegotiated terms that are overall much lessfavorable than those achieved by peers.
Brandreputation andbusinessdevelopmentskills
A well-recognized and highly respectedname in the key areas of trading where itoperates, supported by a demonstratedability to act as a reliable trading partnerbecause it can provide a competitiveadvantage to its business partners. This isoften supported by highly reliable,high-quality service, an extensive network,and an ability to retain excellent talentthat allows the company to frequentlyidentify and pursue attractive tradingbusiness opportunities ahead of peers.
A good brand reputation,possibly with some strongpositions in select trading areas,but not for the majority of itsportfolio. Business developmentskills are sufficient to providesustainable long-term prospects,but do not exhibit the samesuperior characteristics thatindustry peers with a "strong"assessment may demonstrate.
The company's brand reputation is weak and itsbusiness development skills are subpar. Thismay result from, for instance, a third-tierpositioning in its important trading marketswhere first- and second-tier players have awell-entrenched advantage, a history ofoperating mishaps that have damaged thefranchise for a long period, or a lack of businessacumen that has led to poor business decisionsand that undermines the company's ability to bea competitive trading player.
Businessinfrastructureand capabilities
The company's business infrastructure isvery efficient and well suited to supportbusiness needs and to manage operationalrisks. Capabilities in distribution andlogistics, IT and technology, financing, andthe management of internal resources arestrong and aligned to support sustainablegrowth in the trading operations.
The company's businessinfrastructure adequatelysupports it trading operations,and there is no evidence ofsuperior or inferior capabilities.
The company's business infrastructure is notwell adapted to business needs or is inefficient,and the company lacks certain importantcapabilities in distribution/logistics, IT, finance,or other critical areas that impede successfuland profitable trading results.
b) Scale, scope, and diversity66. In assessing the scale, scope, and diversity of a general trading and investment company's trading business, we consider:
The size of its trading revenues;The depth and breadth of its product and service offerings in trading;The geographic balance of its sales, profits, and assets in trading;The degree of vertical integration with its investment business to maximize synergies; andThe degree of customer and asset concentration in its trading portfolio.67. A company whose trading business warrants a "strong," "adequate," or "weak" assessment of scale, scope, and diversity typically woulddisplay a combination of the respective characteristics in table 11.

Table 11Assessing The Scale, Scope, And Diversity Of The Trading Business
Strong Adequate Weak
Size of tradingrevenues
Among the broadest revenue base in theindustry, not only overall but alsogenerally within key trading segments inwhich the company operates, as well asparticipation in broad, global markets.
Revenue base is of average sizecompared with other industry players,both overall and within key tradingsegments, such that overall size isn't aparticular advantage or disadvantage.
Limited revenue base or targetmarkets relative to those of otherparticipants in the industry.
Depth and breadth ofproduct and serviceofferings in trading
Significant product breadth and diversebusiness segments, revenue mix, andprofit sources.
Average for the industry, with relativelybroad offerings and sources of tradingprofits.
Trading operations are narrowlyfocused on a few segments, or thecompany lacks the breadth ofproduct and service offerings thatmost of its peers can provide.
Geographic balanceof sales, profits, andassets in trading
Geographically diversified revenue baseand participation in various tradingmarkets that have generally favorablelong-term growth prospects, or inmarkets that are not closely correlated.
Average for the industry, with a goodlevel of diversity.
Trading operations and the revenuebase are largely domestic or arehighly concentrated in certaincountries or in highly correlatedtrading markets.
Degree of verticalintegration withinvestment businessto maximize synergies
Participation in many stages of valuechains in various industries, enabling thecompany to achieve trading synergiesacross its upstream, midstream, anddownstream activities and with theinvestment business.
Average for the industry, typicallyspanning upstream to downstreamacross at least some industries.
Participation in only a few stages ofvalue chains in limited industries, orwith a lack of synergies across itsupstream, midstream, anddownstream activities and with theinvestment business.
Degree of customerand assetconcentration intrading portfolio
Among the most diversified of portfoliosof trading customers and trading assetsrelative to peers and in absolute terms(both domestically and globally, withoutsignificant single-name concentrations).
There are pockets of concentration incertain trading customers or in certaintrading assets, but overall trading-related concentrations are not somaterial that they potentially createsignificant risks.
There is significant concentration inthe trading customer base or incertain trading assets that is notmitigated.
2. Investment business:68. We take into consideration: (1) strategic investment capability, and 2) scale and scope in assessing a company's investment business.
a) Strategic investment capability69. The ability to make profitable investments as well as timely selling or buying of businesses is a key for this sector. As a result, weconsider a company's strategic investment capability as a key factor in assessing its competitive position.
70. To assess "strategic investment capability," we consider a company's:
Ability to make decisions on investment opportunities and divestitures; andAbility to manage the investment portfolio.71. For general trading and investment companies, a demonstrated strong track record and good prospects for good execution, as well as adiscerning ability to select partners, will often be a key advantage in securing new opportunities to participate in business and will enhancethe sustainability of a company's investment business model. Conversely, a subpar track record and poor prospects for business executionwill not only hurt profitability but also often hinder a company's ability to win new opportunities and may limit return on investment.
72. A company whose investment business warrants a "strong," "adequate," or "weak" assessment of strategic investment capabilitytypically has a combination of the characteristics described in table 12.
Table 12Strategic Investment Capability Assessment Guidelines
Strong Adequate Weak
Ability to makedecisions oninvestmentopportunities anddivestitures
Timely and speedy decision-making oninvestment opportunities, supportedby expertise and risk/return analysis.The company proactively manages itsportfolio in the face of changingbusiness conditions and is committedto an effective strategy of assetdivestiture.
Not particularly rapid or slow, butsupported by an adequate degree ofrisk/return analysis. Investment timing isneither particularly good nor bad overall,or investments made are at neitherparticularly high nor low prices. Thecompany actively manages its portfolio inthe face of changing business conditionsbut may be more reactive than proactive inits strategy of asset divestiture.
Slow decision-making, owing to a lackof expertise and risk/return analysis.Investment timing is generally poor orinvestments are made at high prices.The company does not have a proactiveapproach to asset disposals.Management may be hesitant to turnover specific assets, which may hinderan effective portfolio allocationstrategy.
Ability to managethe investmentportfolio
The company has a successful trackrecord of using and leveraging itsvarious resources to effectivelysupport its investment portfolio, and ofachieving synergies across itsinvestment portfolio. Its capabilitiesare a positive differentiator amongpeers in the industry. This is supportedby highly capable human resources.
Not particularly successful or unsuccessfulor with a mixed track record. Sometimes,investment businesses incur losses,although not in large amounts, and thetrack record doesn't point to a particularstrength or weakness in achievingsynergies between investments.
The company is not successful atleveraging its various resources toeffectively support its investmentportfolio. This may partly result from alack of capable human resources. Thereis evidence of a limited or weak trackrecord of investments with businesssynergies and poor prospects forexecution.
b) Scale and scope73. We believe that scale and scope are prerequisites for general trading and investment companies to maintain or expand their investmentbusiness franchise and portfolios.
74. Our assessment of the scale and scope of a company's investment business includes:
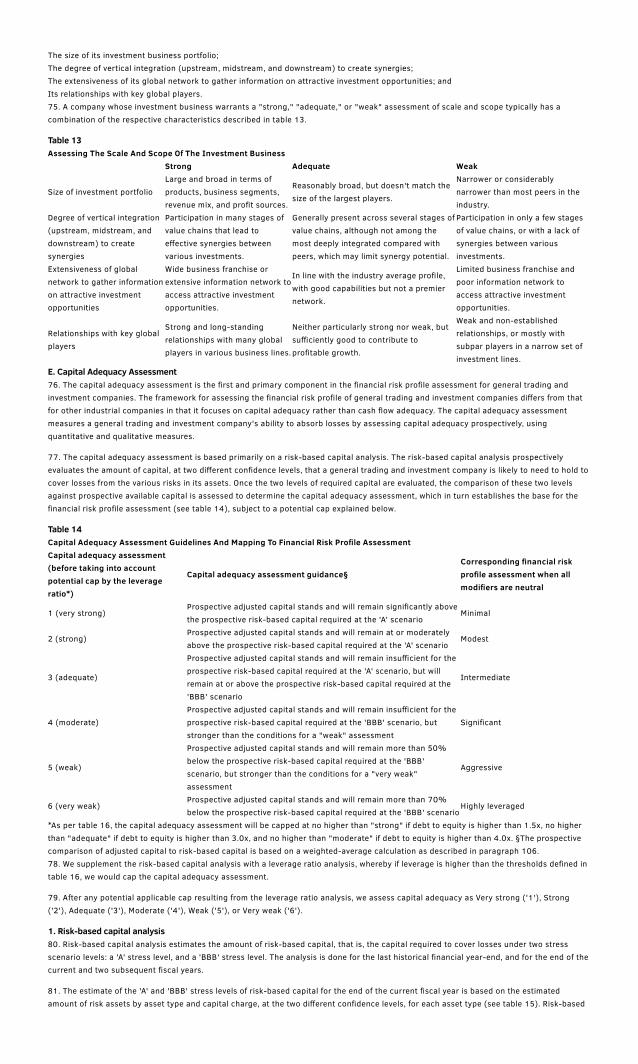
The size of its investment business portfolio;The degree of vertical integration (upstream, midstream, and downstream) to create synergies;The extensiveness of its global network to gather information on attractive investment opportunities; andIts relationships with key global players.75. A company whose investment business warrants a "strong," "adequate," or "weak" assessment of scale and scope typically has acombination of the respective characteristics described in table 13.
Table 13Assessing The Scale And Scope Of The Investment Business
Strong Adequate Weak
Size of investment portfolioLarge and broad in terms ofproducts, business segments,revenue mix, and profit sources.
Reasonably broad, but doesn't match thesize of the largest players.
Narrower or considerablynarrower than most peers in theindustry.
Degree of vertical integration(upstream, midstream, anddownstream) to createsynergies
Participation in many stages ofvalue chains that lead toeffective synergies betweenvarious investments.
Generally present across several stages ofvalue chains, although not among themost deeply integrated compared withpeers, which may limit synergy potential.
Participation in only a few stagesof value chains, or with a lack ofsynergies between variousinvestments.
Extensiveness of globalnetwork to gather informationon attractive investmentopportunities
Wide business franchise orextensive information network toaccess attractive investmentopportunities.
In line with the industry average profile,with good capabilities but not a premiernetwork.
Limited business franchise andpoor information network toaccess attractive investmentopportunities.
Relationships with key globalplayers
Strong and long-standingrelationships with many globalplayers in various business lines.
Neither particularly strong nor weak, butsufficiently good to contribute toprofitable growth.
Weak and non-establishedrelationships, or mostly withsubpar players in a narrow set ofinvestment lines.
E. Capital Adequacy Assessment76. The capital adequacy assessment is the first and primary component in the financial risk profile assessment for general trading andinvestment companies. The framework for assessing the financial risk profile of general trading and investment companies differs from thatfor other industrial companies in that it focuses on capital adequacy rather than cash flow adequacy. The capital adequacy assessmentmeasures a general trading and investment company's ability to absorb losses by assessing capital adequacy prospectively, usingquantitative and qualitative measures.
77. The capital adequacy assessment is based primarily on a risk-based capital analysis. The risk-based capital analysis prospectivelyevaluates the amount of capital, at two different confidence levels, that a general trading and investment company is likely to need to hold tocover losses from the various risks in its assets. Once the two levels of required capital are evaluated, the comparison of these two levelsagainst prospective available capital is assessed to determine the capital adequacy assessment, which in turn establishes the base for thefinancial risk profile assessment (see table 14), subject to a potential cap explained below.
Table 14Capital Adequacy Assessment Guidelines And Mapping To Financial Risk Profile AssessmentCapital adequacy assessment(before taking into accountpotential cap by the leverageratio*)
Capital adequacy assessment guidance§Corresponding financial riskprofile assessment when allmodifiers are neutral
1 (very strong)Prospective adjusted capital stands and will remain significantly abovethe prospective risk-based capital required at the 'A' scenario
Minimal
2 (strong)Prospective adjusted capital stands and will remain at or moderatelyabove the prospective risk-based capital required at the 'A' scenario
Modest
3 (adequate)
Prospective adjusted capital stands and will remain insufficient for theprospective risk-based capital required at the 'A' scenario, but willremain at or above the prospective risk-based capital required at the'BBB' scenario
Intermediate
4 (moderate)Prospective adjusted capital stands and will remain insufficient for theprospective risk-based capital required at the 'BBB' scenario, butstronger than the conditions for a "weak" assessment
Significant
5 (weak)
Prospective adjusted capital stands and will remain more than 50%below the prospective risk-based capital required at the 'BBB'scenario, but stronger than the conditions for a "very weak"assessment
Aggressive
6 (very weak)Prospective adjusted capital stands and will remain more than 70%below the prospective risk-based capital required at the 'BBB' scenario
Highly leveraged
*As per table 16, the capital adequacy assessment will be capped at no higher than "strong" if debt to equity is higher than 1.5x, no higherthan "adequate" if debt to equity is higher than 3.0x, and no higher than "moderate" if debt to equity is higher than 4.0x. §The prospectivecomparison of adjusted capital to risk-based capital is based on a weighted-average calculation as described in paragraph 106.78. We supplement the risk-based capital analysis with a leverage ratio analysis, whereby if leverage is higher than the thresholds defined intable 16, we would cap the capital adequacy assessment.
79. After any potential applicable cap resulting from the leverage ratio analysis, we assess capital adequacy as Very strong ('1'), Strong('2'), Adequate ('3'), Moderate ('4'), Weak ('5'), or Very weak ('6').
1. Risk-based capital analysis80. Risk-based capital analysis estimates the amount of risk-based capital, that is, the capital required to cover losses under two stressscenario levels: a 'A' stress level, and a 'BBB' stress level. The analysis is done for the last historical financial year-end, and for the end of thecurrent and two subsequent fiscal years.
81. The estimate of the 'A' and 'BBB' stress levels of risk-based capital for the end of the current fiscal year is based on the estimatedamount of risk assets by asset type and capital charge, at the two different confidence levels, for each asset type (see table 15). Risk-based

capital for the end of the current fiscal year is the summation of asset values after applying the capital charge to each asset item.
82. The stress scenario for one asset may not always occur simultaneously with the stress scenario for another asset if the two assets arenot fully correlated. However, as we cannot quantify the correlation in a reliable manner, we do not assume any benefit from lack ofcorrelation or partial correlation of these risks. We assume a full correlation among various assets, but assess risk diversificationsqualitatively at a later stage, together with any risk concentrations (see section G. Risk Position And Asset Risk Management CapabilitiesAssessment, 1. Risk position, subsection b) Risk concentration and diversification).
83. Once we estimate the risk-based capital for the end of the current fiscal year, we then estimate the risk-based capital for the end of twosubsequent fiscal years by using the estimated growth or decrease of risk-based capital after the end of the current fiscal year (seeparagraph 104 concerning our forecasts of adjusted capital).
2. Capital charges by asset84. Under the methodology, we calculate risk-based capital at the end of the past and current fiscal years by multiplying a company's assetvalues by the applicable standard capital charge by asset type shown in table 15. The capital charges in table 15 reflect the unexpectedloss--the possible loss that may arise in times of stress--of each asset item in light of that item's risk profile. For example, a capital charge of10% at a 'BBB' stress indicates that losses in times of a 'BBB' stress may be equivalent to 10% of the asset value on the balance sheet,thereby requiring the same amount of capital to be set aside to absorb such unexpected losses for a 'BBB' stress. Long-term assets tend tohave higher capital charges.
85. To calibrate the capital charges, we draw principally from our bank criteria, "Bank Capital Methodology And Assumptions," publishedDec. 6, 2010, from our insurance criteria, "Refined Methodology And Assumptions For Analyzing Insurer Capital Adequacy Using TheRisk-Based Insurance Capital Model," published June 7, 2010; from the stress scenarios presented in "Understanding Standard & Poor'sRating Definitions," published June 3, 2009; and from our analysis of past defaults by general trading and investment companies.
86. Depending on the nature of the asset, we seek to capture credit risk, market risk, or operational risk.
87. For credit risk exposure, we have calibrated capital charges principally to those set forth in our bank criteria based on corporateexposure. Capital charges vary by our assessment of economic risk (ranked on a scale of 1 to 10, as defined in "Banking Industry CountryRisk Assessment Methodology And Assumptions," published Nov. 9, 2011), whereby higher charges are applied to assets located incountries of higher economic risk. However, for general trading and investment companies, we do not intend to apply charges to individualassets country-by-country; rather we determine the weighted average economic risk for a general trading and investment company basedon its country exposure by asset, and then to apply the corresponding capital charge to the entire amount of a given asset type to reflectthat asset type's exposure to credit risk.
88. We also apply the weighted-average approach to stock exposures. While our bank criteria differentiate stock exposure capital charges bycountry of exposure by using the "equity market group" on each country on a scale of 1 to 4 (as defined in table 13 of "Bank CapitalMethodology And Assumptions," published Dec. 6, 2010), for general trading and investment companies, we determine the weighted-average equity market group assessment, and then apply the corresponding capital charge to the overall stock exposure.
89. Table 15 shows the capital charges that we apply when the weighted-average economic risk assessment is '4' and the weighted-averageequity market group assessment is '2'. The capital charges we apply for other weighted-average economic risk assessments, or otherweighted-average equity market group assessments, differ for some asset types and are shown in Appendixes III and IV.
Table 15Capital Charges By Asset (Applied For Japanese General Trading And Investment Companies)
Assetitem
Capital charge(%) for 'BBB'stress
Capital charge(%) for 'A' stress
Current assetsa* Notes and accounts receivables 5 7b* Loan receivables and bonds 5 7c-1 Inventories from resources 8/20 10/25c-2* Inventories from nonresources (excluding real estate and vessels) 8 10Noncurrent assetsd-1§ Securities and investments (listed stock) 45 55d-2§ Securities and investments (unlisted stock) 55 65d-3* Long-term credit exposure (listed bonds) 3 4d-4* Long-term credit exposure (unlisted bonds, loans, and guarantees) 8 10e Investments in equity-affiliated companies (both listed and unlisted) 60 70f Doubtful receivables 100 100g Mineral rights 60 75h-1 Real estate in inventory 18 25h-2 Vessels (aircraft and ships) 20 30i-1 Other assets in the company's own use 80 100
i-2Other assets not integral to the company's business operations (could be sold or rented; forexample, buildings and buildings under construction, machinery, and equipment; excludinggoodwill and other intangible assets)
18 25
j Goodwill and other intangible assets 80 100*This capital charge is under 'economic risk assessment 4'. §This capital charge is under the assessment of 'equity market group 2'.Current assets:a: Notes and accounts receivables:90. The capital charges are 5% for a 'BBB' stress and 7% for a 'A' stress. This reflects the short-term nature of the exposure. Thisassessment is based on our economic risk assessment of '4' through a weighted-average approach. Accordingly, this capital charge wouldbe changed if our economic risk assessment changes from '4'.
b: Loan receivables and bonds:91. The capital charges are 5% for a 'BBB' stress and 7% for a 'A' stress. This assessment is based on our economic risk assessment of '4'through a weighted-average approach. Accordingly, this capital charge would be changed if our economic risk assessment changes from '4'.
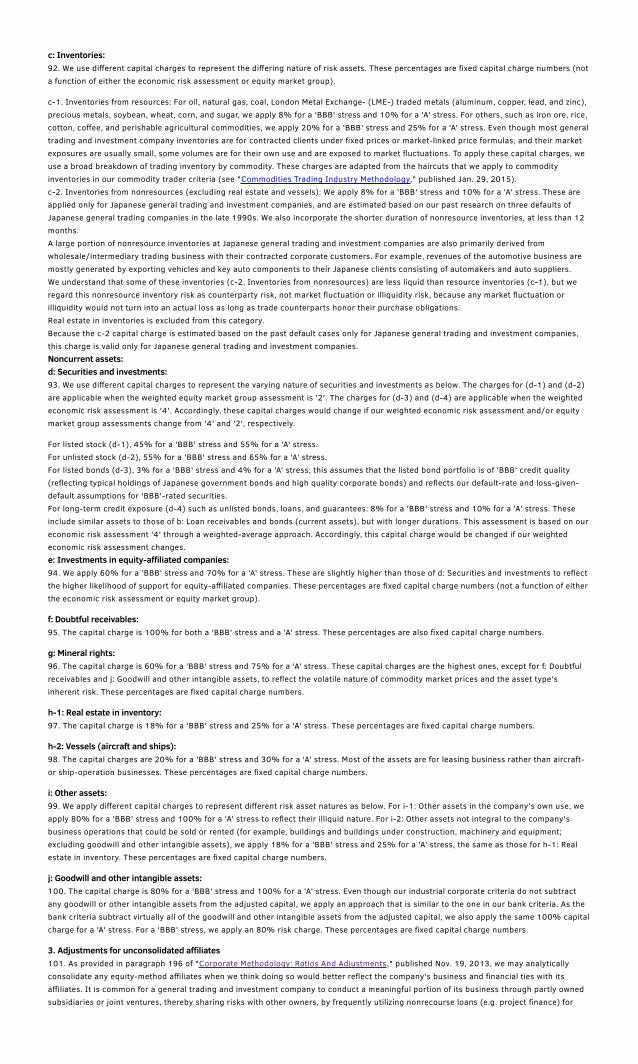
c: Inventories:92. We use different capital charges to represent the differing nature of risk assets. These percentages are fixed capital charge numbers (nota function of either the economic risk assessment or equity market group).
c-1. Inventories from resources: For oil, natural gas, coal, London Metal Exchange- (LME-) traded metals (aluminum, copper, lead, and zinc),precious metals, soybean, wheat, corn, and sugar, we apply 8% for a 'BBB' stress and 10% for a 'A' stress. For others, such as iron ore, rice,cotton, coffee, and perishable agricultural commodities, we apply 20% for a 'BBB' stress and 25% for a 'A' stress. Even though most generaltrading and investment company inventories are for contracted clients under fixed prices or market-linked price formulas, and their marketexposures are usually small, some volumes are for their own use and are exposed to market fluctuations. To apply these capital charges, weuse a broad breakdown of trading inventory by commodity. These charges are adapted from the haircuts that we apply to commodityinventories in our commodity trader criteria (see "Commodities Trading Industry Methodology," published Jan. 29, 2015).c-2. Inventories from nonresources (excluding real estate and vessels): We apply 8% for a 'BBB' stress and 10% for a 'A' stress. These areapplied only for Japanese general trading and investment companies, and are estimated based on our past research on three defaults ofJapanese general trading companies in the late 1990s. We also incorporate the shorter duration of nonresource inventories, at less than 12months.A large portion of nonresource inventories at Japanese general trading and investment companies are also primarily derived fromwholesale/intermediary trading business with their contracted corporate customers. For example, revenues of the automotive business aremostly generated by exporting vehicles and key auto components to their Japanese clients consisting of automakers and auto suppliers.We understand that some of these inventories (c-2. Inventories from nonresources) are less liquid than resource inventories (c-1), but weregard this nonresource inventory risk as counterparty risk, not market fluctuation or illiquidity risk, because any market fluctuation orilliquidity would not turn into an actual loss as long as trade counterparts honor their purchase obligations.Real estate in inventories is excluded from this category.Because the c-2 capital charge is estimated based on the past default cases only for Japanese general trading and investment companies,this charge is valid only for Japanese general trading and investment companies.Noncurrent assets:d: Securities and investments:93. We use different capital charges to represent the varying nature of securities and investments as below. The charges for (d-1) and (d-2)are applicable when the weighted equity market group assessment is '2'. The charges for (d-3) and (d-4) are applicable when the weightedeconomic risk assessment is '4'. Accordingly, these capital charges would change if our weighted economic risk assessment and/or equitymarket group assessments change from '4' and '2', respectively.
For listed stock (d-1), 45% for a 'BBB' stress and 55% for a 'A' stress.For unlisted stock (d-2), 55% for a 'BBB' stress and 65% for a 'A' stress.For listed bonds (d-3), 3% for a 'BBB' stress and 4% for a 'A' stress; this assumes that the listed bond portfolio is of 'BBB' credit quality(reflecting typical holdings of Japanese government bonds and high quality corporate bonds) and reflects our default-rate and loss-given-default assumptions for 'BBB'-rated securities.For long-term credit exposure (d-4) such as unlisted bonds, loans, and guarantees: 8% for a 'BBB' stress and 10% for a 'A' stress. Theseinclude similar assets to those of b: Loan receivables and bonds (current assets), but with longer durations. This assessment is based on oureconomic risk assessment '4' through a weighted-average approach. Accordingly, this capital charge would be changed if our weightedeconomic risk assessment changes.e: Investments in equity-affiliated companies:94. We apply 60% for a 'BBB' stress and 70% for a 'A' stress. These are slightly higher than those of d: Securities and investments to reflectthe higher likelihood of support for equity-affiliated companies. These percentages are fixed capital charge numbers (not a function of eitherthe economic risk assessment or equity market group).
f: Doubtful receivables:95. The capital charge is 100% for both a 'BBB' stress and a 'A' stress. These percentages are also fixed capital charge numbers.
g: Mineral rights:96. The capital charge is 60% for a 'BBB' stress and 75% for a 'A' stress. These capital charges are the highest ones, except for f: Doubtfulreceivables and j: Goodwill and other intangible assets, to reflect the volatile nature of commodity market prices and the asset type'sinherent risk. These percentages are fixed capital charge numbers.
h-1: Real estate in inventory:97. The capital charge is 18% for a 'BBB' stress and 25% for a 'A' stress. These percentages are fixed capital charge numbers.
h-2: Vessels (aircraft and ships):98. The capital charges are 20% for a 'BBB' stress and 30% for a 'A' stress. Most of the assets are for leasing business rather than aircraft-or ship-operation businesses. These percentages are fixed capital charge numbers.
i: Other assets:99. We apply different capital charges to represent different risk asset natures as below. For i-1: Other assets in the company's own use, weapply 80% for a 'BBB' stress and 100% for a 'A' stress to reflect their illiquid nature. For i-2: Other assets not integral to the company'sbusiness operations that could be sold or rented (for example, buildings and buildings under construction, machinery and equipment;excluding goodwill and other intangible assets), we apply 18% for a 'BBB' stress and 25% for a 'A' stress, the same as those for h-1: Realestate in inventory. These percentages are fixed capital charge numbers.
j: Goodwill and other intangible assets:100. The capital charge is 80% for a 'BBB' stress and 100% for a 'A' stress. Even though our industrial corporate criteria do not subtractany goodwill or other intangible assets from the adjusted capital, we apply an approach that is similar to the one in our bank criteria. As thebank criteria subtract virtually all of the goodwill and other intangible assets from the adjusted capital, we also apply the same 100% capitalcharge for a 'A' stress. For a 'BBB' stress, we apply an 80% risk charge. These percentages are fixed capital charge numbers.
3. Adjustments for unconsolidated affiliates101. As provided in paragraph 196 of "Corporate Methodology: Ratios And Adjustments," published Nov. 19, 2013, we may analyticallyconsolidate any equity-method affiliates when we think doing so would better reflect the company's business and financial ties with itsaffiliates. It is common for a general trading and investment company to conduct a meaningful portion of its business through partly ownedsubsidiaries or joint ventures, thereby sharing risks with other owners, by frequently utilizing nonrecourse loans (e.g. project finance) for

specific projects.
4. Calculation for adjusted capital102. Once the risk-based capital is estimated at two different confidence levels and at four time points, we then compare them with theamount of capital expected to be available. The calculation of this capital uses the analytical adjustments listed in "Corporate Methodology:Ratios And Adjustments," published Nov. 19, 2013. In addition, we make the following adjustments to equity to reflect factors specific to thissector:
(-) Tax loss carryforwards net of valuation allowance; and(+) Loan-loss reserves other than the portion allocated to doubtful receivables. Loan-loss reserves allocated to doubtful receivables arenetted against doubtful receivables when calculating the risk-based capital for doubtful receivables.103. For the purpose of determining the amount of hybrid capital that we recognize as high or intermediate equity content, we follow thecorporate approach, rather than the approach we use for financial institutions, because general trading and investment companies are notregulated entities and because the trading business is corporate-like in nature.
104. We forecast the amount of adjusted capital, consisting of our projections for net income, dividends, and other items that may affectcapital accumulation or depletion, for the current year and the next two fiscal years. We incorporate our key assumptions, includingcommodity price assumptions and profit forecasts from key investments, in detail in forecasting the amount of capital.
5. Capital adequacy assessment105. The capital adequacy assessment follows the below steps:
For the past and current fiscal year-end, we calculate the general trading and investment company's risk-based capital at two differentstress levels through the capital adequacy's quantitative analysis.For the end of the two subsequent years, the risk-based capital is projected based on the requirement at the end of the previous fiscal yearand growth or contraction in risk-based capital over the year based on expected business growth or contraction and changes in risk profile.106. The capital adequacy assessment is set by comparing the redundancy or deficiency of adjusted capital relative to the risk-based capitalat two different stress levels at the end of the past fiscal year-end and for the projection periods. To arrive at the capital adequacyassessment (before taking into account the potential cap due to the leverage ratio), we consider either or both of the results of the twodifferent stress scenarios (e.g. 'A' and/or 'BBB' stress scenarios) as explained in the capital adequacy assessment guidance in table 14. Foreach of four time points, adjusted capital is divided by the risk-based capital under 'A' stress and 'BBB' stress scenarios. Then, we calculatetwo stress levels of capital adequacy using the below periods and weights.
The capital adequacy calculation is generally a four-year weighted average of the results. In averaging 'A' stress ratios and 'BBB' stressratios for four consecutive periods, we generally apply 20% for the past fiscal year, 25% for the current fiscal year, 30% for the next fiscalyear, and 25% for the year after the next fiscal year.We may change the weightings, however, to place greater emphasis on the current and forecast years if a company is undergoing atransformational event or if we do not view the last historical year as representative. The weights applied will then generally be 30%, 40%,and 30% for the current and two subsequent years, respectively.6. Leverage ratio107. To complement our risk-based capital analysis, we also analyze capital adequacy by calculating a leverage ratio (debt to equity) toassess the extent of balance sheet leverage and trends. We use the leverage ratio as a cap for the capital adequacy assessment (see table16).
108. The leverage ratio analysis does not differentiate various types of assets by their risk nature, but represents a general trading andinvestment company's risk buffer (equity) against its financed debt. We calculate the leverage ratio over three years of forecasts, withweights of 30%, 40%, and 30% for the current fiscal year, the next year, and the year after, respectively.
109. We use the following thresholds and caps.
Table 16Leverage Ratio Thresholds And Applicable Capital Adequacy Assessment CapsIf debt to equity exceeds… The capital adequacy assessment is capped at…1.5x Strong (2)3.0x Adequate (3)4.0x Moderate (4)F. Profitability Assessment110. Under the criteria, we assess profitability, the first line of defense against losses and the primary way that a general trading andinvestment company builds or maintains capital adequacy. We consider profitability analysis to help develop a fuller understanding of acompany's financial risk profile. We assess a general trading and investment company's profitability as "strong," "adequate," or "weak"based on its profitability compared with the long-term average in the sector. We also consider trends in track record and our forward-lookingviews on the profitability measure. We can modify the capital adequacy assessment by one category, either weaker or stronger.
111. We use return (pretax net income) on risk-weighted assets (RORA). We use pretax net income as the numerator. As a denominator, weuse risk-based assets reflecting required capital levels under our 'BBB'-stress scenario. The RORA calculation is generally a four-yearweighted average whereby we apply a 20% weight for the past fiscal year, 25% for the current fiscal year, 30% for the next fiscal year, and25% for the year after the next fiscal year. We may change the weightings, however, to place greater emphasis on the current and forecastyears if a company is undergoing a transformational event or if we do not view the last historical year as representative. The weights appliedwill then generally be 30%, 40%, and 30% for the current and two subsequent years, respectively. We think pretax net income is a usefulparameter for analyzing general trading and investment companies' earnings because, unlike operating income, which is a key profitabilityparameter for most other industrial companies, pretax net income captures the following items, which are important profitabilitycontributors at general trading and investment companies:
Equity in the earnings of affiliated companies; andVarious gains and losses from investment business, such as those from investment sales, revaluations, and liquidations.112. As shown in table 17, we assess profitability as generally measured by a general trading and investment company's RORA on athree-point scale: "strong," "adequate," and "weak." We consider RORA above 20% to be "strong," between 10% and 20% "adequate," andbelow 10% "weak."
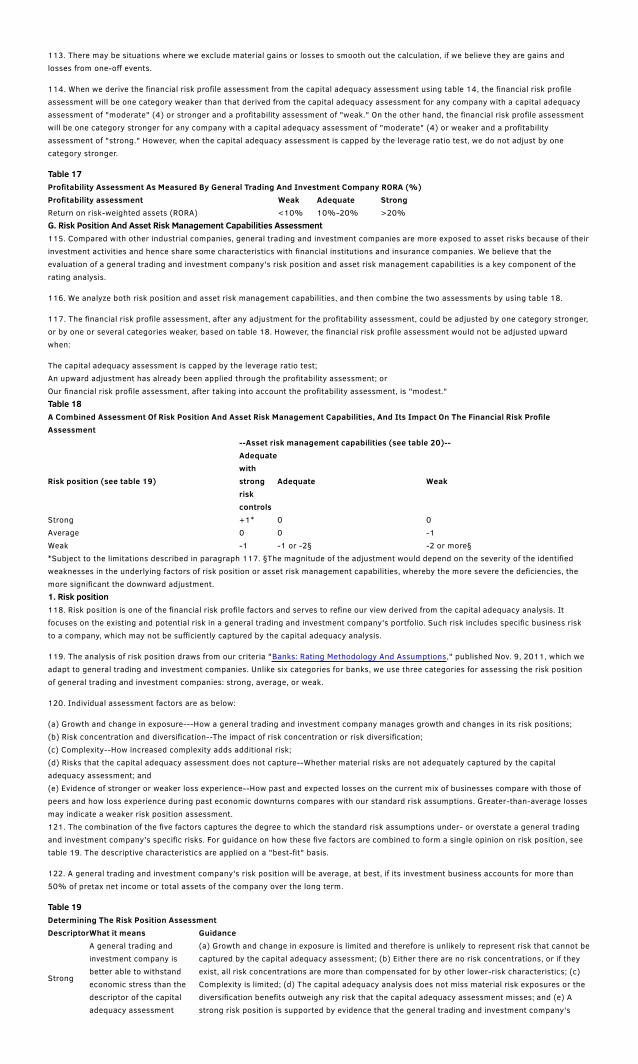
113. There may be situations where we exclude material gains or losses to smooth out the calculation, if we believe they are gains andlosses from one-off events.
114. When we derive the financial risk profile assessment from the capital adequacy assessment using table 14, the financial risk profileassessment will be one category weaker than that derived from the capital adequacy assessment for any company with a capital adequacyassessment of "moderate" (4) or stronger and a profitability assessment of "weak." On the other hand, the financial risk profile assessmentwill be one category stronger for any company with a capital adequacy assessment of "moderate" (4) or weaker and a profitabilityassessment of "strong." However, when the capital adequacy assessment is capped by the leverage ratio test, we do not adjust by onecategory stronger.
Table 17Profitability Assessment As Measured By General Trading And Investment Company RORA (%)Profitability assessment Weak Adequate StrongReturn on risk-weighted assets (RORA) <10% 10%-20% >20%G. Risk Position And Asset Risk Management Capabilities Assessment115. Compared with other industrial companies, general trading and investment companies are more exposed to asset risks because of theirinvestment activities and hence share some characteristics with financial institutions and insurance companies. We believe that theevaluation of a general trading and investment company's risk position and asset risk management capabilities is a key component of therating analysis.
116. We analyze both risk position and asset risk management capabilities, and then combine the two assessments by using table 18.
117. The financial risk profile assessment, after any adjustment for the profitability assessment, could be adjusted by one category stronger,or by one or several categories weaker, based on table 18. However, the financial risk profile assessment would not be adjusted upwardwhen:
The capital adequacy assessment is capped by the leverage ratio test;An upward adjustment has already been applied through the profitability assessment; orOur financial risk profile assessment, after taking into account the profitability assessment, is "modest."Table 18A Combined Assessment Of Risk Position And Asset Risk Management Capabilities, And Its Impact On The Financial Risk ProfileAssessment
--Asset risk management capabilities (see table 20)--
Risk position (see table 19)
Adequatewithstrongriskcontrols
Adequate Weak
Strong +1* 0 0Average 0 0 -1Weak -1 -1 or -2§ -2 or more§*Subject to the limitations described in paragraph 117. §The magnitude of the adjustment would depend on the severity of the identifiedweaknesses in the underlying factors of risk position or asset risk management capabilities, whereby the more severe the deficiencies, themore significant the downward adjustment.1. Risk position118. Risk position is one of the financial risk profile factors and serves to refine our view derived from the capital adequacy analysis. Itfocuses on the existing and potential risk in a general trading and investment company's portfolio. Such risk includes specific business riskto a company, which may not be sufficiently captured by the capital adequacy analysis.
119. The analysis of risk position draws from our criteria "Banks: Rating Methodology And Assumptions," published Nov. 9, 2011, which weadapt to general trading and investment companies. Unlike six categories for banks, we use three categories for assessing the risk positionof general trading and investment companies: strong, average, or weak.
120. Individual assessment factors are as below:
(a) Growth and change in exposure---How a general trading and investment company manages growth and changes in its risk positions;(b) Risk concentration and diversification--The impact of risk concentration or risk diversification;(c) Complexity--How increased complexity adds additional risk;(d) Risks that the capital adequacy assessment does not capture--Whether material risks are not adequately captured by the capitaladequacy assessment; and(e) Evidence of stronger or weaker loss experience--How past and expected losses on the current mix of businesses compare with those ofpeers and how loss experience during past economic downturns compares with our standard risk assumptions. Greater-than-average lossesmay indicate a weaker risk position assessment.121. The combination of the five factors captures the degree to which the standard risk assumptions under- or overstate a general tradingand investment company's specific risks. For guidance on how these five factors are combined to form a single opinion on risk position, seetable 19. The descriptive characteristics are applied on a "best-fit" basis.
122. A general trading and investment company's risk position will be average, at best, if its investment business accounts for more than50% of pretax net income or total assets of the company over the long term.
Table 19Determining The Risk Position AssessmentDescriptorWhat it means Guidance
Strong
A general trading andinvestment company isbetter able to withstandeconomic stress than thedescriptor of the capitaladequacy assessment
(a) Growth and change in exposure is limited and therefore is unlikely to represent risk that cannot becaptured by the capital adequacy assessment; (b) Either there are no risk concentrations, or if theyexist, all risk concentrations are more than compensated for by other lower-risk characteristics; (c)Complexity is limited; (d) The capital adequacy analysis does not miss material risk exposures or thediversification benefits outweigh any risk that the capital adequacy assessment misses; and (e) Astrong risk position is supported by evidence that the general trading and investment company's
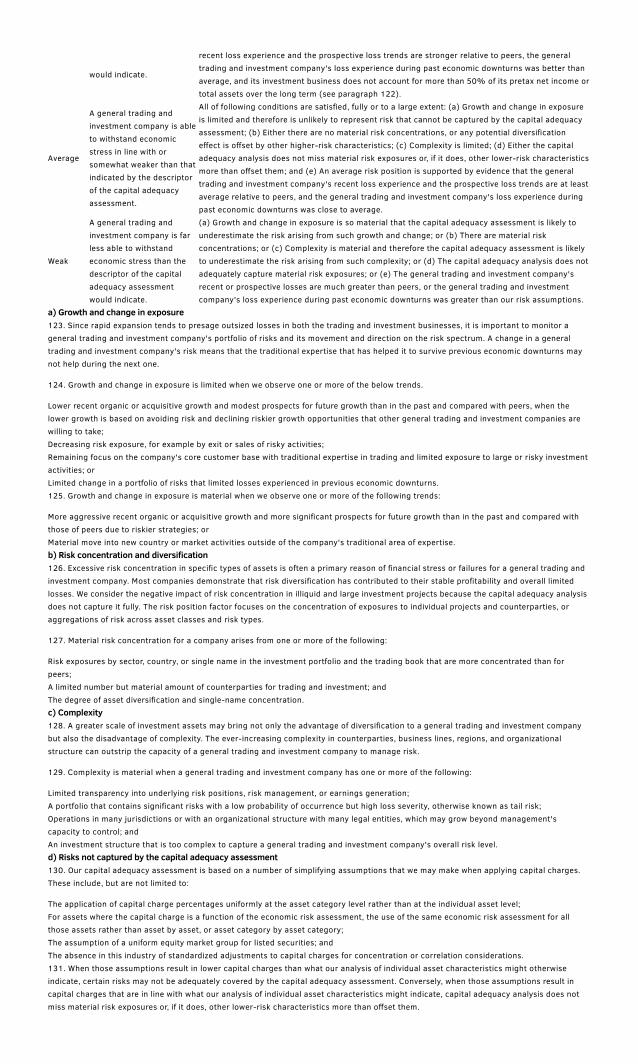
would indicate.
recent loss experience and the prospective loss trends are stronger relative to peers, the generaltrading and investment company's loss experience during past economic downturns was better thanaverage, and its investment business does not account for more than 50% of its pretax net income ortotal assets over the long term (see paragraph 122).
Average
A general trading andinvestment company is ableto withstand economicstress in line with orsomewhat weaker than thatindicated by the descriptorof the capital adequacyassessment.
All of following conditions are satisfied, fully or to a large extent: (a) Growth and change in exposureis limited and therefore is unlikely to represent risk that cannot be captured by the capital adequacyassessment; (b) Either there are no material risk concentrations, or any potential diversificationeffect is offset by other higher-risk characteristics; (c) Complexity is limited; (d) Either the capitaladequacy analysis does not miss material risk exposures or, if it does, other lower-risk characteristicsmore than offset them; and (e) An average risk position is supported by evidence that the generaltrading and investment company's recent loss experience and the prospective loss trends are at leastaverage relative to peers, and the general trading and investment company's loss experience duringpast economic downturns was close to average.
Weak
A general trading andinvestment company is farless able to withstandeconomic stress than thedescriptor of the capitaladequacy assessmentwould indicate.
(a) Growth and change in exposure is so material that the capital adequacy assessment is likely tounderestimate the risk arising from such growth and change; or (b) There are material riskconcentrations; or (c) Complexity is material and therefore the capital adequacy assessment is likelyto underestimate the risk arising from such complexity; or (d) The capital adequacy analysis does notadequately capture material risk exposures; or (e) The general trading and investment company'srecent or prospective losses are much greater than peers, or the general trading and investmentcompany's loss experience during past economic downturns was greater than our risk assumptions.
a) Growth and change in exposure123. Since rapid expansion tends to presage outsized losses in both the trading and investment businesses, it is important to monitor ageneral trading and investment company's portfolio of risks and its movement and direction on the risk spectrum. A change in a generaltrading and investment company's risk means that the traditional expertise that has helped it to survive previous economic downturns maynot help during the next one.
124. Growth and change in exposure is limited when we observe one or more of the below trends.
Lower recent organic or acquisitive growth and modest prospects for future growth than in the past and compared with peers, when thelower growth is based on avoiding risk and declining riskier growth opportunities that other general trading and investment companies arewilling to take;Decreasing risk exposure, for example by exit or sales of risky activities;Remaining focus on the company's core customer base with traditional expertise in trading and limited exposure to large or risky investmentactivities; orLimited change in a portfolio of risks that limited losses experienced in previous economic downturns.125. Growth and change in exposure is material when we observe one or more of the following trends:
More aggressive recent organic or acquisitive growth and more significant prospects for future growth than in the past and compared withthose of peers due to riskier strategies; orMaterial move into new country or market activities outside of the company's traditional area of expertise.b) Risk concentration and diversification126. Excessive risk concentration in specific types of assets is often a primary reason of financial stress or failures for a general trading andinvestment company. Most companies demonstrate that risk diversification has contributed to their stable profitability and overall limitedlosses. We consider the negative impact of risk concentration in illiquid and large investment projects because the capital adequacy analysisdoes not capture it fully. The risk position factor focuses on the concentration of exposures to individual projects and counterparties, oraggregations of risk across asset classes and risk types.
127. Material risk concentration for a company arises from one or more of the following:
Risk exposures by sector, country, or single name in the investment portfolio and the trading book that are more concentrated than forpeers;A limited number but material amount of counterparties for trading and investment; andThe degree of asset diversification and single-name concentration.c) Complexity128. A greater scale of investment assets may bring not only the advantage of diversification to a general trading and investment companybut also the disadvantage of complexity. The ever-increasing complexity in counterparties, business lines, regions, and organizationalstructure can outstrip the capacity of a general trading and investment company to manage risk.
129. Complexity is material when a general trading and investment company has one or more of the following:
Limited transparency into underlying risk positions, risk management, or earnings generation;A portfolio that contains significant risks with a low probability of occurrence but high loss severity, otherwise known as tail risk;Operations in many jurisdictions or with an organizational structure with many legal entities, which may grow beyond management'scapacity to control; andAn investment structure that is too complex to capture a general trading and investment company's overall risk level.d) Risks not captured by the capital adequacy assessment130. Our capital adequacy assessment is based on a number of simplifying assumptions that we may make when applying capital charges.These include, but are not limited to:
The application of capital charge percentages uniformly at the asset category level rather than at the individual asset level;For assets where the capital charge is a function of the economic risk assessment, the use of the same economic risk assessment for allthose assets rather than asset by asset, or asset category by asset category;The assumption of a uniform equity market group for listed securities; andThe absence in this industry of standardized adjustments to capital charges for concentration or correlation considerations.131. When those assumptions result in lower capital charges than what our analysis of individual asset characteristics might otherwiseindicate, certain risks may not be adequately covered by the capital adequacy assessment. Conversely, when those assumptions result incapital charges that are in line with what our analysis of individual asset characteristics might indicate, capital adequacy analysis does notmiss material risk exposures or, if it does, other lower-risk characteristics more than offset them.

132. Other common risks that the capital adequacy analysis may not sufficiently cover are interest rate risk and currency risk.
133. Substantial differences among investment portfolios in the same industry are also considered here. Such differences are material whengeneral trading and investment companies have more significant exposure than peers in the same specific sub-industrial sectors or newfields, such as unconventional oil and gas among energy investments and emerging markets among overseas investments.
e) Evidence of stronger or weaker loss experience134. Evidence of a stronger risk position is reflected in relatively lower recent and projected losses than for peers with a similar mix of riskassets in their portfolio, and a better-than-average track record of losses during periods of similar economic stress. Conversely, weaker riskpositions are associated with losses that are greater than the average for peers with a similar mix of risk assets in their portfolio, or a worse-than-average track record of losses during recent periods of similar economic stress.
135. Deviations from the average peer performance are explained by highlighting the root causes as any combination of growth,concentration, and complexity, or by considering how a risk specific to a general trading and investment company is materially different fromthe standard risk assumptions in the capital adequacy analysis or our calculation of normalized losses.
136. Examples of such material differences may be any of the following:
Provisioning and loss recognition by a general trading and investment company that may be more aggressive or less so than peers';Legal or regulatory costs or fines that can be higher or lower than for peers in similar lines of business; orDeviations in the performance of individual large investments, compared with our initial projections.2. Asset risk management capabilities137. For a general trading and investment company's asset risk management capabilities, we aim to examine whether the company'sstrategy for reshaping the business portfolio and buying and selling assets to optimize the risk/return balance is reasonably managed undercontrolled risk management. Market risk, credit risk, and business investment risk are key risk areas.
138. Our analysis of asset risk management capabilities examines whether general trading and investment companies execute riskmanagement practices in a systematic, consistent, and strategic manner across the enterprise that effectively limits future losses within anoptimal risk/return framework. Asset risk management analysis also provides a prospective view of the general trading and investmentcompany's risk profile and necessary risk buffer, equity.
139. All else being equal, a general trading and investment company with stronger asset risk management capabilities is less likely toexperience losses outside the predetermined risk tolerances set under its risk management framework than a company with weaker assetrisk management capabilities.
140. Our analysis of asset risk management capabilities for general trading and investment companies draws from our methodology forassessing risk management for insurers (see "Enterprise Risk Management," published May 7, 2013), but we adapt it for general trading andinvestment companies.
141. We assess asset risk management capabilities on a three point scale as "adequate with strong risk controls," "adequate," or "weak"(see table 20), based on the analysis of six subfactors, which we each assess as "positive," "neutral," or "negative" (see table 21). The sixsubfactors are:
Risk management culture,Risk controls,Risk appetite,Emerging risk management,Risk models, andStrategic risk management.Table 20Determining The Asset Risk Management Capabilities Assessment For General Trading And Investment CompaniesAssessmentGuideline What it means in our opinionAdequate with strong risk controls
The risk management culture, riskcontrols, and risk appetite subfactorsare assessed as positive, and nosubfactor is assessed as negative.
The company's asset risk management capabilities are comprehensive, wellestablished, and effective; there are no known deficiencies in key areas and we see therisk management culture as well entrenched and transparent, its risk appetiteappropriately balances risk and opportunities, and it has also established various riskcontrols that we view in aggregate as positive. This results in a demonstrated andexpected ability to consistently identify, measure, and manage risk exposures andlosses with chosen risk tolerances.There is sufficient, clear evidence of the company's practice of optimizing risk-adjustedreturns. The company has a sufficient track record of success.Risk and risk management are important considerations in the company's corporatedecision making.In our opinion, the company is relatively unlikely to experience unexpected losses thatare outside of its risk tolerances.
AdequateThe risk management culture, riskcontrols, and risk appetite subfactorsare assessed as at least neutral but,overall, the assessments don't satisfythe requirements for "adequate withstrong risk controls."
The company has capabilities to identify, measure, and manage most key riskexposures and losses, but the process has not been extended to all significant risksfacing the enterprise.
The company's loss/risk tolerance guidelines are less developed than those ofcompanies with a higher assessment.The company demonstrates sufficient execution of its existing risk managementprograms, although the execution is less comprehensive than those of companies witha higher assessment.

Risk and risk management are often important considerations in the company'sdecision making.In our opinion, the company is more likely to incur unexpected losses than a companywith a higher assessment.
WeakAny of the risk management culture,risk controls, or risk appetite,subfactors are assessed as negative.
The company has limited capabilities to consistently identify, measure, and manage riskexposures across the enterprise and, thereby, limit losses.
The company demonstrates sporadic execution of its risk management program; lossesaren't expected to be limited in accordance with a set of predetermined risk toleranceguidelines.The company has yet to adopt a risk management framework; or it has very recentlyadopted a risk management system that has yet to be tested.Risk appetite is aggressive and other subfactors would not offset this.Risk and risk management are only sometimes considered in the company's corporatedecision-making process.
Table 21Assessing The Six Subfactors For Asset Risk Management CapabilitiesSubfactorPositive Neutral Negative1. Risk management culture
Risk management is well entrenchedin the organization, with a formal riskmanagement framework, anindependent and well-staffed riskmanagement department, and activeboard participation.
The company has some riskmanagement functions at the enterpriselevel that cover most material risks.
Risk management is not practiced, or is practicedinconsistently, across the enterprise, with limitedboard participation.
The company has a clear vision of itsasset risk profile and risks aremanaged, both at a business-unit andenterprise level, within risktolerances.
There is limited or infrequent boardparticipation.
The company lacks a clear understanding of itsasset risk profile.
The company has a culture of riskcommunication and informationsharing, internally and externally.
The company understands its asset riskprofile around key risk exposures andmanages them within chosen risktolerances.
The company lacks a formal asset risk managementframework supported by clear rationales; risk limitsdo not exist or are very basic.
2. Risk controlsThe company has identified allmaterial asset risks from all sourcesand frequently monitors its riskexposures with multiple metrics.
The company has identified andmonitors its main sources of materialasset risks.
The company has a comprehensiveasset risk limit system and strictformal limit breach policies.
The company has an asset risk limitsystem to deal with material asset risks,but the limits are relatively simple orlack linkage to risk appetite.
The company has a limited formal asset risk limitsystem, or its asset risk limit system is overlyaggressive, providing no practical value incontrolling exposures.
The company has strict "exit rules"for its investments and the exit ruleswork in practice at a corporatemanagement level with good trackrecords.
The company has adequate "exit rules"for its investments and the exit ruleswork in practice at a corporatemanagement level.
The company does not have "exit rules" for itsinvestments.
The company has formal risk limitsincluding limits for assetconcentration and multiple riskmanagement strategies to effectivelymanage exposures
Even though the company has formalrisk limits including limits for assetconcentration, they are not enforced.
The company has no formal risk limits so there isno enforcement.
3. Risk appetite
The company has a low risk appetite.The company has a modest riskappetite.
The company has an aggressive risk appetite farbeyond its risk management capability.
Investment targeting (for example,internal rate of return [IRR] hurdles)is reasonably conservative (i.e., high),with a good track record relative tothe industry average.
Investment targets are average for theindustry.
Investment targets are quite aggressive and farbelow industry averages and historical trackrecords. The company has a track record ofsignificant negative free cash flow (cash flow fromoperations plus net investment cash flow) inmultiple years and we expect this to continuemainly because of planned large investments orlosses.
The company's asset risk appetiteframework is clearly communicatedand linked directly to risk limits.
Asset risk management is mainly theresponsibility of business functions, withlimited enterprise overview.
The company manages asset risks predominantly insilos.
The company publicly discloses freecash flow targets and shows a strongcommitment to meet the targets evenduring times of stress by sellingassets or halting investments.
The company publicly discloses its freecash flow targets, but may miss thetargets in times of stress or as a resultof changes in the business environment.
4. Emerging risk management

The company has well-establishedprocesses for identifying andmonitoring emerging asset risks,analyzing their significance, andpreparing for and/or potentiallymitigating them.
The company has some processes inplace to identify and analyze the impactof emerging asset risks; but theseprocesses are more ad-hoc and do notlead to risk mitigations.
The company does not have processes foridentifying and evaluating emerging asset risks.
5. Risk models
The company's risk models captureall material asset risks and asset riskinterrelationships in aggregatingexposures.
The company's risk models capturemajor asset risks. However, the modelsare less comprehensive or the processesused to aggregate enterprise asset riskexposures are less sophisticated thanthose at companies assessed positive.
The company does not use asset risk models or therisk models often fail to capture major asset risks.
The company understands modellimitations and these arecompensated for within theorganization.
There are general concerns about data quality,assumptions, and governance.
The company uses model resultsextensively in the decision-makingprocess ("use test" in industryparlance).
6. Strategic risk managementThe company has a track record ofconsistently using a risk vs. rewarddecision-making framework tooptimize risk-adjusted returns at anenterprise level.
The company uses some risk vs. rewardanalysis in decision making, but themetrics and processes applied areinconsistent across the company.
The company does not optimize risk-adjustedreturns; risk and risk vs. reward analysis is notreflected in the company's decision making.
H. Modifiers1. Capital structure142. To assess a general trading and investment company's capital structure, we largely follow the methodology used for other corporateissuers (see "Corporate Methodology," section G, paragraphs 136-156). However, for general trading and investment companies, the capitalstructure analysis does not assess the investment subfactor, since investments are included within our analysis of capital adequacy. Weassess capital structure as either "neutral," "negative," or "very negative" as per table 21 of "Corporate Methodology."
143. The assessment rests on the evaluation of three subfactors: i) currency risk of debt, ii) debt maturity, and iii) interest risk of debt, whichwe each assess as either neutral or negative in accordance with "Corporate Methodology," paragraphs 142-152. However, we modify theassessment for currency risk of debt by applying a debt-to-equity test of 4.0x in place of the debt-to-EBITDA test of 3.0x set forth inparagraphs 143 and 144 of "Corporate Methodology."
2. Financial policy144. In assessing the financial policy of a general trading and investment company, the analysis uses the same methodology as that usedfor other corporate issuers (see "Corporate Methodology," section H), except that the section relative to financial sponsors would not applyto general trading and investment companies.
3. Funding and liquidity145. We assess funding and liquidity on a combined basis. Funding and liquidity assesses a general trading and investment company'scapacity to support its business performance through effective funding, while managing liquidity requirements both on an ongoing basis andin periods of stress.
146. We believe that stable funding carries far more importance for general trading and investment companies than for other industrialcompanies. Similar to financial institutions, we believe that stable long-term funding is essential to maintain their long-term investmentbusiness. The way general trading and investment companies fund their business directly affects their ability to maintain their investmentbusiness and to meet obligations in adverse circumstances. In funding, the analysis is guided by the basic principle that stable, long-termfunding sources generally should finance long-term and less liquid assets, and that the use of short-term funding generally should be limitedto financing of short-term and more liquid assets.
147. At the same time, we believe liquidity is as critical for general trading and investment companies as for other industrial companies. Inour view, general trading and investment companies are less confidence-sensitive than banks or financial companies, but share comparablesensitivity to other industrial companies.
148. The aggregate impact on the anchor (or SACP if caps apply) of the funding and liquidity assessments is shown in table 5 above. If theanchor is 'bbb-' or higher, before applying the funding and liquidity modifier, funding and liquidity will not modify the anchor upward. As forother nonfinancial corporate entities, we apply a cap on the SACP if liquidity is assessed as "less than adequate" or "weak."
149. We assess funding and liquidity in the below three steps. First, we determine the funding assessment by analyzing the funding stabilityratio (FSR), which we define as the ratio of long-term debt plus equity to long-term assets, a measure to evaluate the balance betweenfunding sources and uses; we also consider several qualitative factors to determine the funding assessment. Second, we determine theliquidity assessment by applying our corporate liquidity criteria (see "Methodology And Assumptions: Liquidity Descriptors For GlobalCorporate Issuers," published Dec. 16, 2014). In the calculation, we use our expectations, including cash flow and investment forecasts.And third, we combine the two resulting assessments for funding and liquidity to determine their aggregate impact on SACP.
150. In addition to the characteristics in table 22, for companies that are subsidiaries of larger corporate or financial groups, we also factorin the role that the parent group plays in the ongoing funding and liquidity of the subsidiary. If a general trading and investment companyhas, prior to considering ongoing parent support, a funding assessment of "moderate" or "weak," or if the liquidity assessment is "less thanadequate" or "weak" but its group status is "moderately strategic" or higher (as defined in "Group Rating Methodology," published Nov. 19,2013), then we raise both the funding and liquidity assessments to "adequate" if all of the following characteristics are met:
The parent has the capacity to meet the company's current and expected funding and liquidity needs.
The parent has a demonstrated history of providing funding and supporting the liquidity of its subsidiary.There are no regulatory or other barriers to the parent providing this support.a) Funding151. Funding is assessed based on the FSR and qualitative characteristics (see table 22). A general trading and investment company's FSRis defined as its long-term debt plus equity divided by its long-term assets. The ratio provides a holistic view of a general trading andinvestment company's available stable long-term funding sources relative to its stable long-term funding needs.
We define funding sources as the sum of total equity and long-term debt including hybrid instruments with minimal equity content maturingafter one year.We define funding needs as the sum of long-term assets (noncurrent assets).152. Under the criteria, an FSR of 120% or higher is necessary to achieve a funding assessment of "strong." The FSR is combined withqualitative considerations to determine the funding assessment. If the FSR is less than 120%, positive qualitative considerations canimprove the funding assessment. Conversely, negative qualitative considerations can shift the funding assessment down by one or morelevels (for example, to "adequate" from "strong") even if the FSR is 120% or more. Qualitative considerations include an evaluation of theassumptions made in the FSR calculation as well as company-specific funding strengths and weaknesses.
153. Among five characteristics that we analyze to assess funding stability (see table 22), we believe strong relationships with creditorbanks is a key supporting factor. For companies that have ongoing, well-entrenched banking relationships, we can reflect these relationshipsin our funding assessment. These relationships may take the form of historical links, as well as shareholdings and management influence bythe main banks, and interaction between the main banks and the company. Based on their bank relationships, these companies often havelower funding costs and longer funding terms than those who do not benefit from such relationships, even if the economy worsens.
Table 22Funding Assessment For General Trading And Investment CompaniesThe following characteristics support funding. We assess funding as "strong," "adequate," "moderate," or "weak" based on which of thesepositive characteristics apply to the company.The company has ongoing, well-entrenched relationships with banks, as demonstrated even in past stress periods.The majority of the company's funding consists of stable long-term or medium-term debt, and the company does not rely significantly onshort-term debt or debt sources that have proven highly unstable in the past (such as certain forms of debt secured by assets whose creditquality is not easily observed in public markets, or cash flows and other types of complex off-balance-sheet funding).We believe the company could easily access multiple sources of secured and unsecured debt in the capital markets, even in stress periods.The company has no significant maturity concentrations (staggered debt maturities) and is strongly positioned to manage its refinancingrequirements.We do not expect a sharp increase in the cost of funding or refinancing for the company or for the sector and we do not expect the companyto have difficulty retaining funding over the next year.StrongWe expect the FSR to be 120% or higher, and all of the above positive funding characteristics apply.AdequateWe expect the FSR to be 120% or higher, but one of the positive funding characteristics does not apply; orWe expect the ratio to be 90% or more but less than 120%, and all of the positive funding characteristics apply.ModerateWe expect the FSR to be 120% or higher, but more than one of the positive funding characteristics do not apply;We expect the FSR to be 90% or more but less than 120%, but one of the positive funding characteristics does not apply; orWe expect the ratio to be less than 90%, and all of the positive funding characteristics apply.WeakThe conditions for a Strong, Adequate, or Moderate assessment are not met.b) Liquidity154. In assessing a general trading and investment company's liquidity, we apply the corporate liquidity criteria (see "Methodology AndAssumptions: Liquidity Descriptors For Global Corporate Issuers," published Dec. 16, 2014) with certain modifications as described inparagraphs 155 and 157 below.
155. General trading and investment companies typically hold some commodity inventories (like companies in the commodity tradingindustry). If we identify those commodity inventories as readily marketable inventories, we include those in our liquidity analysis with certainadjustments as described (and subject to the same conditions, including applicable haircuts by commodity) in paragraphs 71-73, as well asparagraph 87 of "Commodities Trading Industry Methodology," published Jan. 29, 2015.
156. Unlike other industrial companies, general trading and investment companies regularly have large cash flows in their investmentactivity, one of their core businesses. However, the liquidity criteria primarily focus on FFO under "Methodology And Assumptions: LiquidityDescriptors For Global Corporate Issuers," published Dec. 16, 2014, while cash flows from investment activities are incorporated into theliquidity analysis only when they are confidently predictable, typically when relevant investment transactions are contracted. For example,we include expected cash proceeds from loan receivables from customers over the next 24 months because collections of such loanreceivables are confidently predictable under contract. But we do not treat cash flow from planned asset sales as liquidity sources unlesscontracted. This is because our liquidity analysis is meant to be an analysis under certain stresses, and it's generally difficult to identifywhich investment divestitures are certain under stress.
157. On the other hand, given general trading and investment companies' greater flexibility to generate cash by divesting some investments,thereby adding stability to cash inflow when needed (even if not identifiable in advance), we differentiate a threshold between thesecompanies and other industrial corporate issuers. More specifically, while the corporate liquidity criteria assess the liquidity as "less thanadequate" when the ratio of liquidity sources to liquidity uses is less than 1.2x, we use a 1.1x threshold for general investment and tradingcompanies.
4. Management and governance158. In assessing the management and governance of a general trading and investment company, we adopt our general management andgovernance criteria (see "Methodology: Management And Governance Credit Factors For Corporate Entities And Insurers," published Nov.13, 2012) but apply it only to areas other than asset risk management, which the asset risk management capabilities assessment addresses.A company's management and governance can be assessed as: "strong," "satisfactory," "fair," or "weak."
5. Comparable ratings analysis

159. The comparable ratings analysis for a general trading and investment company uses the same methodology as that described insection K of the "Corporate Methodology" criteria.
VII. APPENDIXESAppendix I160. This section of the appendix explains how we assess the competitive risk and growth of the general trading and investment industry'strading business at "intermediate risk" (3), as described in the paragraph 45.
Competitive risk and growth assessment for the trading businessa) Effectiveness of barriers to entry--medium risk161. We assess the effectiveness of barriers to entry in the trading business as medium risk. Barriers to entry in the trading business tend toentail medium risk overall. Primarily, general trading and investment companies act as intermediaries for their customers and generally donot speculate for their own accounts. Factors such as trading know-how, customer relationships, access to distribution channels,information intelligence, the ability to provide financing, and logistics network are typically the biggest barriers to entry.
162. The prevalence of these factors is not homogenous across various segments in general trading and investment companies' tradingbusiness, however, resulting in our assessment of overall medium risk. Some segments, for instance, have a near-oligopolistic naturedominated by a few participants where well-established and extensive networks form effective barriers to entry. Conversely, other segmentsare fragmented and often comprise both large participants and many small, local operators with limited networks and know-how, resulting inlow protection against new entrants.
b) Level and trend of the trading business' profit margins--medium risk163. We assess trading business profit margins as medium risk. Trading businesses can typically generate thin but relatively stable marginsby acting as intermediaries for customers. Moreover, general trading and investment companies' trading businesses generally are notexposed to currency or price fluctuation risks because they usually hedge their market risk or can often pass on such risk to their customersby contract. This helps support stable profit margins.
c) Risk of secular change and substitution by functions, services, and technologies--medium risk164. In the criteria, we assess the risk of substitution as medium risk for general trading and investment companies' trading business. Inmaking such a judgment, we take into account the possibility that new services and functions could emerge to provide a company's tradingcustomers with alternative options. It is also possible that a general trading and investment company's end customers could begin todirectly trade with some of their upstream or midstream suppliers. Other potential threats to a trading business may include in-sourcing(customers bringing activities such as raw material procurement, logistics, and distribution in-house).
165. However, we think general trading and investment companies can usually fend off these threats by differentiating their services to meetthe needs of specific customers. More importantly, general trading and investment companies often have dominant positions in upstreambusinesses, allowing them to enjoy strong positions in downstream businesses, to the point of establishing somewhat exclusive distributionchannels with their customers. Technological change in trading is generally irrelevant and technological displacement is typically not a majorrisk factor. Government mandates and subsidies--for instance, global or country-specific energy or environmental policies--can underpindemand for certain types of trading activities, depending on the sustainability of such mandates or subsidies.
d) Risk in trading business growth trends--medium risk166. We also assess the risk in the industry's growth trends as medium risk for general trading and investment companies' trading business.Factors that generally support long-term demand for a trading business include a desire by its customers to utilize industry intelligence andnetworking to find new business partners, to outsource business, and to reduce logistics costs. Growth in a trading business is generally tiedto economic conditions, whether in mature, low-growth markets or in newer, faster-growing markets.
167. Key trading functions include market research/marketing, serving as a business intermediary, serving as a buyer's trading agent,providing logistics and IT operations, and providing trade financing. We do not expect significant growth or shrinkage in these businesses.Rather, we expect them to display relatively stable growth over the long term.
Appendix II168. This section of the appendix explains how we assess the competitive risk and growth of the general trading and investment industry'sinvestment business at "moderately high" (4), as described in paragraph 46.
Competitive risk and growth assessment for the investment businessa) Effectiveness of the investment business' barriers to entry--medium risk169. In the criteria, we assess that barriers to entry in the resource investment business entail medium risk overall. Entry requiresinvestment in infrastructure, including scale, scope, and in-depth networking with global key players to obtain valuable investmentinformation, as well as the ability to actually invest.
170. Another barrier is capital. As the scale and scope of a resource project increases, the amount of investment required for constructionand operation increases. Even as a minority owner, a general trading and investment company often has to provide financing forinfrastructure such as railroads or ports. Technological know-how generally isn't a prerequisite because these projects usually have separateproject managers or operators.
171. As most resource projects are large, only a limited number of players have the global network to find customers for the project'sproducts, plus sufficient financial strength to operate in the resource investment to successfully complete the project, in our view.
172. In the criteria, we also presume medium barrier-to-entry risk for nonresource investments. Typically, as a majority owner of suchbusinesses, general trading and investment companies are "hands-on" investors, not only as financial investors, but also as businessmanagers. This makes the barrier to entry in a nonresource investment business higher than it would be otherwise.
b) Level and trend of the investment business' profit margins--high risk173. We assess the level and trend of the industry's investment profit margins as high risk. For general trading and investment companies'investment business, we include the evaluation of operating profits plus capital gains and losses in the analysis of this subfactor. We expectprofits from resource investments to fluctuate with economic and commodity cycles. Generally, profits can come under consistent pressurefrom the following factors:
Price-based competition in pure commodities, making even the soundest mining projects unable to differentiate their products to get better

or more stable pricing;A high degree of operating risk from hazards such as explosions, fires, weather disruptions (including floods), and other natural disasters.This risk is, however, generally lower than that in the oil and gas upstream industry; andRegulation and high taxation in many countries that may include export duties, royalties, "super-profit" taxes, license payments, andenvironmental obligations.174. For nonresource investments, we also expect profit to be volatile, in line with fluctuations in the invested industries, such as automanufacturing, foods and retail, and commodity chemicals.
c) Risk of secular change and substitution by functions, services, and technologies--medium risk175. In the criteria, we assume medium risk of product and service obsolescence, because we believe substitutes will make modest inroadsinto demand for both resource and nonresource products in the near to medium term, as detailed below.
In the near to medium term, industrialization in emerging markets and dependence on hydrocarbon-based economic development shouldcontinue to support meaningful demand growth for oil and natural gas. We believe natural gas in particular should face little substitution riskin the near to medium term because it's more friendly environmentally than other hydrocarbon fuels. Even though a particular metal mayfrom time to time be displaced in some applications by another metal or plastics, in the past the scope of such substitution has been limited,the change has been gradual, and new applications for the metal have emerged.In the long term, traditional resource products might become vulnerable to new competitors, including shale gas, forms of renewable energysuch as wind power and solar power, or new energy sources. Spurred by environmental concerns, some governments have mandatedincreasingly stringent energy efficiency standards and have provided incentives to use renewable energy or other alternatives. This is likelyto slow down secular growth in demand for petroleum products and mining products in mature, developed economies.Increased political and social emphasis on demand management and energy efficiency could reduce demand for energy sources.Nonresource businesses held by general trading and investment companies usually are closely linked to their trading businesses. Forexample, general trading and investment companies may invest in automakers or food producers and marketers--companies at the top of"industry pyramids"--that help support their auto-dealer or retail supermarkets businesses.d) Risk in investment business growth trends--high risk176. In our observation, resource investing is cyclical and prone to overinvestment. Sales declined significantly during recessions, but thenoutpaced GDP growth during expansions. Accordingly, we assume that investments aimed at spurring growth are often high risk. Granted,the risk of unsuccessful exploration has receded somewhat thanks to technological advances in reservoir mapping and resource extraction,particularly when targeting onshore shale formations. Even though most general trading and investment companies usually take minoritystakes in brownfield projects, some of their investment businesses are on a pro rata basis. Unsuccessful investment risk may, in aggregate,be relatively low, but we take a conservative view, given the sector's various investment types.
177. For nonresource businesses, growth trends in this sector's investment businesses are affected by industries such as automanufacturing, food and retail, and commodity chemicals.
Appendix IIITable 23 (a)Capital Charges By Weighted-Average Economic Risk Assessmenta. Notes and accounts receivables, and b. Loan receivables and bonds (current assets)Weighted-average economic risk assessmentCapital charge for 'BBB' stress (%)Capital charge for 'A' stress (%)1 3 52 4 53 4 64 5 75 6 86 7 107 8 118 10 139 11 1610 13 18Table 23 (b)Capital Charges By Weighted-Average Economic Risk Assessmentc-2. Inventories from nonresources (excluding real estate and vessels)Weighted-average economic risk assessmentCapital charge for 'BBB' stress (%)Capital charge for 'A' stress (%)1 6 72 6 83 7 94 8 105 9 126 11 147 13 168 15 199 18 2210 21 26Table 23 (c)Capital Charges By Weighted-Average Economic Risk Assessmentd-3. Long-term credit exposure (listed bonds)Weighted-average economic risk assessmentCapital charge for 'BBB' stress (%)Capital charge for 'A' stress (%)1 2 32 2 33 3 34 3 45 4 56 4 67 5 7

8 6 89 7 910 8 10Table 23 (d)Capital Charges By Weighted-Average Economic Risk Assessmentd-4. Long-term credit exposure (unlisted bonds, loans, and guarantees)Weighted-average economic risk assessmentCapital charge for 'BBB' stress (%)Capital charge for 'A' stress (%)1 6 72 6 83 7 94 8 105 9 126 11 147 13 168 15 199 18 2210 21 26Appendix IVTable 24 (a)Capital Charges By Weighted-Average Equity Market Groupd-1. Securities and investments (listed stock)Weighted-average equity market groupCapital charge for 'BBB' stress (%)Capital charge for 'A' stress (%)1 35 452 45 553 55 654 65 75Table 24 (b)Capital Charges By Weighted-Average Equity Market Groupd-2. Securities and investments (unlisted stock)Weighted-average equity market groupCapital charge for 'BBB' stress (%)Capital charge for 'A' stress (%)1 45 552 55 653 65 754 75 85VIII. RELATED CRITERIA AND RESEARCHRelated CriteriaGeneralRating Government-Related Entities: Methodology And Assumptions, March 25, 2015Group Rating Methodology, Nov. 19, 2013Ratings Above The Sovereign--Corporate And Government Ratings: Methodology And Assumptions, Nov. 19, 2013Country Risk Assessment Methodology And Assumptions, Nov. 19, 2013Methodology And Assumptions: Assigning Equity Content To Corporate Entity And North American Insurance Holding Company HybridCapital Instruments, April 1, 2013Criteria For Assigning 'CCC+', 'CCC', 'CCC-', And 'CC' Ratings, Oct. 1, 2012Principles Of Credit Ratings, Feb. 16, 2011Stand-Alone Credit Profiles: One Component Of A Rating, Oct. 1, 2010Understanding Standard & Poor's Rating Definitions, June 3, 2009Industrial corporate (general)Methodology And Assumptions: Liquidity Descriptors For Global Corporate Issuers, Dec. 16, 2014Corporate Methodology, Nov. 19, 2013Corporate Methodology: Ratios And Adjustments, Nov. 19, 2013Methodology: Industry Risk, Nov. 19, 2013Methodology: Management And Governance Credit Factors For Corporate Entities And Insurers, Nov. 13, 2012Hybrid Capital Handbook: September 2008 Edition, Sept. 15, 2008Financial institutionsNonbank Financial Institutions Rating Methodology, Dec. 9, 2014Quantitative Metrics For Rating Banks Globally: Methodology And Assumptions, July 17, 2013Banks: Rating Methodology And Assumptions, Nov. 9, 2011Bank Capital Methodology And Assumptions, Dec. 6, 2010InsuranceInsurers: Rating Methodology, May 7, 2013Enterprise Risk Management, May 7, 2013Refined Methodology And Assumptions For Analyzing Insurer Capital Adequacy Using The Risk-Based Insurance Capital Model, June 7,2010Industrial (specific industries)Commodities Trading Industry Methodology, Jan. 29, 2015Request For Comment: Methodology: Investment Holding Companies, Nov. 26, 2014Methodology For Standard & Poor's Metals And Mining Price Assumptions, Nov. 19, 2013Methodology For Crude Oil And Natural Gas Price Assumptions For Corporates And Sovereigns, Nov. 19, 2013Related ResearchBanking Industry Country Risk Assessment Update: May 2015, May 6, 2015 (subject to updates from time to time)These criteria represent the specific application of fundamental principles that define credit risk and ratings opinions. Their use isdetermined by issuer- or issue-specific attributes as well as Standard & Poor's Ratings Services' assessment of the credit and, if applicable,structural risks for a given issuer or issue rating. Methodology and assumptions may change from time to time as a result of market andeconomic conditions, issuer- or issue-specific factors, or new empirical evidence that would affect our credit judgment.

Legal DisclaimersCareers at S&P Ratings ServicesTerms of UsePrivacy and Cookie NoticeCopyright © 2015 Standard & Poor's Financial Services LLC, a part of McGraw Hill Financial. All rights reserved.
Reproduction and distribution of this information in any form is prohibited except with the prior written permission of Standard & Poor's.Standard & Poor's does not guarantee the accuracy, completeness, timeliness or availability of any information, including ratings, and is notresponsible for any errors or omissions (negligent or otherwise), regardless of the cause, or for the results obtained from the use of suchinformation. STANDARD & POOR'S GIVES NO EXPRESS OR IMPLIED WARRANTIES, INCLUDING, BUT NOT LIMITED TO, ANY WARRANTIES OFMERCHANTABILITY OR FITNESS FOR A PARTICULAR PURPOSE OR USE. STANDARD & POOR'S shall not be liable for any direct, indirect,incidental, exemplary, compensatory, punitive, special or consequential damages, costs, expenses, legal fees, or losses (including lostincome or profits and opportunity costs) in connection with any use of this information, including ratings. Standard & Poor's ratings arestatements of opinions and are not statements of fact or recommendations to purchase hold or sell securities. They do not address themarket value of securities or the suitability of securities for investment purposes, and should not be relied on as investment advice. Pleaseread our complete disclaimer here
Primary Credit Analyst:Hiroki Shibata, Tokyo (81) 3-4550-8437;[email protected]
Secondary Contacts:Chizuko Satsukawa, Tokyo (81) 3-4550-8694;[email protected] Kubota, Tokyo 81-3-4550-8730;[email protected]
Criteria Officers:Mark Puccia, New York (1) 212-438-7233;[email protected] Yamaoka, Tokyo (81) 3-4550-8719;[email protected] Buet, Paris (33) 1-4420-6687;[email protected] J Eastham, Melbourne (61) 3-9631-2184;[email protected]
No content (including ratings, credit-related analyses and data, model, software or other application or output therefrom) or any partthereof (Content) may be modified, reverse engineered, reproduced or distributed in any form by any means, or stored in a database orretrieval system, without the prior written permission of S&P. The Content shall not be used for any unlawful or unauthorized purposes. S&P,its affiliates, and any third-party providers, as well as their directors, officers, shareholders, employees or agents (collectively S&P Parties)do not guarantee the accuracy, completeness, timeliness or availability of the Content. S&P Parties are not responsible for any errors oromissions, regardless of the cause, for the results obtained from the use of the Content, or for the security or maintenance of any data inputby the user. The Content is provided on an “as is” basis. S&P PARTIES DISCLAIM ANY AND ALL EXPRESS OR IMPLIED WARRANTIES,INCLUDING, BUT NOT LIMITED TO, ANY WARRANTIES OF MERCHANTABILITY OR FITNESS FOR A PARTICULAR PURPOSE OR USE, FREEDOMFROM BUGS, SOFTWARE ERRORS OR DEFECTS, THAT THE CONTENT’S FUNCTIONING WILL BE UNINTERRUPTED OR THAT THE CONTENTWILL OPERATE WITH ANY SOFTWARE OR HARDWARE CONFIGURATION. In no event shall S&P Parties be liable to any party for any direct,indirect, incidental, exemplary, compensatory, punitive, special or consequential damages, costs, expenses, legal fees, or losses (including,without limitation, lost income or lost profits and opportunity costs) in connection with any use of the Content even if advised of thepossibility of such damages.
Credit-related analyses, including ratings, and statements in the Content are statements of opinion as of the date they are expressed and notstatements of fact or recommendations to purchase, hold, or sell any securities or to make any investment decisions. S&P assumes noobligation to update the Content following publication in any form or format. The Content should not be relied on and is not a substitute forthe skill, judgment and experience of the user, its management, employees, advisors and/or clients when making investment and otherbusiness decisions. S&P’s opinions and analyses do not address the suitability of any security. S&P does not act as a fiduciary or aninvestment advisor. While S&P has obtained information from sources it believes to be reliable, S&P does not perform an audit andundertakes no duty of due diligence or independent verification of any information it receives.
S&P keeps certain activities of its business units separate from each other in order to preserve the independence and objectivity of theirrespective activities. As a result, certain business units of S&P may have information that is not available to other S&P business units. S&Phas established policies and procedures to maintain the confidentiality of certain non-public information received in connection with eachanalytical process.
S&P may receive compensation for its ratings and certain credit-related analyses, normally from issuers or underwriters of securities or fromobligors. S&P reserves the right to disseminate its opinions and analyses. S&P's public ratings and analyses are made available on its Websites, www.standardandpoors.com (free of charge), and www.ratingsdirect.com and www.globalcreditportal.com (subscription), and may bedistributed through other means, including via S&P publications and third-party redistributors. Additional information about our ratings feesis available at www.standardandpoors.com/usratingsfees.
Any Passwords/user IDs issued by S&P to users are single user-dedicated and may ONLY be used by the individual to whom they have beenassigned. No sharing of passwords/user IDs and no simultaneous access via the same password/user ID is permitted. To reprint, translate,or use the data or information other than as provided herein, contact Client Services, 55 Water Street, New York, NY 10041; (1)212-438-7280 or by e-mail to: [email protected].