Methodology for estimating emissions from agriculture in ...
218
WOt-technical report 148 Methodology for estimating emissions from agriculture in the Netherlands Calculations of CH 4 , NH 3 , N 2 O, NO x , NMVOC, PM 10 , PM 2.5 and CO 2 with the National Emission Model for Agriculture (NEMA); Update 2019 L.A. Lagerwerf, A. Bannink, C. van Bruggen, C.M. Groenestein, J.F.M. Huijsmans, J.W.H. van der Kolk, H.H. Luesink, S.M. van der Sluis, G.L. Velthof & J. Vonk
Transcript of Methodology for estimating emissions from agriculture in ...

WOt-technical report 148
Methodology for estimating emissions from agriculture in the NetherlandsCalculations of CH4, NH3, N2O, NOx, NMVOC, PM10, PM2.5 and CO2 with the National Emission Model for Agriculture (NEMA); Update 2019
L.A. Lagerwerf, A. Bannink, C. van Bruggen, C.M. Groenestein, J.F.M. Huijsmans, J.W.H. van der Kolk, H.H. Luesink, S.M. van der Sluis, G.L. Velthof & J. Vonk


Methodology for estimating emissions from agriculture in the Netherlands

This WOT technical report was produced in accordance with the Quality Management System of the Statutory Research Tasks Unit for Nature & the Environment, a subsidiary of Wageningen University & Research. The mission of the Statutory Research Tasks Unit for Nature and the Environment (WOT Natuur & Milieu) is to carry out statutory research tasks on issues relating to nature and the environment. These tasks are implemented in order to support the Dutch Minister of Agriculture, Nature and Food Quality, who is responsible for these issues. We provide data about agri-environment, biodiversity and soil information to compile reports as part of national and international obligations, and we work on products of the PBL Netherlands Environmental Assessment Agency, such as the Assessment of the Human Environment reports. The ‘WOT technical reports’ series presents the findings of research projects implemented for the Statutory Research Tasks Unit for Nature & the Environment by various centres of expertise. WOT Technical Report 148 presents the findings of a research project commissioned and funded by the Dutch Ministry of Agriculture, Nature and Food Quality (LNV).
Methodology for estimating emissions from agriculture in the Netherlands
Calculations for CH4, NH3, N2O, NOx, NMVOC, PM10, PM2.5 and CO2 using the National Emission Model for Agriculture (NEMA) – Update 2019
L.A. Lagerwerf, A. Bannink, C. van Bruggen, C.M. Groenestein, J.F.M. Huijsmans, J.W.H. van der Kolk, H.H. Luesink, S.M. van der Sluis, G.L. Velthof & J. Vonk
Statutory Research Tasks Unit for Nature & the Environment Wageningen, March 2019
WOT Technical Report 148
ISSN 2352-2739
DOI: 10.18174/472366

Abstract Lagerwerf, L.A., A. Bannink, C. van Bruggen, C.M. Groenestein, J.F.M. Huijsmans, J.W.H. van der Kolk, H.H. Luesink, S.M. van der Sluis, G.L. Velthof & J. Vonk (2019). Methodology for estimating emissions from agriculture in the Netherlands. Calculations of CH4, NH3, N2O, NOx, NMVOC, PM10, PM2.5 and CO2 with the National Emission Model for Agriculture (NEMA) – update 2019. Wageningen, The Statutory Research Tasks Unit for Nature and the Environment. WOt-technical report 148. 215 p.; 6 Figs; 45 Tabs; 108 Refs; 12 Annexes. The National Emission Model for Agriculture (NEMA) is used to calculate emissions to air from agricultural activities in the Netherlands on a national scale. Emissions of ammonia (NH3) and other N compounds (NOx and N2O) are calculated for animal housing, manure storage, manure application and grazing using a flow model for total ammoniacal nitrogen (TAN). Emissions from the application of inorganic N fertilizer, compost and sewage sludge, cultivation of organic soils, crop residues, and ripening of crops are calculated as well. The NEMA is also used to estimate emissions of methane (CH4) from enteric fermentation and manure management, non-methane volatile organic compounds (NMVOC) and particulate matter (PM) from manure management and agricultural soils, as well as for carbon dioxide (CO2) from liming. Emissions are calculated in accordance with the criteria of international guidelines and reported in an annual Informative Inventory Report (IIR; for air pollutants) and National Inventory Report (NIR; for greenhouse gases). This methodology report provides an outline of and describes the background to the calculation of emissions according to the NEMA. Keywords: air pollutants, greenhouse gases, livestock, crops, animal housing, manure storage, manure application, inorganic N fertilizer, enteric fermentation, manure management, agricultural soils, liming, NIR, CRF, IIR, NFR Authors: L.A. Lagerwerf & J. Vonk - National Institute for Public Health and the Environment (RIVM)
A. Bannink & C.M. Groenestein - Wageningen Livestock Research
C. van Bruggen –Statistics Netherlands (CBS)
J.F.M. Huijsmans - Wageningen Plant Research
J.W.H. van der Kolk & G.L. Velthof - Wageningen Environmental Research
H.H. Luesink - Wageningen Economic Research
S.M. van der Sluis - PBL Netherlands Environmental Assessment Agency (PBL)
© 2019
National Institute for Public Health and the
Environment (RIVM)
PO Box 1, 3720 BA Bilthoven, Netherlands
T: +31 (30) 274 91 11; email: [email protected]
Wageningen Environmental Research
PO Box 47, 6700 AA Wageningen, Netherlands
T: +31 (317) 48 07 00; email: [email protected]
Wageningen Livestock Research
PO Box 65, 8200 AB Lelystad, Netherlands
T: +31 (320) 238 238; email: [email protected]
Wageningen Economic Research
PO Box 29703, 2502 LS The Hague, Netherlands
T: +31 (70) 335 83 30; email: [email protected]
Statistics Netherlands (CBS)
PO Box 24500, 2490 HA The Hague, Netherlands
T: +31 (70) 337 38 00; internet: www.cbs.nl
PBL Netherlands Environmental Assessment Agency
PO Box 30314, 2500 GH The Hague, Netherlands
T: +31 (70) 328 87 00; email: [email protected]
Wageningen Plant Research
PO Box 16, 6700 AA Wageningen, Netherlands
T: +31 (317) 48 60 01; email: [email protected]
The WOT technical reports series is published by the Statutory Research Tasks Unit for Nature & the Environment (WOT
Natuur & Milieu), part of Wageningen University & Research. This document is available from the secretary’s office, and it
can be downloaded from www.wur.nl/wotnatuurenmilieu
Statutory Research Tasks Unit for Nature & the Environment, P.O. Box 47, NL-6700 AA Wageningen, Netherlands.
Telephone: +31 317 48 54 71; e-mail: [email protected]; Internet: www.wur.nl/wotnatuurenmilieu
All rights reserved. No part of this publication may be reproduced and/or republished by printing, photocopying, microfilm or any other means
without the publisher’s prior permission in writing. The publisher accepts no responsibility for any damage ensuing from the use of the results of
this study or from the implementation of the recommendations contained in this report.
F-0031 UK vs 1.5 (2018) Project WOT-04-008-025 WOt-technical report 148 – March 2019

Preface
This report describes the methodologies for estimating emissions to air from agricultural activities in the Netherlands, as reported in the Informative Inventory Report 2019 (IIR; air pollutants) and the National Inventory Report 2019 (NIR; greenhouse gases), which cover the 1990-2017 time series. The report is an update to previous methodology reports (Vonk et al., 2016; Vonk et al., 2018). In turn, the aforementioned reports replaced the description of ammonia-emission calculations by Velthof et al. (2009) and the protocols that had previously accompanied the annual reporting of greenhouse gases. The calculations are performed using the National Emission Model for Agriculture (NEMA). Various institutes contribute to the annual calculations and the maintenance of the model. The authors wish to thank the many colleagues at Statistics Netherlands, the participating Wageningen Research groups (Wageningen Environmental Research, Wageningen Economic Research, Wageningen Livestock Research and Wageningen Plant Research), PBL Netherlands Environmental Assessment Agency and the National Institute for Public Health and the Environment (RIVM) for their contributions and support. The Netherlands Enterprise Agency (Peter Zijlema and Harry Vreuls) provided useful comments on previous versions of the report. Lotte Lagerwerf André Bannink Cor van Bruggen Karin Groenestein Jan Huijsmans Jennie van der Kolk Harry Luesink Sietske van der Sluis Gerard Velthof Jan Vonk

Methodology for estimating emissions from agriculture in the Netherlands - Update 2019 | 7
Contents
Preface 5
Summary 11
Samenvatting 15
1 Introduction 19
2 General aspects 23 2.1 Data collection 23 2.2 Activity data 23 2.3 Emission calculations 25 2.4 Uncertainty calculations 26
3 CH4 emissions from enteric fermentation (CRF Sector 3A) 33 3.1 Scope and definition 33 3.2 Source-specific aspects 34 3.3 Uncertainty estimates 40
4 CH4 emissions from manure management (CRF Sector 3B) 41 4.1 Scope and definition 41 4.2 Source-specific aspects for CH4 emissions from manure storage 41 4.3 Source-specific aspects for CH4 emissions from manure treatment 45 4.4 Uncertainty estimates 46
5 NH3 emissions from manure management (NFR Category 3B) 49 5.1 Scope and definition 49 5.2 Source-specific aspects for NH3 emissions from animal housing 51 5.3 Source-specific aspects for NH3 emissions from manure treatment 54 5.4 Source-specific aspects for NH3 emissions from outside manure storage facilities 55 5.5 Uncertainty estimates 57
6 NOx emissions from manure management (NFR category 3B) 59 6.1 Scope and definition 59 6.2 Source-specific aspects for NOx emissions from manure storage 59 6.3 Source-specific aspects for NOx emissions from manure treatment 60 6.4 Uncertainty estimates 62
7 N2O emissions from manure management (CRF sector 3B) 63 7.1 Scope and definition 63 7.2 Source-specific aspects for direct N2O emissions from manure storage 64 7.3 Source-specific aspects for direct N2O emissions from manure treatment 65 7.4 Source-specific aspects for indirect N2O emissions from manure management 66 7.5 Uncertainty estimates 67
8 NMVOC emissions from manure management (NFR Category 3B) 69 8.1 Scope and definition 69 8.2 Source-specific aspects for NMVOC emissions from animal housing 69 8.3 Source-specific aspects for NMVOC emissions from silage feeding in animal housing 71 8.4 Source-specific aspects for NMVOC emissions from outside manure storage 73 8.5 Uncertainty estimates 74
9 PM10 and PM2.5 emissions from animal housing (NFR category 3B) 75 9.1 Scope and definition 75 9.2 Source-specific aspects 75 9.3 Uncertainty estimates 78

8 | WOt-technical report 148
10 NH3 emissions from crop production and agricultural soils (NFR Category 3D) 81 10.1 Scope and definition 81 10.2 Source-specific aspects for NH3 emissions from the application of inorganic N fertilizer 82 10.3 Source-specific aspects for NH3 emissions from animal manure applied to soils 85 10.4 Source-specific aspects for NH3 emissions from sewage sludge applied to soils 89 10.5 Source-specific aspects for NH3 emissions from other organic fertilizers applied to soils
(including compost) 90 10.6 Source-specific aspects for NH3 emissions from urine and dung deposited by grazing
animals 91 10.7 Source-specific aspects for NH3 emissions from crop residues 93 10.8 Source-specific aspects for NH3 emissions during crop cultivation 95 10.9 Uncertainty estimates 95
11 NOx emissions from crop production and agricultural soils (NFR Category 3D) 97 11.1 Scope and definition 97 11.2 Source-specific aspects for NOx emissions from the application of inorganic N fertilizer 97 11.3 Source-specific aspects for NOx emissions from animal manure applied to soils 98 11.4 Source-specific aspects for NOx emissions from sewage sludge applied to soils 98 11.5 Source-specific aspects for NOx emissions from other organic fertilizers applied to soils
(including compost) 99 11.6 Source-specific aspects for NOx emissions from urine and dung deposited by grazing
animals 100 11.7 Source-specific aspects for NOx emissions from crop residues 100 11.8 Source-specific aspects for NOx emissions from the agricultural use of organic soils 101 11.9 Uncertainty estimates 102
12 N2O emissions from crop production and agricultural soils (CRF Sector 3D) 103 12.1 Scope and definition 103 12.2 Source-specific aspects for direct N2O emissions from the application of inorganic N
fertilizer 103 12.3 Source-specific aspects for direct N2O emissions from animal manure applied to soils 104 12.4 Source-specific aspects for direct N2O emissions from sewage sludge applied to soils 105 12.5 Source-specific aspects for direct N2O emissions from other organic fertilizers applied to
soils (including compost) 106 12.6 Source-specific aspects for direct N2O emissions from urine and dung deposited by
grazing animals 107 12.7 Source-specific aspects for direct N2O emissions from crop residues 107 12.8 Source-specific aspects for direct N2O emissions from the agricultural use of organic
soils 108 12.9 Source-specific aspects for indirect N2O emissions after atmospheric depositions of NH3
and NOx 109 12.10 Source-specific aspects for indirect N2O emissions from leaching and runoff of nitrogen
added to the soil 110 12.11 Uncertainty estimates 111
13 NMVOC emissions from crop production and agricultural soils (NFR Sector 3D) 113 13.1 Scope and definition 113 13.2 Source-specific aspects for NMVOC emissions from animal manure applied to soils 113 13.3 Source-specific aspects for NMVOC emissions from urine and dung deposited by grazing
animals 114 13.4 Source-specific aspects for NMVOC emissions from farm-level agricultural operations,
including the storage, handling and transport of agricultural products 115 13.5 Source-specific aspects for NMVOC emissions from crop cultivation 116 13.6 Uncertainty estimates 117
14 PM10 and PM2.5 emissions from crop production and agricultural soils (NFR Category 3D) 119 14.1 Scope and definition 119 14.2 Source-specific aspects for PM emissions from farm-level operations 119 14.3 Source-specific aspects for PM emissions from crop cultivation 120

Methodology for estimating emissions from agriculture in the Netherlands - Update 2019 | 9
14.4 Uncertainty estimates 121
15 CO2 emissions from liming (CRF Category 3G) 123 15.1 Scope and definition 123 15.2 Source-specific aspects 123 15.3 Uncertainty estimates 123
References 125
Justification 133
Annex 1 Calculation of TAN excretion for dairy cattle and young stock 135
Annex 2 Calculation of TAN excretion for pigs 139
Annex 3 Calculation of TAN excretion for poultry 151
Annex 4 Mineralization and immobilization of nitrogen in manure 167
Annex 5 Emission factors for NH3 from animal housing of cattle 169
Annex 6 Emission factors for NH3 from animal housing of pigs 173
Annex 7 Emission factors for NH3 from animal housing of poultry 181
Annex 8 Animal house occupancy fractions 187
Annex 9 Manure storage outside the animal house 189
Annex 10 Emission factors for calculation direct nitrous oxide emissions from agricultural soils (including grazing) 193
Annex 11 Uncertainty, quality assurance and verification 203
Annex 12 List of abbreviations 213


Methodology for estimating emissions from agriculture in the Netherlands - Update 2019 | 11
Summary
Emissions to air from agricultural activities in the Netherlands are estimated using the National Emission Model for Agriculture (NEMA). Calculations include the emission of ammonia (NH3), nitrogen oxides (NOx), nitrous oxide (N2O), non-methane volatile organic compounds (NMVOC), methane (CH4), particulate matter (PM10 and PM2.5) and carbon dioxide (CO2). These emissions originate from various processes within the agricultural production chain, grouped in the main categories enteric fermentation (CH4), manure management (CH4, NH3, NOx, N2O and NMVOC), crop production and agricultural soils (NH3, NOx, N2O and NMVOC), and lime application (CO2). The calculations for greenhouse gas emissions are based on the 2006 IPCC Guidelines. The figures for air pollutants are based on the 2016 EMEP Guidebook.
Enteric fermentation Ruminal and/or intestinal fermentation processes take place during the digestion of feed. Particularly large amounts of CH4 are formed in ruminants. For this reason, and in accordance with the key-source analysis, a country-specific (IPCC Tier 3) method that models enteric fermentation processes is used for dairy cattle. For other cattle categories, emissions are calculated using an IPCC Tier 2 approach based on feed rations per year. The emissions from small ruminants and intestinal fermentation by monogastric animals are calculated using IPCC 2006 default emission factors in kg CH4 per head (Tier 1).
Manure management This category includes emissions from manure stored in animal housing, manure treatment and/or manure in outside storage facilities. The emission of CH4 results from the fermentation of organic matter in treated or stored livestock manure. The rate of emission depends on the chemical composition of the manure, as well as on environmental factors (e.g. temperature and the availability of oxygen). Cattle, pigs and poultry are considered key sources, and they are therefore assessed using an IPPC Tier 2 approach. The excretion of volatile solids is calculated from rations fed. The emission of CH4 is calculated by multiplying volatile solids by the maximum methane production potential (Bo) and the methane-conversion factor (MCF). Slurry and solid manure are distinguished from manure excreted on pasture land. Emissions from other livestock categories are calculated using the IPCC 2006 defaults in kg CH4 per head (Tier 1). Ammonia (NH3) is produced from urinary nitrogen (N) and mineralised organic N in the faeces, the sum of which is referred to as total ammoniacal nitrogen (TAN). Following bacterial conversion to ammonium, gaseous NH3 emits to the air, depending on physical and chemical conditions. The TAN content in the manure of the major livestock categories is calculated from annual feed composition. The NH3 emissions are calculated using NH3-N emission factors, expressed as percentage of TAN. These emission factors are derived from measurements of NH3 emissions from animal housing, relative to the TAN excretion. If no results from NH3 measurements are available, emission factors are deduced from measured emissions of other categories, using ratios of TAN excretion as a scale factor. Information on housing systems in agricultural practice is derived from the Agricultural Census, supplemented by provincial records on environmental permits. After manure has been stored in animal housing, some of it is treated. The amount of manure that is separated, dried, incinerated or digested is based on registered manure transports. Separate calculations are performed for NH3 emissions from manure storage outside animal housing. Because N emissions are calculated using the TAN-flow principle, the amount of TAN in storage is corrected for the total N losses in the housing system. Emissions of N in the form of NOx and N2O are also part of the TAN flow, and they originate from nitrification (or denitrification) processes occurring in manure during housing, manure treatment and in outside storage facilities. The NOx and N2O emissions are treated as equal in terms of N losses and based on the IPCC default emission factors for N2O. When applied in the TAN-flow model, these emissions are converted into a percentage of TAN.

12 | WOt-technical report 148
The NMVOC emissions from manure management depend primarily on feed composition, as most such emissions in animal housing result from the feeding of silage. In addition, NMVOC is emitted from manure in animal housing, as well as in outside manure storage. The NMVOC emissions from cattle manure in animal housing and outside storage are calculated based on feed intake. For other animal categories, emissions are calculated using the values for volatile solid excretion. Because NMVOC emissions from manure management are a key source, a Tier 2 method is applied. The emission factors are EMEP default emission factors. Emissions of particulate matter (PM10 and PM2.5) from manure management depend primarily on the housing systems. Emission factors are derived from measurements of PM. If no measurement results are available, emission factors are deduced from emission factors measured in other systems, taking ratios of TAN excretion as a scale factor or using defaults.
Crop production and agricultural soils As part of the TAN flow, available N in manure intended for application is calculated by subtracting N losses from animal housing, manure treatment and outside manure storage from the total N excreted by the animals. The N losses include NH3-N, N2O-N, NOx-N, plus dinitrogen-N (N2). The use of manure N outside agriculture and the net export of manure N are also taken into account. The N available for application to agricultural soils is divided over grassland and cropland (cropped and uncropped). This is done because of differences between the manure-application techniques used on grasslands and those used on arable land, with NH3 emission factors differing between application techniques. For NH3 from grazed grasslands, NH3 emission factors based on TAN excreted during grazing are used. The NH3 emissions from the application of inorganic N fertilizer, sewage sludge and compost, crop ripening and crop residues left on the field are calculated using country-specific emission factors based on literature and measurements for these sources. Emissions of NOx and N2O occur when N is applied to agricultural soils. For N2O, a distinction is made between surface spreading and low-ammonia emission application, as the incorporation of animal manure into the soil increases N2O emissions. The emission factors are country-specific (IPCC Tier 2), as are those for inorganic N fertilizer, sewage sludge, compost, pasture manure, crop residues and the cultivation of organic soils. Emissions of NOx are calculated using the EMEP default emission factor for N supply to soil. After the application of manure, NMVOC emissions occur, and a Tier 2 calculation method using the EMEP default emission factors is applied to calculate these emissions. Although no direct emission factors for NMVOC emissions are available for manure application, a correlation has been found between the volume of NH3 emissions and the volume of NMVOC emissions. it is therefore assumed that the ratio of NMVOC from application to NMVOC from animal housing is equal to the ratio of NH3 from application to NH3 from animal housing (EEA, 2016). To measure NMVOC emissions from manure on pasture, the storage of silage and the cultivation of crops, the EMEP default emission factors are used. Particulate matter (PM) is emitted during the storage, handling and transport of agricultural products, as well as during the cultivation of agricultural soils and crop harvesting. A Tier 2 approach is used for measuring PM10 and PM2.5 emissions from the tillage of crops. Fixed estimates are used for other sources of PM emissions (concentrates, inorganic fertilizers and pesticides).
Liming The application of lime to reduce soil acidity results in CO2 emissions, due to the decomposition of carbonate. Emissions of CO2 from lime are calculated from annual statistics and the IPCC default emission factors (Tier 1).
Overview of methods and emission factors used For the reporting of air pollutants within the Nomenclature For Reporting and Informative Inventory Report (NFR; IIR) format, the level of methods and emission factors used by NEMA are summarised in Table S.1.

Methodology for estimating emissions from agriculture in the Netherlands - Update 2019 | 13
Table S.1 Methods and emission factors (EF) used in the NEMA for air pollutants, by level as distinguished by the 2016 EMEP Guidebook (IIR)
NFR source categories NH3 NOx NMVOC PM10/PM2.5
Metho
d
EF Metho
d
EF Metho
d
EF Method EF
3. Agriculture
B. Manure management T3 CS T3 CS T2 D T2 CS
D. Agricultural soils T3 CS T3 D T1, T2 D T2 CS, D
F. Field burning of
agricultural residues
N/A N/A NO NO NO NO NO NO
I. Other NO NO NO NO NO NO NO NO
Method: T2 = EMEP Tier 2; T3 = EMEP Tier 3; NO = not occurring; N/A = not applicable.
EF: D = EMEP default; CS = country-specific; NO = not occurring; N/A = not applicable.
The methods and emission factors used are in full compliance with the requirements set by the 2016 EMEP Guidebook. For the reporting of greenhouse gases within the Common Reporting Format and the National Inventory Report (CRF; NIR), the level of methods and emission factors used by the NEMA are summarised in Table S.2. Table S.2 Methods and emission factors (EF) used in the NEMA for greenhouse gases, by level as distinguished by the IPCC 2006 Guidelines (used in the National Inventory Report; NIR and Common Reporting Format; CRF)
CRF source categories CO2 CH4 N2O
Method EF Method EF Method EF
3. Agriculture
A. Enteric fermentation N/A N/A T1, T2,
T3
CS, D N/A N/A
B. Manure management N/A N/A T1, T2 CS, D T2 D
C. Rice cultivation N/A N/A NO NO N/A N/A
D. Agricultural soils N/A N/A N/A N/A T1, T1b, T2 CS, D
E. Prescribed burning of savannahs N/A N/A NO NO NO NO
F. Field burning of agricultural residues N/A N/A NO NO NO NO
G. Liming T2 D N/A N/A N/A N/A
H. Urea application IE IE N/A N/A N/A N/A
I. Other carbon-containing fertilizers NO NO N/A N/A N/A N/A
J. Other N/A N/A NO NO NO NO
Method: T1 = IPCC Tier 1; T1a, T1b, T1c = IPCC Tier 1a, Tier 1b and Tier 1c, respectively; T2 = IPCC Tier 2; T3 = IPCC Tier 3;
NO = not occurring; N/A = not applicable.
EF: D = IPCC default; CS = country-specific; NO = not occurring; N/A = not applicable.
The methods and emission factors used are in full compliance with the requirements set by the 2006 IPCC Guidelines.

Methodology for estimating emissions from agriculture in the Netherlands - Update 2019 | 15
Samenvatting
Om emissies naar de lucht uit landbouwkundige activiteiten in Nederland te schatten, wordt het National Emission Model for Agriculture (NEMA) gebruikt. De berekeningen omvatten emissies van ammoniak (NH3), stikstofoxiden (NOx), lachgas (N2O), niet-methaan vluchtige organische stoffen (NMVOS), methaan (CH4), fijnstof (PM10, PM2,5) en koolstofdioxide (CO2). Deze emissies zijn afkomstig van diverse processen in de landbouwproductieketen, gegroepeerd in de hoofdcategorieën enterische fermentatie (CH4), mestmanagement (CH4, NH3, NOx, N2O en NMVOS), gewasproductie en landbouwbodems (NH3, NOx, N2O en NMVOC), en bekalking (CO2).
Enterische fermentatie Tijdens de vertering van voer vinden pens- en darmfermentatieprocessen plaats, enterische fermentatie. Voornamelijk door herkauwers worden aanzienlijke hoeveelheden CH4 gevormd. Daarom wordt in lijn met de key source (belangrijkste bronnen) analyse, een landspecifieke (IPCC Tier 3) methode toegepast voor melkkoeien waarin de enterische fermentatieprocessen gemodelleerd worden. Voor de andere rundveecategorieën worden emissies jaarlijks berekend op basis van de rantsoenen volgens een IPCC Tier 2-benadering. De emissies van kleine herkauwers en darmfermentatie door eenmagige dieren worden berekend met IPCC 2006 default emissiefactoren in kg CH4 per dier (Tier 1).
Mestmanagement Deze categorie omvat emissies van mest opgeslagen in de stal, mest be- of verwerking en/of mest-opslag in buitenopslagfaciliteiten. Uit de fermentatie van organische stof in opgeslagen of be- of verwerkte mest van landbouw-huisdieren komen emissies van CH4 voort. De omvang van de emissie hangt af van de chemische samenstelling van de mest en omgevingsfactoren zoals temperatuur en de beschikbaarheid van zuurstof. Rundvee, varkens en pluimvee worden beschouwd als key source, en worden daarom geschat met een IPCC Tier 2-benadering. De excretie van organische stof wordt berekend uit de gevoerde rantsoenen. De organische stof vermenigvuldigd met het biochemisch methaanpotentieel (Bo) en methaanconversiefactor (MCF) geeft de CH4-emissies. Er wordt onderscheid gemaakt tussen drijf- en vaste mest, en mestexcretie tijdens beweiden. Emissies van andere diercategorieën worden berekend met IPCC 2006 default (Tier 1) emissiefactoren in kg CH4 per dier. NH3 wordt gevormd uit de stikstof (N) in de urine en gemineraliseerde organische N in de faeces, waarvan de som Totaal Ammoniakaal N (TAN) genoemd wordt. Na de bacteriologische conversie van urine en organische N naar ammonium kan gasvormig NH3 naar de lucht emitteren, afhankelijk van fysische en chemische condities. TAN in de mest wordt afgeleid uit de voedersamenstelling op jaarlijkse basis. De NH3-emissie wordt berekend met NH3-N emissiefactoren uitgedrukt als percentage van TAN. Deze emissiefactoren zijn afkomstig van metingen aan NH3-emissies uit stallen, gerelateerd aan de TAN-excretie. Als er geen meetresultaten beschikbaar zijn, dan worden de emissiefactoren afgeleid van bestaande emissiefactoren van andere stalsystemen gebruikmakend van de verhouding in TAN-excretie als schaalfactor. Informatie over stalsystemen in de landbouwpraktijk is afgeleid uit de Landbouwtelling, waar nodig verfijnd met provinciale gegevens over omgevingsvergunningen. Na mestopslag in de stal kan een deel van de mest worden be- of verwerkt. De hoeveelheden mest die wordt gescheiden, gedroogd, verbrand of vergist is gebaseerd op Vervoersbewijzen dierlijke mest-stoffen (VDMs). NH3-emissies uit mestopslagen buiten de stal worden apart berekend. Omdat N-emissies worden berekend volgens het TAN-stroomprincipe, wordt de hoeveelheid TAN in buitenopslag gecorrigeerd voor alle N-verliezen in de stal.

16 | WOt-technical report 148
Emissies van N in de vorm van NOx en N2O zijn ook deel van de TAN-stroom en ontstaan door (de-) nitrificatie in de mest gedurende opslag in de stal en buitenopslagen en mest be- of verwerking. De NOx en N2O worden verondersteld van gelijke omvang te zijn in termen van N-verlies, en zijn gebaseerd op de IPCC default emissiefactoren voor N2O. Deze emissies worden geconverteerd in percentage van TAN voor gebruik in het TAN-stroommodel. De NMVOS-emissies vanuit mestmanagement zijn voor een groot deel afhankelijk van het voer, omdat de meeste emissies uit het gevoerde kuilvoer komen. Daarnaast komen er nog NMVOS-emissies uit de stal en de opslag buiten de stal. De NMVOS-emissies voor melkvee worden berekend aan de hand van voeropnamen, terwijl voor de andere diercategoerieën deze met de hulp van organische-stofexcretie worden berekend. Aangezien de NMVOS-emissies uit mest een key source zijn worden deze emissies met een Tier 2 berekening berekend. De gebruikte emissiefactoren zijn de EMEP 2016 default emissie-factoren. Fijnstof (PM10 en PM2,5)-emissies van mestmanagement hangen voornamelijk af van het stalsysteem. Emissiefactoren zijn afgeleid van metingen aan PM. Indien niet gemeten, zijn emissiefactoren afgeleid van bestaande emissiefactoren van andere stalsystemen, gebruikmakend van ratio’s van de TAN-excretie als schaalfactor, of zijn default emissiefactoren gebruikt.
Gewasproductie en landbouwbodems Beschikbare N in mest voor aanwending wordt berekend door de N verliezen in de stal en buiten-opslagen af te trekken van de totale N excretie van de dieren. De totale N-verliezen omvatten NH3-N, N2O-N, NOx-N en distikstof-N (N2). Daarnaast wordt gecorrigeerd voor het gebruik van mest N buiten de landbouw en de (netto) export van mest N. De N die als mest wordt toegediend aan landbouw-gronden wordt dan verdeeld over gras- en bouwland (beteeld en onbeteeld), met een onderscheid in mestaanwendingstechnieken met specifieke NH3-emissiefactoren. Er wordt gebruik gemaakt van NH3-emissiefactoren gebaseerd op TAN-excretie tijdens beweiding voor NH3-emissies van beweiding. De NH3-emissies door aanwending van minerale N meststoffen, zuiveringsslib en compost, gewasafrijping en gewasresten die zijn achtergebleven op het veld worden berekend met landspecifieke emissie-factoren. Na toediening van N aan landbouwgronden emitteert er NOx en N2O. Voor N2O wordt onderscheid gemaakt tussen bovengrondse en emissiearme aanwending, omdat inwerken van dierlijke mest leidt tot een verhoogde N2O-emissie. De emissiefactoren zijn landspecifiek (Tier 2), net als die voor minerale N-meststoffen, zuiveringsslib, compost, weidemest, gewasresten en het landbouwkundig gebruik van organische bodems. Emissies van NOx worden berekend op basis van de EMEP default emissiefactor voor N-toevoer naar de bodem. Bij het toedienen van mest emitteert ook NMVOS. Op het moment zijn er nog geen emissiefactoren voor deze emissies. Er is er wel een correlatie gevonden tussen de NH3- en NMVOS-emissies (EMEP Guidebook). De verhouding NMVOS uit mesttoediening tot NMVOS uit stal wordt gelijk gesteld aan de verhouding NH3 uit mesttoediening tot NH3 uit stal (EEA, 2016). Voor de NMVOS-emissies van weidegang, opslag van kuilvoer en de teelt van landbouwgewassen worden de EMEP 2016 default emissiefactoren gebruikt. Al deze bronnen worden geschat met een Tier 2-benadering, behalve de NMVOS emissies van de teelt van landbouwgewassen, deze wordt met een Tier 1-methode berekend. Tijdens de opslag, verwerking en transport van agrarische producten, het gebruik van landbouw-bodems en oogsten vinden emissies van fijnstof (PM) plaats. Een Tier 2-benadering wordt gebruikt voor PM10- en PM2,5- emissies door het verbouwen van gewassen. Voor andere bronnen van PM-emissies (krachtvoer, anorganische meststoffen en pesticidegebruik) hebben vaste schattingen.
Bekalking Aanwending van kalk om de zuurtegraad van de bodem te verhogen, resulteert in CO2-emissies vanwege de afbraak van carbonaat. Emissies van CO2 door bekalking worden berekend aan de hand van jaarlijkse statistieken voor het gebruik van meststoffen en de IPCC default emissiefactoren (Tier 1).

Methodology for estimating emissions from agriculture in the Netherlands - Update 2019 | 17
Overzicht van gebruikte methoden en emissiefactoren Om luchtvervuilende stoffen in de Nomenclature For Reporting en Informative Inventory Report (NFR, IIR) indeling te rapporteren, wordt het niveau van methoden en emissiefactoren gebruikt in NEMA samengevat in Tabel S.1. Tabel S.1 Methoden en emissiefactoren (EF) gebruikt in NEMA voor luchtvervuilende stoffen, naar niveau zoals onderscheiden in het 2016 EMEP Guidebook (IIR)
NFR broncategorie NH3 NOx NMVOC PM10/PM2,5
Methode EF Methode EF Method EF Methode EF
3. Landbouw
B. Mestmanagement T3 CS T3 CS T2 D T2 CS
D. Landbouwbodems T3 CS T3 D T1, T2 D T2 CS,
D F. Verbranden gewasresten
op het veld N/A N/A NO NO NO NO NO NO
I. Overig NO NO NO NO NO NO NO NO
Methode: T2 = EMEP Tier 2; T3 = EMEP Tier 3; NO = not occurring (komt niet voor); N/A = not applicable (niet van toepassing).
EF: D = EMEP default; CS = country-specific (landspecifiek); NO = not occurring (komt niet voor); N/A = not applicable (niet van toepassing).
De gebruikte methoden en emissiefactoren zijn volledig in lijn met de vereisten uit het 2016 EMEP Guidebook. Om broeikasgassen in het Common Reporting Format en National Inventory Report (CRF, NIR) te rapporteren, wordt het niveau van methoden en emissiefactoren gebruikt in NEMA samengevat in Tabel S.2. Tabel S.2 Methoden en emissiefactoren (EF) gebruikt in NEMA voor broeikasgassen, naar niveau zoals onderscheiden in de IPCC 2006 Guidelines (NIR)
CRF broncategorie CO2 CH4 N2O
Methode EF Methode EF Methode EF
3. Landbouw
A. Enterische fermentatie N/A N/A T1, T2, T3 CS, D N/A N/A
B. Mestmanagement N/A N/A T1, T2 CS, D T2 D
C. Rijstbouw N/A N/A NO NO N/A N/A
D. Landbouwbodems N/A N/A N/A N/A T1, T1b, T2 CS, D
E. Voorgeschreven verbranding van
savannes
N/A N/A NO NO NO NO
F. Verbranden gewasresten op het veld N/A N/A NO NO NO NO
G. Bekalking T2 D N/A N/A N/A N/A
H. Ureum-aanwending IE IE N/A N/A N/A N/A
I. Overige koolstof bevattende meststoffen NO NO N/A N/A N/A N/A
J. Overig N/A N/A NO NO NO NO
Methode: T1 = IPCC Tier 1; T1a, T1b, T1c = respectievelijk IPCC Tier 1a, Tier 1b en Tier 1c; T2 = IPCC Tier 2; T3 = IPCC Tier 3;
NO = not occurring (komt niet voor); N/A = not applicable (niet van toepassing).
EF: D = IPCC default; CS = country-specific (landspecifiek); NO = not occurring (komt niet voor); N/A = not applicable (niet van toepassing).
De gebruikte methoden en emissiefactoren zijn volledig in lijn met de vereisten uit de 2006 IPCC Guidelines.


Methodology for estimating emissions from agriculture in the Netherlands - Update 2019 | 19
1 Introduction
In 2017, the agricultural sector was responsible for more than 85% of all ammonia (NH3) emissions in the Netherlands. Agriculture is also a significant contributor to the emission of nitrogen oxides (NOx). The deposition of NH3 and NOx can have adverse effects in the form of eutrophication and acidification. Both NOx and non-methane volatile organic compounds (NMVOC) have an effect on the formation of ozone, which can, in turn, have a negative effect on human health and plant growth. Agricultural activities constitute a considerable source of particulate matter emissions as well, especially in the coarse fraction of up to 10 µm in size (PM10). Particulate matter, both 10 µm and 2.5 µm (PM2.5) can have detrimental health effects, and it constitutes an uncertain factor in climate change. With regard to the greenhouse gases methane (CH4) and nitrous oxide (N2O), agriculture is the largest contributor to total national emissions. Combined and expressed as carbon dioxide equivalents (CO2-eq.), they amount to about 10% of all Dutch greenhouse gas emissions. Stationary combustion (mainly from heating in horticulture) and the use of mobile equipment are not allocated to agriculture, as they are included in the energy sector. The only CO2 emissions reported in the agricultural sector originate from calcareous fertilizers (liming). Air-polluting emissions and greenhouse gas emissions are subject to differing reporting requirements, which are explained further in the following sections.
Reporting requirements and institutional arrangements Under the Kyoto Protocol, the Netherlands is required to set up and maintain a national system for monitoring its greenhouse-gas emissions. One element of this system is a transparent and verifiable description of the methods and processes used within this monitoring system. These methods must meet international guideline criteria, which are defined by the United Nations (UN) and the European Union (EU), as described in the 2006 IPCC Guidelines. The Netherlands also reports emissions of other air pollutants. These reports are used to assess whether the Netherlands meets the National Emission Ceilings (NEC) and, as a party to the Convention on Long Range Transboundary Air Pollution (CLRTAP), the Gothenburg Protocol. In this case as well, the methods must meet the criteria of international guidelines, as defined by the European Monitoring and Evaluation Programme (EMEP) of the European Environment Agency (EEA), and described in the EMEP Guidebook 2016. The Pollutant Release and Transfer Register (PRTR; in Dutch, the Emissieregistratie’ [ER]) collects and formally establishes annual emissions of pollutants to air, water and soil. The PRTR is a collaborative group that includes the following and other entities: Statistics Netherlands (CBS), Wageningen University & Research, the National Institute for Public Health and the Environment (RIVM) and PBL Netherlands Environmental Assessment Agency. It is coordinated by RIVM, under the supervision of the Netherlands Enterprise Agency (RVO), which acts as the National Inventory Entity (NIE) for greenhouse gas reporting. The PRTR is commissioned by the Ministry of Economic Affairs and Climate Policy (EZK) and the Ministry of Infrastructure and Water Management (I&W). Within the PRTR, several teams work on specific sectors defined by the guideline criteria, including the task force on Agriculture and Land Use. Emissions from land use, land use change and forestry (LULUCF) are reported according to an unrelated calculation method. They are therefore not discussed here, but they are available in Arets et al. (2019). This report concerns emissions to air originating from agricultural activities, based on the National Emission Model for Agriculture (NEMA) of the independent Dutch Scientific Committee for the Manure Act (CDM). The current report provides an overview of the methods applied in NEMA to estimate emissions of CH4, NH3, N2O, NOx, NMVOC, PM10, PM2.5 and CO2 from the agricultural sector. The only methodological change in the calculation method from the previous methodology report is the addition of a method for calculating manure treatment.
20 | WOt-technical report 148
Emissions data are available through the website www.prtr.nl, as well as in annual reports on greenhouse-gas emissions (National Inventory Report, NIR) and other pollutants (Informative Inventory Report, IIR). Data from the PRTR are also used for the evaluation of national environmental policy and in many other environmental reports. For this reason, annual reports are also published in Dutch with updated NEMA results.
Outline of the report Following this introductory section covering general aspects of emission and uncertainty calculations, subsequent sections describe the scope, definition, calculation method, emission factors, activity data, uncertainty and quality applying to each combination of compound and source category distinguished. The categorisation of the 2006 Intergovernmental Panel on Climate Change (IPCC) Guidelines and the EMEP Guidebook 2016 has been followed in this regard (IPCC, 2006; EEA, 2016). The Common Reporting Format (CRF, to accompany the NIR) and the Nomenclature For Reporting (NFR, accompanying the IIR) are used for reporting purposes. Emissions from agriculture occur in the following sectors: Enteric fermentation (3A), Manure management (3B), Agricultural soils (3D) and Liming (3G). Because of climatological conditions, activities relating to Sectors 3C (Rice cultivation) and 3E (Prescribed burning of savannahs) do not occur in the Netherlands). In addition, no emissions are produced from Sector 3F (Field burning of agricultural residues), as these activities were prohibited by law for the entire time series (Article 10.2 of the Environmental Management Act (in Dutch, Wet Milieubeheer). An overview of processes and emissions is presented in Figure 1.1, indicating the sections in which they are discussed in detail. The sections are arranged consecutively, starting at the animal level and proceeding to manure management (animal housing and outside manure storage), agricultural soils and liming, thereby providing a full overview of emission calculations. Repetition of information was kept to a minimum. Some repetition was inevitable, however, given that the sections are also intended to be read independently. Readers who are interested in specific compounds should therefore be able to skip the other sections.

Methodology for estimating emissions from agriculture in the Netherlands - Update 2019 | 21
Figure 1.1 Processes and emissions in agriculture, with allocations to CRF and NFR reporting categories


Methodology for estimating emissions from agriculture in the Netherlands - Update 2019 | 23
2 General aspects
2.1 Data collection
Several institutes work together to collect all of the data necessary to be able to calculate the volume of emissions from agricultural activities in the Netherlands (Figure 2.1): Statistics Netherlands (CBS), the National Institute for Public Health and the Environment (RIVM), the Netherlands Enterprise Agency (RVO) and Wageningen University & Research (Wageningen Economic Research, Wageningen Environmental Research and Wageningen Plant Research).
2.2 Activity data
In the Netherlands, livestock numbers, N-excretion rates and manure-management types are used in the calculation of many different emissions for the purpose of calculating emissions from agricultural activities. The origin and calculation of livestock numbers and N excretions are described here, in order to minimise repetition in following sub-section.
Figure 2.1 Institutes collaborating to gather the data necessary for calculating emissions

24 | WOt-technical report 148
2.2.1 Livestock numbers
Activity data on livestock numbers originate from the annual Agricultural Census. Until 2016, the census included all agricultural businesses larger than three ‘size units’ (in Dutch, grootte-eenheden; until 2009) or 3,000 Standard Outputs in Euros (from 2010 onwards). Beginning in 2016, the Agricultural Census has included all agricultural businesses registered with agricultural activity codes in the Commercial Register of the Dutch Chamber of Commerce. Additional details on population statistics are available from CBS (www.cbs.nl) and Van Bruggen et al. (2015). The livestock categories are presented in Figure 2.2, as included in the Agricultural Census.
The Agricultural census distinguishes a considerable number of livestock categories and sub-categories (Figure 2.2). This categorisation is also used in the NEMA calculations, with the results grouped into reporting categories, as indicated as the Average Animal Population (AAP) in the IIR/NFR and the NIR/CRF. The Agricultural Census states the number of animals as of 1 April. This number is assumed to be representative of the number of animals throughout the year, except in cases of outbreaks of animal diseases or other events that could cause fluctuations in the number of animals. In such cases, Statistics Netherlands/Working Group on Uniformity of Calculations for Manure and Mineral Data (WUM) modifies the number of animals, and the modified numbers are used in the emission calculations. The number of privately-owned horses and ponies is not registered in the Agricultural Census. The former Product Boards for Livestock, Meat and Eggs estimated the number of privately owned horses and ponies at 300,000 (PVE, 2005). Although emissions related to these animals are calculated within NEMA, strictly speaking, they do not belong to the agricultural sector. The resulting emissions of NH3, NOx, PM10 and PM2.5 are therefore attributed to NFR Category 6 (Other). Given that the Netherlands has opted not to report greenhouse gas emissions under the CRF Category (Other), CH4 and N2O emissions have been included within Sector 3 (Agriculture).
Figure 2.2 Livestock categories in the Agricultural Census

Methodology for estimating emissions from agriculture in the Netherlands - Update 2019 | 25
2.2.2 N excretions
The N excretions in animal houses (taking into account excretions on pasture land during grazing) are calculated using the annually updated data of the WUM. The calculation methodology assumes a certain nutrient balance per animal, for which the nutrient excretion is calculated from the difference between nutrient uptake from feed and nutrient fixation in animal products (CBS, 2012a). These data have been published by CBS (2012a) for the 1990-2008 time series and, for consecutive years, in the Livestock Manure and Minerals publication series (CBS, 2008 through 2018), which is available at the CBS website (www.cbs.nl). The starting points for calculating N emissions are the N excretion figures derived by the WUM. For emission calculations, the age category ≥ 1 year for cattle is divided into the age categories of 1-2 and > 2 years, with the same N excretions per animal. For the calculation of uncertainty values, they are not assessed separately, but combined. The manure production and nutrient excretion of piglets is included in the sow’s figures, and a similar process is used for sheep, goats, rabbits and fur-bearing animals, for which the manure production and nutrient excretion of their young stock are also included in the figures for the mother animal (CBS, 2012a).
2.2.3 Manure management
Animal manure can be either slurry or solid, depending on the livestock category and housing system (e.g. the use of straw). It is called slurry (or liquid manure) if it flows under gravity and is pumpable, while solid manure is stackable and can be packed in heaps (RAMIRAN, 2011). Slurry is anaerobic, solid manure that is not packed or compressed, and that is more aerated. • Cattle manure in the Netherlands is most commonly stored as slurry, although it can also be solid,
possibly with a share of urine and faeces excreted during grazing. In general, female young stock, dairy and suckling cows are kept on pasture land during the summer months. All dairy cows spend part of the day inside animal housing, depending on the grazing system applied, particularly at night and during milking times. Over the years, an increasing proportion of the animals are kept inside animal house at all times. This implies that all of the manure is produced in animal housing, including during the summer months.
• Pig manure in the Netherlands is predominantly slurry. All pigs are kept indoors year-round. A minor proportion of pig manure is solid, produced when bedding material is used (e.g. straw).
• Poultry includes laying hens, broilers, ducks and turkeys. Because of the high dry matter content of poultry excreta and the housing systems used, all poultry manure is currently considered solid. Battery cage systems with slurry were used in the earlier years of the time series. In recent years, poultry systems with free ranging have become more prevalent.
• Goats in the Netherlands are kept inside animal housing throughout the year and produce solid manure.
• Sheep are grazing animals kept outside except during the lambing season. During this housing period, they produce solid manure.
• Horses, mules and asses produce manure in animal housing and during grazing. Solid manure is produced in the period inside animal housing.
• Rabbits are kept indoors year-round and produce solid manure. • Fur-bearing animals (minks and foxes) are kept indoors year-round and produce liquid manure.
2.3 Emission calculations
In the Netherlands, agriculture is a major source of NH3, NOx, N2O, NMVOC, CH4, PM10 and PM2.5 emissions. Both NH3 and NOx contribute to the eutrophication and acidification of soils, while N2O and CH4 are greenhouse gases, and N2O and NMVOC damages the ozone layer. Particulate matter affects human health, and N emissions reduce the efficiency of nitrogen use in agriculture. Commissioned by the Ministry of Economic Affairs and Climate Policy, the NEMA working group of the CDM developed a method to calculate NH3 emissions in 2009 (Velthof et al., 2009). The method includes emissions from animal housing, manure treatment and manure storage for livestock
26 | WOt-technical report 148
categories in the Dutch Agricultural Census, as well as from livestock grazing in pastures and applications of animal manure and fertilizers to the soil. At the request of the PRTR, modules for the calculation of NOx, N2O, CH4, PM10 and PM2.5 have been included in the model since the emission calculations of 2012 (Van Bruggen et al., 2014). The name of the model was therefore changed from the National Emission Model for Ammonia to the National Emission Model for Agriculture (NEMA). With the implementation of the 2006 IPCC Guidelines in 2013, a module for the calculation of CO2 from calcareous fertilizers (liming) was added as well. The 2016 update to the EEA Guidebook led to the addition of NMVOC emission calculations in 2018. The results are used in reports to the EU and to assess whether the Netherlands is in compliance with the NEC directive and the UNECE (Gothenburg Protocol). The results are also reported to the UNFCCC within the context of the Kyoto Protocol.
Reporting at higher levels The NEMA model calculates emissions using more sub-categories than are reported internationally. In addition, there can be more emission factors than are actually reported. These sub-categories are aggregated for purposes of reporting activity data and emissions. The resulting average emission factors are calculated by dividing emissions by the activity data. This calculated emission factor is referred to as the ‘implied emission factor’.
2.4 Uncertainty calculations
2.4.1 General
Models are not an exact representation of reality, and their estimates are therefore uncertain to some extent. In activity data, the availability and representativeness of data constitute the main source of uncertainty. When applying emission factors, uncertainties emerge from possible measurement errors, statistical random-sampling errors or missing data. Other causes of uncertainty include lack of completeness due to unrecognized emission sources or lack of measurement methods. These aspects are not taken into account in the current uncertainty analysis. For more details on causes of uncertainty, see Chapter 3 of the 2006 IPCC Guidelines (IPCC, 2006). According to the guidance documents, uncertainty estimates are essential to a complete emission inventory. The Netherlands is obliged to estimate uncertainties for the national level and for trends in emissions, as well as for separate components: activity data, emission factors and other parameters used in estimating emissions. Uncertainty estimates for separate components and for the calculation methods should be used to prioritise efforts to make further improvements to the calculation of emissions. Additional attention should be paid to emissions sources listed in NEMA that have relatively high uncertainty and that are responsible for relatively large emissions. An Approach 1 uncertainty analysis is implemented each year before the NIR is submitted by the PRTR, based on the greenhouse gas inventory and in compliance with IPCC Guidelines. The assumptions used and their results are described in an annex to the NIR. Where included in the QA/QC programme for the relevant period, additional analyses are implemented regularly in specific situations, which include any updating of the Approach 2 uncertainty analyses. Based on the 2019 inventory (1990-2017 time series), new uncertainty estimates were calculated using the propagation-of-error approach for the most recent reference year (2015). Uncertainty values were estimated based on literature and expert judgements. Previous estimates were reconsidered and revised as needed, based on new insights or changed methods. The previous full Approach 2 uncertainty assessment was conducted in 2009 (Olivier et al., 2009), with partial updates in Vonk et al. (2016) and Vonk et al. (2018). This assessment demonstrated that Approach 1 uncertainty assessments are sufficiently reliable and that Approach 2 uncertainty assessments need only be implemented at periodic intervals of around five years, unless a major change in an important source is sufficient to require a reassessment. Data from this uncertainty analysis were also used as input for the Monte Carlo analysis of uncertainties conducted on the 2019 inventory of emissions in the Netherlands.
Methodology for estimating emissions from agriculture in the Netherlands - Update 2019 | 27
A detailed overview of quality assurance and quality control is provided in Annex 11, which also contains outlines for the verification of data. Methods for estimating emissions are periodically improved in response to the availability of new data or new scientific insights. This should be reflected in any new estimate of uncertainty for the relevant emission sources. An updated method does not automatically mean a reduction in uncertainty, as it is also possible that uncertainty was underestimated in the past.
2.4.2 Calculation method
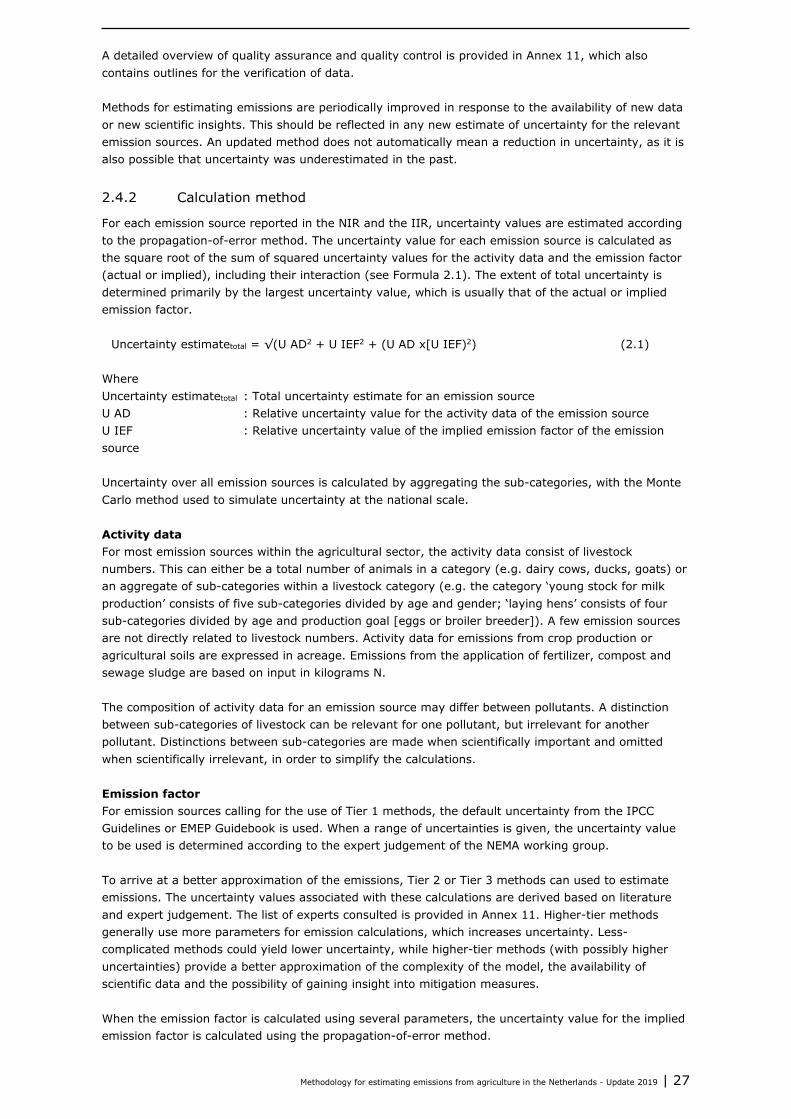
For each emission source reported in the NIR and the IIR, uncertainty values are estimated according to the propagation-of-error method. The uncertainty value for each emission source is calculated as the square root of the sum of squared uncertainty values for the activity data and the emission factor (actual or implied), including their interaction (see Formula 2.1). The extent of total uncertainty is determined primarily by the largest uncertainty value, which is usually that of the actual or implied emission factor.
Uncertainty estimatetotal = √(U AD2 + U IEF2 + (U AD x[U IEF)2) (2.1) Where Uncertainty estimatetotal : Total uncertainty estimate for an emission source U AD : Relative uncertainty value for the activity data of the emission source U IEF : Relative uncertainty value of the implied emission factor of the emission source Uncertainty over all emission sources is calculated by aggregating the sub-categories, with the Monte Carlo method used to simulate uncertainty at the national scale.
Activity data For most emission sources within the agricultural sector, the activity data consist of livestock numbers. This can either be a total number of animals in a category (e.g. dairy cows, ducks, goats) or an aggregate of sub-categories within a livestock category (e.g. the category ‘young stock for milk production’ consists of five sub-categories divided by age and gender; ‘laying hens’ consists of four sub-categories divided by age and production goal [eggs or broiler breeder]). A few emission sources are not directly related to livestock numbers. Activity data for emissions from crop production or agricultural soils are expressed in acreage. Emissions from the application of fertilizer, compost and sewage sludge are based on input in kilograms N. The composition of activity data for an emission source may differ between pollutants. A distinction between sub-categories of livestock can be relevant for one pollutant, but irrelevant for another pollutant. Distinctions between sub-categories are made when scientifically important and omitted when scientifically irrelevant, in order to simplify the calculations.
Emission factor For emission sources calling for the use of Tier 1 methods, the default uncertainty from the IPCC Guidelines or EMEP Guidebook is used. When a range of uncertainties is given, the uncertainty value to be used is determined according to the expert judgement of the NEMA working group. To arrive at a better approximation of the emissions, Tier 2 or Tier 3 methods can used to estimate emissions. The uncertainty values associated with these calculations are derived based on literature and expert judgement. The list of experts consulted is provided in Annex 11. Higher-tier methods generally use more parameters for emission calculations, which increases uncertainty. Less-complicated methods could yield lower uncertainty, while higher-tier methods (with possibly higher uncertainties) provide a better approximation of the complexity of the model, the availability of scientific data and the possibility of gaining insight into mitigation measures. When the emission factor is calculated using several parameters, the uncertainty value for the implied emission factor is calculated using the propagation-of-error method.
28 | WOt-technical report 148
Levels of calculation and reporting Emission calculations are performed using livestock categories that are more detailed than those used in the reporting of emissions. For this reason, uncertainty values have been aggregated using the propagation-of-error method. With independent categories, the aggregation of uncertainty values leads to lower combined uncertainty. The propagation-of-error method can be used to calculate uncertainty values with dependencies, although simplified formulas are available only for fully dependent or independent uncertainties. Dependencies between 0% and 100% can be aggregated during the calculation of overall uncertainty. This method is used to reduce the likelihood of underestimating uncertainty values.
2.4.3 Uncertainty calculations
Uncertainty of livestock numbers Because aggregated categories are reported, uncertainty values must be aggregated using the following formula:
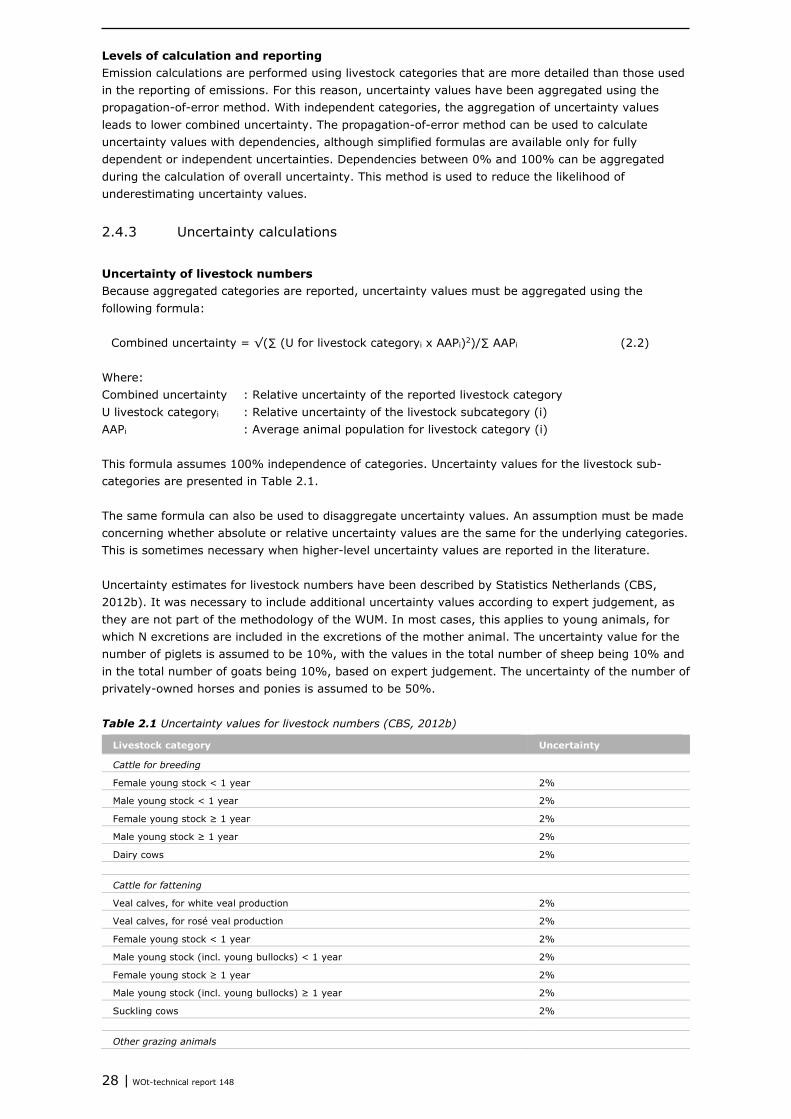
Combined uncertainty = √(∑ (U for livestock categoryi x AAPi)2)/∑ AAPi (2.2) Where: Combined uncertainty : Relative uncertainty of the reported livestock category U livestock categoryi : Relative uncertainty of the livestock subcategory (i) AAPi : Average animal population for livestock category (i) This formula assumes 100% independence of categories. Uncertainty values for the livestock sub-categories are presented in Table 2.1. The same formula can also be used to disaggregate uncertainty values. An assumption must be made concerning whether absolute or relative uncertainty values are the same for the underlying categories. This is sometimes necessary when higher-level uncertainty values are reported in the literature. Uncertainty estimates for livestock numbers have been described by Statistics Netherlands (CBS, 2012b). It was necessary to include additional uncertainty values according to expert judgement, as they are not part of the methodology of the WUM. In most cases, this applies to young animals, for which N excretions are included in the excretions of the mother animal. The uncertainty value for the number of piglets is assumed to be 10%, with the values in the total number of sheep being 10% and in the total number of goats being 10%, based on expert judgement. The uncertainty of the number of privately-owned horses and ponies is assumed to be 50%. Table 2.1 Uncertainty values for livestock numbers (CBS, 2012b)
Livestock category Uncertainty
Cattle for breeding
Female young stock < 1 year 2%
Male young stock < 1 year 2%
Female young stock ≥ 1 year 2%
Male young stock ≥ 1 year 2%
Dairy cows 2%
Cattle for fattening
Veal calves, for white veal production 2%
Veal calves, for rosé veal production 2%
Female young stock < 1 year 2%
Male young stock (incl. young bullocks) < 1 year 2%
Female young stock ≥ 1 year 2%
Male young stock (incl. young bullocks) ≥ 1 year 2%
Suckling cows 2%
Other grazing animals

Methodology for estimating emissions from agriculture in the Netherlands - Update 2019 | 29
Livestock category Uncertainty
Sheep (ewes) 5%
Sheep (all) 10%1)
Dairy goats (≥ 1 year) 5%
Goats (all) 10%1)
Horses (agriculture) 5%
Ponies (agriculture) 5%
Mules and asses 5%1)
Horses and ponies (not agriculture) 50%1)
Pigs
Piglets 10%2)
Fattening pigs 10%
Sows 5%
Breeding pigs 5%
Boars 5%
Poultry
Broiler breeders < 18 weeks 10%
Broiler breeders ≥ 18 weeks 5%
Laying hens < 18 weeks 10%
Laying hens ≥ 18 weeks 5%
Broilers 10%
Ducks 10%
Turkeys 10%
Other animals
Rabbits (does) 5%
Other rabbits 10%1)
Mink 5% 1) Expert judgement. 2) Expert judgement: the 10% uncertainty value for piglets was estimated according to the following calculation. In 2012, there were 2.37 litters
per sow (Agrovision). The number of full-grown piglets was 27.8 per sow. Assuming that piglets die primarily in the beginning, there would be
11.7 (27.8/2.37) piglets per litter. After 78 days, piglets become fatteners, while the next litter comes after 154 days (365/2.37). The average
number of piglets per sow during a year is thus 78/154x11.7 = 5.93. With 938,000 sows in 2012, there were 5.93x938,000 = 5.6 million
piglets. The Agricultural Census counted 5.2 million piglets.
Uncertainty of N excretions The uncertainty values for N excretions have been estimated previously (CBS, 2012b) and are summarised in Table 2.2 below. Although WUM reports the division of excretions over the housing and grazing periods, an uncertainty value is reported only for total excretions. In order to perform a propagation-of-error analysis on both animal housing and grazing emissions, uncertainty values were calculated for the shares:
U animal housingi = √((N excretioni x U N excretioni)2/(2 x N excretioni, animal housing2)) (2.3a) U pasturei = √((N excretioni x U N excretioni)2/(2 x N excretioni, pasture2)) (2.3b)
Where: U animal housingi : Relative uncertainty of N excretions in animal housing for livestock category
(i) U pasturei : Relative uncertainty of N excretions on pasture for livestock category (i) N excretioni : Total N excretions for livestock category (i) U N excretioni : Relative uncertainty of total N excretions for livestock category (i) N excretioni animal housing : N excretions in animal housing for livestock category (i) N excretioni pasture : N excretion on pasture for livestock category (i)

30 | WOt-technical report 148
The model assumes that only female cattle graze along with sheep, horses, ponies, mules and asses. Male cattle and dairy goats are generally kept indoors in the Netherlands, as are pigs and poultry (although some free-ranging of poultry does occur, it is accounted for in the emission factor for animal housing). Table 2.2 Uncertainty values (U, %) for total N excretion (CBS, 2012b) and N excretions in animal housing and on pasture
Livestock category U total N
excretion
per head
U animal house
N excretion per
head
U pasture N
excretion per
head
Cattle for breeding
Female young stock < 1 year 4.9% 4.0% 24.5%
Male young stock < 1 year 5.5% - -
Female young stock ≥ 1 year 4.1% 4.0% 10.3%
Male young stock ≥ 1 year 5.3% - -
Dairy cows 5.8% 4.7% 31.3%
Cattle for fattening
Veal calves, for white veal production 14.8% - -
Veal calves, for rosé veal production 9.5% - -
Female young stock < 1 year 4.9% 4.0% 25.1%
Male young stock < 1 year (incl. young bullocks) 11.3% - -
Female young stock ≥ 1 year 4.1% 4.1% 10.2%
Male young stock ≥ 1 year (incl. young bullocks) 8.9% - -
Suckling cows 5.3% 7.7% 7.3%
Other grazing animals
Sheep (ewes, including young animals and males) 6.0% 42.4% 4.7%
Dairy goats ≥ 1 year (including young animals and
males)
14.5% - -
Horses (agriculture) 21.4% 29.2% 31.4%
Ponies (agriculture) 21.4% 36.8% 25.7%
Mules and asses1) 21.4% 36.8% 25.7%
Horses and Ponies (not agriculture) 21.4% 36.8% 25.7%
Pigs
Fattening pigs 9.9%
Sows (including piglets) 11.4%
Breeding pigs 9.8%
Boars 7.9%
Poultry
Broiler breeders < 18 weeks 10.7%
Broiler breeders ≥ 18 weeks 6.8%
Laying hens <18 weeks 10.8%
Laying hens ≥ 18 weeks 8.3%
Broilers 21.6%
Ducks 14.6%
Turkeys 13.1%
Other animals
Rabbits (does, including young animals and males) 9.4%
Mink (females, including young animals and males) 11.8% 1) Mules and asses are not part of the calculations performed by WUM, and they have been set equal to ponies.

Methodology for estimating emissions from agriculture in the Netherlands - Update 2019 | 31
Uncertainty of manure-management systems The uncertainty value for the division between the solid and slurry fractions (summarised in Table 2.3) is estimated by experts at 10% for the smallest fraction. The uncertainty value for the larger fraction is derived by multiplying by the ratio between the manure management systems. If all of the manure is in a single manure-management system (either all solid or all slurry), the uncertainty value is assumed to be 0%. Table 2.3 Uncertainty values (U, %) for manure-management systems (expert judgment)
Livestock category Manure-management system U fraction solid/slurry
Cows in milk and in calf Slurry 0.31 Solid 10
Female young stock < 1 year Slurry 6.95 Solid 10
Male young stock < 1 year Slurry 6.95 Solid 10
Female young stock ≥ 1 year Slurry 0.42 Solid 10
Male young stock ≥ 1 year Slurry 2.05 Solid 10
Veal calves, for white veal production Slurry 0
Veal calves, for rosé veal production Slurry 0
Female young stock < 1 year Slurry 7.86 Solid 10
Male young stock (incl. young bullocks) < 1 year Slurry 8.18 Solid 10
Female young stock ≥ 1 year Slurry 7.86 Solid 10
Male young stock (incl. young bullocks) ≥ 1 year Slurry 9.61 Solid 10
Suckling cows (incl. fattening/grazing) ≥ 2 years Slurry 5.15 Solid 10
Fattening pigs Slurry 0
Rearing pigs Slurry 0
Sows Slurry 0.31 Solid 10
Boars for service Slurry 2.35 Solid 10
Broilers Solid 0
Ducks Solid 0
Turkeys Solid 0
Broiler breeders < 18 weeks Solid 0
Broiler breeders ≥ 18 weeks Solid 0
Laying hens < 18 weeks Solid 0
Laying hens ≥ 18 weeks Solid 0

Methodology for estimating emissions from agriculture in the Netherlands - Update 2019 | 33
3 CH4 emissions from enteric fermentation (CRF Sector 3A)
3.1 Scope and definition
This section provides a description of the methods and working processes used to determine the emission of CH4 from ruminal and intestinal (enteric) fermentation. The following source categories are distinguished in the CRF: • 3A1a Mature dairy cattle (ruminal and intestinal fermentation) • 3A1b Other mature cattle (ruminal and intestinal fermentation) • 3A1c Growing cattle (ruminal and intestinal fermentation) • 3A2 Sheep (ruminal and intestinal fermentation) • 3A3 Swine (intestinal fermentation only) • 3A4 Other livestock
a) Goats (ruminal and intestinal fermentation) b) Horses (intestinal fermentation only) c) Mules and asses (intestinal fermentation only) d) Poultry e) Other
In Category 3A4d (Poultry), emissions are reported as ‘not estimated’ (NE), given that the anatomy of the gastro-intestinal tract of poultry (i.e. the high passage rate of feed) and the composition of poultry feed (relatively high energy value) result in a negligible contribution of fermentation processes to feed digestion. The 2006 IPCC Guidelines also do not provide a default emission factor for poultry. No emissions are reported in Category 3A4e (Other), either because the same applies to the livestock categories of fur-bearing animals and rabbits or because the respective species (llamas, alpacas and deer) are not kept commercially in the Netherlands. The feed consumed by an animal is digested in the gastro-intestinal tract in order to provide the energy and nutrients needed for maintenance and production. Part of the nearly anaerobic gastro-intestinal tract accommodates a particularly large microbial population, fermenting the feed and forming methane as a by-product. In monogastric animals (e.g. pigs, horses, mules and asses), this involves only hindgut fermentation in the large intestine, with the CH4 production remains relatively low in comparison to ruminants. The gastro-intestinal tracts of polygastric ruminants (e.g. cattle, sheep and goats) is specialised to digest fibrous material, especially in the rumen. In the process of intensive microbial fermentation, the rumen generates substantially more CH4 production than is the case in monogastric animals. In addition to the microbial matter synthesised through the fermentation of organic matter, volatile fatty acids and hydrogen gas are produced. Only a fraction of the hydrogen that is produced is utilised for microbial growth or the production of propionic acid and branched-chain volatile fatty acids. The remainder or surplus of the hydrogen that is produced is released into the rumen environment, either in rumen fluid or in the gaseous head space. Together with CO2, which is available in excess within the rumen, the hydrogen gas that is released is almost completely converted into CH4 and water by methanogens. Under Dutch feeding conditions for cattle, less than 0.5% of the calculated enteric production of hydrogen was observed to be exhaled by dairy cattle, indicating that almost all of the surplus hydrogen is eventually converted into CH4 (Van Zijderveld et al., 2011). This relatively complete conversion of surplus hydrogen into CH4 keeps the partial gas pressure of hydrogen in the rumen environment very low. In the past, it was generally accepted that a relatively small increase in the partial gas pressure could have a detrimental effect on the fermentative degradation of feed in the rumen as a result of the inhibition of microbial activity (fibre degradation in particular). This assumption has been contradicted by more recent findings. Feeding the methanogen-inhibiting feed additive nitro-oxypropanolol caused
34 | WOt-technical report 148
a reduction of about 30% in CH4 emissions, as well as significant increases in partial hydrogen pressure in the rumen and exhalation of hydrogen by the ruminant. Nevertheless, digestibility appears to improve rather than decline (Hristov et al., 2015). A study by Van Lingen et al. (2017) clearly demonstrates the flexibility of the rumen microbiota in handling variation in hydrogen pressure by shifting the fermentation pathways from a hydrogen-yielding acetate-oriented pathway towards a hydrogen-consuming propionate-oriented pathway. Although there are two enteric compartments in which CH4 is produced (the rumen and the hindgut), almost all of the CH4 (99%) that is formed will leave the ruminant through the mouth, through respiration (i.e. transport from the rumen to blood and lungs) or through the frequent eructation of rumen gases and rumination (Berends et al., 2014). The amount of CH4 produced by ruminants depends on the amount of feed consumed by the animal and the characteristics and composition of this feed (Veen, 2000; Smink et al., 2003; Tamminga et al., 2007). The amount of feed ingested strongly determines the amount of organic matter that will be fermented and, consequently, the amount of hydrogen gas that will be converted into CH4. The characteristics of the feed (e.g. degradability, rate of degradation and outflow to the intestine) determine the fraction of individual feed components that will ferment in the rumen and the fraction that will escape rumen fermentation and flow out into the small intestine (Dijkstra et al., 1992). The chemical composition of the fermented part of the feed determines the amount and type of volatile fatty acids that will be produced (Bannink et al., 2008; Kebreab et al., 2009), and it is thereby an important determinant of the amount of surplus hydrogen that will be converted into CH4 (Mills et al., 2001; Ellis et al., 2008; Bannink et al., 2011). In conclusion, the amount and type of feed ingested determines the emission factor for CH4 (i.e. the amount of CH4 in kg CH4/year that is produced by an animal), partly through its effect on the ‘methane-conversion factor’ (i.e. the fraction of gross energy ingested with feed that is converted into CH4).
3.2 Source-specific aspects
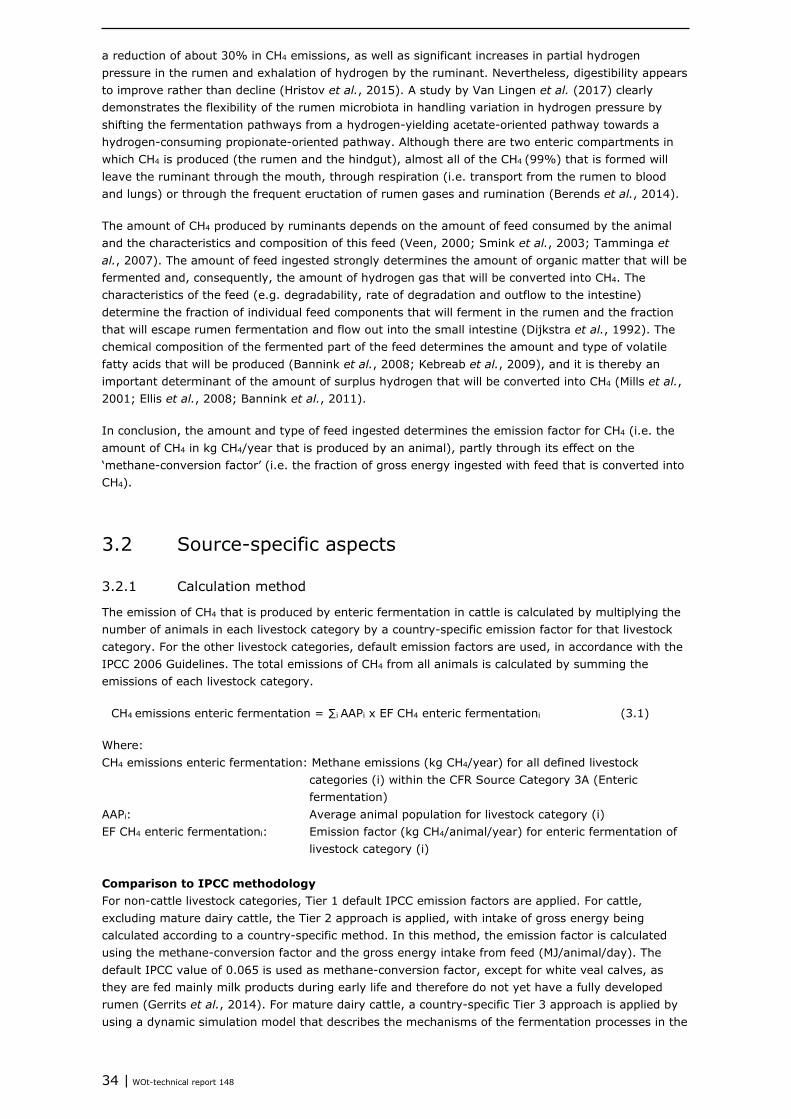
3.2.1 Calculation method
The emission of CH4 that is produced by enteric fermentation in cattle is calculated by multiplying the number of animals in each livestock category by a country-specific emission factor for that livestock category. For the other livestock categories, default emission factors are used, in accordance with the IPCC 2006 Guidelines. The total emissions of CH4 from all animals is calculated by summing the emissions of each livestock category.
CH4 emissions enteric fermentation = ∑i AAPi x EF CH4 enteric fermentationi (3.1) Where: CH4 emissions enteric fermentation: Methane emissions (kg CH4/year) for all defined livestock
categories (i) within the CFR Source Category 3A (Enteric fermentation)
AAPi: Average animal population for livestock category (i) EF CH4 enteric fermentationi: Emission factor (kg CH4/animal/year) for enteric fermentation of
livestock category (i)
Comparison to IPCC methodology For non-cattle livestock categories, Tier 1 default IPCC emission factors are applied. For cattle, excluding mature dairy cattle, the Tier 2 approach is applied, with intake of gross energy being calculated according to a country-specific method. In this method, the emission factor is calculated using the methane-conversion factor and the gross energy intake from feed (MJ/animal/day). The default IPCC value of 0.065 is used as methane-conversion factor, except for white veal calves, as they are fed mainly milk products during early life and therefore do not yet have a fully developed rumen (Gerrits et al., 2014). For mature dairy cattle, a country-specific Tier 3 approach is applied by using a dynamic simulation model that describes the mechanisms of the fermentation processes in the

Methodology for estimating emissions from agriculture in the Netherlands - Update 2019 | 35
gastrointestinal tract (Bannink et al., 2011). The model predicts the consequences of nutrition on microbial fermentation and the accompanying production of CH4 in the rumen and the large intestine. The simulation model predicts the gross energy intake from feed and the production of CH4 in the rumen and large intestine from feed intake and dietary characteristics (e.g. dry-matter intake, chemical composition and rumen degradation characteristics of chemical fractions in dry feed matter). The model subsequently calculates the methane-conversion factor from predicted CH4 emissions and gross energy intake. It therefore predicts the methane-conversion factor as a model output, instead of assuming a constant methane-conversion factor value as a model input, as is the case with the Tier 2 approach.
3.2.2 Activity data
The activity data for this emission source consist of livestock numbers. These numbers and their uncertainty estimates are described in Section 2.
3.2.3 Emission factors
Emission factors used for the calculation of enteric fermentation are detailed in following sections dealing with mature dairy cattle (Tier 3), cattle excluding mature dairy cattle (Tier 2) and all livestock categories, excluding cattle (Tier 1).
Mature dairy cattle
Emission factors for mature dairy cattle A Tier 3 approach is applied for mature dairy cattle, in order to calculate country-specific emission factors using a dynamic simulation model. Depending on production conditions, two regions can be distinguished within the Netherlands, each with a different dietary composition. These two areas are therefore regarded as separate regions representing the North-western and the South-eastern parts of the Netherlands. The most important difference from the Tier 2 approach, which is used for other cattle, is that the simulation model predicts the emission factor from feed intake and dietary characteristics as model inputs, instead of using the values for gross energy intake and the methane-conversion factor. Another important difference is that the simulation model takes several dietary characteristics into account in order to predict the fermentation processes in the rumen and large intestine, instead of using only the net energy value for milk production and maintenance as a dietary characteristic. A final difference from the Tier 2 approach is that the simulation model calculates gross energy intake from dry-matter intake and dietary composition instead of adopting a gross-energy intake value for dry feed matter. The emission factor, gross energy intake and methane-conversion factor of mature dairy cattle are calculated annually (Bannink, 2011). The Tier 3 approach does not account for the effects of feed additives that demonstrably mitigate enteric CH4 emissions. The simulation model describes CH4 production as a result of microbial fermentation processes in the gastro-intestinal tracts of mature dairy cattle (Dijkstra et al., 1992; Mills et al., 2001; Bannink et al., 2005; Bannink et al., 2008; Bannink et al., 2011). Mills et al. (2001) add a representation of CH4 production to the model of rumen-fermentation processes developed by Dijkstra et al. (1992), including a representation of the fermentation processes taking place in the large intestine. This model extension calculates the production and utilisation of hydrogen using the production of volatile fatty acids, following Bannink et al. (2006), and the conversion of hydrogen into CH4. More recently, an improved representation of the production of volatile fatty acids and hydrogen was included by making this value dependent on the acidity of rumen contents (Bannink et al., 2005; Bannink et al., 2008; Bannink et al., 2011). Since 2005, this version of the simulation model has been applied as a Tier 3 approach for calculating CH4 emissions in mature dairy cattle. Although the model can also be used for other cattle categories, it is not currently applied for this purpose, due to budget constraints and the lack of model-evaluation results for other categories. Most recently, Bannink et al. (2018) adapted the model description to improve its application to the prediction of apparent faecal nitrogen digestibility according to the national ammonia emissions registration. The consequences of this adaptation for calculated CH4 predictions are negligible.

36 | WOt-technical report 148
Based on predicted values for the emission factor and gross energy intake, the simulation model calculates a methane-conversion factor. For this reason, the methane-conversion factor is not part of the assumptions made in the model representation, instead constituting a predicted outcome of the model in the same unit that is used for the methane-conversion factor in other categories. From the predicted values of the emission factor and the gross energy intake per year, the methane-conversion factor is calculated as follows:
Ym = EF CH4 enteric fermentationdairy cattle × 55.65 / (GE x 365) (3.2) Where Ym : Methane-conversion factor (fraction of GE intake converted into CH4) EF CH4 enteric fermentationdairy cattle: Emission factor (kg CH4/animal/year) calculated with the
simulation model GE : Gross energy intake (MJ/animal/day) calculated with the simulation model 55.65 : Standard energy content of 1 kg CH4 (MJ/kg CH4) The methane-emission factor EF and the methane-conversion factor Ym depend on all input data for the simulation model: 1) the level of feed intake, 2) the chemical composition of ingested feed and 3) the degradation characteristics in the rumen. The origin of these data is described in the next section.
Feed intake and feed characteristics for mature dairy cattle Important input data for the simulation model include the following: 1. The chemical composition of dry-matter intake in the various dietary components (e.g. grass
herbage, grass silage, maize silage, low-protein concentrates, protein-rich concentrates and wet by-products). A distinction is made between soluble carbohydrates (including sugars), starch, cell walls (hemi-cellulose, cellulose and lignin), crude protein (including a distinction of the ammonia fraction), crude fat and crude ash. Data on the composition is derived from information provided by the laboratory of Eurofins Agro (formerly Blgg and AgroXpertus) in Wageningen (eurofins-agro.com), which analyses the majority of roughages in the Netherlands, as well as from producers of compound feed. The data used for these calculations have been described previously by Smink et al. (2005). Between 1990 and 2008, CBS (2012a) revised the WUM rations, including new calculations and data on chemical composition developed by Bannink (2011). Part of the ensiled roughage is not fed to dairy cattle in the same year in which the roughage analysis was performed. A correction for ensiled roughage has therefore been made in the annual ration calculations (CBS, 2012a);
2. Rumen-intrinsic degradation characteristics of starch, crude protein and fibre. The assumptions made concerning the degradation characteristics for starch, crude protein and fibre (i.e. the soluble/washable fraction, the fraction that is potentially degradable, the fraction that is undegradable and the fractional degradation rate of the fraction that is potentially degradable) are stated in the report by Bannink (2011).
3. Feed-intake levels and dry-matter intake, as calculated by WUM (CBS, 2012a) for the North-western and South-eastern regions. Dry-matter intake (kg dry matter/animal/day) is derived from calculations prepared by the WUM. The intake of various components in the rations (grass, grass silage, maize silage, standard concentrates, protein-rich concentrates and wet by-products) is calculated annually based on national statistics concerning the amounts of these products that have been traded or produced. These statistics on dietary components cover part of the total energy requirement that is calculated annually according to a country-specific method. It is subsequently assumed that the remainder of the energy requirement for the recorded production level is covered by the intake of grass from grazing. Since 1990, the WUM has calculated dry-matter intake and rations annually, and these figures have been used as input for the method for calculating manure production and mineral excretion by livestock (CBS, 2008 through 2018). The first release was published in 1994 (WUM, 1994), and a revised calculation of the rations (from 1990 to 2008) was published in 2009 (CBS, 2012a).
The input data vary according to annual changes in the proportion of individual dietary components (grass herbage, grass silage, maize silage, low-protein concentrates, protein-rich concentrates, wet by-products), as well as with changes in the chemical composition and intrinsic-degradation characteristics of these chemical fractions. The fractional passage rate of fermentable matter and fluid,
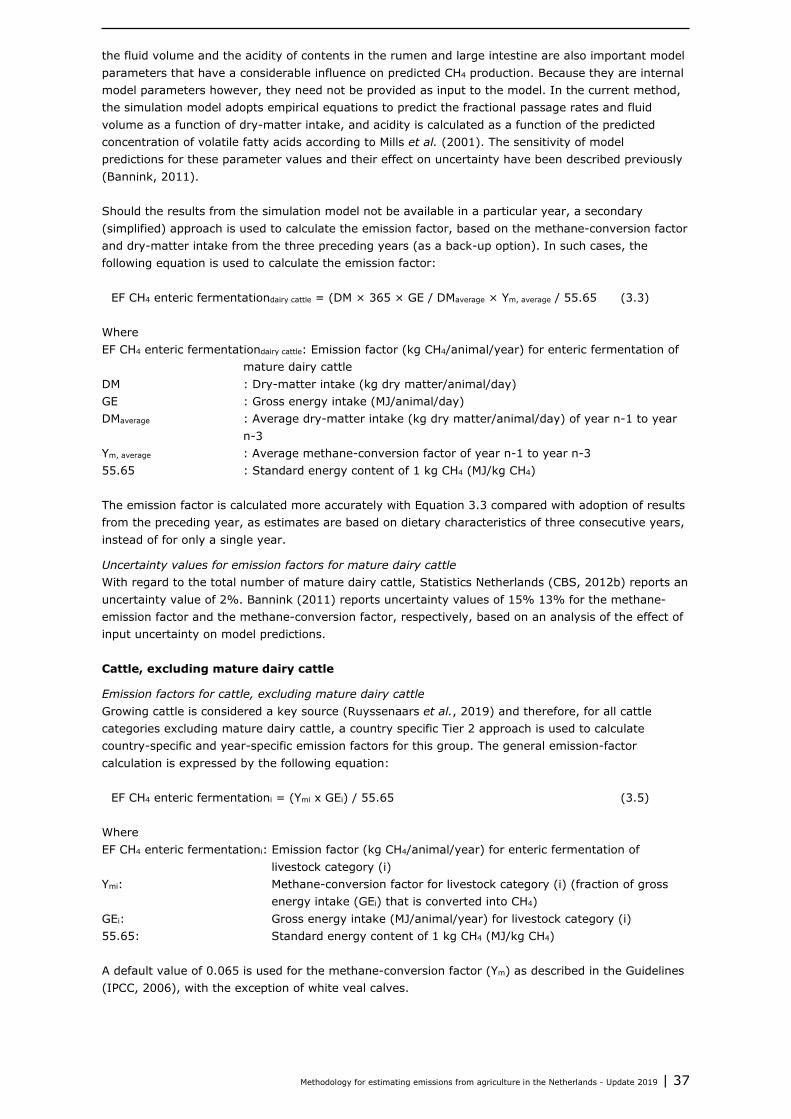
Methodology for estimating emissions from agriculture in the Netherlands - Update 2019 | 37
the fluid volume and the acidity of contents in the rumen and large intestine are also important model parameters that have a considerable influence on predicted CH4 production. Because they are internal model parameters however, they need not be provided as input to the model. In the current method, the simulation model adopts empirical equations to predict the fractional passage rates and fluid volume as a function of dry-matter intake, and acidity is calculated as a function of the predicted concentration of volatile fatty acids according to Mills et al. (2001). The sensitivity of model predictions for these parameter values and their effect on uncertainty have been described previously (Bannink, 2011). Should the results from the simulation model not be available in a particular year, a secondary (simplified) approach is used to calculate the emission factor, based on the methane-conversion factor and dry-matter intake from the three preceding years (as a back-up option). In such cases, the following equation is used to calculate the emission factor:
EF CH4 enteric fermentationdairy cattle = (DM × 365 × GE / DMaverage × Ym, average / 55.65 (3.3) Where EF CH4 enteric fermentationdairy cattle: Emission factor (kg CH4/animal/year) for enteric fermentation of
mature dairy cattle DM : Dry-matter intake (kg dry matter/animal/day) GE : Gross energy intake (MJ/animal/day) DMaverage : Average dry-matter intake (kg dry matter/animal/day) of year n-1 to year
n-3 Ym, average : Average methane-conversion factor of year n-1 to year n-3 55.65 : Standard energy content of 1 kg CH4 (MJ/kg CH4) The emission factor is calculated more accurately with Equation 3.3 compared with adoption of results from the preceding year, as estimates are based on dietary characteristics of three consecutive years, instead of for only a single year.
Uncertainty values for emission factors for mature dairy cattle With regard to the total number of mature dairy cattle, Statistics Netherlands (CBS, 2012b) reports an uncertainty value of 2%. Bannink (2011) reports uncertainty values of 15% 13% for the methane-emission factor and the methane-conversion factor, respectively, based on an analysis of the effect of input uncertainty on model predictions.
Cattle, excluding mature dairy cattle
Emission factors for cattle, excluding mature dairy cattle Growing cattle is considered a key source (Ruyssenaars et al., 2019) and therefore, for all cattle categories excluding mature dairy cattle, a country specific Tier 2 approach is used to calculate country-specific and year-specific emission factors for this group. The general emission-factor calculation is expressed by the following equation:
EF CH4 enteric fermentationi = (Ymi x GEi) / 55.65 (3.5) Where EF CH4 enteric fermentationi: Emission factor (kg CH4/animal/year) for enteric fermentation of
livestock category (i) Ymi: Methane-conversion factor for livestock category (i) (fraction of gross
energy intake (GEi) that is converted into CH4) GEi: Gross energy intake (MJ/animal/year) for livestock category (i) 55.65: Standard energy content of 1 kg CH4 (MJ/kg CH4) A default value of 0.065 is used for the methane-conversion factor (Ym) as described in the Guidelines (IPCC, 2006), with the exception of white veal calves.

38 | WOt-technical report 148
Gross energy intake is calculated according to the following equation:
GEi = DMi x 18.45 (3.6) Where GEi: Gross energy intake (MJ/animal/year) for livestock category (i) DMi: Dry-matter intake (kg dry matter/animal/year) for livestock category (i) 18.45: Gross energy content of 1 kg dietary dry matter (MJ/kg dry matter) It is assumed that 1 kg dietary dry matter has a gross energy content of 18.45 MJ/kg dry matter (IPCC, 2006), with the exception of milk products fed to white veal calves (21.00 MJ/kg DM; Gerrits et al., 2014).
Feed intake and rations of cattle, excluding mature dairy cattle Feed-intake levels and dry-matter intake were calculated by WUM (CBS, 2012a) according to the same method as described above for mature dairy cattle. The intake of various components in the rations (milk/milk products, grass, grass silage, maize silage, standard concentrates, protein-rich concentrates and wet by-products) is calculated annually for each cattle category, based on national statistics on the amounts of these products that have been traded or produced. These statistics on dietary components cover part of the total energy requirement that is calculated annually according to a country-specific method for the various cattle categories. It is subsequently assumed that the remainder of the energy requirement for the recorded production level is covered by the intake of grass from grazing. Since 1990, the WUM has calculated dry-matter intake and rations annually, and these figures have been used as input for the method used to calculate manure production and mineral excretion by livestock (CBS, 2008 through 2018). The first release was published in 1994 (WUM, 1994), and a revised calculation of the rations (from 1990 to 2008) was published in 2009 (CBS, 2012a). The dry-matter intake of cattle, excluding mature dairy cattle, is stated in the report written by Smink (2005) and in Van Bruggen et al. (2015).
Emission factors for white veal calves The production of white veal constitutes a considerable sector in the Netherlands. Rations consist largely or entirely of milk products, with low associated methane-conversion factors, as milk products are not fermented in the rumen. Over time, in order to improve animal welfare, rations have been supplemented with increasing amounts of concentrates and roughage. As the rumen is still not fully developed in white veal calves, the methane-conversion factors for these ration components was observed to be lower than the default value of 0.065. Specific methane-conversion factor values of 0.003 for milk products and 0.055 for other ration components are assumed, and a gross energy intake of 21.00 MJ/kg of dry matter for milk products is used (Gerrits et al., 2014) to calculate the emission factor:
EF CH4 enteric fermentationwhite veal = (Ym, milk products x GEmilk products + Ym, other ration components x GEother ration
components) / 55.65 (3.7) Where EF CH4 enteric fermentationwhite veal: Emission factor (kg CH4/animal/year) from enteric fermentation of
white veal calves Ym, milk products : Methane-conversion factor for milk products GEmilk products : Gross energy intake (MJ/animal/year) with milk products Ym, other ration components : Methane-conversion factor for other ration components GEother ration components : Gross energy intake (MJ/animal/year) with other ration components 55.65 : Standard energy content of 1 kg CH4 (MJ/kg CH4)
Uncertainty values for emission factors cattle, excluding mature dairy cattle Feed intake depends on the total energy requirement and the variety of rations fed to fulfil this requirement. The uncertainty value for the total energy requirement is assumed to be 2%. Given the additional uncertainty concerning how to meet this requirement, the uncertainty value for dry-matter feed intake is assumed to be 5% for female young stock and 10% for male young stock categories. A
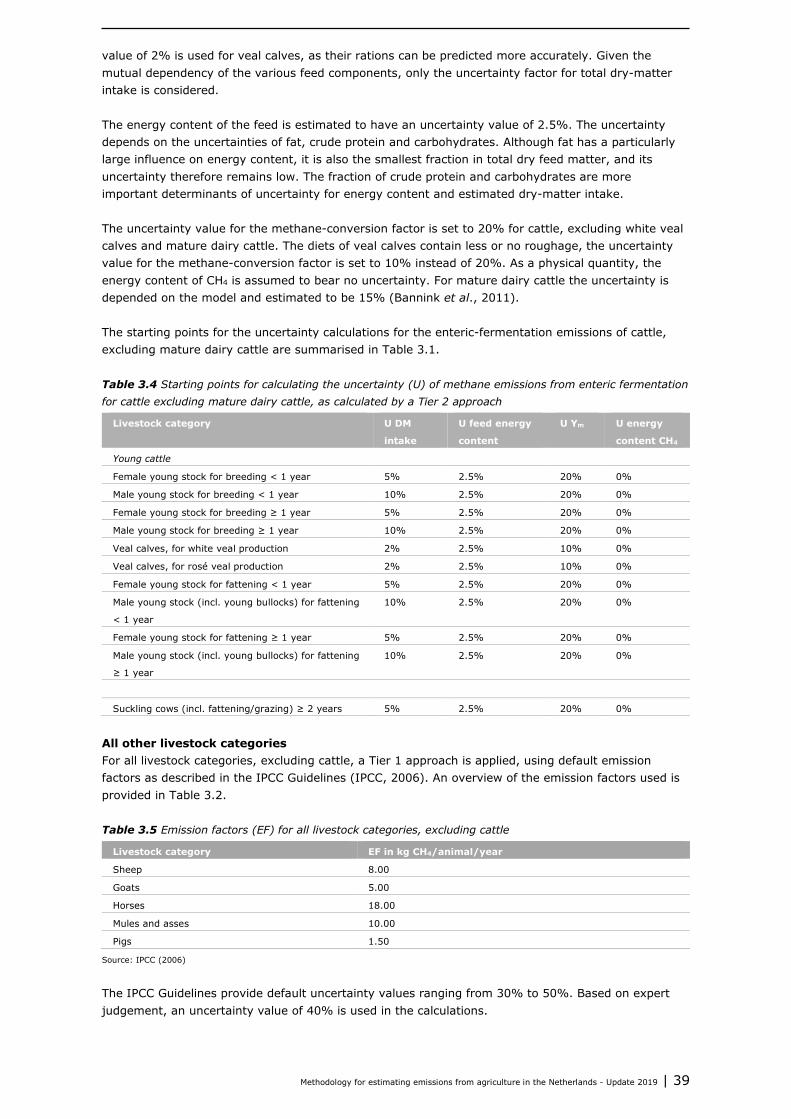
Methodology for estimating emissions from agriculture in the Netherlands - Update 2019 | 39
value of 2% is used for veal calves, as their rations can be predicted more accurately. Given the mutual dependency of the various feed components, only the uncertainty factor for total dry-matter intake is considered. The energy content of the feed is estimated to have an uncertainty value of 2.5%. The uncertainty depends on the uncertainties of fat, crude protein and carbohydrates. Although fat has a particularly large influence on energy content, it is also the smallest fraction in total dry feed matter, and its uncertainty therefore remains low. The fraction of crude protein and carbohydrates are more important determinants of uncertainty for energy content and estimated dry-matter intake. The uncertainty value for the methane-conversion factor is set to 20% for cattle, excluding white veal calves and mature dairy cattle. The diets of veal calves contain less or no roughage, the uncertainty value for the methane-conversion factor is set to 10% instead of 20%. As a physical quantity, the energy content of CH4 is assumed to bear no uncertainty. For mature dairy cattle the uncertainty is depended on the model and estimated to be 15% (Bannink et al., 2011). The starting points for the uncertainty calculations for the enteric-fermentation emissions of cattle, excluding mature dairy cattle are summarised in Table 3.1. Table 3.4 Starting points for calculating the uncertainty (U) of methane emissions from enteric fermentation for cattle excluding mature dairy cattle, as calculated by a Tier 2 approach
Livestock category U DM
intake
U feed energy
content
U Ym U energy
content CH4
Young cattle
Female young stock for breeding < 1 year 5% 2.5% 20% 0%
Male young stock for breeding < 1 year 10% 2.5% 20% 0%
Female young stock for breeding ≥ 1 year 5% 2.5% 20% 0%
Male young stock for breeding ≥ 1 year 10% 2.5% 20% 0%
Veal calves, for white veal production 2% 2.5% 10% 0%
Veal calves, for rosé veal production 2% 2.5% 10% 0%
Female young stock for fattening < 1 year 5% 2.5% 20% 0%
Male young stock (incl. young bullocks) for fattening
< 1 year
10% 2.5% 20% 0%
Female young stock for fattening ≥ 1 year 5% 2.5% 20% 0%
Male young stock (incl. young bullocks) for fattening
≥ 1 year
10% 2.5% 20% 0%
Suckling cows (incl. fattening/grazing) ≥ 2 years 5% 2.5% 20% 0%
All other livestock categories For all livestock categories, excluding cattle, a Tier 1 approach is applied, using default emission factors as described in the IPCC Guidelines (IPCC, 2006). An overview of the emission factors used is provided in Table 3.2. Table 3.5 Emission factors (EF) for all livestock categories, excluding cattle
Livestock category EF in kg CH4/animal/year
Sheep 8.00
Goats 5.00
Horses 18.00
Mules and asses 10.00
Pigs 1.50
Source: IPCC (2006)
The IPCC Guidelines provide default uncertainty values ranging from 30% to 50%. Based on expert judgement, an uncertainty value of 40% is used in the calculations.

40 | WOt-technical report 148
3.3 Uncertainty estimates
The uncertainty estimates for the data sources and emission factors used are listed in Table 3.3, along with the total uncertainty estimate for CH4 from enteric fermentation. Table 3.6 Uncertainty estimates (% of value) for CH4 emissions, activity data (AD) and implied emission factors (IEF) from CRF Sector 3A Enteric fermentation
IPCC Livestock category U AD U IEF U emission
3A1a Mature dairy cattle 2% 15% 15%
3A1b Other mature cattle 2% 21% 21%
3A1c Growing cattle 1% 11% 11%
3A2 Sheep 10% 40% 41%
3A3 Swine 6% 40% 41%
3A4a Goats 10% 40% 41%
3A4b Horses 36% 40% 56%
3A4c Mules and Asses 5% 40% 40%
Total 10%

Methodology for estimating emissions from agriculture in the Netherlands - Update 2019 | 41
4 CH4 emissions from manure management (CRF Sector 3B)
4.1 Scope and definition
This section provides a description of the methodology and working processes for determining CH4 emissions from manure in animal housing, outside storage and manure treatment. The following source categories are distinguished in the CRF: • 3B1a Mature dairy cattle • 3B1b Other mature cattle • 3B1c Growing cattle • 3B2 Sheep • 3B3 Swine • 3B4 Other livestock • 5B2 Biological treatment of waste – anaerobic digestion at biogas facilities Source Category 3B4 (Other livestock) consists of poultry, goats, horses, mules and asses, fur-bearing animals and rabbits. Source Category 5B2 includes emissions from the manure used in digestion-based manure-treatment systems. Emissions from other types of manure treatment are included in the manure-management source categories (3B1 through 3B4). Methane emissions from animal manure are caused by the fermentation of organic matter in an anaerobic environment. It takes some time for methanogenic bacteria to develop and produce methane. This implies that, when manure is stored for less than a month, methane production will remain very low. The extent to which organic matter is converted into methane also depends on the chemical (or other) composition of the manure, as well as on environmental factors (e.g. temperature). An overview of key factors affecting methane emissions from manure is presented in Webb et al. (2012). Slurry from pigs and cattle is often stored in slurry pits underneath the slatted floors of the animal house, as well as in manure-storage facilities outside the animal house. Solid manure is stored in animal housing and stacked outdoors, in most cases with a roof to avoid rainwater. In both cases, anaerobic conditions can occur, resulting in the production and emission of CH4. The slurry pit is an ‘accumulation system’, involving a constant input of manure and a volume that increases until the pit is emptied. In such systems, CH4 emissions increase as the manure temperature rises and as the manure is stored for longer periods (Zeeman, 1994). These emissions also increase if older manure with high methanogenic activity is already present (inoculation). Several different types of manure treatment are used in the Netherlands: separation, incineration, drying and/or digestion of manure. Methane emissions from manure excreted during grazing is low, due to aerobic conditions and the rapid drying of manure on the field.
4.2 Source-specific aspects for CH4 emissions from manure storage
4.2.1 Calculation method
Because cattle, pigs and poultry are regarded as key sources (Coenen et al., 2017), emission factors are calculated according to a Tier 2 approach.

42 | WOt-technical report 148
Tier 2 In the Tier 2 approach, a distinction is made between slurry-manure management systems, solid-manure management systems and pasture manure.
CH4 emissions manure management = ∑ AAPi x FRACj, manure management x EF CH4 manure managementij
(4.1) Where: CH4 emissions manure management: Methane emission (kg CH4/year) for all defined livestock
categories (i) within the CFR Source Category 3B (Manure management)
AAPi: Average animal population for livestock category (i) FRACj, manure management: Fraction of manure in the various management systems (j) EF CH4 manure managementij: Emission factor (kg CH4/animal) for the manure management of
livestock category (i) and manure-management system (j)
Tier 1 With respect to the other livestock categories, default Tier 1 emission factors are used (IPCC, 2006).
CH4 emissions manure management = ∑ AAPi x EF CH4 manure managementi (4.2) Where: CH4 emissions manure management: Methane emissions (kg CH4/year) for all defined livestock
categories (i) within the CFR Source Category 3B (Manure management)
AAPi: Average animal population for livestock category (i) EF CH4 manure managementi: Emission factor (kg CH4/animal) for the manure management of
livestock category (i)
4.2.2 Activity data
Livestock numbers Livestock numbers constitute the activity data for this emission source. Livestock numbers and their uncertainty estimates are described in Section 2.
Distribution between manure-management systems The proportion of slurry and solid manure depends on how manure is managed in the housing systems. Data on these are derived from the Agricultural Census. The length of the grazing period in days per year and hours per day indicate the fraction of manure excreted on pasture land, as indicated by the WUM.
Uncertainty estimates for activity data for CH4 from manure management Uncertainty values for the fraction of manure in the management systems, manure on pasture or in animal housing are included in the volatile solids (VS) uncertainty for these two categories. In the Netherlands, manure from animal housing is also divided into two categories: solid and slurry manure. An uncertainty value of 10% is used for the smallest manure fraction. The uncertainty value for the other fraction is calculated as the absolute uncertainty of the small fraction divided by the fraction for large management systems. Because emissions are reported by livestock category, uncertainty values for the distribution between manure-management systems are ultimately included in the emission-factor uncertainty.
4.2.3 Emission factors
For sheep, goats, horses, mules and asses, rabbits and fur-bearing animals, the Tier 1 default emission factors from Table 4.1 are used (IPCC, 2006).

Methodology for estimating emissions from agriculture in the Netherlands - Update 2019 | 43
Table 4.7 Emission factors (EF) for all livestock categories (excluding cattle, pigs and poultry), IPCC (2006)
Livestock category EF in kg CH4/animal/year
Sheep 0.19
Goats 0.13
Horses 1.56
Mules and asses 0.76
Rabbits 0.08
Fur-bearing animals (minks and foxes) 0.68
For the key livestock categories of cattle, pigs and poultry, a country-specific emission factor is calculated annually for each manure-management system using the following formula:
EF for CH4 manure managementij = VSi x (1 - FRACmanure treatment) x Boi x MCFij x 0.67 (4.3)
Where EF for CH4 manure managementij: Emission factor (kg CH4/animal) for the manure management of
livestock category (i) and manure-management system (j) VSi : Volatile solids (kg VS/year) excreted by the livestock category (i) FRACmanure treatment : Fraction of the manure that is treated Boi : Maximum methane production potential (m3 CH4/kg VS) for the manure
produced by the livestock category (i) MCFij : Methane-conversion factor for the livestock category (i) and manure-
management system (j) 0.67 : Density of methane (kg/m3)
Volatile solids (VS) The amount of VS excreted is calculated for the key categories of cattle, pigs and poultry (Zom and Groenestein, 2015). Since 2018, this has been calculated annually. The amount of VS excreted by livestock depends on the digestibility of the organic matter and protein in the feed components. The excretion of VS in urine is calculated as the amount of urea (CH4N2O) or uric acid (C5H4O3N4) from the digestibility of crude protein, which is also used in the calculation of TAN. In faeces, VS depends on dry-matter intake, the ash content therein and the digestibility of the VS (Zom and Groenestein, 2015).
Fraction of treated manure The amount of manure that has been treated can be estimated based on registered manure transports (data from the Netherlands Enterprise Agency; RVO).
Maximum methane production potential (Bo) The value of Bo depends on the degradability of the organic components in the manure. This value is expressed in m3 CH4/kg VS and is 0.22 for cattle manure, 0.31 for pig manure, and 0.34 for poultry manure (Groenestein et al., 2016).
Methane-conversion factor (MCF) The MCF indicates the share of Bo that will actually be converted into methane, depending on the environmental conditions. The most important factors are storage time, inoculation, temperature, the availability of oxygen, dry-matter content and manure coverage (hard cover, floating, crust or otherwise). In the Netherlands, farmers are required to store the manure for six or seven months, as it is forbidden to apply manure from September to February (obligation related to implementation of the Nitrates Directive). For this reason, long-term measurements are needed in order to estimate the annual CH4 emissions from which MCF can be deduced, while environmental factors must be representative of the Dutch situation. Additionally, in analysing the measurements from housing systems, correction for enteric methane production is necessary in order to obtain emissions from manure. In light of the aforementioned considerations and based on literature, Groenestein et al. (2016) prepared estimates of the mean MCF for cattle and pig slurry (Table 4.2). Although solid manure is currently produced in poultry housing in the Netherlands, not enough data were available for solid poultry manure. The IPCC defaults have therefore been used. In the previous years of the

44 | WOt-technical report 148
time series, slurry manure from poultry was considered as well, with the MCF set equal to pig slurry. For solid manure from cattle and pigs and for manure on pasture land, the default IPCC MCF values of respectively 0.02 and 0.01 have been used. Table 4.8 MCF values used for each livestock category (Groenestein et al., 2016)
Livestock category MCF
Slurry
Cattle 0.17
Pigs 0.36
Laying hens 0.36
Solid manure
Cattle 0.021
Pigs 0.021
Poultry 0.015
Pasture manure
Cattle 0.011 1Default IPCC MCF values
4.2.4 Uncertainty
The IPCC specifies an uncertainty value of 30% for the Tier 1 emission factor. Based on the data from Groenestein et al. (2016), an uncertainty value (defined as 2 x (stdev/√n)) of 35.3% could be calculated for the estimation of MCF for slurry pig manure. For cattle and poultry, it is assumed that MCF uncertainty values will be the same. For solid manure, the uncertainty value is assumed to be twice that of slurry (Table 4.3). The uncertainty values for the estimation of the mean Bo (defined as 2 x (stdev/√(n-1))) depend on the livestock category (Table 4.3). Based on the data in Groenestein et al. (2016), these values have been set to 11.1% for cattle and 13.6% for pigs. The uncertainty value for poultry manure is assumed to be the same as for pig manure. The uncertainty values for the estimations of the excretion of VS are assumed to be 10% under housing conditions and 20% under grazing conditions. For the density of CH4, an uncertainty value of 0% is assumed, given that it is a physical property. Table 4.9 Uncertainty estimates (U) in activity data for the calculation of methane emissions from manure-management systems (MMS)
Livestock category MMS U MCF (%) U Bo (%) U VS (%)
Cows in milk and in calf Slurry 35.3 11.1 10 Solid 70.5 11.1 10 Pasture 35.3 11.1 20
Female young stock for breeding Slurry 35.3 11.1 10 Solid 70.5 11.1 10 Pasture 35.3 11.1 20
Male young stock for breeding Slurry 35.3 11.1 10 Solid 70.5 11.1 10
Veal calves, for white veal production Slurry 35.3 11.1 10
Veal calves, for rosé veal production Slurry 35.3 11.1 10
Female young stock for fattening Slurry 35.3 11.1 10 Solid 70.5 11.1 10 Pasture 35.3 11.1 20
Male young stock (incl. young bullocks) for fattening Slurry 35.3 11.1 10 Solid 70.5 11.1 10
Suckling cows (incl. fattening/grazing) ≥ 2 years Slurry 35.3 11.1 10 Solid 70.5 11.1 10 Pasture 35.3 11.1 20
Pigs Slurry 35.3 13.6 10 Solid 70.5 13.6 10
Poultry Solid 70.5 13.6 10
Slurry 35.3 13.6 10

Methodology for estimating emissions from agriculture in the Netherlands - Update 2019 | 45
4.3 Source-specific aspects for CH4 emissions from manure treatment
4.3.1 Calculation method
The CH4 emissions from manure treatment are calculated based on the amount of VS in the treated manure. The following six types of manure treatment are used: separation, nitrification/denitrification, production of mineral concentrates, incineration, pelleting/drying and manure digestion. It is assumed that half of the regular CH4 emissions from manure storage has taken place before the manure is treated. For all techniques except for digestion, these values are replaced by emissions from the storage of manure-treatment products. Emissions are assumed to occur in the digestion-only process. For purposes of simplification, storage emissions during and after processing are combined and expressed as a single emission factor for ingoing VS manure. The combined emissions from the CH4 process (if relevant) and subsequent storage from manure treatment for livestock category (i) and process (o) are calculated as follows:
CH4 emissions manure treatmentio = ∑ VSi x FRACio, manure treatment x EF CH4 manure treatmentio (4.5) Where: CH4 emissions manure treatmentio: Methane emissions (kg CH4/year) for the livestock category (i)
within the manure-treatment system (o) VSi Volatile solids (kg VS/year) excreted by the livestock category (i) FRACio, manure treatment: Fraction of the manure that is treated for the livestock category
(i) within the manure-treatment system (o) EF CH4 manure treatmentio: Emission factor (kg CH4/kg VS) for the manure-treatment system
by livestock category (i) and manure-treatment system (o)
4.3.2 Activity data
Volatile solids (VS) The amount of VS excreted is calculated for the key categories of cattle, pigs and poultry (Zom and Groenestein, 2015). The amount of VS excreted by livestock depends on the digestibility of the organic matter and protein in the feed components. The excretion of VS in urine is calculated as the amount of urea (CH4N2O) or uric acid (C5H4O3N4) from the digestibility of crude protein, which is also used in the calculation of TAN. In faeces, VS depends on dry-matter intake, the ash content therein and the digestibility of the VS (Zom and Groenestein, 2015).
Fraction of treated manure The amount of manure that has been treated can be estimated based on registered manure transports (data from the Netherlands Enterprise Agency; RVO).
Livestock numbers Livestock numbers constitute the activity data for this emission source. Livestock numbers and their uncertainty estimates are described in Section 2.
4.3.3 Emission factors
A literature survey was conducted by Melse and Groenestein (2016) in order to compile the most suitable emission factors for the various types of manure treatment used in and under conditions in the Netherlands, as summarised in Table 4.4.

46 | WOt-technical report 148
Table 4.10 Emission factors (EF; g CH4/kg VS in manure) for all livestock categories, by manure-treatment system (Melse and Groenestein, 2016).
Livestock category Manure treatment EF
Cattle (excl. veal calves) Separation 24.8
Digestion 6.0
Veal calves Separation 4.8
Pigs Separation 64.0
Digestion 8.2
Poultry Incineration 0.6
Pelleting/drying 0.6
4.3.4 Uncertainty
The amounts of manure treated (with the exception of poultry manure) are assumed to be 50% uncertain, based on expert judgement. Poultry manure is processed either by pelleting/drying or incineration, both of which are industrial processes with lower expected uncertainty values of 25%. The uncertainty values for the implied emission factor are assumed equal to those for regular manure management (Table 4.5). Table 4.11 Uncertainty values (% of value) for activity data (AD) and implied emission factors (IEF) for CH4 emissions from manure treatment
Livestock category Manure treatment U AD U IEF
Mature dairy cattle Separation 50% 38.7%
Young cattle Separation 50% 38.9%
Veal calves Separation 50% 38.7%
Fattening pigs Separation 50% 39.6%
Mineral concentrates 50% 39.6%
Breeding pigs Separation 50% 39.6%
Mineral concentrates 50% 39.6%
Laying hens Pelleting/drying 25% 73.5%
Incineration 25% 73.5%
Broilers Pelleting/drying 25% 73.5%
Incineration 25% 73.5%
Turkeys Pelleting/drying 25% 73.5%
Incineration 25% 73.5%
Mature dairy cattle Digestion 50% 38.7%
Young cattle Digestion 50% 38.9%
Fattening pigs Digestion 50% 39.6%
Breeding pigs Digestion 50% 39.6%
4.4 Uncertainty estimates
In the NEMA, uncertainty values for manure management and manure treatment are calculated separately, in order to account for differences in circumstances and thus in the associated emissions. The output of the model is at the level of detail shown in Table 4.3, Table 4.5 and Annex 11.
Aggregation of emissions for reporting For the respective livestock categories distinguished in the CRF, emissions from manure management and manure treatment are summed to arrive at total CH4 emission from manure management.
Aggregation of uncertainties for CH4 manure management and manure treatment Uncertainty values for emissions from manure management and manure treatment are aggregated to the CRF categories, as shown in Table 4.6.

Methodology for estimating emissions from agriculture in the Netherlands - Update 2019 | 47
Table 4.12 Uncertainty values (U) for activity data (AD; livestock numbers), implied emission factors (IEF) and CH4 emissions from manure management
IPCC Livestock category U AD U IEF U emissions
3A1a Mature dairy cattle 2% 39% 39%
3A1b Other mature cattle 2% 34% 34%
3A1c Growing cattle 1% 21% 21%
3A2 Sheep 10% 44% 45%
3A3 Swine 8% 29% 30%
3A4a Goats 10% 30% 32%
3A4b Horses 36% 58% 68%
3A4c Mules and asses 5% 43% 43%
3A4d Poultry 5% 44% 44%
3A4e Other 5% 29% 29%
Total 20%


Methodology for estimating emissions from agriculture in the Netherlands - Update 2019 | 49
5 NH3 emissions from manure management (NFR Category 3B)
5.1 Scope and definition
This section provides a description of the methods and working processes for determining NH3 emissions from manure management, using the following NFR categories: • 3B1a Dairy cattle • 3B1b Non-dairy cattle • 3B2 Sheep • 3B3 Swine • 3B4d Goats • 3B4e Horses • 3B4f Mules and asses • 3B4gi Laying hens • 3B4gii Broilers • 3B4giii Turkeys • 3B4giv Other poultry • 3B4h Other animals • 5B2 Biological treatment of waste – anaerobic digestion at biogas facilities Buffalo (3B4a) are reported as ‘not occurring’ (NO), as these animals are not kept commercially in the Netherlands. The category ‘Other animals’ (3B4h) consists of fur-bearing animals and rabbits. Source Category 5B2 includes the emissions from the manure used in digestion-based manure-treatment systems. Emissions from other types of manure treatment are included in the manure-management source categories (3B1 through 3B4). Emissions of NH3 from manure management are the sum of emissions from animal housing (including inside manure storage), outside manure storage and manure treatment (Figure 5.1). These emissions originate mainly from nitrogen excreted in the urine and to a small extent from mineralized organically bound N in faeces. In mammals, this N is excreted as urea (CH4N2O) and, in birds, as uric acid (C5H4O3N4). Both urea and uric acid are converted by bacterial enzymes (urease and uricase) into ammonium (NH4+). For urea, this process usually takes less than 24 hours (Elzing and Monteny, 1997), while uric acid breaks down more slowly (Groot Koerkamp, 1998). At high pH levels, NH4+ is converted to NH3, which is emitted in a process affected by various factors, both physical (e.g. air speed, area and temperature) and chemical (e.g. NH4+ concentration, pH and ion strength). The sum of the amount of NH3 and NH4+ is referred to as total ammoniacal N (TAN). The N-flow method described in this methodology report and its predecessors (Velthof et al., 2009; Vonk et al., 2016; Vonk et al., 2018) calculates gaseous N emissions based on TAN. This represents a change with respect to methodologies that were used previously in the Netherlands, which used emission factors based on total N excretions (Oenema et al., 2000; Van der Hoek, 2002). The excretion of TAN is calculated as the sum of all excretions of N in urine and the net mineralised organically bound N in faeces. The net mineralised organically bound N is used, given that TAN can also be immobilised and become organic N. International consensus exists concerning the advantages of a methodology for calculating NH3 emissions based on TAN instead of on total N: • Gaseous N components are formed from NH4+ in manure. Research under controlled conditions has
demonstrated that NH3 emissions are more closely related to NH4+ content than to the content of total N in manure (e.g. Velthof et al., 2005).
• A measure that does not change the total amount of N in the manure, but that does change the amount of TAN affects NH3 emissions as well. This effect cannot be calculated with an emission factor based on total N. In addition to having an effect on total N excretions, rations have an effect

50 | WOt-technical report 148
on the share of TAN in the excretions (Annex 1, Annex 2 and Annex 3). The effects of ration composition on NH3 emissions is better quantified with a methodology based on TAN.
• The emission factor for the application of manure is based on TAN (Section 10.3). In the methodology that was previously used in the Netherlands, emissions after application were calculated based on standard TAN contents in the manure, as derived from literature. These data are not influenced by changes in rations or housing systems. The calculation of NH3 emissions after the application of manure according to the calculated TAN content of the manure also reveals the effects of rations and housing systems on TAN in emissions after application.
• The TAN-based methodology draws connections to internationally accepted concepts of NH3 calculation methods (Reidy et al., 2008; Reidy et al., 2009), as well as to the Emission Inventory Guidebook of EMEP/EEA that is used in European and UNECE contexts (EEA, 2016).
The methodology assumes that the relationship between TAN content and NH3 emissions progresses in a linear pattern. For this reason, a linear emission factor is applied as a percentage of the TAN excreted in manure. This assumption was also made in the former methodology based on total N (Oenema et al., 2000), and it has been used in experimental research as well (Velthof et al., 2005). The method for calculating NH3 emissions based on TAN-excretion rates also takes into account the net mineralisation of organic N that occurs in the manure (Annex 4). Methods for calculating the animal-excretion rate of TAN are based on ration data and animal productivity, as drafted in Annex 1, Annex 2 and Annex 3. These calculations are performed annually by the WUM to quantify dietary effects in estimates of TAN excretion and NH3 emissions (e.g. changes in roughage production and composition, and the consequent changes in the composition and feeding quality of rations). The actual ration compositions and N-digestibility of the separate components are taken as the starting point for the TAN calculations, instead of fixed TAN values or empirically averaged digestion values (Velthof et al., 2012). The method for calculating the TAN excretions of dairy cattle is consistent with the Tier 3 approach for estimating enteric CH4 emissions (Bannink et al. (2011) (Bannink et al., 2018); see Section 3.2). In poultry, TAN is composed mainly of uric acid instead of urea. As is commonly known, however, part of the uric acid in animal housing and in outside manure-storage facilities may not have been converted to NH4+, especially in dried manures. The amount of NH4+/uric acid in the applied manure is uncertain. For this reason, no correction has been made. In subsequent sections, uniform calculation rules are provided, based on TAN values for all livestock categories. Over time, and for all livestock categories, part of the TAN in manure is lost in the form of gaseous N compounds (Figure 5.1). It is assumed that net mineralisation takes place directly after excretion in animal housing. The calculations are performed as follows: 1. The TAN excreted by the animal is calculated as the excretion of N in urine. 2. The amount of TAN produced by net mineralisation is calculated from the excretion of organic N in
faeces. In slurry, mobilisation exceeds immobilisation, while the reverse occurs in solid manure (for poultry manure, it is assumed that no mobilisation or immobilisation occurs).
3. The total amount of TAN in manure is equal to the sum of TAN excretions from Steps 1 and 2. 4. The emissions of NH3 and other N compounds (N2, N2O and NOx) are calculated relative to the
total amount of TAN in the manure. 5. After deducting N losses in animal housing from the total TAN in manure, part of the manure is
treated (separated, incinerated, dried and/or digested) and stored, while another part of the manure is stored in outside storage facilities without treatment. In this case as well, N losses occur.
6. The amount of TAN remaining after the deduction of N losses in animal housing, outside storage and/or manure treatment is applied to land (Sections 10, 11 and 12).
The calculation steps are described in greater detail in the next section.
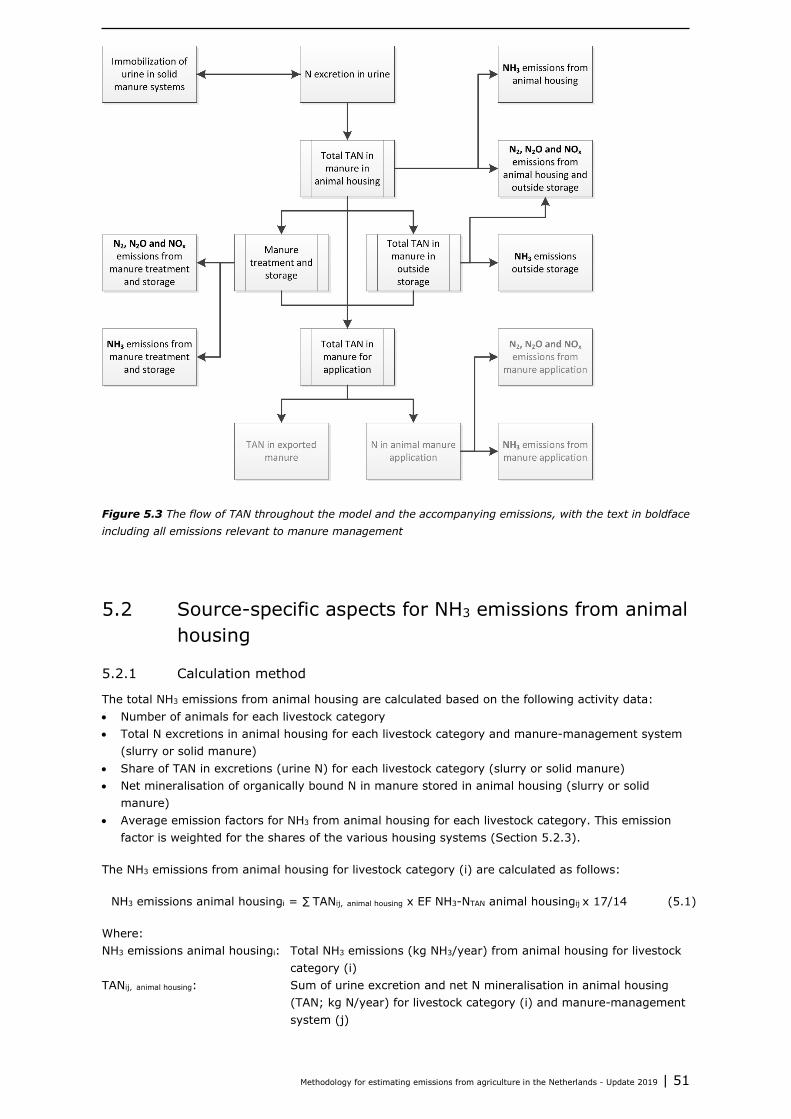
Methodology for estimating emissions from agriculture in the Netherlands - Update 2019 | 51
5.2 Source-specific aspects for NH3 emissions from animal housing
5.2.1 Calculation method
The total NH3 emissions from animal housing are calculated based on the following activity data: • Number of animals for each livestock category • Total N excretions in animal housing for each livestock category and manure-management system
(slurry or solid manure) • Share of TAN in excretions (urine N) for each livestock category (slurry or solid manure) • Net mineralisation of organically bound N in manure stored in animal housing (slurry or solid
manure) • Average emission factors for NH3 from animal housing for each livestock category. This emission
factor is weighted for the shares of the various housing systems (Section 5.2.3). The NH3 emissions from animal housing for livestock category (i) are calculated as follows:
NH3 emissions animal housingi = ∑ TANij, animal housing x EF NH3-NTAN animal housingij x 17/14 (5.1) Where: NH3 emissions animal housingi: Total NH3 emissions (kg NH3/year) from animal housing for livestock
category (i) TANij, animal housing: Sum of urine excretion and net N mineralisation in animal housing
(TAN; kg N/year) for livestock category (i) and manure-management system (j)
Figure 5.3 The flow of TAN throughout the model and the accompanying emissions, with the text in boldface including all emissions relevant to manure management

52 | WOt-technical report 148
EF NH3-NTAN animal housingij: NH3 emission factor (% of TAN) of animal housings for livestock category (i) and manure-management system (j)
17/14: Conversion factor from NH3-N to NH3 based on molecular weight The input of TAN is calculated differently, depending on the type of manure management. For slurry, a part of the fraction of organically bound N mineralises, while a part of the urine N immobilises in solid manure. In poultry manure, no mineralisation or immobilisation takes place.
5.2.2 Activity data
Livestock numbers Livestock numbers constitute the activity data for this emission source. Livestock numbers and their uncertainty estimates are described in Section 2.3
N excretion for each livestock category in a given year N excretions and uncertainty estimates are described in Section 2.
Fraction of TAN in total N excretions The excretion of urine N (TAN) is calculated annually, based on data concerning rations, the composition of the rations, the N digestibility of the feed components in the rations and the production parameters (Tamminga et al., 2000; Tamminga et al., 2004; Bannink et al., 2016; Bannink et al., 2017). Descriptions for historic years (before 2009) based on the calculation method using urine N excretions for cattle, pigs and poultry are provided in Annex 1, Annex 2 and Annex 3, respectively. For other grazing animals (horses, ponies, sheep and goats), the same methodology is used as for cattle. For rabbits and fur-bearing animals, no data were available for calculating the TAN fraction in N excretions. The share of total NH3 emissions produced by these animals is limited, and data on ration composition are difficult to obtain. The TAN fractions for these livestock categories are therefore estimated to be 70% of the excreted N (based on expert judgement).
Mineralisation/immobilisation of organic N It is assumed that the N mineralisation occurring during the storage of slurry in animal housing amounts to 10% of all organic N, based on research by Beline et al. (1998); see also Annex 4. For solid manure, an N immobilisation of 25% (or mineralisation of -25%) is assumed. For poultry and for slurry manure from fur-bearing animals, no mineralisation/immobilisation is assumed.
TAN in animal housing The input of TAN from animal housing for a given livestock category (i) with manure-management system (j) is calculated as follows:
TANi, slurry from animal housing = AAPi x FRACi, slurry manure management x (N excretioni x FRACi, TAN in urine + N excretioni x (1 - FRACi, TAN in urine) x N mineralisationj) (5.2a) TANi, solid from animal housing = AAPi x FRACi, solid manure management x (N excretioni x FRACi, TAN in urine + N excretioni x FRACi, TAN in urine x N mineralisationj) (5.2b)
Where TANi, slurry from animal housing : Sum of urine excretions and net N mineralisation in animal housing (TAN;
kg N/year) for livestock category (i) and manure-management system (j) TANi, solid from animal housing : Sum of urine excretions and net N mineralisation in animal housing (TAN;
kg N/year) for livestock category (i) and manure-management system (j) AAPi : Average animal population for livestock category (i) FRACi, slurry manure management : Fraction of slurry manure for livestock category (i) FRACi, solid manure management : Fraction of solid manure for livestock category (i) N excretionsi : N excretions (kg N/animal) in animal housing for livestock category (i) FRACi, TAN in urine : Fraction of urine N in total N excretions in animal housing for livestock
category (i) N mineralisationj : Net N mineralisation (% of organic N excretion) for manure-management
system (j)

Methodology for estimating emissions from agriculture in the Netherlands - Update 2019 | 53
For slurry manure, the net N mineralisation refers to the mineralisation of faeces into TAN. For solid manure, the net N mineralisation refers to the immobilisation of TAN into organically bound N.
5.2.3 Emission factors
NH3 emission factor for each livestock category and housing system Although different housing systems may have the same manure-management system, this does not necessarily mean that their emission factors will be the same. For this reason, a different emission factor is used for each type of housing system. The shares of housing systems for each livestock category are based on the Agricultural Census. If insufficient information on the shares of housing systems was available, other sources were used (e.g. environmental permit files for housing systems issued by the local authorities). The NH3 emission factors for housing systems are often derived from measurements resulting from the measurement protocol for emission factors specified in the legislative regulations for ammonia and animal husbandry (in Dutch, Regeling ammoniak en veehouderij or RAV). Where possible, data from the most recent NH3 emission factors in the RAV have been used. If new information about a certain livestock category or housing system is available, however, the emission factor can override the figure reported in the RAV. The NH3 emission factors derived from the measurements are expressed in kg for each animal place. These figures are converted into an emission factor as a percentage of TAN, taking into account the TAN excretions of the housed animals in the year for which the emission factors were determined, as well as the housing occupancy (Velthof et al., 2009). To calculate the emission factor for all animal housing for livestock category (i) and manure-management system (slurry or solid manure; j), the following calculation is performed:
EF NH3-Ntan animal housingij = Σ (EF NH3, animal housingik x (14/17) / (FRACk, occupancy, RAV year)) / TANi, animal housing, RAV year x FRACik, animal housing (5.3)
Where: EF NH3–NTAN animal housingij: NH3 emission factor (% of TAN excretions) for livestock category (i) and
manure-management system (j) EF NH3, animal housingik : NH3 emission factor (kg NH3/animal place/year) for livestock category (i)
and housing system (k) FRACk, occupancy, RAV year : Fraction of occupancy for each animal place for livestock category (i) and
housing system (k), for the year in which the EF NH3 for animal housingik was determined
TANi, animal housing, RAV year : Sum of urine excretions and net N mineralisation in animal housing (TAN; kg N/year) for livestock category (i) for the year in which the emission factor for animal housing was determined
FRACik, animal housing : Fraction of housing system (k) for livestock category (i) 14/17 : Conversion factor from NH3 to NH3-N, based on molecular weight Additional details on the emission factor calculations are provided in Annex 5, Annex 6 and Annex 7. Research conducted by an enforcement agency revealed that many air scrubbers were not being used properly (Handhavingsamenwerking Noord-Brabant, 2013; 2015). For this reason, implementation grades were corrected. For the years up to and including 2009, it was assumed that 40% of the scrubbers did not function, decreasing by 8% per year up to 16% in 2012. From then on, a decrease of 4% per year was assumed until 2016, when all scrubbers were assumed to operate properly, given that electronic monitoring was compulsory on all equipment from that time. Melse et al. (2018) demonstrate that combined air scrubbers (in most cases, a biological air scrubber with a water curtain) do not achieve an efficiency level of 85% NH3 reduction, but only a reduction of 59%. The emission factors for animal housing take this into account.

54 | WOt-technical report 148
Manure-management system The proportion of slurry and solid manure depends on the housing systems used. Data on these systems are derived from the Agricultural Census. The length of the grazing period in days per year and hours per day indicate the fraction of manure excreted on pasture land, as indicated by the WUM.
Occupancy The occupancy fraction of the different housing systems is presented in Annex 8, based on Van Bruggen et al. (2015). Occupancy refers to the number of animal places that are actually occupied by animals during the year. There are several reasons to explain why an animal housing unit might not be filled to capacity. In most cases, the reason is related to a period in which the animal housing unit is unoccupied between production rounds. Loss of animals, earlier selection of animals or other reasons for vacancies during a period of growth and rearing (as described in Stichting Groen Label, 1996) and in Ogink et al., 2008) are not considered.
5.2.4 Uncertainty
Calculation of the overall uncertainty of NH3 emissions from animal housing begins by estimating the uncertainty value for TAN excretions for each aggregated livestock category over a given manure type. These uncertainty estimates are subsequently multiplied by the uncertainty value for the NH3 emission factor for animal housing. This method was selected because the emission factors of housing systems for the various livestock subcategories can originate from the same activity data, and they are therefore dependent on each other. The uncertainty estimates for animal numbers, N excretions and fractions of manure types are the inputs for calculating the uncertainty of NH3 from animal housing (see Section 2.4.3). In addition, the uncertainty of the fractions of TAN (10%), mineralisation (150%) and the emission factor (40%) are needed. The uncertainty value for the emission factor is an estimate of an emission factor for a given housing system, expressed in kg NH3 per animal. This estimate is used for the average emission factor over all housing systems based on TAN. This method of aggregation is used to include dependencies, as described in Section 2.4. Some of the emission factors for housing systems are based on the same emission measurements. Results for manure management as a whole (animal housing, manure treatment and outside storage) are presented in Table 5.2. Outcomes for each subsector are reported in Annex 11.
5.3 Source-specific aspects for NH3 emissions from manure treatment
5.3.1 Calculation method
The NH3 emissions from manure treatment are calculated based on the amount of N in the manure used in manure treatment. The following six types of manure treatment are used: manure separation, nitrification/denitrification, production of mineral concentrates, incineration, pelleting/drying and manure digestion. For manure separation and pelleting/drying, NH3 is emitted during both the treatment process and the storage of manure-treatment products. For manure incineration and digestion, only additional storage emissions occur. In the interest of simplicity, emissions during processing and subsequent storage are combined and expressed as a single emission factor based on the N that is treated. The combined NH3 emissions from the manure treatment (o) for livestock category (i) are calculated as follows:
NH3 emissions manure treatment = ∑ Nio, manure treatment x EF NH3-N manure treatmentio (5.4) Where: NH3 emissions manure treatment: NH3 emissions from manure treated (kg NH3/year)
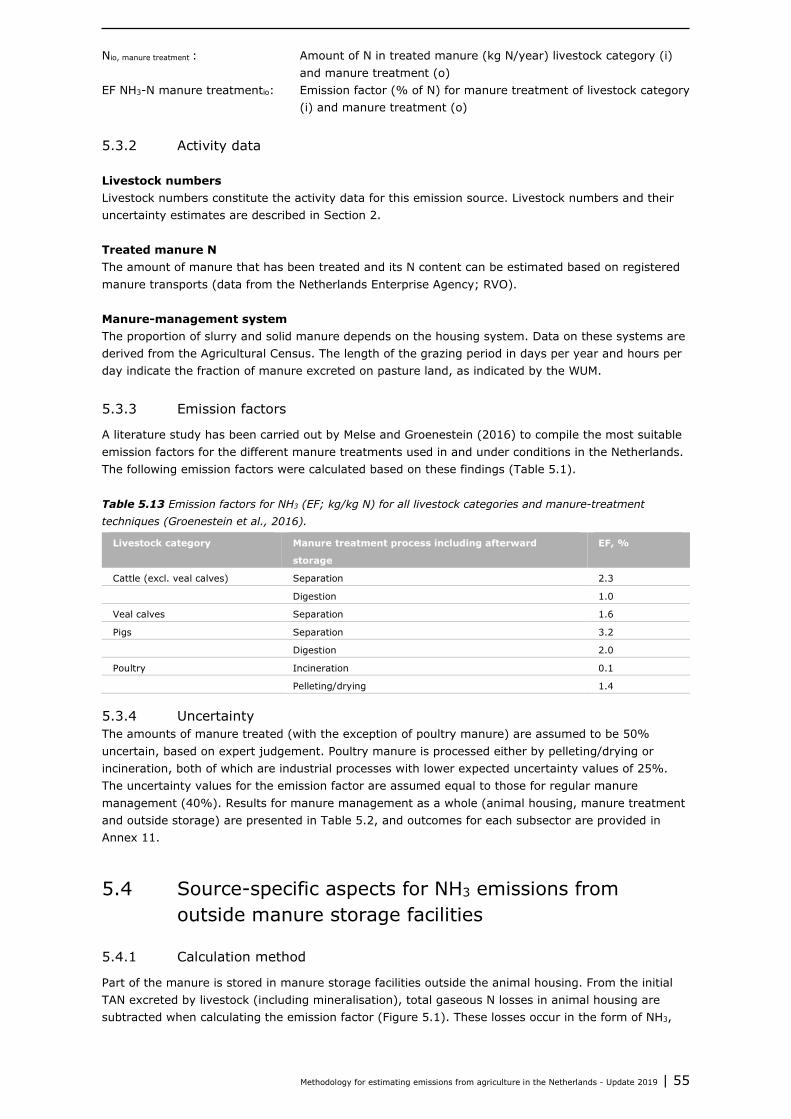
Methodology for estimating emissions from agriculture in the Netherlands - Update 2019 | 55
Nio, manure treatment : Amount of N in treated manure (kg N/year) livestock category (i) and manure treatment (o)
EF NH3-N manure treatmentio: Emission factor (% of N) for manure treatment of livestock category (i) and manure treatment (o)
5.3.2 Activity data
Livestock numbers Livestock numbers constitute the activity data for this emission source. Livestock numbers and their uncertainty estimates are described in Section 2.
Treated manure N The amount of manure that has been treated and its N content can be estimated based on registered manure transports (data from the Netherlands Enterprise Agency; RVO).
Manure-management system The proportion of slurry and solid manure depends on the housing system. Data on these systems are derived from the Agricultural Census. The length of the grazing period in days per year and hours per day indicate the fraction of manure excreted on pasture land, as indicated by the WUM.
5.3.3 Emission factors
A literature study has been carried out by Melse and Groenestein (2016) to compile the most suitable emission factors for the different manure treatments used in and under conditions in the Netherlands. The following emission factors were calculated based on these findings (Table 5.1). Table 5.13 Emission factors for NH3 (EF; kg/kg N) for all livestock categories and manure-treatment techniques (Groenestein et al., 2016).
Livestock category Manure treatment process including afterward
storage
EF, %
Cattle (excl. veal calves) Separation 2.3
Digestion 1.0
Veal calves Separation 1.6
Pigs Separation 3.2
Digestion 2.0
Poultry Incineration 0.1
Pelleting/drying 1.4
5.3.4 Uncertainty The amounts of manure treated (with the exception of poultry manure) are assumed to be 50% uncertain, based on expert judgement. Poultry manure is processed either by pelleting/drying or incineration, both of which are industrial processes with lower expected uncertainty values of 25%. The uncertainty values for the emission factor are assumed equal to those for regular manure management (40%). Results for manure management as a whole (animal housing, manure treatment and outside storage) are presented in Table 5.2, and outcomes for each subsector are provided in Annex 11.
5.4 Source-specific aspects for NH3 emissions from outside manure storage facilities
5.4.1 Calculation method
Part of the manure is stored in manure storage facilities outside the animal housing. From the initial TAN excreted by livestock (including mineralisation), total gaseous N losses in animal housing are subtracted when calculating the emission factor (Figure 5.1). These losses occur in the form of NH3,
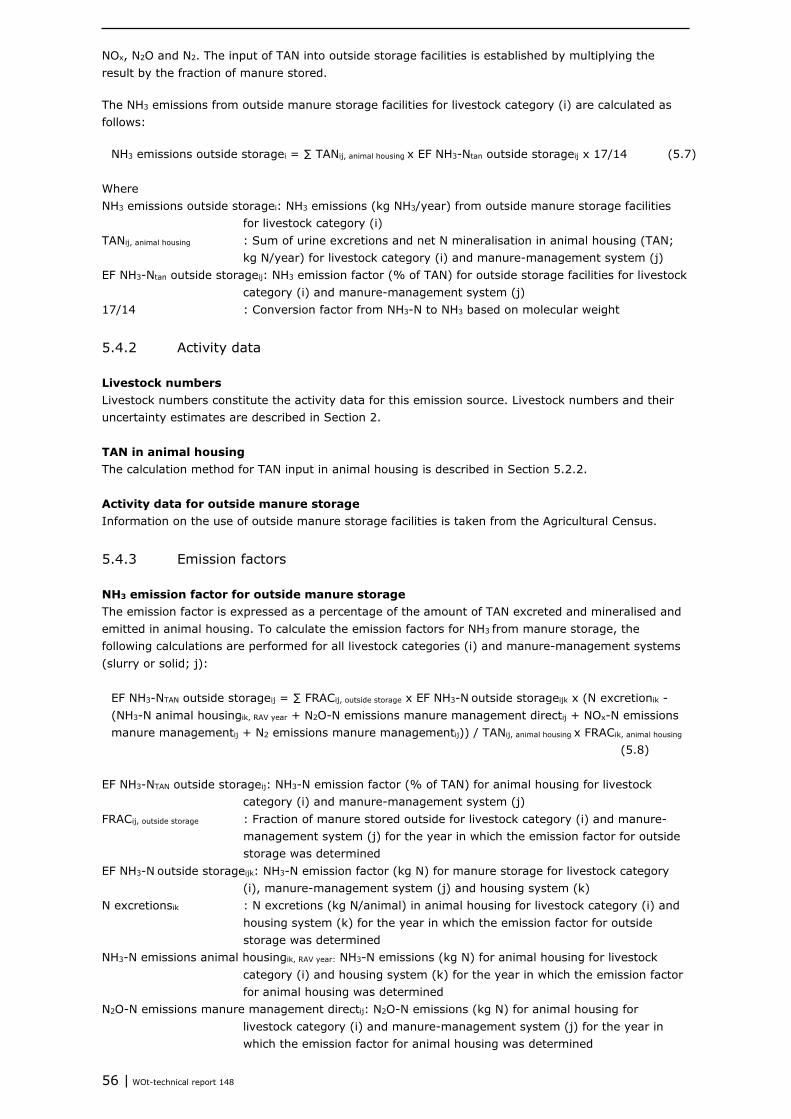
56 | WOt-technical report 148
NOx, N2O and N2. The input of TAN into outside storage facilities is established by multiplying the result by the fraction of manure stored. The NH3 emissions from outside manure storage facilities for livestock category (i) are calculated as follows:
NH3 emissions outside storagei = ∑ TANij, animal housing x EF NH3-Ntan outside storageij x 17/14 (5.7) Where NH3 emissions outside storagei: NH3 emissions (kg NH3/year) from outside manure storage facilities
for livestock category (i) TANij, animal housing : Sum of urine excretions and net N mineralisation in animal housing (TAN;
kg N/year) for livestock category (i) and manure-management system (j) EF NH3-Ntan outside storageij: NH3 emission factor (% of TAN) for outside storage facilities for livestock
category (i) and manure-management system (j) 17/14 : Conversion factor from NH3-N to NH3 based on molecular weight
5.4.2 Activity data
Livestock numbers Livestock numbers constitute the activity data for this emission source. Livestock numbers and their uncertainty estimates are described in Section 2.
TAN in animal housing The calculation method for TAN input in animal housing is described in Section 5.2.2.
Activity data for outside manure storage Information on the use of outside manure storage facilities is taken from the Agricultural Census.
5.4.3 Emission factors
NH3 emission factor for outside manure storage The emission factor is expressed as a percentage of the amount of TAN excreted and mineralised and emitted in animal housing. To calculate the emission factors for NH3 from manure storage, the following calculations are performed for all livestock categories (i) and manure-management systems (slurry or solid; j):
EF NH3-NTAN outside storageij = ∑ FRACij, outside storage x EF NH3-N outside storageijk x (N excretionik - (NH3-N animal housingik, RAV year + N2O-N emissions manure management directij + NOx-N emissions
manure managementij + N2 emissions manure managementij)) / TANij, animal housing x FRACik, animal housing
(5.8) EF NH3-NTAN outside storageij: NH3-N emission factor (% of TAN) for animal housing for livestock
category (i) and manure-management system (j) FRACij, outside storage : Fraction of manure stored outside for livestock category (i) and manure-
management system (j) for the year in which the emission factor for outside storage was determined
EF NH3-N outside storageijk: NH3-N emission factor (kg N) for manure storage for livestock category (i), manure-management system (j) and housing system (k)
N excretionsik : N excretions (kg N/animal) in animal housing for livestock category (i) and housing system (k) for the year in which the emission factor for outside storage was determined
NH3-N emissions animal housingik, RAV year: NH3-N emissions (kg N) for animal housing for livestock category (i) and housing system (k) for the year in which the emission factor for animal housing was determined
N2O-N emissions manure management directij: N2O-N emissions (kg N) for animal housing for livestock category (i) and manure-management system (j) for the year in which the emission factor for animal housing was determined

Methodology for estimating emissions from agriculture in the Netherlands - Update 2019 | 57
NOx-N emissions manure managementij: NOx-N emissions (kg N) for animal housing for livestock category (i) and manure-management system (j) for the year in which the emission factor for outside storage was determined
N2 emissions manure managementij: N2 emissions (kg N) for animal housing for livestock category (i) and manure-management system (j) for the year in which the emission factor for outside storage was determined
FRACik, animal housing : Fraction of housing system (k) within animal category (i) TANij, animal housing : Sum of urine excretions and net N mineralisation in animal housing (TAN;
kg N/year) for livestock category (i) and manure-management system (j) for the year in which the emission factor for outside storage was determined
N2O, NOx and N2 emissions The calculation methods for emissions of NOx and N2O are described in Sections 6 and 7, respectively. The N2-N emissions are 10 times greater than the N2O-N emissions for slurry manure and 5 times greater than for solid manure (Oenema et al., 2000).
Fraction of manure stored outside Information on the fractions of manure stored outside animal housing, are taken from the Agricultural Census and complemented with data taken from literature. An overview of the percentages and sources is provided in Annex 9.
5.4.4 Uncertainty
Uncertainty values for total emissions of N2O, NOx and N2 are estimated at 100% (based on expert judgement). The total uncertainty is estimated, as uncertainty estimates are calculated only for N2O, NOx and NH3 emissions from animal housing, and not for N2 emissions. The outside storage of slurry depends on storage capacity in relation to manure production. Storage capacity is queried in the Agricultural Census. Uncertainty values for storage fractions depend on manure production, the responses of farmers to the question in the Agricultural Census and the use of such outside storage. Uncertainty values are estimated at 25% for slurry and 50% for solid manure (based on expert judgement). The uncertainty value for the emission factor for outside storage facilities is estimated at 200%. The emission factor is based on a limited amount of old data (and expert judgement). From data in Groot Koerkamp and Kroodsma (2000), the uncertainty value for the outside storage of solid manure from broilers can be calculated at 35%. It is assumed that other solid poultry manure has the same uncertainty value (based on expert judgement).
5.5 Uncertainty estimates
In the NEMA, the uncertainty values for emissions from animal housing and outside manure storage facilities are calculated separately, in order to account for differences in circumstances and thus in the associated emissions. The output of the model is at the level of detail shown in Table 5.1 and Annex 11 (available through www.prtr.nl).
Aggregation of emissions for reporting For the respective livestock categories distinguished in the NFR, emissions from animal housing, manure treatment and outside storage are summed to arrive at the total of all NH3 emissions from manure management.
Aggregation of uncertainty estimates for NH3 from animal housing, manure treatment and outside manure storage Uncertainty estimates calculated for emissions from animal housing, manure treatment and outside manure storage facilities are aggregated to the NFR categories, as shown in Table 5.2.

58 | WOt-technical report 148
Table 5.14 Uncertainty values for activity data (U AD; livestock numbers), implied emission factors (U IEF) and NH3 emissions (U emissions) from manure management
EMEP Livestock category U AD U IEF U emissions
3B1a Dairy cattle 2% 45% 45%
3B1b Non-dairy cattle 1% 29% 29%
3B2 Sheep 5% 106% 106%
3B3 Swine 8% 36% 37%
3B4d Goats 5% 90% 90%
3B4e Horses 4% 78% 78%
3B4f Mules and asses 5% 88% 88%
3B4gi Laying hens 4% 44% 44%
3B4gii Broilers 10% 49% 50%
3B4giii Turkeys 10% 44% 45%
3B4giv Other poultry 10% 46% 47%
3B4h Other animals 5% 47% 47%
Total 20%
Methodology for estimating emissions from agriculture in the Netherlands - Update 2019 | 59
6 NOx emissions from manure management (NFR category 3B)
6.1 Scope and definition This section provides a description of the methods and working processes for determining NOx emissions from manure management, using the following NFR categories: • 3B1a Dairy cattle • 3B1b Non-dairy cattle • 3B2 Sheep • 3B3 Swine • 3B4d Goats • 3B4e Horses • 3B4f Mules and asses • 3B4gi Laying hens • 3B4gii Broilers • 3B4giii Turkeys • 3B4giv Other poultry • 3B4h Other animals Category 3B4a (Buffalo) is reported as ‘not occurring’ (NO), as these animals are not kept commercially in the Netherlands. Category 3B4h (Other animals) consists of fur-bearing animals and rabbits. Emissions reported under Category 3B concern only the NOx emissions from manure produced in animal housing and then stored temporarily and/or treated before being transported elsewhere. The NOx emissions resulting from manure production on pasture land are reported under Category 3D (NOx emissions from soil). Although emissions are reported as NO (nitrogen monoxide) in the NEMA, they are referred to as NOx in this report, in order to prevent confusion with the notation key NO (‘Not Occurring’). Nitrous oxide emissions from livestock manure-management depend on the nitrogen and carbon content of the manure, the manure-treatment method used and the amount of time the manure is stored. During storage, the manure often becomes low in oxygen, thereby slowing the nitrification process and maintaining a low level of denitrification. Nitrification is the process whereby ammonia (NH4+) is converted into nitrate by bacteria under conditions of high oxygen. In this process, nitrous oxide can be formed as a by-product, particularly if the nitrification is limited through lack of oxygen. Nitrification does not require the presence of any organic substances (volatile solids). Straw-rich solid manure and poultry manure can possess a relatively open and loose structure, allowing O2 to diffuse far more easily than it does in slurry, thus enabling nitrification. Denitrification is the process whereby bacteria can convert nitrate (NO3-) into the gaseous nitrogen compound N2 under conditions of low oxygen, with NOx as a by-product. Organic substances (volatile solids) are used as an energy source. Denitrification in animal housing and manure storage facilities depends entirely on the nitrification process, which must supply the oxidised nitrogen compounds.
6.2 Source-specific aspects for NOx emissions from manure storage
6.2.1 Calculation method
In contrast to the case of NH3 from animal housing and outside manure storage, emissions of NOx are calculated for animal housings and outside manure storages combined. The following formula is used to calculate NOx emissions from animal manure:
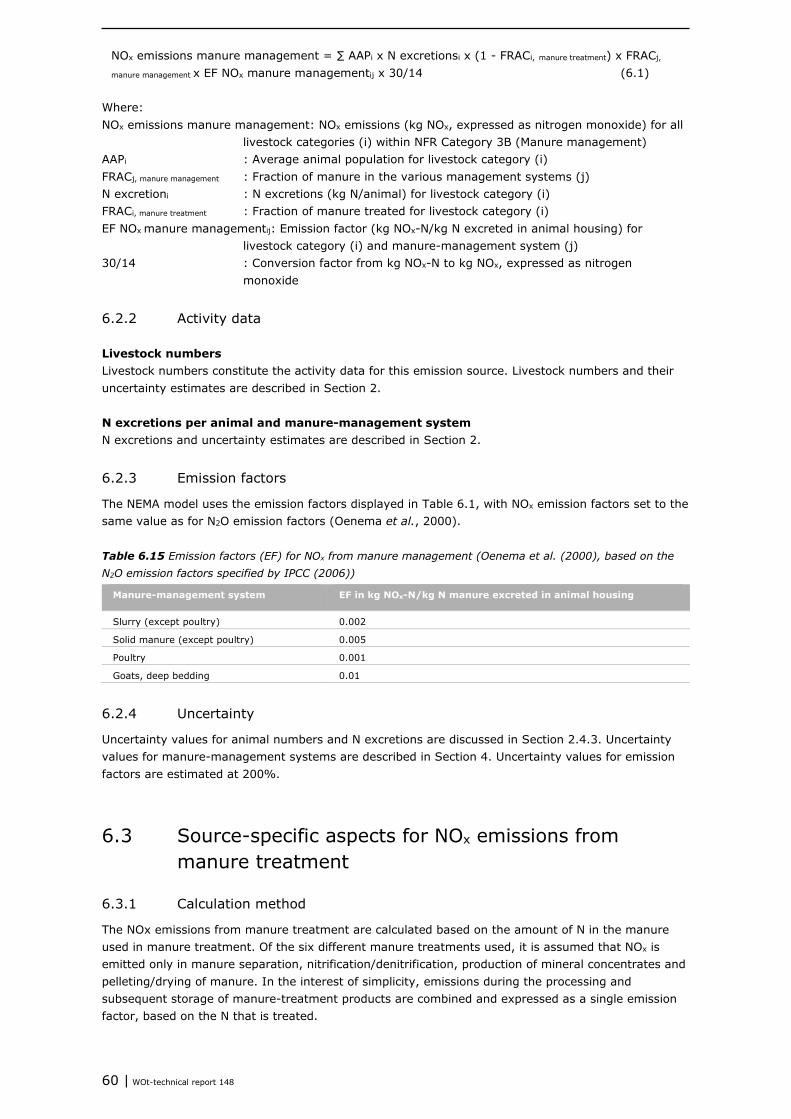
60 | WOt-technical report 148
NOx emissions manure management = ∑ AAPi x N excretionsi x (1 - FRACi, manure treatment) x FRACj,
manure management x EF NOx manure managementij x 30/14 (6.1) Where: NOx emissions manure management: NOx emissions (kg NOx, expressed as nitrogen monoxide) for all
livestock categories (i) within NFR Category 3B (Manure management) AAPi : Average animal population for livestock category (i) FRACj, manure management : Fraction of manure in the various management systems (j) N excretioni : N excretions (kg N/animal) for livestock category (i) FRACi, manure treatment : Fraction of manure treated for livestock category (i) EF NOx manure managementij: Emission factor (kg NOx-N/kg N excreted in animal housing) for
livestock category (i) and manure-management system (j) 30/14 : Conversion factor from kg NOx-N to kg NOx, expressed as nitrogen
monoxide
6.2.2 Activity data
Livestock numbers Livestock numbers constitute the activity data for this emission source. Livestock numbers and their uncertainty estimates are described in Section 2.
N excretions per animal and manure-management system N excretions and uncertainty estimates are described in Section 2.
6.2.3 Emission factors
The NEMA model uses the emission factors displayed in Table 6.1, with NOx emission factors set to the same value as for N2O emission factors (Oenema et al., 2000). Table 6.15 Emission factors (EF) for NOx from manure management (Oenema et al. (2000), based on the N2O emission factors specified by IPCC (2006))
Manure-management system EF in kg NOx-N/kg N manure excreted in animal housing
Slurry (except poultry) 0.002
Solid manure (except poultry) 0.005
Poultry 0.001
Goats, deep bedding 0.01
6.2.4 Uncertainty
Uncertainty values for animal numbers and N excretions are discussed in Section 2.4.3. Uncertainty values for manure-management systems are described in Section 4. Uncertainty values for emission factors are estimated at 200%.
6.3 Source-specific aspects for NOx emissions from manure treatment
6.3.1 Calculation method
The NOx emissions from manure treatment are calculated based on the amount of N in the manure used in manure treatment. Of the six different manure treatments used, it is assumed that NOx is emitted only in manure separation, nitrification/denitrification, production of mineral concentrates and pelleting/drying of manure. In the interest of simplicity, emissions during the processing and subsequent storage of manure-treatment products are combined and expressed as a single emission factor, based on the N that is treated.
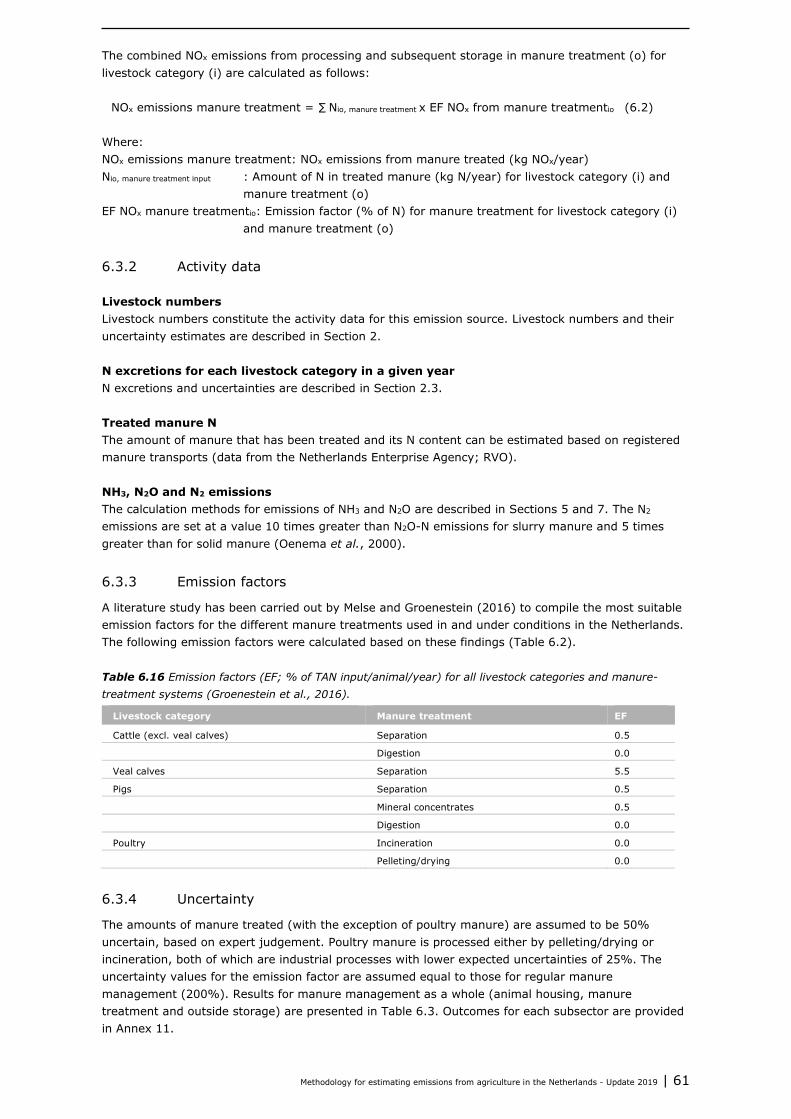
Methodology for estimating emissions from agriculture in the Netherlands - Update 2019 | 61
The combined NOx emissions from processing and subsequent storage in manure treatment (o) for livestock category (i) are calculated as follows:
NOx emissions manure treatment = ∑ Nio, manure treatment x EF NOx from manure treatmentio (6.2) Where: NOx emissions manure treatment: NOx emissions from manure treated (kg NOx/year) Nio, manure treatment input : Amount of N in treated manure (kg N/year) for livestock category (i) and
manure treatment (o) EF NOx manure treatmentio: Emission factor (% of N) for manure treatment for livestock category (i)
and manure treatment (o)
6.3.2 Activity data
Livestock numbers Livestock numbers constitute the activity data for this emission source. Livestock numbers and their uncertainty estimates are described in Section 2.
N excretions for each livestock category in a given year N excretions and uncertainties are described in Section 2.3.
Treated manure N The amount of manure that has been treated and its N content can be estimated based on registered manure transports (data from the Netherlands Enterprise Agency; RVO).
NH3, N2O and N2 emissions The calculation methods for emissions of NH3 and N2O are described in Sections 5 and 7. The N2 emissions are set at a value 10 times greater than N2O-N emissions for slurry manure and 5 times greater than for solid manure (Oenema et al., 2000).
6.3.3 Emission factors
A literature study has been carried out by Melse and Groenestein (2016) to compile the most suitable emission factors for the different manure treatments used in and under conditions in the Netherlands. The following emission factors were calculated based on these findings (Table 6.2). Table 6.16 Emission factors (EF; % of TAN input/animal/year) for all livestock categories and manure-treatment systems (Groenestein et al., 2016).
Livestock category Manure treatment EF
Cattle (excl. veal calves) Separation 0.5
Digestion 0.0
Veal calves Separation 5.5
Pigs Separation 0.5
Mineral concentrates 0.5
Digestion 0.0
Poultry Incineration 0.0
Pelleting/drying 0.0
6.3.4 Uncertainty
The amounts of manure treated (with the exception of poultry manure) are assumed to be 50% uncertain, based on expert judgement. Poultry manure is processed either by pelleting/drying or incineration, both of which are industrial processes with lower expected uncertainties of 25%. The uncertainty values for the emission factor are assumed equal to those for regular manure management (200%). Results for manure management as a whole (animal housing, manure treatment and outside storage) are presented in Table 6.3. Outcomes for each subsector are provided in Annex 11.
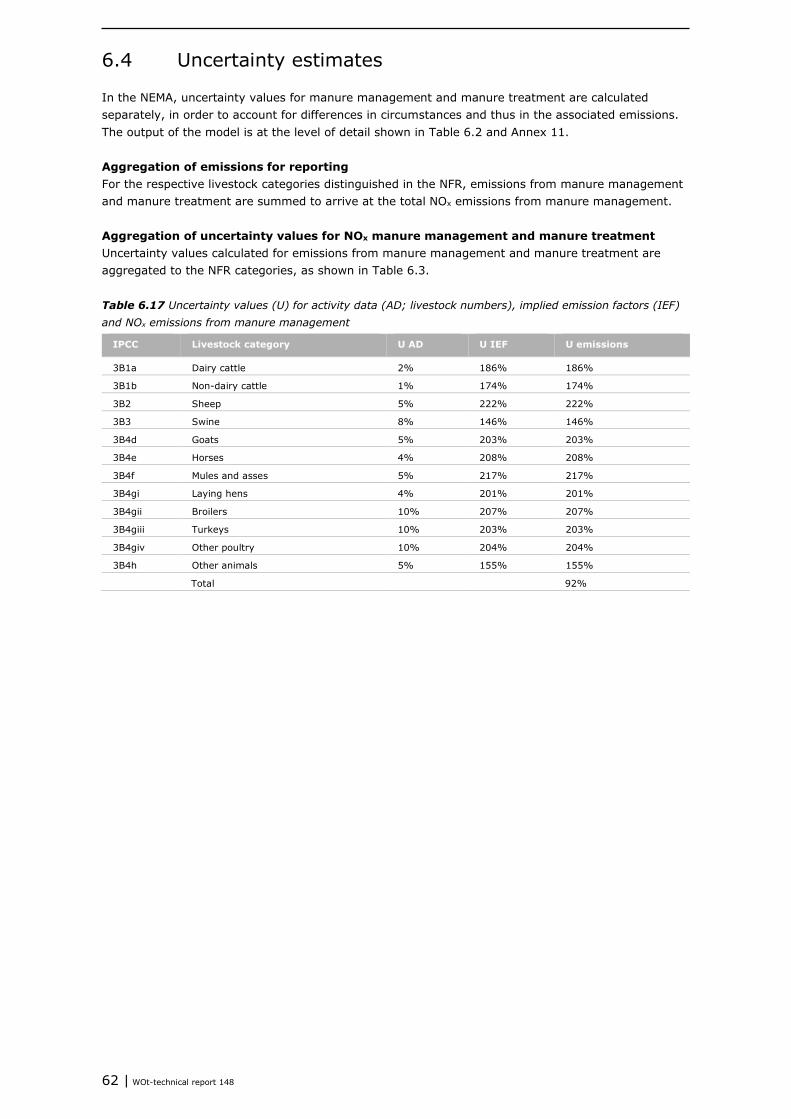
62 | WOt-technical report 148
6.4 Uncertainty estimates
In the NEMA, uncertainty values for manure management and manure treatment are calculated separately, in order to account for differences in circumstances and thus in the associated emissions. The output of the model is at the level of detail shown in Table 6.2 and Annex 11.
Aggregation of emissions for reporting For the respective livestock categories distinguished in the NFR, emissions from manure management and manure treatment are summed to arrive at the total NOx emissions from manure management.
Aggregation of uncertainty values for NOx manure management and manure treatment Uncertainty values calculated for emissions from manure management and manure treatment are aggregated to the NFR categories, as shown in Table 6.3. Table 6.17 Uncertainty values (U) for activity data (AD; livestock numbers), implied emission factors (IEF) and NOx emissions from manure management
IPCC Livestock category U AD U IEF U emissions
3B1a Dairy cattle 2% 186% 186%
3B1b Non-dairy cattle 1% 174% 174%
3B2 Sheep 5% 222% 222%
3B3 Swine 8% 146% 146%
3B4d Goats 5% 203% 203%
3B4e Horses 4% 208% 208%
3B4f Mules and asses 5% 217% 217%
3B4gi Laying hens 4% 201% 201%
3B4gii Broilers 10% 207% 207%
3B4giii Turkeys 10% 203% 203%
3B4giv Other poultry 10% 204% 204%
3B4h Other animals 5% 155% 155%
Total 92%
Methodology for estimating emissions from agriculture in the Netherlands - Update 2019 | 63
7 N2O emissions from manure management (CRF sector 3B)
7.1 Scope and definition
This provides a description of the methods and working processes for determining N2O emissions from manure management. The following source categories are distinguished in the CRF: • Direct emissions
3B1a Mature dairy cattle 3B1b Other mature cattle 3B1c Growing cattle 3B2 Sheep 3B3 Swine 3B4 Other livestock
• Indirect emissions 3B5 Indirect N2O emissions
Source Category 3B4 (Other livestock) consists of poultry, goats, horses, mules and asses, fur-bearing animals and rabbits. Emissions reported under Category 3B concern only the N2O emissions from manure produced in animal housing and then stored temporarily and/or treated before being transported elsewhere. The nitrous oxide resulting from manure production on pasture land is reported under Category 3D (Section 12; N2O emissions from crop production and agricultural soils). Nitrous oxide emissions from livestock manure-management depend on the nitrogen and carbon content of the manure, the amount of time the manure is stored and the treatment method used. During storage, the manure often becomes low in oxygen, thereby slowing the nitrification process and maintaining a low level of denitrification. Nitrification is the process whereby ammonia (NH4+) is converted into nitrate by bacteria under conditions of high oxygen. In this process, nitrous oxide can be formed as a by-product, particularly if the nitrification is limited through lack of oxygen. Nitrification does not require the presence of any organic substances (volatile solids). Straw-rich solid manure and poultry manure can possess a relatively open and loose structure, allowing O2 to diffuse far more easily than it does in slurry, thus enabling nitrification. Denitrification is the process whereby bacteria can convert nitrate (NO3-) into the gaseous nitrogen compound N2 under conditions of low oxygen, with nitrous oxide as a by-product. Organic substances (volatile solids) are used as an energy source. Denitrification in animal housing and manure storage facilities depends entirely on the nitrification process, which must supply the oxidised nitrogen compounds. N2O emissions from solid manure are higher than those from slurry, as very little nitrification occurs in the latter, due to the lack of oxygen.

64 | WOt-technical report 148
7.2 Source-specific aspects for direct N2O emissions from manure storage
7.2.1 Calculation method
Direct N2O emissions from animal manure are calculated as follows:
N2O emissions manure management direct = ∑ AAPi x N excretionsi x (1 - FRACi, manure treatment) x FRACj, manure management x EF N2O manure management directij x 44/28 (7.1)
Where: N2O manure emissions management: N2O emissions for all livestock categories (i) within NFR
Category 3B (Manure management) AAPi : Average animal population for livestock category (i) N excretionsi : N excretions (kg N/animal) for livestock category (i) FRACi, manure treatment : Fraction of manure that is treated for livestock category (i) FRACj, manure management : Fraction of manure in the various management systems (j) EF N2O manure management directij: Emission factor (kg N2O-N/kg N excreted manure) for livestock
category (i) and manure-management system (j) 44/28 : Conversion factor from kg N2O-N to kg N2O
Comparison to IPCC methodology The aforementioned method is consistent with that described by the IPCC (IPCC (2006); p. 10.52). The total amount of manure produced is therefore multiplied by an emission factor without subtracting NH3 and NOx emissions. Default (Tier 1) values are used for the emission factors.
7.2.2 Activity data
Livestock numbers Livestock numbers constitute the activity data for this emission source. Livestock numbers and their uncertainty estimates are described in Section 2.
N excretions for each animal and manure-management system N excretions and uncertainty values are described in Section 2.
7.2.3 Emission factors for direct N2O emissions from manure management
The NEMA model uses the default IPCC 2006 emission factors, as presented in Table 7.1. The researchers involved in the NEMA have investigated whether better emission factors for N2O from manure management are available in the Netherlands. Table 7.18 Emission factors (EF) for N2O from manure management IPCC (2006)
Livestock category EF in kg N2O-N/kg N manure excreted in animal housing
Slurry
Cattle 0.002
Pigs 0.002
Laying hens 0.001
Fur-bearing animals 0.002
Solid manure
Cattle 0.005
Pigs 0.005
Poultry 0.001
Sheep 0.005
Goats, deep bedding 0.010
Horses, mules and asses 0.005
Rabbits 0.005

Methodology for estimating emissions from agriculture in the Netherlands - Update 2019 | 65
The available data suggest that emissions of N2O from animal housing and outside manure storage facilities could be lower than the defaults. Due to the limited data available, however, it was decided to maintain the current methodology based on the IPCC Guidelines and Oenema et al. (2000), thus resulting in a conservative estimate of emissions.
7.2.4 Uncertainty
Uncertainty values for animal numbers and N excretions are discussed in Section 2.4.3. Uncertainty values for manure-management systems are described in Section 4. Uncertainty values for emission factors are estimated at 200% (IPCC, 2006).
7.3 Source-specific aspects for direct N2O emissions from manure treatment
7.3.1 Calculation method
The N2O emissions from manure treatment are calculated based on the amount of N in the manure used in manure treatment. Of the six different manure treatments used, it is assumed that N2O is emitted only in manure separation, nitrification/denitrification, production of mineral concentrates and pelleting/drying of manure. In the interest of simplicity, emissions during processing and subsequent storage are combined and expressed as a single emission factor, based on the N that is treated. The combined N2O emissions from processing and subsequent storage in manure treatment (o) for livestock category (i) are calculated as follows:
N2O emissions manure treatment = ∑ Nio, manure treatment x EF N2O manure treatmentio (7.2) Where: N2O emissions manure treatment: N2O emissions from manure treated (kg N2O/year) Nio, manure treatment : Amount of N in treated manure (kg N/year) for livestock category (i) and
manure treatment (o) EF NOx manure treatmentio: N2O emission factor (% of N) for manure treatment for livestock category
(i) and manure treatment (o)
7.3.2 Activity data
Livestock numbers Livestock numbers constitute the activity data for this emission source. Livestock numbers and their uncertainty estimates are described in Section 2.
N excretions for each livestock category in a given year N excretions and uncertainty values are described in Section 2.3.
Treated manure N The amount of manure that has been treated and its N content can be estimated based on registered manure transports (data from the Netherlands Enterprise Agency; RVO).
NH3, NOx and N2 emissions The calculation methods for emissions of NH3 and NOx are described in Sections 5 and 6, respectively. The N2-N emissions are set at values 10 times greater than N2O-N emissions for slurry manure and 5 times greater than for solid manure (Oenema et al., 2000).

66 | WOt-technical report 148
7.3.3 Emission factors
A literature study has been carried out by Melse and Groenestein (2016) to compile the most suitable emission factors for the different manure treatments used in and under conditions in the Netherlands. The following emission factors were calculated based on these findings (Table 7.2). Table 7.19 Emission factors (EF; % of TAN input/animal/year) for all livestock categories and manure-treatment processes (Groenestein et al., 2016).
Livestock category Manure treatment EF
Cattle (excl. veal calves) Separation 0.5
Digestion 0.0
Veal calves Separation 5.5
Pigs Separation 0.5
Mineral concentrates 0.5
Digestion 0.0
Poultry Incineration 0.0
Pelleting/drying 0.0
7.3.4 Uncertainty The amounts of manure treated (with the exception of poultry manure) are assumed to be 50% uncertain, based on expert judgement. Poultry manure is processed either by pelleting/drying or incineration, both of which are industrial processes with lower expected uncertainties of 25%. The uncertainty values for the emission factor are assumed equal to those for regular manure management (200%). Results for manure management as a whole (animal housing, manure treatment and outside storage) are presented in Table 7.3. Outcomes for each subsector are provided in Annex 11.
7.4 Source-specific aspects for indirect N2O emissions from manure management
7.4.1 Calculation method
Indirect N2O emissions manure management are calculated by multiplying the total emissions of NH3 and NOx from animal housing, manure treatment and NH3 from manure storage by an emission factor:
N2O emissions manure management indirect = (NH3 emissions manure management x 14/17 + NOx emissions manure management direct x 14/30) x EF N2O manure management indirect x 44/28 (7.5)
Where: N2O emissions manure management indirect: Indirect nitrous oxide emissions (kg N2O-N/year)
following atmospheric deposition of NH3 and NOx from manure management NH3 emissions manure management: NH3 emissions (kg NH3/year) for all defined livestock categories
(i) within NFR Category 3B (Manure management) 14/17 : Conversion factor from NH3 to NH3-N NOx emissions manure management direct: NOx emissions (kg NOx/year, expressed as nitrogen
monoxide) for all defined livestock categories (i) within NFR Category 3B (Manure management)
14/30 : Conversion factor from NOx (expressed as nitrogen monoxide) to NOx-N EF N2O manure management indirect: Nitrous oxide emission factor for indirect emission following
atmospheric deposition of NH3 and NOx 44/28 : Conversion factor from kg N2O-N to kg N2O
Comparison to IPCC methodology For indirect emissions from manure management, only atmospheric deposition is calculated for the Netherlands. The IPCC Guidelines also calculate leaching and runoff from manure storage. In the

Methodology for estimating emissions from agriculture in the Netherlands - Update 2019 | 67
Netherlands, all slurry manure is stored underneath animal houses or in fully closed outside storage tanks (this is an obligation of the EU Nitrates Directive). Solid manure must be stored on concrete plates, with runoff directed into a slurry pit or separate tank.
7.4.2 Activity data
The calculations for NH3 and NOx emissions are described in Sections 5 and 6.
7.4.3 Emission factors
The IPCC 2006 default emission factors of 0.01 kg N2O-N/kg N emitted as NH3 and NOx from animal housing and outside manure storage facilities are used.
7.4.4 Uncertainty
The uncertainty value for total NH3 and NOx emissions from manure management is 17%. This is based on the uncertainty values calculated in Sections 5 and 6. The uncertainty value for this emission factor is set to 400% (IPCC, 2006).
7.5 Uncertainty estimates
In the NEMA, uncertainty values for direct N2O emissions from manure management, manure treatment and indirect manure management are calculated separately, in order to account for the differences in circumstances, and thus in the associated emissions. The output of the model is at the level of detail shown in Table 7.2 and Annex 11.
Aggregation of emissions for reporting For the respective livestock categories distinguished in the CRF, emissions from direct manure management and manure treatment are summed to arrive at the total emissions of N2O from manure management. Indirect emissions from manure management are based on total NH3 and NOx emissions from manure management over all livestock categories.
Aggregation of uncertainty values for N2O direct manure management, manure treatment and indirect manure management Uncertainty values calculated for emissions from direct manure management, manure treatment and indirect manure management are aggregated to the CRF categories, as shown in Table 7.3. Table 7.20 Uncertainty values (U) for activity data (AD; livestock numbers), implied emission factors (IEF) and N2O emissions from manure management
IPCC Livestock category U AD U IEF U emissions
3A1a Mature dairy cattle 2% 186% 186%
3A1b Other mature cattle 2% 201% 201%
3A1c Growing cattle 1% 126% 126%
3A2 Sheep 5% 222% 222%
3A3 Swine 8% 113% 113%
3A4a Goats 5% 203% 203%
3A4b Horses 36% 222% 225%
3A4c Mules and asses 5% 217% 217%
3A4d Poultry 5% 144% 144%
3A4e Other 5% 155% 155%
3B5 Atmospheric deposition from manure
management
17% 400%
406%
Total 137%


Methodology for estimating emissions from agriculture in the Netherlands - Update 2019 | 69
8 NMVOC emissions from manure management (NFR Category 3B)
8.1 Scope and definition
This section provides a description of the methods and working processes for determining NMVOC emissions from manure management, using the following NFR categories: • 3B1a Dairy cattle • 3B1b Non-dairy cattle • 3B2 Sheep • 3B3 Swine • 3B4d Goats • 3B4e Horses • 3B4f Mules and asses • 3B4gi Laying hens • 3B4gii Broilers • 3B4giii Turkeys • 3B4giv Other poultry • 3B4h Other animals Category 3B4a (Buffalo) is reported as ‘not occurring’ (NO), as these animals are not kept commercially in the Netherlands. Category 3B4h (Other animals) consists of fur-bearing animals and rabbits. Emissions reported under Category 3B include the NMVOC emissions from manure produced in animal housing and then stored temporarily before being transported elsewhere, as well as the NMVOC emissions occurring during the feeding of silage in animal housing. No NMVOC emissions from manure treatment are reported, as no method is available for calculating these emissions. The NMVOC emissions resulting from manure application, manure production on pasture land during grazing, silage storage and crop cultivation are reported under Category 3D (Crop production and agricultural soils). In manure, NMVOC are produced by the degradation of fat, carbohydrates and protein (VS) present in the manure. For all animal categories except cattle, the volume of NMVOC is based on the amount of VS in the manure. For cattle, the volume of NMVOC depends on the energy content of the feed. Because of a correlation between emissions of NH3 and NMVOC from manure, the ratio between NH3 emissions from animal housing and manure application is a measure of the NMVOC emissions from housing and after application, as described in the EMEP Guidebook (EEA, 2016). The NMVOC emissions are calculated with the Tier 2 method, as described in the EMEP Guidebook (EEA, 2016).
8.2 Source-specific aspects for NMVOC emissions from animal housing
8.2.1 Calculation method
Dairy and non-dairy cattle The NMVOC emissions from cattle manure in animal housing are calculated as follows:
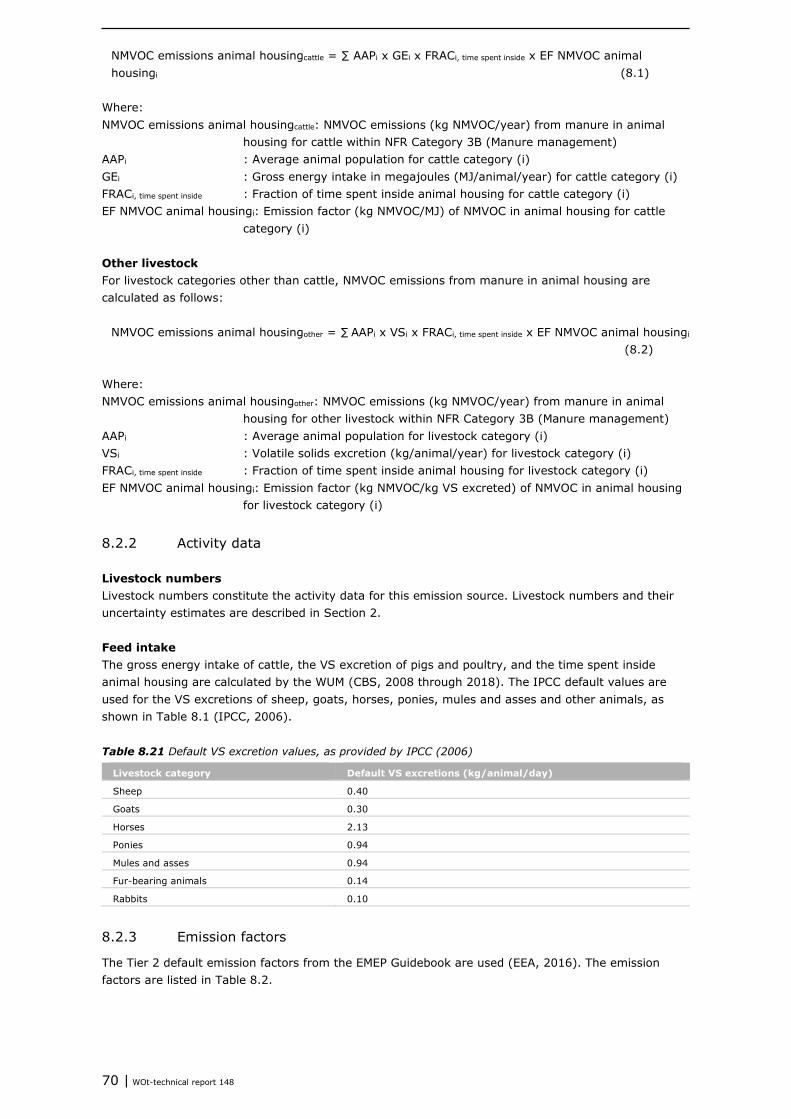
70 | WOt-technical report 148
NMVOC emissions animal housingcattle = ∑ AAPi x GEi x FRACi, time spent inside x EF NMVOC animal housingi (8.1)
Where: NMVOC emissions animal housingcattle: NMVOC emissions (kg NMVOC/year) from manure in animal
housing for cattle within NFR Category 3B (Manure management) AAPi : Average animal population for cattle category (i) GEi : Gross energy intake in megajoules (MJ/animal/year) for cattle category (i) FRACi, time spent inside : Fraction of time spent inside animal housing for cattle category (i) EF NMVOC animal housingi: Emission factor (kg NMVOC/MJ) of NMVOC in animal housing for cattle
category (i)
Other livestock For livestock categories other than cattle, NMVOC emissions from manure in animal housing are calculated as follows:
NMVOC emissions animal housingother = ∑ AAPi x VSi x FRACi, time spent inside x EF NMVOC animal housingi
(8.2) Where: NMVOC emissions animal housingother: NMVOC emissions (kg NMVOC/year) from manure in animal
housing for other livestock within NFR Category 3B (Manure management) AAPi : Average animal population for livestock category (i) VSi : Volatile solids excretion (kg/animal/year) for livestock category (i) FRACi, time spent inside : Fraction of time spent inside animal housing for livestock category (i) EF NMVOC animal housingi: Emission factor (kg NMVOC/kg VS excreted) of NMVOC in animal housing
for livestock category (i)
8.2.2 Activity data
Livestock numbers Livestock numbers constitute the activity data for this emission source. Livestock numbers and their uncertainty estimates are described in Section 2.
Feed intake The gross energy intake of cattle, the VS excretion of pigs and poultry, and the time spent inside animal housing are calculated by the WUM (CBS, 2008 through 2018). The IPCC default values are used for the VS excretions of sheep, goats, horses, ponies, mules and asses and other animals, as shown in Table 8.1 (IPCC, 2006). Table 8.21 Default VS excretion values, as provided by IPCC (2006)
Livestock category Default VS excretions (kg/animal/day)
Sheep 0.40
Goats 0.30
Horses 2.13
Ponies 0.94
Mules and asses 0.94
Fur-bearing animals 0.14
Rabbits 0.10
8.2.3 Emission factors
The Tier 2 default emission factors from the EMEP Guidebook are used (EEA, 2016). The emission factors are listed in Table 8.2.

Methodology for estimating emissions from agriculture in the Netherlands - Update 2019 | 71
Table 8.22 NMVOC emission factors (EF) of NMVOC from manure in animal housing, by livestock category (EEA, 2016)
Livestock category EF for manure in housing Unit
Cattle 0.0000353 kg NMVOC/MJ
Sheep 0.001614 kg NMVOC/kg VS excreted
Rearing and fattening pigs 0.001703 kg NMVOC/kg VS excreted
Sows 0.007042 kg NMVOC/kg VS excreted
Goats 0.001614 kg NMVOC/kg VS excreted
Horses 0.001614 kg NMVOC/kg VS excreted
Ponies 0.001614 Kg NMVOC/kg VS excreted
Mules and asses 0.001614 kg NMVOC/kg VS excreted
Laying hens 0.005684 kg NMVOC/kg VS excreted
Broilers 0.009147 kg NMVOC/kg VS excreted
Turkeys 0.005684 kg NMVOC/kg VS excreted
Other poultry 0.005684 kg NMVOC/kg VS excreted
Other animals (fur animals) 0.005684 kg NMVOC/kg VS excreted
Other animals (rabbits) 0.001614 kg NMVOC/kg VS excreted
8.2.4 Uncertainty
Uncertainty values for animal numbers are discussed in Section 2.4.3. Feed uptake and energy content are described in Section 3 (Table 3.1), and in Section 4 for manure-management systems. The proportion of time spent inside animal housing is assumed to be 20% uncertain, and uncertainty values for emission factors are estimated at 300% (based on expert judgement).
8.3 Source-specific aspects for NMVOC emissions from silage feeding in animal housing
8.3.1 Calculation method
Dairy and non-dairy cattle The NMVOC emissions from silage feeding in animal housing if silage is used for feeding cattle are calculated as follows:
NMVOC emissions silage feedingcattle = ∑ AAPi x GEi x FRACi, time spent inside x (EF NMVOC silage feedingi x FRACi, silage) (8.3)
Where: NMVOC emissions silage feedingcattle: NMVOC emissions (kg NMVOC/year) from the feeding of silage
for all cattle categories (i) within NFR Category 3B (Manure management) AAPi : Average animal population for cattle category (i) GEi : Gross energy intake in megajoules (MJ/animal) for cattle category (i) FRACi, time spent inside : Fraction of time spent inside animal housing (i) EF NMVOC silage feedingi: Emission factor (kg NMVOC/MJ) of NMVOC from the feeding of silage for
cattle category (i) FRACi, silage : Fraction of the feed given consisting of silage for cattle category (i) If the fraction of feed consisting of silage is greater than 0.5 of all dry-matter consumption, it is assumed that silage feeding is dominant, and the fraction of feed consisting of silage is set to 1.0.
Other livestock NMVOC emissions from silage feeding in animal housing when silage is used for feeding livestock categories other than cattle that are fed silage are calculated as follows:
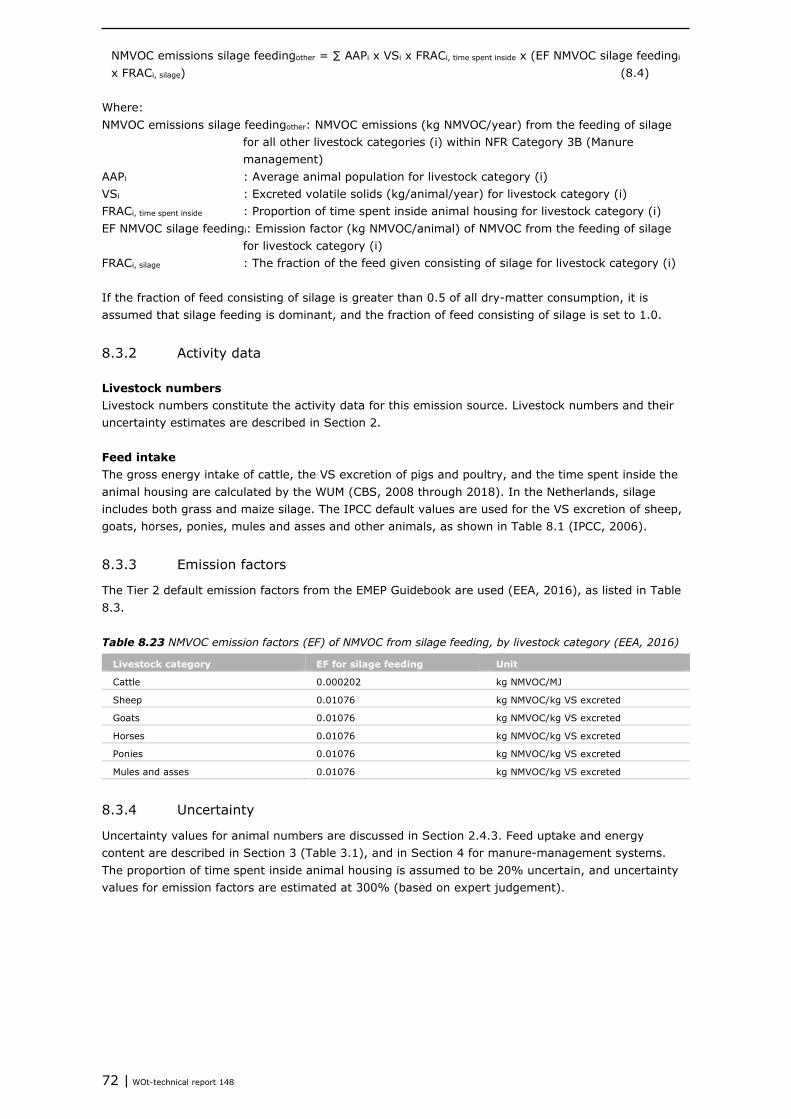
72 | WOt-technical report 148
NMVOC emissions silage feedingother = ∑ AAPi x VSi x FRACi, time spent inside x (EF NMVOC silage feedingi x FRACi, silage) (8.4)
Where: NMVOC emissions silage feedingother: NMVOC emissions (kg NMVOC/year) from the feeding of silage
for all other livestock categories (i) within NFR Category 3B (Manure management)
AAPi : Average animal population for livestock category (i) VSi : Excreted volatile solids (kg/animal/year) for livestock category (i) FRACi, time spent inside : Proportion of time spent inside animal housing for livestock category (i) EF NMVOC silage feedingi: Emission factor (kg NMVOC/animal) of NMVOC from the feeding of silage
for livestock category (i) FRACi, silage : The fraction of the feed given consisting of silage for livestock category (i) If the fraction of feed consisting of silage is greater than 0.5 of all dry-matter consumption, it is assumed that silage feeding is dominant, and the fraction of feed consisting of silage is set to 1.0.
8.3.2 Activity data
Livestock numbers Livestock numbers constitute the activity data for this emission source. Livestock numbers and their uncertainty estimates are described in Section 2.
Feed intake The gross energy intake of cattle, the VS excretion of pigs and poultry, and the time spent inside the animal housing are calculated by the WUM (CBS, 2008 through 2018). In the Netherlands, silage includes both grass and maize silage. The IPCC default values are used for the VS excretion of sheep, goats, horses, ponies, mules and asses and other animals, as shown in Table 8.1 (IPCC, 2006).
8.3.3 Emission factors
The Tier 2 default emission factors from the EMEP Guidebook are used (EEA, 2016), as listed in Table 8.3. Table 8.23 NMVOC emission factors (EF) of NMVOC from silage feeding, by livestock category (EEA, 2016)
Livestock category EF for silage feeding Unit
Cattle 0.000202 kg NMVOC/MJ
Sheep 0.01076 kg NMVOC/kg VS excreted
Goats 0.01076 kg NMVOC/kg VS excreted
Horses 0.01076 kg NMVOC/kg VS excreted
Ponies 0.01076 kg NMVOC/kg VS excreted
Mules and asses 0.01076 kg NMVOC/kg VS excreted
8.3.4 Uncertainty
Uncertainty values for animal numbers are discussed in Section 2.4.3. Feed uptake and energy content are described in Section 3 (Table 3.1), and in Section 4 for manure-management systems. The proportion of time spent inside animal housing is assumed to be 20% uncertain, and uncertainty values for emission factors are estimated at 300% (based on expert judgement).

Methodology for estimating emissions from agriculture in the Netherlands - Update 2019 | 73
8.4 Source-specific aspects for NMVOC emissions from outside manure storage
8.4.1 Calculation method
Dairy and non-dairy cattle The NMVOC emissions from outside cattle manure storage are calculated as follows:
NMVOC emissions manure storagecattle = ∑ AAPi x NMVOC emissions animal housingcattle x (NH3 emissions manure storagei / NH3 emissions animal housingi) (8.5)
Where: NMVOC emissions manure storagecattle: NMVOC emissions (kg NMVOC) for all cattle categories (i)
within NFR Category 3B (Manure management) AAPi : Average animal population for cattle category (i) NMVOC emissions animal housingcattle: NMVOC emissions (kg NMVOC/animal/year) from manure in
animal housing for cattle category (i) NH3 emissions manure storagei: NH3 emissions (kg NH3/year) from manure storage facilities outside
animal housing for cattle category (i) NH3 emissions animal housingi: NH3 emissions (kg NH3/year) from animal housing for cattle category
(i)
Other livestock NMVOC emissions from outside manure storage for livestock categories other than cattle are calculated as follows:
NMVOC emissions manure storageother = ∑ AAPi x NMVOC emissions animal housingi x (NH3 emissions outside storagei / NH3 emissions animal housingi) (8.6)
Where: NMVOC emissions manure storageother: NMVOC emissions (kg NMVOC) for all other livestock categories
(i) within NFR Category 3B (Manure management) NMVOC emissions animal housingi: NMVOC emissions (kg NMVOC/animal/year) from manure in animal
housing for livestock category (i) NH3 emissions outside storagei: NH3 emissions (kg NH3/year) from outside manure storage facilities
for livestock category (i) NH3 emissions animal housingi: NH3 emissions (kg NH3/year) from animal housing for livestock
category (i)
8.4.2 Activity data
Livestock numbers constitute the activity data for this emission source. Livestock numbers and their uncertainty estimates are described in Section 2. The emissions of NH3 from animal housing and outside storage are described in Sections 5.2 and 5.4, respectively.
8.4.3 Emission factors
The Tier 2 default emission factors from the EMEP Guidebook are used (EEA, 2016).
8.4.4 Uncertainty
Uncertainty values for animal numbers are discussed in Section 2.4.3. Feed uptake and energy content are described in Section 3 (Table 3.1), and in Section 4 for manure-management systems. The proportion of time spent inside animal housing is assumed to be 20% uncertain, and the uncertainty values for emission factors are estimated at 300% (based on expert judgement).

74 | WOt-technical report 148
8.5 Uncertainty estimates
In the NEMA, uncertainty values for emissions from animal housing, silage feeding in animal housing and outside manure storage are calculated separately, in order to account for differences in circumstances, and thus in the associated emissions.
Aggregation of emissions for reporting For the respective livestock categories distinguished in the NFR, emissions from animal housing, silage feeding in animal housing and outside manure storage are summed to arrive at the total of all NMVOC emissions from manure management.
Aggregation of uncertainties for NMVOC from animal housing, silage feeding in animal housing and outside manure storage Uncertainty values calculated for emissions from animal housing, silage feeding in animal housing and outside manure storage are aggregated to the NFR categories, as shown in Table 8.4. Table 8.24 Uncertainty values (U) for activity data (AD; livestock numbers), implied emission factors (IEF) and NMVOC emissions from manure management
EMEP Livestock category U AD U IEF U emissions
3B1a Dairy cattle 2% 221% 221%
3B1b Non-dairy cattle 1% 146% 146%
3B2 Sheep 5% 309% 309%
3B3 Swine 8% 222% 223%
3B4d Goats 5% 302% 302%
3B4e Horses 4% 272% 272%
3B4f Mules and asses 5% 309% 309%
3B4gi Laying hens 4% 218% 218%
3B4gii Broilers 10% 303% 303%
3B4giii Turkeys 10% 303% 303%
3B4giv Other poultry 10% 303% 303%
3B4h Other animals 5% 299% 300%
Total 143%

Methodology for estimating emissions from agriculture in the Netherlands - Update 2019 | 75
9 PM10 and PM2.5 emissions from animal housing (NFR category 3B)
9.1 Scope and definition
This section provides a description of the methods and working processes for determining emissions of PM10 and PM2.5 (particulate matter smaller than 10 µm and smaller than 2.5 µm respectively) from animal housing, using the following NFR categories: • 3B1a Dairy cattle • 3B1b Non-dairy cattle • 3B2 Sheep • 3B3 Swine • 3B4d Goats • 3B4e Horses • 3B4f Mules and asses • 3B4gi Laying hens • 3B4gii Broilers • 3B4giii Turkeys • 3B4giv Other poultry • 3B4h Other animals Category 3B4a (Buffalo) is reported as ‘not occurring’ (NO), as these animals are not kept commercially in the Netherlands. Category 3B4h (Other animals) consists of fur-bearing animals and rabbits. Particulate matter emissions from agriculture originate mainly from animal housing and consist of skin, manure, feed and bedding particles. Poultry is the main source category of PM10 and PM2.5 emissions in Dutch agriculture. Over time, slurry-based housing systems for laying hens have been replaced by systems that produce solid manure, thereby leading to higher emissions of PM. Pigs and cattle contribute to the production of PM as well, albeit to a lesser extent. The increasing use of air scrubbers in housing systems for pigs is decreasing the emission of PM (Melse et al., 2018).
9.2 Source-specific aspects
9.2.1 Calculation method
Emissions are calculated as the product of the number of animals for in each housing system and the corresponding emission factors for PM10 and PM2.5 in grams per animal per year.
PM emissions animal housing = ∑ AAPi x FRACik, housing system x EF PM animal housingik / 1,00 (9.1) Where: PM emissions animal housing: PM emissions (kg PM10 or PM2.5/year) for all livestock categories (i) and
housing systems (k) within NFR Category 3B (Manure management) AAPi : Average animal population for livestock category (i) FRACik, housing system : Fraction of animals in the various animal-housing systems (k) EF PM animal housingik : Emission factor (g PM10 or PM2.5/year) for livestock category (i) and animal-
housing system (k) 1,000 : Conversion factor from grams to kilograms

76 | WOt-technical report 148
9.2.2 Activity data
Livestock numbers constitute the activity data for this emission source. Livestock numbers and their uncertainty estimates are described in Section 2. The shares of housing systems for each livestock category are based on the Agricultural Census. If insufficient information is available for certain livestock categories, other sources can be used (e.g. the permit files of local authorities). Research by an enforcement agency revealed that many air scrubbers were not being used properly (Handhavingsamenwerking Noord-Brabant, 2013; 2015). For this reason, implementation grades were therefore corrected. For the years up to and including 2009, it was assumed that 40% of the scrubbers did not function, decreasing by 8% a year up to 16% in 2012. From then on, a decrease of 4% per year was assumed until 2016, when all scrubbers were assumed to operate properly, given that electronic monitoring was compulsory on all equipment from that time.
9.2.3 Emission factors
The emission factors are based on a measurement programme conducted by WUR Livestock Research between 2007 and 2009 (publication series ‘Particulate matter emission from animal houses’, in Dutch; (Mosquera et al., 2009a; Mosquera et al., 2009b; Mosquera et al., 2009c; Winkel et al., 2009a; Winkel et al., 2009b; Winkel et al., 2009c; Mosquera et al., 2010a; Mosquera et al., 2010b; Mosquera et al., 2010c; Huis in 't Veld et al., 2011; Mosquera et al., 2011; Winkel et al., 2011). Measurements of PM emissions from housing were not prepared for all livestock categories. For categories that were not measured, emission factors were deduced from factors measured for similar livestock categories, using ratios of fixed P excretions (Chardon and Van der Hoek, 2002) as a scale factor. An overview of housing systems and emission factors for PM10 and PM2.5 is provided in Table 9.1. Several techniques have been developed for reducing PM emissions, with air scrubbers being the most common. Air scrubbers generate the following reductions in emissions of PM2.5, as well as in PM10 based on measurements (Mosquera et al., 2011). If air scrubbers are used in animal housing for a given animal category, the emission factor is reduced by the following percentages, depending on the type of air scrubber. • Chemical air scrubber: 35% • Biological air scrubber with short retention time: 60% • Biological air scrubber with long retention time: 75% • Combined air scrubber: 80% Table 9.25 Emission factors (EF) for PM10 and PM2.5 from animal housing (g/animal/year; traditional systems do not have PM emission reduction, but can have emission reductions for other substances. Calculated emission factors for air scrubbers for each livestock category are not mentioned)
Livestock category Housing system EF PM10 EF PM2.5
Dairy cattle
Female young stock < 1 year Traditional 37.7 10.4
Male young stock < 1 year Traditional 170.1 46.8
Female young stock 1-2 years Traditional 37.7 10.4
Male young stock 1-2 years Traditional 170.1 46.8
Female young stock ≥ 2 years Traditional 117.8 32.5
Cows in milk and in calf Tie-stall system 80.8 22.3
Cubicle system, grazing1) 117.8 32.5
Cubicle system, no grazing1) 147.5 40.6
Bulls for service ≥ 2 years Traditional 170.1 46.8
Cattle for fattening
Veal calves, for white veal production Traditional2) 35.7 9.8
Veal calves, for rosé veal production Traditional2) 35.7 9.8

Methodology for estimating emissions from agriculture in the Netherlands - Update 2019 | 77
Livestock category Housing system EF PM10 EF PM2.5
Female young stock < 1 year Traditional 37.7 10.4
Male young stock < 1 year (incl. young bullocks) Traditional 170.1 46.8
Female young stock 1-2 years Traditional 37.7 10.4
Male young stock 1-2 years (incl. young bullocks) Traditional 170.1 46.8
Female young stock ≥ 2 years Traditional 86.2 23.8
Male young stock ≥ 2 years (incl. young bullocks) Traditional 170.1 46.8
Suckling cows ≥ 2 years (incl. fattening/grazing) Traditional 86.2 23.8
Pigs
Piglets Traditional partially raster1), 2) 81.2 2.0
Traditional fully raster1), 2) 62.0 2.1
Fattening pigs and growing pigs Traditional1), 2) 157.3 7.4
Sows, pregnant and open Traditional, individual1), 2) 186.3 16.0
Traditional, group1), 2) 173.7 12.1
Sows with piglets Traditional2) 164.9 14.2
Boars for service Traditional2) 185.6 15.9
Poultry
Broilers Traditional1), 2), 4) 26.8 2.0
Broiler breeders < 18 weeks Floor housing3) 17.0 1.3
Broiler breeders ≥ 18 weeks Cage housing 8.7 1.8
Floor housing + aviary1), 2), 4) 49.1 3.8
Laying hens < 18 weeks Battery3), 5) 2.2 0.4
Colony housing 9.6 0.9
Floor housing2), 4) 34.8 1.7
Aviary housing 26.9 1.6
Laying hens ≥ 18 weeks Battery3), 5) 5.4 1.1
Enriched cage/colony housing 24.0 2.3
Floor housing1), 2), 4) 87.1 4.2
Aviary housing1) 67.3 4.0
Ducks Traditional 104.5 5.0
Turkeys Traditional1) 95.1 44.6
Turkey breeders < 7 months Traditional 177.0 83.0
Turkey breeders ≥ 7 months Traditional 240.8 112.9
Rabbits (mother animals) Traditional 10.7 2.1
Minks (mother animals) Traditional1) 8.1 4.2
Foxes (mother animals) Traditional 8.1 4.2
Sheep Traditional 19.0 5.7
Goats Traditional 19.0 5.7
Horses6) Traditional 220.0 140.0
Ponies6) Traditional 220.0 140.0
Mules and asses6) Traditional 160.0 100.0 1) Source: Wageningen UR Livestock Research measurements. 2) Air scrubbers available. 3) Chemical air scrubbers available. 4) Additional emission reducing techniques available see Table 8.2. 5) Prohibited since 2013. 6) Default emission factors from the EMEP Guidebook (EEA, 2016).
Source: Wageningen UR Livestock Research.

78 | WOt-technical report 148
9.2.4 Uncertainty
The uncertainty values for livestock numbers, including the aggregation and disaggregation of subcategories, are provided in Section 2.4.3. Uncertainty values in the shares of housing systems are estimated at 10%. Uncertainty values for the measured emission factors are also published in publication series ‘Particulate matter emission from animal houses’ and displayed in Table 9.2. An uncertainty value of 40% is assumed for the EMEP default emission factors used (horses, ponies, mules and asses), based on expert judgement. Table 9.26 Uncertainty values for emission factors for PM10 and PM2.5 from manure management
Livestock
category
Uncertainty
PM10
Uncertainty
PM2.5
Source
Dairy cows 32% 35% Greatest uncertainty1) in particulate-matter emissions from
animal housing: dairy cows (Mosquera et al., 2010a) (47.4 x
100% / 147.5 = 32%)
Other cattle 32% 35% Equal to dairy cows
Goats 32% 35% Equal to dairy cows
Fattening
pigs
45% 55% Greatest uncertainty in particulate-matter emissions from animal
housing: fattening pigs (Mosquera et al., 2010b) (65.4 x 100% /
144.0 = 45%)
Sows 48% 52% Greatest uncertainty in particulate-matter emissions from animal
housing: gestating sows (Winkel et al., 2009b; Mosquera et al.,
2010c) (82.6 x 100% / 173.7 = 48%)
Laying hens 44% 100% Greatest uncertainty in particulate-matter emissions from animal
housing: laying hens in animal housing with a drying tunnel
(Mosquera et al., 2009a; Mosquera et al., 2009b; Winkel et al.,
2009a; Winkel et al., 2011) (1.7 x 100% / 3.9 = 44%)
Broilers 33% 45% Greatest uncertainty of particulate-matter emissions from animal
housing: broilers (Winkel et al., 2009c) (8.8 x 100% / 26.8 =
33%)
Ducks 33% 45% Equal to broilers
Turkeys 33% 45% Equal to broilers
Rabbits 49% 100% Greatest uncertainty in gaseous emissions and particulate matter
from rabbit animal housing with manure storage under the
welfare cages (Huis in ’t Veld et al., 2011) (5.21 x 100% / 10.7
= 49%) Fur-bearing
animals
49% 100% Only one type of housing system is used (Mosquera et al., 2011)
(5.21 x 100% / 10.7 = 49%) 1) In line with the EMEP Guidebook (2006), the greatest uncertainty value is selected.
9.3 Uncertainty estimates
Emission calculations use more livestock categories than are listed in Table 9.3, along with several housing systems (Table 9.1). These livestock categories (e.g. young female cattle < 1 year and 1-2 years) have been aggregated in the uncertainty analysis, so that the associated uncertainty value is considered only once. The same applies to the uncertainty values for the emission factors of housing systems. The emission factors of air scrubbers are dependent on the traditional system. Uncertainty values are calculated using only one category, instead of two. The uncertainty value for shares of housing system is included in the implied emission factor. Implied emission factors are calculated by multiplying these uncertainty estimates by the selected aggregation (based on expert judgement), as shown in Table 9.3.
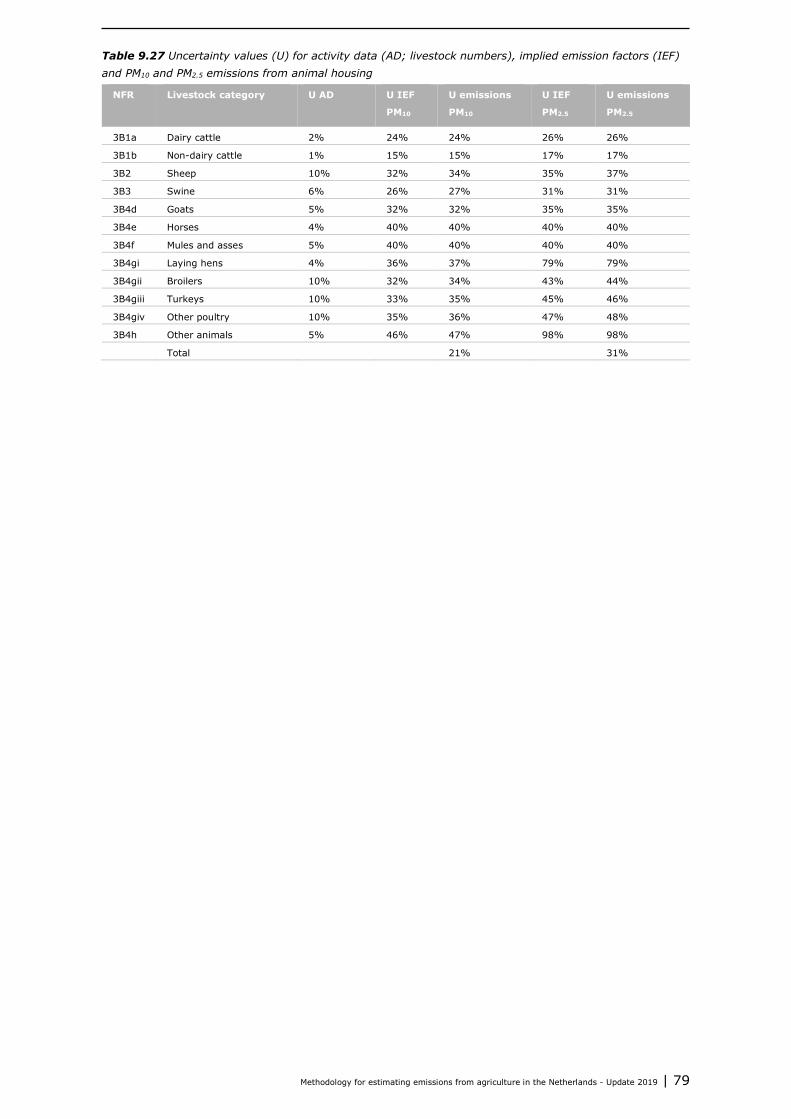
Methodology for estimating emissions from agriculture in the Netherlands - Update 2019 | 79
Table 9.27 Uncertainty values (U) for activity data (AD; livestock numbers), implied emission factors (IEF) and PM10 and PM2.5 emissions from animal housing
NFR Livestock category U AD U IEF
PM10
U emissions
PM10
U IEF
PM2.5
U emissions
PM2.5
3B1a Dairy cattle 2% 24% 24% 26% 26%
3B1b Non-dairy cattle 1% 15% 15% 17% 17%
3B2 Sheep 10% 32% 34% 35% 37%
3B3 Swine 6% 26% 27% 31% 31%
3B4d Goats 5% 32% 32% 35% 35%
3B4e Horses 4% 40% 40% 40% 40%
3B4f Mules and asses 5% 40% 40% 40% 40%
3B4gi Laying hens 4% 36% 37% 79% 79%
3B4gii Broilers 10% 32% 34% 43% 44%
3B4giii Turkeys 10% 33% 35% 45% 46%
3B4giv Other poultry 10% 35% 36% 47% 48%
3B4h Other animals 5% 46% 47% 98% 98%
Total 21% 31%

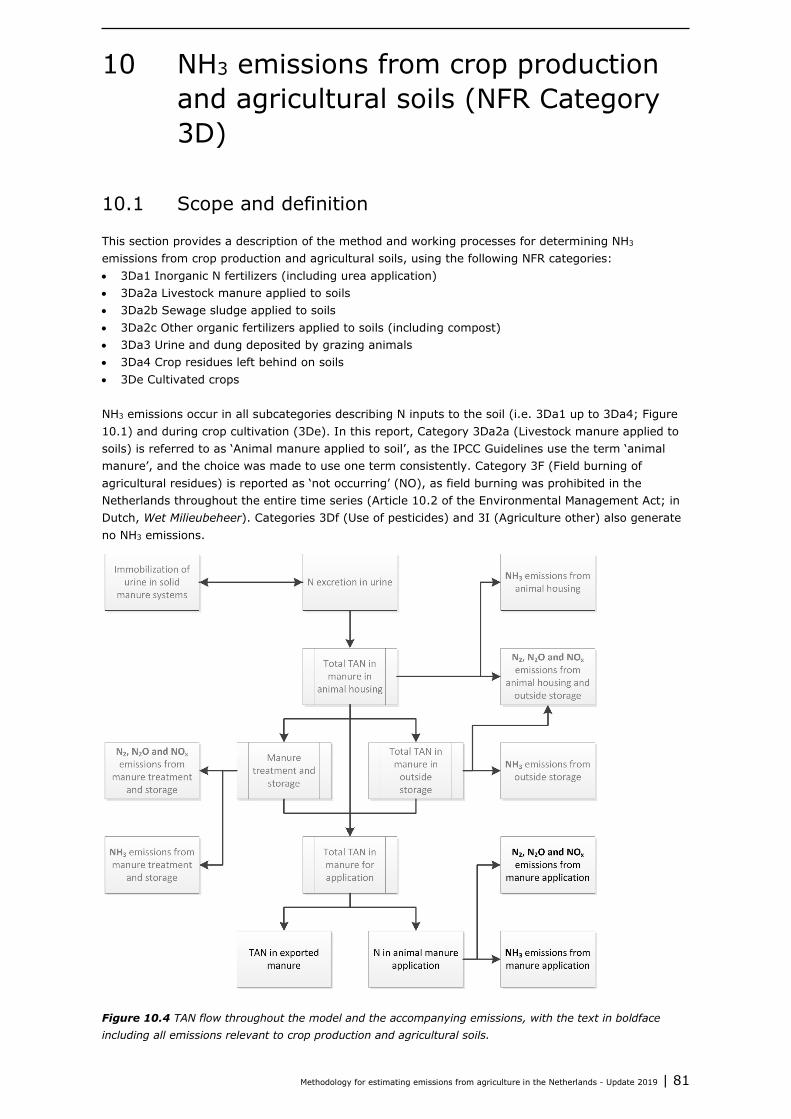
Methodology for estimating emissions from agriculture in the Netherlands - Update 2019 | 81
10 NH3 emissions from crop production and agricultural soils (NFR Category 3D)
10.1 Scope and definition
This section provides a description of the method and working processes for determining NH3 emissions from crop production and agricultural soils, using the following NFR categories: • 3Da1 Inorganic N fertilizers (including urea application) • 3Da2a Livestock manure applied to soils • 3Da2b Sewage sludge applied to soils • 3Da2c Other organic fertilizers applied to soils (including compost) • 3Da3 Urine and dung deposited by grazing animals • 3Da4 Crop residues left behind on soils • 3De Cultivated crops NH3 emissions occur in all subcategories describing N inputs to the soil (i.e. 3Da1 up to 3Da4; Figure 10.1) and during crop cultivation (3De). In this report, Category 3Da2a (Livestock manure applied to soils) is referred to as ‘Animal manure applied to soil’, as the IPCC Guidelines use the term ‘animal manure’, and the choice was made to use one term consistently. Category 3F (Field burning of agricultural residues) is reported as ‘not occurring’ (NO), as field burning was prohibited in the Netherlands throughout the entire time series (Article 10.2 of the Environmental Management Act; in Dutch, Wet Milieubeheer). Categories 3Df (Use of pesticides) and 3I (Agriculture other) also generate no NH3 emissions.
Figure 10.4 TAN flow throughout the model and the accompanying emissions, with the text in boldface including all emissions relevant to crop production and agricultural soils.

82 | WOt-technical report 148
The NEMA includes calculation methods for all source categories that have been distinguished. The amount of TAN in animal manure available for application is derived from TAN excretions minus N emissions in animal houses, manure treatment and during manure storage, and minus exported N, using a balance method to model N flows in agriculture (Figure 10.1). In addition to the application of N in animal manure, the following additional supply sources of N have been included in the model: inorganic N fertilizer, sewage sludge, compost and crop residues, and TAN excreted on pasture land during grazing (Figure 10.2).
10.2 Source-specific aspects for NH3 emissions from the application of inorganic N fertilizer
10.2.1 Calculation method
Inorganic N fertilizer includes synthetic fertilizer and rinsing liquid (Figure 10.1). The NH3 emission from inorganic N fertilizer is calculated with the following activity data: • Amount of N applied for type of inorganic N fertilizer • Amount of N applied from rinsing liquid • Emission factor for type and application technique of inorganic N fertilizer (Section 10.3.2) • Emission factor for rinsing liquid. The NH3 emissions from inorganic N fertilizer application are calculated as follows.
NH3 emissions inorganic fertilizer = ∑ Nl, inorganic fertilizer x EF NH3 inorganic fertilizerl x 17/14 (10.1) Where: NH3 emissions inorganic fertilizer: NH3 emissions (kg NH3/year) from inorganic N fertilizers applied to
agricultural soils Nl, inorganic fertilizer: Total amount of inorganic N fertilizer (kg N) applied for type of
inorganic fertilizer (l)
Figure 10.5. Source categories contributing to NH3 emissions from agricultural soils

Methodology for estimating emissions from agriculture in the Netherlands - Update 2019 | 83
EF NH3 inorganic fertilizerl: NH3 emission factor for inorganic N fertilizer (% of applied N) for type of inorganic fertilizer (l)
17/14: Conversion factor from NH3-N to NH3
10.2.2 Activity data
The usage of the various types of inorganic N fertilizers is taken from the synthetic fertilizer statistics of Wageningen Economic Research. From 2016 onwards, the usage of the various types of inorganic N fertilizers is taken from the inorganic fertilizer statistics from the Farm Accountancy Data Network (FADN; in Dutch, BIN) of Wageningen Economic Research. Consistency between the two data sources has been verified and confirmed (Van Bruggen et al., 2019). The amount of rinsing liquid produced by air scrubbers, as calculated by the NEMA, is also taken into consideration. It is assumed that all inorganic N fertilizers are surface-applied, with the exception of liquid-injected urea and fertilizer applied in greenhouse horticulture.
10.2.3 Emission factors
The NH3 emission factors for inorganic N fertilizer are based on a review paper by Bouwman et al. (2002), which uses results from 148 studies (1,667 NH3 measurements) from all over the world to quantify the effect of fertilizer type, crop, N addition, application method, temperature, soil characteristics (cation exchange capacity [CEC], pH, organic matter content) and location on NH3 emission. A calculation method was developed based on the results of regression analysis (R2 = 28%). The following data are used in the Netherlands.
Crop In the calculation model, a distinction is made between grassland and upland crops. The areas of grassland, cropland and maize are determined based on soil-use maps. The factor-class value for grassland is -0.045. Cropland and maize are regarded as upland crops, with a factor-class value of 0.158.
Fertilizer type Calculations have been performed for the fertilizer types addressed in Bouwman et al. (2002), but the paper does not mention all inorganic types of N fertilizer that are in use. The emission factors have been calculated as follows: • Ammonium sulphate nitrate: This fertilizer type contains both ammonium nitrate and ammonium
sulphate. The emission factor is equal to the average emission factor for ammonium nitrate and ammonium sulphate.
• Nitrogen magnesium: This type of fertilizer resembles calcium ammonium nitrate, but contains MgCO3 besides CaCO3. This difference does not require a different emission factor.
• Chilean nitrate, calcium nitrate and potassium nitrate: These types of fertilizer contain only nitrate N and no ammonium. Their use therefore does not result in NH3 emissions from the soil, and the emission factor is set to 0%.
• Mixed nitrogen fertilizer: This category can include all types of fertilizer. The emission factor is set equal to that of the fertilizer type that is most commonly used in the Netherlands.
• Nitrogen phosphate potassium magnesium fertilizers: These types of fertilizer are comparable to nitrogen phosphate potassium fertilizer, and the emission factor is set to 2%.
• Ammonia water: This type of fertilizer is comparable to liquid ammonia. • Sulphur-coated urea: The coating on this type of fertilizer type leads to lower emissions than those
generated by uncoated urea (Oenema and Velthof, 1993). The emission factor is set to half that of urea.
Emission factors The emission calculations for 2015 included an additional subdivision of urea fertilizers (see Annex 5 in Van Bruggen et al., 2017). The resulting emission factors used to calculate NH3 emissions from inorganic N fertilizers are presented in Table 10.1.

84 | WOt-technical report 148
Table 10.28 Emission factors (EF; in % of N) for inorganic N fertilizer (Velthof et al., 2012), derived from Bouwman et al. (2002)
Fertilizer type EF used (% of N)
Ammonium nitrate 5.2
Ammonium sulphate 11.3
Ammonium sulphate nitrate 8.2
Chilean nitrate 0.0
Diammonium phosphate 7.4
Mixed nitrogen fertilizer 2.5
Potassium nitrate 0.0
Calcium ammonium nitrate 2.5
Calcium nitrate 0.0
Monoammonium phosphate 7.4
Other nitrogen, phosphate and potassium fertilizers1) 4.5
Nitrogen phosphate potassium magnesium fertilizers 2.5
Nitrogen magnesium 2.5
Urea – granular incl. urea with nitrification inhibiter 14.3
Urea – granular with urease inhibitor 5.92)
Urea – liquid, surface-applied 7.52)
Urea – liquid, injected 1.52)
Urea – liquid with urease inhibitor or acid, surface-applied 3.12)
Urea – greenhouse horticulture 0.02)
Liquid ammonia 2.3
Sulphur-coated urea 7.1 1) Including nitrogen phosphate and nitrogen potassium fertilizers.
2) See Annex 5 in Van Bruggen et al. (2017)
Rinsing liquid No ammonia-emission factors are available for the application of rinsing liquid to soil. Given that rinsing liquid is a solution of ammonium sulphate, the emission factor was derived for granular (or other) ammonium sulphate fertilizer. The study by Velthof et al. (2009) is taken as the starting point for determining the emission factors of rinsing liquid. On non-calcareous soils, the application of ammonium sulphate does not result in ammonia emissions, as the pH is too low. On calcareous soils, the emission factor is therefore 15%, assuming that the emission of rinsing liquid is half of that of granular ammonium sulphate, as it will penetrate into the soil and is applied in part using low-ammonia-emission techniques. Taking into account that 76% of agricultural soils in the Netherlands are non-calcareous (Velthof et al., 2009), and assuming a homogeneous distribution of rinsing liquid over soil types, the emission factor becomes 0.76 x 0 + 0.24 x 7.5 = 1.8%.
10.2.4 Uncertainty
The uncertainty analyses are based solely on the total amount of fertilizer. Uncertainty estimates at higher levels of aggregation are more robust, while providing the same overall uncertainty values as those produced when estimating for each category separately. Only rinsing liquid is estimated separately. Uncertainty values for the total amount of inorganic fertilizer applied are estimated at 25%, excluding rinsing liquid. A small proportion of fertilizers is used outside agriculture. If the uncertainty values for the use of inorganic fertilizer for agriculture and private purposes are disaggregated, the uncertainty value for the use of inorganic fertilizer in agriculture is 26.6%. The uncertainty value for the use of rinsing liquid is 40%.

Methodology for estimating emissions from agriculture in the Netherlands - Update 2019 | 85
10.3 Source-specific aspects for NH3 emissions from animal manure applied to soils
The amount of TAN and organic N that remains in manure from animal housing after outside storage, manure treatment and export is applied to the soil. It is assumed that manure stocks in storage remain equal, such that no correction is made for manure stored longer than one year. The amount of TAN in manure applied to soil is calculated according to the following activity data: • Total N (urine N and faecal N) excretions in animal housing • Mineralisation/immobilisation of organic N in storage • Losses of NH3, N2O, NOx and N2 inside animal housing and during outside storage and manure
treatment • Amount of manure that is exported or treated and subsequently used outside Dutch agriculture • Manure used outside agriculture, but in the Netherlands (hobby farming and application on nature
areas) • Manure can also be applied to soils directly through grazing animals. Emissions occurring during
grazing are calculated directly from TAN. In addition to manure application and grazing, the application of inorganic N fertilizer (including the rinsing liquid from air scrubbers) to agricultural soils is a source of NH3 emissions. Emissions of NH3 occur only if the fertilizer contains urea or when ammonium (NH4+) is applied to calcareous soils.
10.3.1 Calculation method
The total amounts of slurry and solid manure are divided over grassland, uncropped land and cropped land (see Section 10.3.2). The level of NH3 emissions is calculated based on the application of manure to grassland, uncropped land and cropped land. The level of NH3 emissions from manure application is calculated as follows:
NH3 emissions manure application = ∑ ((TANijm, applied on grassland x FRACj, application technique grassland x EF NH3 application technique on grasslandjm) + (TANijm, applied on uncropped land x FRACj, application technique uncropped land x EF NH3 application technique on uncropped landjm) + (TANijm, applied on cropped land x FRACj, application technique
cropped land x EF NH3 application technique on cropped landjm)) x 17/14 (10.2) Where: NH3 emissions manure application: NH3 emissions from manure applied to agricultural soils (kg
NH3/year) TANijm, applied on grassland : Amount of TAN in manure (kg N/year) for livestock category (i) and
manure-management system (j) applied to grassland for manure-application technique (m)
FRACj, application technique grassland: Fractions of manure-application techniques (m) for manure-management system (j) used on grassland
EF NH3 application technique on grasslandjm: NH3-N emission factor (% of TAN) for manure-application technique (m) for manure-management system (j) used on grassland
TANijm, applied on uncropped land : Amount of TAN in manure (kg N/year) for livestock category (i) and manure-management system (j) applied to uncropped land for manure-application technique (m)
FRACj, application technique uncropped land: Fractions of manure-application techniques (m) for manure-management system (j) used on uncropped land
EF NH3 application technique on uncropped landjm: NH3-N emission factor (% of TAN) for manure-application technique (m) for manure-management system (j) used on uncropped land
TANij, applied on cropped land : Amount of TAN in manure (kg N/year) for livestock category (i) and manure-management system (j) applied to cropped land for manure-application technique (m)
FRACj, application technique cropped land: Fractions of manure-application techniques (m) for manure-management system (j) used on cropped land

86 | WOt-technical report 148
EF NH3 application technique on cropped landjm: NH3-N emission factor (% of TAN) for manure-application technique (m) for manure-management system (j) used on cropped land
17/14 : Conversion factor from NH3-N to NH3 The level of NH3 emissions is measured or derived for specific manure-application techniques. The following application techniques are distinguished for grassland: surface spreading, shallow injection, trailing shoe and slit coulter application. For uncropped land: surface spreading, injection/full coverage, shallow injection, trailing shoe, incorporation in one track and incorporation in two tracks. For cropped land: shallow injection and trailing shoe. The amount of TAN available for each livestock category/manure type is calculated by subtracting N emissions in animal housing, during manure storage and during manure treatment from the TAN excretion in animal housing. Part of the manure can be used outside agriculture, treated or exported. The amount of manure for livestock category (i) and manure-management system (j) that is available for application is found by subtracting these amounts from initial TAN excretions:
TAN for applicationij = TANi x FRACj, manure management – N losses in animal housingij – NH3 emissions storageij – NH3 emissions treatmentij – N used outside agricultureij – N exportedij (10.3)
Where: TAN for applicationij : Amount of manure (kg N) applied to agricultural soils, for livestock category
(i) and manure-management system (j) TANi : TAN excretions (kg N) in animal housing for livestock category (i) FRACj, manure management : Fraction of manure in the various management systems (j) N losses in animal housingij: Sum of NH3, N2O, NOx and N2 losses (kg N) from animal housing for
livestock category (i) and manure-management system (j) NH3 emissions storageij : NH3 emissions from outside manure storage facilities (kg N) for livestock
category (i) and manure-management system (j) NH3 emissions treatmentij: NH3 emissions from manure treatment (kg N) for livestock category (i) and
manure-management system (j) N used outside agricultureij : Amount of manure (kg N) processed and marketed outside
agriculture, for livestock category (i) and manure-management system (j) N exportij : Amount of manure (kg N) exported, for livestock category (i) and manure-
management system (j), with import denoted as negative export It is assumed that the amount of manure imported for each kind of manure accounts for the same TAN fraction of total N as does Dutch manure coming from animal housing and storage.
10.3.2 Activity data
TAN in manure applied The amount of TAN in manure applied to the soil is calculated from N excretions in urine, the mineralisation and immobilisation of organic N in animal housing and the loss of gaseous N occurring in animal housing and during manure storage (as described in Sections 5, 6 and 7). Based on statistics from Statistics Netherlands, data from the Netherlands Enterprise Agency and calculations of the manure market, the amount of TAN has been corrected for the treatment, export and import of manure.
Fractions of manure applied to land type The amounts of manure applied to grassland, uncropped land and cropped land are based on the results of the calculations performed for purposes of monitoring the manure market. The data are supplied by the FADN of Wageningen Economic Research, and data on manure transports from the Netherlands Enterprise Agency have been used (Luesink et al., 2008; De Koeijer et al., 2012; De Koeijer et al., 2014).

Methodology for estimating emissions from agriculture in the Netherlands - Update 2019 | 87
The implementation grades of manure-application techniques are based on the results of the Agricultural Census. The 2016 Agricultural Census was the last to include questions concerning the type of manure-application techniques used on grassland, uncropped land and cropped land (CBS, 2017). Figures for cropped land are based on data from Huijsmans and Verwijs (2008). A small proportion of all manure is produced or used outside agriculture. Companies smaller than 3,000 standard outputs (SO; a standard output of 3,000 SO equals 2.5 ha grassland, corresponding to 2.5 x 170 kg N/ha = 425 kg N) designated as ‘agricultural companies’ and that produce animal manure are designated as ‘hobby farms’. Imports of less than 425 kg nitrogen by companies with designated as ‘agricultural companies’ that are not listed in the Agricultural Census have been re-designated as hobby farms. Suppliers designated as ‘agricultural companies’ that are not listed in the Agricultural Census dispose much more horse manure than do companies that are listed in the Agricultural Census. These companies have been re-designated as hobby farms. Suppliers designated as ‘agricultural companies’ that are not listed in the Agricultural Census and that dispose of less than 350 kg nitrogen have been re-designated as hobby farms. Emissions from outside agriculture are reported under NFR Category 6A (Other).
10.3.3 Emission factors
Emission factors for manure application are based on measurements. The average emission figures based on all available observations for each method, including minimum and maximum values, are presented in Table 10.2, along with the number of observations and uncertainty values (Huijsmans and Schils, 2009). Total emissions per observation were estimated as the maximum of the emission curve, fitted to the emission figures measured during the 96-hour period after application. Table 10.29 Average total emissions (% of TAN applied) for each method of applying manure on grassland and cropland, based on all available observations (n)
Method Average total
emission (% of TAN)
Minimum Maximum n Uncertainty
Grassland
Surface spreading 74 28 100 81 6%
Narrow-band (trailing
shoe)
26 9 52 29 17%
Shallow injection 16 1 63 89 19%
Uncropped land
Surface spreading 69 30 100 26
Incorporation (direct) 22 3 45 25 17%
Full coverage1) 2 1 3 7 25% 1) Full coverage: direct injection (one pass) or direct incorporation with plough.
Source: Huijsmans and Schils (2009) and Annexes 4 and 5 (Van Bruggen et al., 2018)
Emission factors for other techniques The figures from Statistics Netherlands include a manure-application technique known as ‘slit coulter’ (in Dutch, sleufkouter) for manure application on grassland. No emission data are available for this technique. Given that the slit-coulter technique results in levels of manure placement falling between those of the shallow-injection and narrow-band (trailing shoe) techniques, the emission factor for this technique is assessed as 22%, which is the average of the emission factors for shallow-injection and narrow-band application. Depending on the method of manure incorporation, a certain reduction of NH3 volatilisation can be achieved on arable land. However, the reduction achieved by incorporation in a second pass is highly dependent on the time-lag between surface spreading and incorporation (Huijsmans and De Mol, 1999). The incorporation of the manure in a second pass always leads to a certain time lag. For this reason, the emission factors for surface incorporation in two passes and ploughing in were estimated as 46% and 35%, respectively, which are the average emission values for surface spreading and direct incorporation. The application and incorporation of slurry in two passes is no longer allowed in
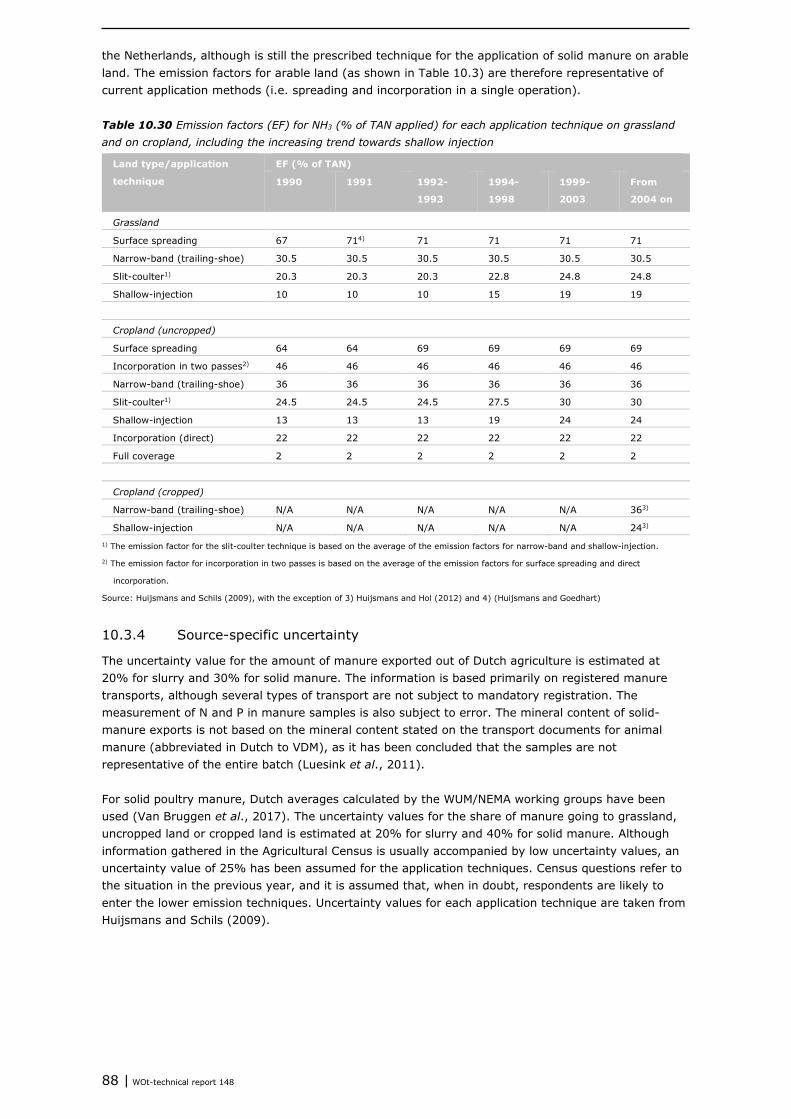
88 | WOt-technical report 148
the Netherlands, although is still the prescribed technique for the application of solid manure on arable land. The emission factors for arable land (as shown in Table 10.3) are therefore representative of current application methods (i.e. spreading and incorporation in a single operation). Table 10.30 Emission factors (EF) for NH3 (% of TAN applied) for each application technique on grassland and on cropland, including the increasing trend towards shallow injection
Land type/application
technique
EF (% of TAN)
1990 1991 1992-
1993
1994-
1998
1999-
2003
From
2004 on
Grassland
Surface spreading 67 714) 71 71 71 71
Narrow-band (trailing-shoe) 30.5 30.5 30.5 30.5 30.5 30.5
Slit-coulter1) 20.3 20.3 20.3 22.8 24.8 24.8
Shallow-injection 10 10 10 15 19 19
Cropland (uncropped)
Surface spreading 64 64 69 69 69 69
Incorporation in two passes2) 46 46 46 46 46 46
Narrow-band (trailing-shoe) 36 36 36 36 36 36
Slit-coulter1) 24.5 24.5 24.5 27.5 30 30
Shallow-injection 13 13 13 19 24 24
Incorporation (direct) 22 22 22 22 22 22
Full coverage 2 2 2 2 2 2
Cropland (cropped)
Narrow-band (trailing-shoe) N/A N/A N/A N/A N/A 363)
Shallow-injection N/A N/A N/A N/A N/A 243) 1) The emission factor for the slit-coulter technique is based on the average of the emission factors for narrow-band and shallow-injection.
2) The emission factor for incorporation in two passes is based on the average of the emission factors for surface spreading and direct
incorporation.
Source: Huijsmans and Schils (2009), with the exception of 3) Huijsmans and Hol (2012) and 4) (Huijsmans and Goedhart)
10.3.4 Source-specific uncertainty
The uncertainty value for the amount of manure exported out of Dutch agriculture is estimated at 20% for slurry and 30% for solid manure. The information is based primarily on registered manure transports, although several types of transport are not subject to mandatory registration. The measurement of N and P in manure samples is also subject to error. The mineral content of solid-manure exports is not based on the mineral content stated on the transport documents for animal manure (abbreviated in Dutch to VDM), as it has been concluded that the samples are not representative of the entire batch (Luesink et al., 2011). For solid poultry manure, Dutch averages calculated by the WUM/NEMA working groups have been used (Van Bruggen et al., 2017). The uncertainty values for the share of manure going to grassland, uncropped land or cropped land is estimated at 20% for slurry and 40% for solid manure. Although information gathered in the Agricultural Census is usually accompanied by low uncertainty values, an uncertainty value of 25% has been assumed for the application techniques. Census questions refer to the situation in the previous year, and it is assumed that, when in doubt, respondents are likely to enter the lower emission techniques. Uncertainty values for each application technique are taken from Huijsmans and Schils (2009).
Methodology for estimating emissions from agriculture in the Netherlands - Update 2019 | 89
10.4 Source-specific aspects for NH3 emissions from sewage sludge applied to soils
10.4.1 Calculation method
In the calculation of NH3 emissions from sewage-sludge application, a distinction is made between liquid and solid sludge, with a different TAN fraction for each type:
NH3 emissions sewage sludge = ∑ (Nsewage sludge x FRACliquid x TANliquid sewage sludge x EF NH3 liquid sewage sludgem + Nsewage sludge x FRACsolid x TANsolid sewage sludge x EF NH3 solid sewage sludge) x 17/14 (10.4)
Where: NH3 emissions sewage sludge: NH3 emissions (kg NH3/year) sewage sludge applied to agricultural soils Nsewage sludge : Amount of sewage sludge (kg N) applied to agricultural soils FRACliquid : Fraction of sewage sludge in liquid form TANliquid sewage sludge : Fraction of TAN in liquid sewage sludge EF NH3 liquid sewage sludge: NH3 emission factor (% of TAN applied) for liquid sewage sludge FRACsolid : Fraction of sewage sludge in solid form TANsolid sewage sludge : Fraction of TAN in solid sewage sludge EF NH3 solid sewage sludge: NH3 emission factor (% of TAN applied) for solid sewage sludge 17/14 : Conversion factor from NH3-N to NH3
10.4.2 Activity data
Amounts of sewage sludge applied to agricultural soils were available from Statistics Netherlands till 2017. Beginning in 2017, the application of sewage sludge has been derived from registered transports to agricultural holdings.
10.4.3 Emission factors
The percentage of TAN in the sludge is calculated from German data on the N and TAN contents of liquid and solid sewage sludge (Landwirtschaftliches Wochenblatt, 2007). All sewage sludge is assumed to be applied to cropland, using shallow injection for the liquid part and incorporation in two passes for the solid part. The corresponding emission factors for manure application (Table 10.4) are used. An exception is made for the first two years of the time series (1990 and 1991), in which the emission factor for surface spreading was used for both liquid and solid sewage sludge. The reason is that, before 1992, there was no obligation to incorporate sewage sludge into the soil immediately, but within a few days of application. With the use of this technique, NH3 emissions had already occurred before incorporation.
10.4.4 Source-specific uncertainty
The uncertainty value for the total usage of sewage sludge is estimated at 25%. Disaggregated uncertainty values are calculated for the liquid and solid fractions. Uncertainty values for the two emission factors combined is estimated at 100%. This figure differs from the uncertainty associated with the manure-application emission factor, as emission factors are measured for manure and not for the application of sewage sludge.
90 | WOt-technical report 148
10.5 Source-specific aspects for NH3 emissions from other organic fertilizers applied to soils (including compost)
10.5.1 Calculation method
Although two sources of compost are considered (i.e. organic waste and green refuse; see Figure 10.1); from organic waste or green refuse), it is assumed that the fraction of TAN in both sources is equal. All compost is surface-applied on uncropped land:
NH3 emissions organic fertilizers = (N organic waste compost + N green refuse compost) x TANcompost x EF NH3 compost x 17/14 (10.5)
Where: NH3 emissions organic fertilizers : NH3 emissions (kg NH3/year) from compost applied to agricultural
soils N organic waste compost : Amount of organic waste compost (kg N) applied to agricultural
soils N green refuse compost : Amount of green refuse compost (kg N) applied to agricultural soils TANcompost : Fraction of TAN in compost EF NH3 organic fertilizers : NH3 emission factor (% of TAN applied) for compost 17/14 : Conversion factor from NH3-N to NH3 Although NEMA also includes calculations for NH3 emissions from the use of compost use outside agriculture, these figures are allocated to NFR Sector 6A (Other).
10.5.2 Activity data
The amounts of N in organic (household) waste and green refuse compost are available from Statistics Netherlands.
10.5.3 Emission factors
The percentage of TAN is taken from the Arable Fertilisation Recommendations (De Haan and Van Geel (2013); Bemestingsadvies akkerbouw, www.kennisakker.nl). All compost is assumed to be applied to uncropped land, using surface spreading. The corresponding emission factor for solid manure application and incorporation in two passes is used (Table 10.4). An exception is made for the first two years of the time series (1990 and 1991), in which the emission factor is kept equal to that of later years. The reason is that, in these years, there was an obligation to incorporate surface-spread manure into the soil on uncropped lands. The emission factor was thus set lower for 1990 and 1991, although this requirement did not apply to compost. Since 1992, the surface spreading of slurry has not been allowed, and the obligation was lifted for other solid manures.
10.5.4 Uncertainty
The uncertainty value for total compost use is estimated at 25%. Given that some compost is used outside agriculture, the uncertainty value for the share of compost used in agriculture is 22.6%. The uncertainty value for TAN is 25%. Uncertainty of the emission factor is estimated to be 100%. This differs from the uncertainty value for the emission factor for manure application, as emission factors are measured for manure and not for compost application.

Methodology for estimating emissions from agriculture in the Netherlands - Update 2019 | 91
10.6 Source-specific aspects for NH3 emissions from urine and dung deposited by grazing animals
10.6.1 Calculation method
The NH3 emissions from urine and dung deposited by grazing animals is calculated from the following values: • N excretions on pasture land for each grazing livestock category (in kg N), calculated annually by
the WUM • Share of TAN in N excretions during grazing, expressed as a percentage of total N excretions
(Annex 1) • Emission factors for grazing, expressed as a percentage of TAN on pasture land (Section 10.6.3). Total NH3 emissions from grazing for all livestock categories (i) is calculated as follows:
NH3 emissions grazing = Σ AAPi x (TANi, grazing – TANi, excreted in nature areas) x EF NH3 grazing x 17/14 (10.6)
Where: NH3 emissions grazing : NH3 emissions (kg NH3/year) from grazing AAPi : Average animal population for livestock category (i) TANi, grazing : TAN excretions on pasture land (kg N/year) for livestock category (i) TANi, excreted in nature areas : TAN excretions from grazing animals in nature areas (kg N/year) for
livestock category (i) EF NH3 grazing : Emission factor (% of TAN) for grazing 17/14 : Conversion factor from NH3-N to NH3 TAN excretions on pasture land are calculated as follows:
TANi, grazing = N excretions on pasturei x FRACi, TAN pasture (10.7) Where: TANi, grazing : TAN excretions (kg N/animal/year) on pasture land for livestock category (i) N excretions on pasturei : Total N excretions (kg N/animal/year) on pasture land for livestock category
(i) FRACi, TAN pasture : Fraction of TAN in total N excretions on pasture land for livestock category
(i) The emission factor for grazing is calculated annually, based on grass composition (year-specific emission factor).
10.6.2 Activity data
Livestock numbers constitute the activity data for this emission source. Livestock numbers and their uncertainty estimates are described in Section 2.
N excretions on pasture land N excretions and uncertainty values are described in Section 2.
Percentage of TAN in pasture manure The percentage of the N excretions consisting of TAN is determined annually by the WUM for each category of grazing livestock.
TAN excretions in nature areas Nature terrain is land for which the primary function is nature and that is not regarded to be agricultural land. In addition, when an agricultural company hires or owns nature terrain, it is not treated as part of the company in the manure legislation. Disposal on nature terrain, even on a

92 | WOt-technical report 148
company’s own farm, has always subject to accounting through documents for the transport of animal manure (abbreviated in Dutch to VDM), including with regard to pasture manure. Agricultural firms with natural grassland are therefore required to submit a VDM declaring how much manure was applied this land. Because the manure remains on the company’s own property, it is likely that some companies do not declare this form of disposal on a VDM. In some cases, animals from agricultural companies are grazed on nature terrain owned by nature-protection organisations. As the owners of the land, these organisations are obliged to submit transportation documents accounting for the manure disposal on nature terrain. It is assumed that this is usually not done. The disposal of pasture manure on nature terrain owned by nature-protection organisations is estimated at 0.7 million kg P2O5 (Luesink et al., 2011). This disposal of pasture manure is divided over the livestock categories based on the production of phosphate in pasture manure. The disposal of nitrogen is calculated from the disposal of phosphate and the N/P2O5 ratio of pasture manure. In addition to the production of pasture manure on nature terrain, the disposal of stored animal manure on nature terrain is subject to accounting through transport documents. The disposals registered through transport documents are counted as disposal on natural grassland, with the manure being applied above ground.
10.6.3 Emission factors
There are no recent measurements for NH3 emissions during grazing. An emission factor (expressed as a percentage of total N excretions) was derived from a study by Bussink (1992; 1994). An emission factor based on TAN can also be derived from this work, as N excretions in urine are reported in addition to total N excretions. Several adjustments have been made to Bussink's (1992; 1994) dataset, and the emission factor for grazing (EFgrazN) has been corrected for: • Inorganic N fertilizer applied during the study by Bussink (1992; 1994), • Changes over time in grazing systems used, • Soil type.
Application of inorganic N fertilizer The emission factor for inorganic N fertilizer reported in the study by Bussink was 2% (calcium ammonium saltpetre on calcium rich clay). For several reasons, however, it could be assumed that the emissions examined in this specific study site would normally be lower, given that: • NH3 emissions from inorganic N fertilizer are inhibited by the higher NH3 concentration in the air
from grazing (application took place around three days after grazing), • Emission factors for inorganic N fertilizers are derived from experiments in which grass height was
lower than in the study by Bussink (1992; 1994), • Emissions from inorganic N fertilizer are slow, and only a part of total NH3 emissions would have
occurred during the measuring days, • Measured NH3 emissions from calcium ammonium saltpetre at the same location in another year
were 0.1% at 50 kg N/ha and 1% at 400 kg N/ha (Bussink, personal communication). In addition, the application of inorganic N fertilizer also occurred during periods without grazing or NH3 measurements. It is estimated that around 75% was applied when the measurements were performed (Bussink, personal communication). The correction for inorganic N fertilizer based on that amount and an emission factor of 1% yields a corrected NH3 emission value between 6 and 38 kg N/ha for grazing.
Grazing system In recent years, the grazing systems in the Netherlands have undergone a strong shift towards systems with limited grazing (Aarts et al., 2008; Van Bruggen and Faqiri, 2015). Bussink derived an emission factor in a situation with unlimited grazing (both day and night). Higher temperatures, wind speeds and global radiation during the day can lead to higher average NH3 emissions from fresh urine patches. Furthermore, during the night-time, the grass is wet from dew, and background concentrations of NH3 are relatively high (little dilution). This effect is also clearly visible in Bussink’s measurements. The average NH3-N flux over 24 hours was 38 g NH3-N per hour, with a flux of 46 g NH3-N per hour in the period between 07:00 and 21:30h in case of restricted grazing (Bussink, 1992). Emissions during the daytime are therefore a factor of 1.20 higher, and this factor is used to derive
Methodology for estimating emissions from agriculture in the Netherlands - Update 2019 | 93
the emission factor for systems with limited grazing based on the emissions reported by Bussink (1992; 1994).
Soil type Emissions of NH3 are also dependent on the cation exchange capacity (CEC) of the soil (Whitehead and Raistrick, 1993; Bussink, 1994). At higher CEC levels, the soil can bind NH4+ more strongly, thereby reducing the risk of NH3 emissions. The CEC correction calculated by Bussink (1996) is used as follows:
CEC correction = (7.71 – 0.02793 x (CEC – 280)) / 7.71 (10.8) The following average CEC values for each soil type were estimated based on data published by Blgg (currently Eurofins Agro in Wageningen, Netherlands) for 2007-2008 (Arjan Reijneveld [Blgg] personal communication): 70 mmolc kg-1 for sand, 180 mmolc kg-1 for clay and loess, and 300 mmolc kg-1 for peat and peat moss/cover-sand soils. The resulting correction factors for these soil types are 1.8, 1.4 and 0.9, respectively. After correcting for the use of inorganic N fertilizer and grazing systems, emission factors based on TAN vary between 4.0 and 11.7, depending on soil type. According to the national soil-use map of the Netherlands (LGN), 15% of all grassland is on peat, with 47% on sand and 39% on clay and loess. These areas and the CEC correction were used to calculate a weighted emission factor, expressed as a percentage of TAN (Bussink, 1996):
EF NH3 grazing = 4.0%, with NrationWUM < 28 g N per kg DM EF NH3 grazing = 1.98 x 10⁻⁵ * (NrationWUM)3.664, with NrationWUM ≥ 28 g N per kg DM (10.9)
Where: EF NH3 grazing : Emission factor (% of TAN) for grazing NrationWUM : Average N content of rations during the grazing season according to the
WUM (g N/kg dry matter). High N rates in feed result in high levels of N excretions and high TAN values, which in turn lead to high NH3 emissions. In the Netherlands, no measurement data are available for NH3 emissions from grazing by other species of grazing animals (other cattle, horses, ponies and sheep). It is assumed that these values are equal to those of dairy cows. For this reason, the formula for dairy cattle is also used for other grazing animals.
10.6.4 Uncertainty
The uncertainty values for livestock numbers, including the aggregation and disaggregation of subcategories, are provided in Section 2.4.3. Uncertainty values for TAN are estimated at 10%. The uncertainty value of TAN excretions in nature areas is estimated at 50%, and that of the grazing emission factor is 100%.
10.7 Source-specific aspects for NH3 emissions from crop residues
10.7.1 Calculation method
Calculation of emissions from crop residues is based on the methodology and calculations of De Ruijter et al. (2013):
NH3 emissions crop residues = ∑ arean x N in above-ground residuen x FRACn, residues x EF NH3 crop residuen x 17/14 (10.10)

94 | WOt-technical report 148
Where: NH3 emissions crop residues: NH3 emissions (kg NH3/year) from crop residues Arean : The area covered by crop (in ha) for crop type (n) N in above-ground residuen: N contained within the crop residues (kg N/ha) for crop (n) FRACn, residues : Fraction of residues contributing to NH3 emissions (i.e. not incorporated into
the soil in the first days after harvest) for crop (n) EF NH3 crop residuen : Emission factor (% of N) for crop residues (n) 17/14 : Conversion factor from NH3-N to NH3 The emission factor is based on the N content of the residues, and it assumes the full exposure of crop residues to air, both in the amounts and over time (see Section 10.7.3). As a result, the factor considers only the N in above-ground residues. The share of residues that are not incorporated into the soil are accounted for in the fraction of contributing residue. Crop residues are also produced through the cutting, drying and collection of grass for the production of silage or hay, with an assumed average amount of 1,000 kg dry matter/ha/year (De Ruijter et al., 2013). Although pasture topping also generates crop residues, it is not considered separately, as it is accounted for in the emission factor for grazing (De Ruijter et al., 2013). Emissions are calculated according the WUM formula based on the total area mown and the N content of fresh grass. Grassland renovation is calculated annually from the area of grassland remaining grassland, along with a ploughing factor.
10.7.2 Activity data
Areas of cultivated crops are derived from the Agricultural Census. Data on grassland renovation were obtained from Statistics Netherlands and Wageningen Economic Research.
10.7.3 Emission factors
Data from the WUM were used to calculate the N contents of crop residues consisting of grass. Data available from De Ruijter et al. (2013) were used to calculate the N content of residues from other crops. To calculate the percentage of N that is emitted as NH3 from crop residues, a regression model was derived from literature describing the relationship between NH3 emissions and the N content of residues (De Ruijter and Huijsmans, 2012):
EF NH3 crop residue = 0.40 x N contentm – 5.08 (10.11) Where: EF NH3 crop residue : Emission factor (% of N) for crop residues N content : N contained in above-ground crop residues (g/kg dry matter) for crop (m) Based on the regression equation, no emission occurs if the N content is less than 12.7 g/kg. The model assumes complete exposure to air of all residues for a prolonged period of time.
10.7.4 Uncertainty
The uncertainty value for the area of cultivated crops is 5% per crop. The uncertainty value for the N contents of crops is estimated at 25%. The uncertainty value associated with the fraction of crop residue that contributes to the emissions is estimated at 15%, and the uncertainty value of the emission factor is estimated at 80%.

Methodology for estimating emissions from agriculture in the Netherlands - Update 2019 | 95
10.8 Source-specific aspects for NH3 emissions during crop cultivation
10.8.1 Calculation method
Emissions from standing crops in the Netherlands have been calculated using the DEPAC resistance model (Van Zanten et al., 2010). In this model, the exchange of NH3 between the stomata of the plants, the air layer directly above the crop and the atmosphere are modelled. Emission or deposition occurs, depending on the ambient NH3 concentration and type of crop. These values were determined on an hourly basis and aggregated over the growing season. For the Netherlands, this method yielded a total emission estimate of 1.5 Gg NH3-N. This estimate has been adopted for the entire time series, instead of calculating the emissions for each year separately. This choice was made due to the high associated level of uncertainty (estimated at 300%), which originates primarily from the stomatal compensation points required for the calculation. It was deemed that using a calculation rule that takes cultivated areas into account, would represent a level of accuracy that cannot be attained at this point.
10.8.2 Activity data
A fixed estimate of NH3 emissions from standing crops is reported, based on Van Zanten et al. (2010), thereby eliminating the need for activity data.
10.8.3 Emission factors
A fixed estimate of NH3 emissions from standing crops is reported, based on Van Zanten et al. (2010), thereby eliminating the need for emission factors.
10.8.4 Uncertainty
The uncertainty of estimated NH3 emissions from standing crops is 300% (Van Zanten et al., 2010).
10.9 Uncertainty estimates
An overview of all uncertainty values for the activity data, the implied emission factors and the emissions included in the category of NH3 emissions from crop production and agricultural soils is provided in Table 10.4. Table 10.31 Uncertainty values for activity data (U AD), implied emission factors (U IEF) and NH3 emissions (U emissions) from crop production and agricultural soils
EMEP Source category U AD U IEF U emissions
3Da1 Inorganic N fertilizers 26% 26% 37%
3Da2a Animal manure applied to soils 4% 38% 38%
3Da2b Sewage sludge applied to soils 25% 84% 88%
3Da2c Other organic fertilizers applied to soils 23% 106% 111%
3Da3 Urine and dung deposited by grazing animals 1% 56% 56%
3Da4 Crop residues applied to soils 7% 59% 59%
3De Cultivated crops 300%
Total, agricultural soils 29%

Methodology for estimating emissions from agriculture in the Netherlands - Update 2019 | 97
11 NOx emissions from crop production and agricultural soils (NFR Category 3D)
11.1 Scope and definition
The NFR Source Category 3D (Crop production and agricultural soils) consists of: • 3Da1 Inorganic N fertilizers (including urea application) • 3Da2a Livestock manure applied to soils • 3Da2b Sewage sludge applied to soils • 3Da2c Other organic fertilizers applied to soils (including compost) • 3Da3 Urine and dung deposited by grazing animals • 3Da4 Crop residues applied to soils No emissions of NOx occur in Source Categories 3Db (Indirect emissions from managed soils), 3Dc (Farm-level agricultural operations including storage, handling and transport of agricultural products), 3Dd (Off-farm storage, handling and transport of bulk agricultural products), 3De (Cultivated crops) or 3Df (Use of pesticides). Given that field burning is prohibited by law in the Netherlands, no emissions occur in Category 3F (Field burning of agricultural residues). Finally, a choice was made to report emissions from the cultivation of organic soils under Category 3I (Agriculture other). Although emissions are reported as NO (nitrogen monoxide) in the NEMA, they are referred to as NOx in this report, in order to prevent confusion with the notation key NO.
11.2 Source-specific aspects for NOx emissions from the application of inorganic N fertilizer
11.2.1 Calculation method
Total NOx emissions from inorganic N fertilizers are calculated as follows:
NOx emissions inorganic fertilizer = Ninorganic fertilizer x EF NOx inorganic fertilizer x 30/14 (11.1) Where: NOx emissions fertilizer : NOx emission (kg NOx/year, expressed as nitrogen monoxide) for inorganic
N fertilizers Ninorganic fertilizer : Amount of N (kg N/year) from inorganic N fertilizers EF NOx fertilizer : NOx emission factor for inorganic N fertilizer (kg NOx-N/kg N applied) 30/14 : Conversion factor from NOx-N to NOx, expressed as nitrogen monoxide
11.2.2 Activity data
The usage of the different types of inorganic N fertilizers is taken from the statistics on synthetic fertilizer available from Wageningen Economic Research. For years from 2016, the usage of the various types of inorganic N fertilizers is taken from the statistics on inorganic fertilizer statistics available from the FADN. Consistency between these two data sources has been verified and confirmed (Van Bruggen et al., 2019).
98 | WOt-technical report 148
11.2.3 Emission factors
The NOx emissions from N input to the soil are calculated using the default EMEP emission factor of 0.012 kg NOx-N/kg N input.
11.2.4 Source-specific uncertainty
The uncertainty value for usage is estimated at 25% for inorganic N fertilizer and 40% for rinsing liquid (Section 10.2.4). The uncertainty value for the emission factor is given as 160% in the EMEP Guidebook (EEA, 2016).
11.3 Source-specific aspects for NOx emissions from animal manure applied to soils
11.3.1 Calculation method
Total NOx emissions from animal manure applied to soils are calculated as follows:
NOx emissions manure application = Nanimal manure x EF NOx manure application x 30/14 (11.2) Where: NOx emissions manure application: NOx emissions (kg NOx/year, expressed as nitrogen monoxide)
from animal manure applied to soils Nanimal manure : Amount of N (kg N/year) from animal manure applied to soils EF NOx application : NOx emission factor for animal manure applied to soils (kg NOx-N/kg N
applied) 30/14 : Conversion factor from NOx-N to NOx, expressed as nitrogen monoxide
11.3.2 Activity data
The amount of N that is applied with manure to the soil is calculated from N excretions in urine, the mineralisation of organic N in animal housing and the loss of gaseous N occurring in animal housing, manure storage facilities and manure treatment, as described in greater detail in Section 10.3. Based on statistics from Statistics Netherlands, data from RVO and calculations of the manure market, these figures have been corrected for the treatment, export and import of manure. Their calculation (including the underlying uncertainty values) is described in Section 10.3.
11.3.3 Emission factors
The NOx emissions from N input to the soil are calculated using the default EMEP emission factor of 0.012 kg NOx-N/kg N input.
11.3.4 Uncertainty
The calculated uncertainty value for the amount of N in animal manure applied to soils is 3%. The uncertainty value for the emission factor is given as 160% in the EMEP Guidebook (EEA, 2016).
11.4 Source-specific aspects for NOx emissions from sewage sludge applied to soils
11.4.1 Calculation method
Total NOx emissions from sewage sludge applied to soils are calculated as follows:
NOx emissions sewage sludge = Nsewage sludge x EF NOx sewage sludge x 30/14 (11.3)

Methodology for estimating emissions from agriculture in the Netherlands - Update 2019 | 99
Where: NOx emissions sewage sludge: NOx emissions (kg NOx/year, expressed as nitrogen monoxide) from
sewage sludge applied to soils Nsewage sludge : Amount of N (kg N/year) from sewage sludge applied to soils EF NOx sewage sludge : NOx emission factor for sewage sludge applied to soils (kg NOx-N/kg N
applied) 30/14 : Conversion factor from NOx-N to NOx, expressed as nitrogen monoxide
11.4.2 Activity data
Amounts of sewage sludge applied to agricultural soils were available from Statistics Netherlands till 2017. From 2017 onwards, the application of sewage sludge has been derived from registered transports to agricultural holdings.
11.4.3 Emission factors
The NOx emissions from N input to the soil are calculated using the default EMEP emission factor of 0.012 kg NOx-N/kg N input.
11.4.4 Uncertainty
The uncertainty value for total usage of sewage sludge is estimated at 25%. Disaggregated uncertainty values have been calculated for the liquid and solid fractions. The uncertainty value for the emission factor is given as 160% in the EMEP Guidebook (EEA, 2016).
11.5 Source-specific aspects for NOx emissions from other organic fertilizers applied to soils (including compost)
11.5.1 Calculation method
Total NOx emissions from compost are calculated as follows:
NOx emissions organic fertilizers = Σ Norganic fertilizers x EF NOx organic fertilizers x 30/14 (11.4) Where: NOx emissions organic fertilizers: NOx emissions (kg NOx/year, expressed as nitrogen monoxide) from
compost applied to agricultural soils Norganic fertilizers : Amount of N (kg N/year) in compost EF NOx organic fertilizers: NOx emission factor for organic fertilizers applied to soils (kg NOx-N/kg N
applied) 30/14 : Conversion factor from NOx-N to NOx, expressed as nitrogen monoxide
11.5.2 Activity data
The amount of compost applied to agricultural soils is calculated by Statistics Netherlands.
11.5.3 Emission factors
The NOx emissions from N input to the soil are calculated using the default EMEP emission factor of 0.012 kg NOx-N/kg N input.
11.5.4 Uncertainty
The uncertainty value for total compost usage is estimated at 25%. The uncertainty value for the emission factor is given as 160% in the EMEP Guidebook (EEA, 2016).
100 | WOt-technical report 148
11.6 Source-specific aspects for NOx emissions from urine and dung deposited by grazing animals
11.6.1 Calculation method
Total NOx emissions from urine and dung deposited by grazing animals are calculated as follows:
NOx emissions grazing = Ngrazing x EF NOx grazing x 30/14 (11.5) Where: NOx emissions grazing : NOx emissions (kg NOx/year, expressed as nitrogen monoxide) from urine
and dung deposited by grazing animals Ngrazing : Amount of N (kg N/year) in urine and dung deposited by grazing animals EF NOx grazing : NOx emission factor for urine and dung deposited by grazing animals to soils
(kg NOx-N/kg N) 30/14 : Conversion factor from NOx-N to NOx, expressed as nitrogen monoxide
11.6.2 Activity data
Part of the animal manure is produced on pasture land during grazing. The amount of nitrogen per animal is calculated by the WUM and is available from Statistics Netherlands. Information on animal figures is provided in Section 2.
11.6.3 Emission factors
The NOx emissions from N input to the soil are calculated using the default EMEP emission factor of 0.012 kg NOx-N/kg N input.
11.6.4 Uncertainty
The uncertainty value for the amount of nitrogen deposited on pasture land is calculated to be 16%, and it is described in Section 10.6. The uncertainty value for the emission factor is given as 160% in the EMEP Guidebook (EEA, 2016).
11.7 Source-specific aspects for NOx emissions from crop residues
11.7.1 Calculation method
Total NOx emissions from crop residues applied to soils are calculated as follows:
NOx emissions crop residues = Ncrop residues x EF NOx crop residues x 30/14 (11.6) Where: NOx emissions crop residues: NOx emissions (kg NOx/year, expressed as nitrogen monoxide) from crop
residues present on agricultural soils Ncrop residues : Amount of N (kg N/year) from crop residues applied to agricultural soils EF NOx crop residues : NOx emission factor for remaining crop residues on soils (kg NOx-N/kg N) 30/14 : Conversion factor from NOx-N to NOx, expressed as nitrogen monoxide
11.7.2 Activity data
In accordance with the IPCC calculation rules, the activity data include all arable and outdoor horticultural crops (e.g. but not greenhouse farming). All crops falling under both of these categories are included in the Agricultural Census (available from www.cbs.nl), and they are included in the calculations for NOx emissions. In addition, a fixed country-specific value in kg N per hectare per crop

Methodology for estimating emissions from agriculture in the Netherlands - Update 2019 | 101
type is used for the nitrogen content of above-ground crop residues. Finally, the calculations consider the fact that, in some cases, part of the above-ground crop residues are removed from the field and thus do not contribute to NOx emissions. Country-specific values are used for these removals (Van der Hoek et al., 2007).The areas used for these crops are taken from the annual Agricultural Census. Mowing losses and pasture renovation are also taken into account.
11.7.3 Emission factors
The NOx emissions from N input to the soil are calculated using the default EMEP emission factor of 0.012 kg NOx-N/kg N input.
11.7.4 Uncertainty
The uncertainty values for area and nitrogen content are described in Section 10. The uncertainty value for the emission factor is given as 160% in the EMEP Guidebook (EEA, 2016).
11.8 Source-specific aspects for NOx emissions from the agricultural use of organic soils
11.8.1 Calculation method
The NOx emissions are determined by multiplying the area of peat and other organic soils by specific mineralisation in the Netherlands and default EMEP emission factors. Total NOx emissions from organic soils are calculated as follows:
NOx emissions organic soils = Σ areap, soil type x mineralisationp x EF NOx organic soils x 30/14 (11.7) Where: NOx emissions organic soils: NOx emissions (kg NOx/year, expressed as nitrogen monoxide) for all
defined soil types Areap, soil type : Area of various soil types (ha) for soil type (p) Mineralisationp : Amount of N mineralised (kg N/ha/year) for soil type (p) EF NOx organic soils : NOx emission factor for the agricultural use of organic soils (kg NOx-N/ha) 30/14 : Conversion factor from NOx-N to NOx, expressed as nitrogen monoxide
11.8.2 Activity data
The areas of organic soils cultivated are estimated from the land-use maps of the sector classified as ‘Land Use, Land Use Change and Forestry’ (LULUCF). Maps are available for the base years 1990, 2004, 2009 and 2013. Between these years, interpolation takes place. An overview of the areas is provided in Annex 18 of Van Bruggen et al. (2015).
11.8.3 Emission factors
The average mineralisation is 233.5 kg N per hectare for peat soil and 204.5 kg N per hectare for other organic soil (Kuikman et al., 2005). The default EMEP emission factor of 0.012 kg NOx-N/kg N input is used.
11.8.4 Uncertainty
The uncertainty value for the area of histosols is estimated at 20%. Kuikman et al. (2005) specifies an uncertainty value of 25% for mineralisation. The uncertainty value for the area of other organic soils is estimated at 35%. Because this category falls between sand and peat and is harder to detect, the uncertainty values are higher than those for the area of histosols. The EMEP Guidebook gives a default uncertainty value of 160% for the emission factor.

102 | WOt-technical report 148
11.9 Uncertainty estimates
An overview of all uncertainty estimates for the activity data, the implied emission factors and the emissions included in the category of NOx emissions from crop production and agricultural soils is provided in Table 11.8. Table 11.32 Uncertainty values for activity data (U AD), implied emission factors (U IEF) and NOx emissions (U emissions) from crop production and agricultural soils
EMEP Source category U AD U IEF U emissions
3Da1 Inorganic N fertilizers 27% 160% 168%
3Da2a Animal manure applied to soils 3% 160% 160%
3Da2b Sewage sludge applied to soils 25% 160% 167%
3Da2c Other organic fertilizers applied to soils 23% 160% 166%
3Da3 Urine and dung deposited by grazing animals 16% 160% 163%
3Da4 Crop residues applied to soils 6% 122% 122%
Total, agricultural soils 87%

Methodology for estimating emissions from agriculture in the Netherlands - Update 2019 | 103
12 N2O emissions from crop production and agricultural soils (CRF Sector 3D)
12.1 Scope and definition
This section provides a description of the methodology and working processes for determining direct and indirect emissions of N2O from the soil as a result of agricultural activities in the Netherlands. It refers to the CRF Source Categories 3Da (Direct N2O emissions from managed soils) and 3Db (Indirect N2O emissions from managed soils), subdivided into: • 3Da1 Inorganic N fertilizers • 3Da2 Organic N fertilizers (further subdivided into animal manure, sewage sludge and other
organic fertilizers applied to soils) • 3Da3 Urine and dung deposited by grazing animals • 3Da4 Crop residues • 3Da6 Cultivation of organic soils (i.e. histosols) • 3Db1 Indirect N2O emissions from atmospheric deposition • 3Db2 Indirect N2O emissions from nitrogen leaching and runoff In Source Category 3Da5 (Mineralisation/immobilisation associated with loss/gain of soil organic matter), only emissions from cropland that remains cropland are required to be reported. According to the methodology used for the sector designated as ‘Land Use, Land Use Change and Forestry’ (LULUCF) in the Netherlands, no emissions occur in this case (Arets et al., 2019). Moreover, the Netherlands has not allocated emissions to Source Category 3Da7 (Other). Nitrous oxide is formed in the soil during the microbiological processes of nitrification and denitrification. Nitrification is the process whereby ammonia (NH4+) is converted into nitrate by bacteria under aerobic (i.e. oxygen-rich) conditions. In slurry, oxygen is the limiting factor for nitrification. Nitrous oxide can be formed as a by-product, particularly if the nitrification process is delayed through lack of oxygen. No organic substances are required for nitrification. Denitrification is the microbiological transformation of NO3- into the gaseous nitrogen compound N2 under anaerobic (low-oxygen) conditions, with N2O as a by-product. Organic substances are used as energy sources. Organic soils have higher emissions of nitrous oxide than do mineral soils. The IPCC Guidelines give separate estimates for the direct and indirect emissions of nitrous oxide from the agricultural sector (IPCC, 2006). Direct emissions occur within the agricultural system, resulting primarily from the application of inorganic N fertilizers and animal manure. Indirect emissions of nitrous oxide have to do with the formation of N2O in soils and aquatic systems as a result of nitrogen losses from the soil to air and water. They are attributed to agriculture, regardless of whether emission occurs on agricultural land or whether agricultural activities form the initial source, even within the same country.
12.2 Source-specific aspects for direct N2O emissions from the application of inorganic N fertilizer
12.2.1 Calculation method
Direct N2O emissions from inorganic N fertilizers are calculated by multiplying the amount of nitrogen of inorganic N fertilizers by a country-specific emission factor:
N2O emissions inorganic fertilizer = Ninorganic fertilizer x EF N2O inorganic fertilizer x 44/28 (12.1)
104 | WOt-technical report 148
Where: N2O emissions inorganic fertilizer: N2O emissions (kg N2O) from inorganic N fertilizers applied to
agricultural soil Ninorganic fertilizer : Application of N from inorganic N fertilizers (kg N) EF N2O inorganic fertilizer: Emission factor (kg N2O-N/kg N) for the application of N from inorganic N
fertilizer 44/28 : Conversion factor from N2O-N to N2O
Comparison to IPCC methodology The methodology described above is consistent with the IPCC method, as described in the IPCC Guidelines (IPCC, 2006).
12.2.2 Activity data
Amount of nitrogen in inorganic N fertilizer applied to soil Usage figures for the various types of inorganic N fertilizers are taken from the statistics on synthetic fertilizer statistics available from Wageningen Economic Research. Beginning with 2016, usage figures for the various types of inorganic N fertilizers have been taken from the statistics on inorganic fertilizer available from the FADN. Consistency between the two data sources has been verified and confirmed (Van Bruggen et al., 2019).
12.2.3 Emission factors
An emission factor of 0.013 is used for the application of inorganic N fertilizer. This factor is the weighted mean of various inorganic N fertilizers and soil types (Velthof et al., 2010; Velthof and Mosquera, 2011; Van Schijndel and Van der Sluis, 2011;, see Annex 10).
12.2.4 Uncertainty
Uncertainty values are estimated at 25% for inorganic N fertilizer and 40% for rinsing liquid (Section 10.2.4). The uncertainty value for the emission factor is estimated at 37% (see Annex 11).
12.3 Source-specific aspects for direct N2O emissions from animal manure applied to soils
12.3.1 Calculation method
Direct N2O emissions from the application of N from animal manure are calculated by multiplying the amount of nitrogen application from animal manure by a country-specific emission factor.
N2O emissions manure application = Σ Nanimal manure x EF N2O manure applicationi x 44/28 (12.2) Where: N2O emissions inorganic fertilizer: N2O emissions (kg N2O) from the application of animal manure to
agricultural soils Nanimal manure : Amount of N (kg N/year) from animal manure applied to soils EF N2O manure applicationi: Emission factor (kg N2O-N/kg N) for the application of N from animal
manure for application technique (i) 44/28 : Conversion factor from N2O-N to N2O The use of animal manure is divided into two types of manure-application techniques, each having its own country-specific emission factor (Annex 10 and Velthof and Mosquera, 2011). These emissions are reported under their respective CRF categories, with the sources ‘animal manure’, ‘sewage sludge’ and ‘compost’ reported together under 3Da2 (Organic N fertilizers). The methodology described above conforms to the IPCC method, as described in the IPCC Guidelines (IPCC, 2006).

Methodology for estimating emissions from agriculture in the Netherlands - Update 2019 | 105
12.3.2 Activity data
Amount of nitrogen in animal manure applied to soil The amount of nitrogen applied to soils is calculated using the N flow. The calculation of N excretions is described in Section 2. Emissions in animal housing and outside manure storage facilities are calculated using the method described in Sections 2 and 4. The amount of nitrogen applied to soils is determined by the amount of nitrogen in animal manure, after subtracting emissions from animal housing and outside storage and adding the N in net exported manure (i.e. export - import).
12.3.3 Emission factors
An emission factor of 0.004 kg N2O-N per kg net applied N is used for surface spreading. This factor is 0.009 for the application of low-emission manure. Both of these figures are weighted means for mineral and organic soils. The higher emission factor for low-emission manure-application methods is caused by the larger amount of N that is available for nitrification/denitrification when this method is used (Velthof et al., 2010; Velthof and Mosquera, 2011; Van Schijndel and Van der Sluis, 2011; see Annex 10). The amounts of manure applied using surface spreading and using low-emission techniques are taken from the Agricultural Census.
12.3.4 Uncertainty
The uncertainty value for the amount of manure applied is calculated according to the N-flow calculation, with a corresponding uncertainty value of 3%. The uncertainty value for the fraction of low-emission techniques is estimated at 5%, with a value of 50% for the fraction of surface spreading (based on expert judgement). The uncertainty value for the low-emission application emission factor is 70.4%, with an uncertainty value of 80.5% for surface spreading. The calculation of these uncertainties is described in Annex 11.
12.4 Source-specific aspects for direct N2O emissions from sewage sludge applied to soils
12.4.1 Calculation method
Direct emissions of nitrous oxide from sewage sludge are calculated by multiplying the amount of nitrogen from sewage sludge by a country-specific emission factor.
N2O emissions sewage sludge = Nsewage sludge x EF N2O sewage sludge x 44/28 (12.3) Where: N2O emissions sewage sludge: N2O emissions (kg N2O) from sewage sludge applied to agricultural
soils Nsewage sludge : Amount of N (kg N) from sewage sludge EF N2O sewage sludge : Emission factor (kg N2O-N/kg N) for sewage sludge 44/28 : Conversion factor from N2O-N to N2O These emissions are reported under their respective CRF categories, with the sources ‘Animal manure’, ‘Sewage sludge’ and ‘Compost’ reported together under Category 3Da2 (Organic N fertilizers).
Comparison to IPCC methodology The methodology described above conforms to the IPCC method, as described in the IPCC Guidelines (IPCC, 2006).
12.4.2 Activity data
Amounts of sewage sludge applied to agricultural soils were available from Statistics Netherlands till 2017. From 2017 onwards, the application of sewage sludge is derived from registered transports to agricultural holdings.

106 | WOt-technical report 148
12.4.3 Emission factors
For sewage sludge, the emission factors and uncertainty values for manure application are used: 0.004 kg N2O-N per kg N for surface application and 0.009 kg N2O-N for low-ammonia emission application.
12.4.4 Uncertainty
The uncertainty value for total sewage sludge usage is estimated at 25%. Disaggregated uncertainty values are calculated for the liquid and solid fractions. The uncertainty value for the emission factor is estimated at 100%. This is higher than the uncertainty value for the same emission factors for manure application, as the measurements relate to application of animal manure.
12.5 Source-specific aspects for direct N2O emissions from other organic fertilizers applied to soils (including compost)
12.5.1 Calculation method
Direct N2O emissions from compost are calculated by multiplying the amount of nitrogen from compost by a country-specific emission factor.
N2O emissions organic fertilizers = Norganic fertilizers x EF N2O organic fertilizers x 44/28 (12.4) Where: N2O emissions organic fertilizers: N2O emissions (kg N2O) from organic fertilizers applied to
agricultural soils Norganic fertilizers : Amount of N from compost in kg N EF N2O organic fertilizers: Emission factor for compost (kg N2O-N/kg N) 44/28 : Conversion factor from N2O-N to N2O These emissions are reported under their respective CRF categories, with the sources ‘Animal manure’, ‘Sewage sludge’ and ‘Compost’ reported together under 3Da2 (Organic N fertilizers).
Comparison to IPCC methodology The methodology described above conforms to the IPCC method, as described in the IPCC Guidelines (IPCC, 2006).
12.5.2 Activity data
The amounts of organic waste and green refuse compost applied to agricultural soils or used outside the context of agriculture are calculated by Statistics Netherlands and published through Statline.
12.5.3 Emission factors
All compost is assumed to be surface-applied, with an emission factor of 0.004 kg N2O-N per kg N applied (Section 12.3).
12.5.4 Uncertainty
The uncertainty value for total compost usage is estimated at 25%. The uncertainty value for the emission factor is 100%. This is higher than the uncertainty value calculated for the emission factor reported in Section 12.3, as no emission factor is available for the application of compost. The emission factor is therefore assumed to be the same as for the application of manure.
Methodology for estimating emissions from agriculture in the Netherlands - Update 2019 | 107
12.6 Source-specific aspects for direct N2O emissions from urine and dung deposited by grazing animals
12.6.1 Calculation method
The N2O emissions from urine and dung deposited by grazing animals are calculated by multiplying the amount of nitrogen by a country-specific emission factor.
N2O emissions grazing = Ngrazing x EF N2O grazing x 44/28 (12.5) Where: N2O emissions grazing : N2O emissions (kg N2O) from urine and dung deposited by grazing animals Ngrazing : Amount of N for livestock category (kg N/year) in urine and dung deposited
by grazing animals EF N2O grazing : Emission factor (kg N2O-N/kg N) for urine and dung deposited by grazing
animals 44/28 : Conversion factor from N2O-N to N2O These emissions are reported under their respective CRF categories.
Comparison to IPCC methodology The methodology described above conforms to the IPCC method, as described in the IPCC Guidelines (IPCC, 2006).
12.6.2 Activity data
Some animal manure is produced on pasture land. The amount of nitrogen per animal is calculated by the WUM and available from www.cbs.nl. Statistics concerning the livestock populations are also available on the CBS website.
12.6.3 Emission factors
An emission factor of 0.033 kg N2O-N per kg net produced N is used for grazing. This factor is a weighted mean over soil types (see Annex 10).
12.6.4 Uncertainty
The uncertainty value for nitrogen excretion is described in Section 2.4.3. The uncertainty for the emission factor is 64.3%. The uncertainty value is calculated using uncertainty values for the emission factors for each soil type and for the distribution of manure distribution over these soil types (Annex 11).
12.7 Source-specific aspects for direct N2O emissions from crop residues
12.7.1 Calculation method
Direct N2O emissions from crop residues are calculated by multiplying the amount of nitrogen from crop residues by a country-specific emission factor.
N2O emissions crop residues = Ncrop residues x EF N2O crop residues x 44/28 (12.6) Where: N2O emissions crop residues: N2O emissions (kg N2O) from crop residues present on agricultural soils Ncrop residues: Amount of N (kg N/year) from crop residues applied to agricultural soils EF N2O crop residues: Emission factor (kg N2O-N/kg N) for crop residues 44/28: Conversion factor from N2O-N to N2O
108 | WOt-technical report 148
These emissions are reported under their respective CRF categories.
Comparison to IPCC methodology The methodology described above conforms to the IPCC method, as described in the IPCC Guidelines (IPCC, 2006).
12.7.2 Activity data
Amount of nitrogen in crop residues In accordance with the IPCC calculation rules, these values include all arable and outdoor horticultural crops (e.g. but not greenhouse farming). All crops falling under these two categories are included in the Agricultural Census (available at www.cbs.nl), and they are included in the calculations for nitrous oxide emissions. In addition, a fixed country-specific value in kg N per hectare per crop type is used for the nitrogen content of above-ground and below-ground crop residues. Finally, the calculations consider the fact that, in some cases, part of the above-ground crop residues are removed from the field and thus do not contribute to nitrous oxide emissions. Country-specific values are used for these removals, as reported in Van der Hoek et al. (2007). The areas used for these crops are taken from the annual Agricultural Census, which includes all agricultural companies that are headquartered in the Netherlands and that are larger than or equal to three Netherlands size units (nge, until 2009) or 3,000 Standard Outputs (SO, from 2010).
12.7.3 Emission factors
An emission factor of 0.01 kg N2O-N per kg N is used for crop residues remaining on mineral soils. This value is estimated from Dutch research studies conducted in the first half of the 1990s (Kroeze, 1994). Arable farming and outdoor horticulture hardly ever occur in organic soils.
12.7.4 Uncertainty
Uncertainty values for areas of crops are described in Section 10. The uncertainty value for activity data for pasture renewal is estimated at 25%. The uncertainty value for the emission factor is estimated at 80%, based on Kroeze (1994). This value is dependent on the age and management of the grass.
12.8 Source-specific aspects for direct N2O emissions from the agricultural use of organic soils
12.8.1 Calculation method
Direct nitrous oxide emissions from agricultural use of organic soils are calculated by multiplying the amount of mineralised nitrogen in organic soils (peat soils and other organic soils) by a country-specific emission factor.
N2O emissions organic soils = Σ areap, soil type x mineralisationp x EF N2O organic soils x 44/28 (12.7) Where: N2O emissions organic soils: N2O emissions (kg N2O) for all defined soil types Mineralisationp : Amount of N mineralised (kg N/ha/year) for soil type (p) Areap, soil type : Area of various soil types (ha) for soil type (p) EF N2O organic soils : Emission factor (kg N2O-N/kg N) for mineralised nitrogen in organic soils 44/28 : Conversion factor from N2O-N to N2O These emissions are reported under their respective CRF categories.

Methodology for estimating emissions from agriculture in the Netherlands - Update 2019 | 109
Comparison to IPCC methodology The methodology described above conforms to the IPCC method, as described in the IPCC Guidelines (IPCC, 2006).
12.8.2 Activity data
Nitrous oxide emissions are determined by multiplying the area of peat and other organic soils by specific Dutch mineralisation rates and emission factors. The extent of the areas of cultivated land are estimated from the land-use maps of the sector designated as ‘Land Use, Land Use Change and Forestry’ (LULUCF). Maps are available for the base years 1990, 2004, 2009 and 2013. Between these years, interpolation takes place. An overview of the resulting areas is provided in Annex 18 of Van Bruggen et al. (2015).
12.8.3 Emission factors
The average mineralisation values are 233.5 kg N per hectare of peat soil and 204.5 kg N per hectare of other organic soil (Kuikman et al., 2005). Using an emission factor of 0.02 (taken largely from Dutch research projects conducted in the first half of the 1990s and reported in Kroeze, 1994), the nitrous oxide emissions of histosols amount to 4.67 kg N2O–N per hectare of peat soil and 4.09 kg N2O-N per hectare of other organic soils.
12.8.4 Uncertainty
The uncertainty value for the area of histosols is estimated at 20%. The uncertainty value for the area of other organic soils is estimated at 35%. Because this area is a category between sand and peat, it is harder to detect, and the uncertainty values are therefore greater than those for the area of histosols. The uncertainty value for mineralisation is 25% (expert judgement based on Kuikman et al., 2005). Kroeze (1994) provides emission factors ranging from 1.25% to 2.5%. The greater of these two values yields an uncertainty value of 37.5%. The emission factor used for the histosols is also used for other organic soils. The uncertainty value is greater (50%), given that measurements are conducted only for histosols.
12.9 Source-specific aspects for indirect N2O emissions after atmospheric depositions of NH3 and NOx
12.9.1 Calculation method
Indirect N2O emissions occur after atmospheric depositions of nitrogen compounds that have evaporated in the form of NH3 and NOx from animal housing and manure storage (attributed to manure management; see Sections 5 and 6), as well as from inorganic N fertilizer, the application of animal manure, grazing, sewage sludge and compost (attributed to agricultural soils; this section). Indirect N2O emissions after atmospheric depositions of nitrogen compounds are calculated by multiplying the amount of nitrogen by the default 2006 IPCC emission factors.
N2O emissions indirect soil = Natmospheric deposition x EF N2O emissions indirect soil x 44/28 (12.8) Where: N2O emissions indirect soil: Indirect N2O emissions (kg N2O) from the soil after atmospheric deposition
of nitrogen compounds Natmospheric deposition : Amount of N (kg N) from atmospheric deposition EF N2O indirect soil : Default IPCC emission factor (kg N2O-N/kg N supply) for atmospheric
deposition 44/28 : Conversion factor from N2O-N to N2O
110 | WOt-technical report 148
Comparison to IPCC methodology The aforementioned method is similar to the IPCC method, as described in the IPCC Guidelines (IPCC, 2006), although the IPCC also differentiates another supply source: N2O formed in the atmosphere from NH3 emissions. Because the IPCC provides no calculation method for this source, the nitrous oxide emissions created by NH3 in the atmosphere are not included here. The extent of the various supply sources is determined using country-specific data at the Tier 2 or Tier 3 level. The N2O emissions are determined through Tier 1 analysis. Default IPCC emission factors are used.
12.9.2 Activity data
Although the term ‘deposition’ is used here, it does not refer to actual depositions of NH3 and NOx, but to the total NH3 and NOx emissions produced by the agricultural sector in the Netherlands (as derived from the IPCC Guidelines). This refers primarily to the total depositions of all NH3 and NOx emitted by the Dutch agricultural sector, regardless of their geographic location (thus also including those outside the country’s borders). The extent of the NH3 emissions from the application of inorganic N fertilizer and animal manure, as well as during grazing are calculated within the National Emission Model for Agriculture (NEMA) using country-specific emission factors (described in Section 10). For NOx emissions, EMEP default emission factors for the application of inorganic N fertilizer, for the application of animal manure and for grazing are applied (described in Section 11).
12.9.3 Emission factors
Due to the lack of measurement data in the Netherlands, IPCC default emission factors of 0.01 kg N2O–N per kg N supply were used when calculating indirect emissions of nitrous oxide (Denier van der Gon et al., 2004; Van der Hoek et al., 2007).
12.9.4 Uncertainty
The uncertainty value for total emissions from agricultural soils in the form of NH3 and NOx is calculated to be 25.9%. IPCC gives an uncertainty value of 400% for the emission factor.
12.10 Source-specific aspects for indirect N2O emissions from leaching and runoff of nitrogen added to the soil
12.10.1 Calculation method
Indirect nitrous oxide emissions from aquatic systems occur through leaching and runoff of nitrogen (especially nitrate) from agricultural soils. Nitrate undergoes de-nitrification in groundwater or surface water, thereby creating nitrous oxide. The following calculation rule is used for calculating nitrous oxide emissions for this supply source:
N2O emissions leaching = Napplied to soil x FRACleach x EF N2O leaching x 44/28 (12.9) Where: N2O emissions leaching : N2O emissions (kg N2O) from leaching and runoff of nitrogen added to the
soil Napplied to soil : Amount of N (kg N) applied to the soil FRACleach : Fraction of nitrogen leaching and running off EF N2O leaching : N2O leaching emission factor (kg N2O-N/kg N supply) 44/28 : Conversion factor from N2O-N to N2O

Methodology for estimating emissions from agriculture in the Netherlands - Update 2019 | 111
The amount of nitrogen (Napplied to soil) refers to the total amount of inorganic N fertilizer and animal manure applied to soils, together with pasture manure, crop residues, sewage sludge, compost and the mineralisation of organic soils. The emission factor used is the IPCC default, and the FRACleach is country-specific. Further background information on the FRACleach values is provided in Velthof and Mosquera (2011). Further information concerning the nitrous oxide emission factor of 0.0075 is provided in the 2006 IPCC Guidelines (IPCC, 2006, p. 11.24).
Comparison to IPCC methodology The aforementioned method is similar to the IPCC method, as described in the IPCC Guidelines (IPCC, 2006), although the IPCC also differentiates another supply source: effluent discharged from sewage treatment plants into surface water. The nitrous oxide emissions created from effluent discharged into surface water are not included in the agricultural sector, but in CRF Category 5B. The extent of the various supply sources is determined using country-specific data at the Tier 2 or Tier 3 level. The N2O emissions are determined through Tier 1 analysis. Default IPCC emission factors are used.
12.10.2 Activity data
Activity data include all nitrogen applied to soils directly, inorganic fertilizer (described in Section 12.2), animal manure (described in Section 12.3), sewage sludge (described in Section 12.4), compost (described in Section 12.5), urine and dung deposited by grazing animals (described in Section 12.6), crop residues (described in Section 12.7) and the mineralisation of organic soils (described in Section 12.8).
12.10.3 Emission factors
With respect to the leaching and runoff of nitrogen added to soil, the emission factor refers to the share of nitrogen that is leached and run off: the ‘FRACleach’ (Table 12.1). A country-specific value between 15% to 13% is applied, due to the relatively high groundwater tables in the Netherlands (Velthof and Mosquera, 2011). The default emission factor of 0.0075 is used. Table 12.33 FRACleach and nitrous oxide emission factors for indirect nitrous oxide emissions from leaching and runoff
Supply source Factor
FRACleach 0.15 kg N per kg N to soil (1990-1991)
0.14 kg N per kg N to soil (1992-1997)
0.13 kg N per kg N to soil (1998-present)
Nitrous oxide emission factor 0.0075 kg N2O–N per kg N leached/runoff
Source: Velthof and Mosquera (2011)
12.10.4 Uncertainty
The uncertainty value for the amount of N added to the soil is calculated at 10.0%. The uncertainty value for FRACleach is estimated at 50%. The uncertainty value for the emission factor is 233% (largest range in the Guidelines: greatest value 0.025).
12.11 Uncertainty estimates
An overview of all uncertainty values for the activity data, the implied emission factors and the emissions included in the category of N2O emissions from crop production and agricultural soils is provided in Table 12.2.

112 | WOt-technical report 148
Table 12.34 Uncertainty values for activity data (U AD), implied emission factors (U IEF) and N2O emissions (U emissions) from crop production and agricultural soils
IPCC Source category U AD U IEF U emissions
3Da1 Inorganic N fertilizers 24% 37% 45%
3Da2a Animal manure applied to soils 3% 66% 66%
3Da2b Sewage sludge applied to soils 25% 100% 106%
3Da2c Other organic fertilizers applied to soils 25% 100% 106%
3Da3 Urine and dung deposited by grazing animals 15% 64% 67%
3Da4 Crop residues 7% 35% 35%
3Da6 Cultivation of organic soils (i.e. histosols) 18% 37% 41%
3Db1 Atmospheric deposition 26% 400% 414%
3Db2 Nitrogen from leaching and runoff 51% 233% 267%
Total, agricultural soils 36%

Methodology for estimating emissions from agriculture in the Netherlands - Update 2019 | 113
13 NMVOC emissions from crop production and agricultural soils (NFR Sector 3D)
13.1 Scope and definition
This section provides a description of the methods and working processes for determining NMVOC emissions from silage storage, manure application, urine and dung deposited by grazing animals and crop production, according to the following NFR categories: • 3Da2a Animal manure applied to soils • 3Da3 Urine and dung deposited by grazing animals • 3Dc Farm-level agricultural operations including storage, handling and transport of agricultural
products • 3De Cultivated crops The emission of NMVOC occurs when manure is applied to the soil, during grazing (through the deposit of urine and manure) and during the storage of silage. No estimates are provided for NMVOC emissions during the application of organic/inorganic fertilizer or sewage sludge, as no emission factors are available for these sources. The NMVOC from manure are produced during the degradation of fats, carbohydrates and proteins present in the manure. The composition of manure therefore influences the emission of NMVOC. Given the existence of a correlation between NH3 and NMVOC emissions from manure management, the ratio of NH3 emissions from animal housing to those from manure application is used to divide NMVOC emissions over these categories, as described in the EMEP Guidebook (EEA, 2016). The calculation used for the application of cattle manure differs from that used for the other animal categories. The NMVOC calculations for cattle manure are based on the energy content of the cattle feed. For the other animal categories, the VS content of the manure is used.
13.2 Source-specific aspects for NMVOC emissions from animal manure applied to soils
13.2.1 Calculation method
The methods used are described in the EMEP Guidebook (EEA, 2016). The NMVOC emissions from the application of manure are calculated as follows:
NMVOC manure application = ∑ AAPi x NMVOC animal housingi x (NH3 manure applicationi / NH3 animal housingi) (13.1)
Where: NMVOC manure application: NMVOC emissions (kg NMVOC) for manure application for livestock
category (i) AAPi : Average animal population for livestock category (i) NMVOC animal housingi : NMVOC emissions (kg NMVOC/animal/year) from manure in livestock
housing for animal category (i), as calculated in Section 8.2

114 | WOt-technical report 148
NH3 manure applicationi : NH3 emissions (kg NH3/year) from manure application for livestock category (i), as calculated in Section 10.3
NH3 animal housingi : Total NH3 emissions (kg NH3/year) from animal housing for livestock category (i), as calculated in Section 5.2
13.2.2 Activity data
Livestock numbers constitute the activity data for this emission source. Livestock numbers and their uncertainty estimates are described in Section 2.4.3. The NMVOC emissions from animal housing are described in Section 8.2. The emissions of NH3 from manure application and NH3 from animal housing are described in Sections 10.3 and 5.2, respectively.
13.2.3 Emission factors
The NMVOC emissions from animal manure applied to soils are based on the emissions of animal manure in housing (described in Section 8.2).
13.2.4 Uncertainty
The uncertainty value for livestock numbers, including the aggregation/disaggregation of subcategories, is given in Section 2.4.3. The uncertainty value for the emission factors is 300% (estimate based on expert judgement).
13.3 Source-specific aspects for NMVOC emissions from urine and dung deposited by grazing animals
13.3.1 Calculation method
The methods used are described in the EMEP Guidebook (EEA, 2016).
Dairy and non-dairy cattle The NMVOC emissions from urine and dung deposited by grazing of cattle are calculated as follows:
NMVOC emissions pasturecattle = ∑ AAPi x GEi x (1- FRACi, time spent inside) x EF NMVOC pasturei (13.2) Where: NMVOC pasturecattle : NMVOC emissions (kg NMVOC/year) during grazing, for all cattle categories
(i) AAPi : Average animal population for cattle category (i) GEi : Gross energy intake in megajoules (MJ/animal/year) for cattle category (i) FRACi, time spent inside : Fraction of time spent inside housing facilities for cattle category (i) EF NMVOC pasturei : Emission factor (kg NMVOC/MJ) for grazing for cattle category (i)
Other livestock The NMVOC emissions from urine and dung deposited by grazing by livestock categories other than cattle are calculated as follows:
NMVOC emissions pastureother = ∑i AAPi x VSi x (1- FRACi, time spent inside) x EF NMVOC pasturei (13.3) Where: NMVOC pastureother: NMVOC emissions (kg NMVOC/year) during grazing for all other livestock
categories (i) AAPi: Average animal population for livestock category (i) VSi: Volatile solids (kg VS/year) excreted by livestock category (i) FRACi, time spent inside: Fraction of time spent inside housing facilities for other livestock category (i) EF NMVOC pasturei: Emission factor (kg NMVOC/animal) for grazing of livestock category (i)
Methodology for estimating emissions from agriculture in the Netherlands - Update 2019 | 115
13.3.2 Activity data
Livestock numbers constitute the activity data for this emission source. Livestock numbers and their uncertainty estimates are described in Section 2.4.3. The gross feed intake of cattle, the composition of feed and the time spent inside housing facilities are calculated by the WUM (CBS, 2008 through 2018). For the VS excretion of sheep, goats, horses, ponies and mules and asses, the IPCC default values (as listed in Table 8.1) are used (IPCC, 2006).
13.3.3 Emission factors
The Tier 2 default emission factors from the EMEP Guidebook are used (EEA, 2016). All emission factors are listed in Table 13.1. Table 13.35 NMVOC emission factors (EF) of grazing used for each livestock category (EEA, 2016)
Livestock category EF for grazing Unit
Cattle 0.0000069 kg NMVOC/MJ
Sheep 0.00002349 kg NMVOC/kg VS excreted
Goats 0.00002349 kg NMVOC/kg VS excreted
Horses 0.00002349 kg NMVOC/kg VS excreted
Mules and asses 0.00002349 kg NMVOC/kg VS excreted
13.3.4 Uncertainty
The uncertainty value for livestock numbers, including the aggregation/disaggregation of subcategories, is given in Section 2.4.3. The uncertainty value for the emission factors is 300% (estimate based on expert judgement).
13.4 Source-specific aspects for NMVOC emissions from farm-level agricultural operations, including the storage, handling and transport of agricultural products
13.4.1 Calculation method
The methods used are described in the EMEP Guidebook (EEA, 2016). It is assumed that the NMVOC emissions from the storage of silage are a fraction of the NMVOC emissions from silage feeding in animal housing.
Dairy and non-dairy cattle The NMVOC emissions from silage storage for cattle feeding are calculated as follows:
NMVOC emissions silage storagecattle = ∑ AAPi x GEi x FRACi, time spent inside x (FRACi, silage x EF NMVOC silage storagei) x 0.25 (13.4)
Where: NMVOC emissions silage storagecattle: NMVOC emissions (kg NMVOC/year) from the storage of silage
for all cattle categories (i) AAPi : Average animal population for cattle category (i) GEi : Gross energy intake in megajoules (MJ/animal) per year (i) FRACi, time spent inside : Fraction of time spent inside animal housing for cattle category (i) FRACi, silage : Fraction of gross energy uptake consisting of silage (i) EF NMVOC silage storagei : Emission factor (kg NMVOC/MJ) for NMVOC from the storage of silage for
cattle category (i) 0.25 : Fraction of emissions from silage storage compared to emissions from
silage feeding in animal housing
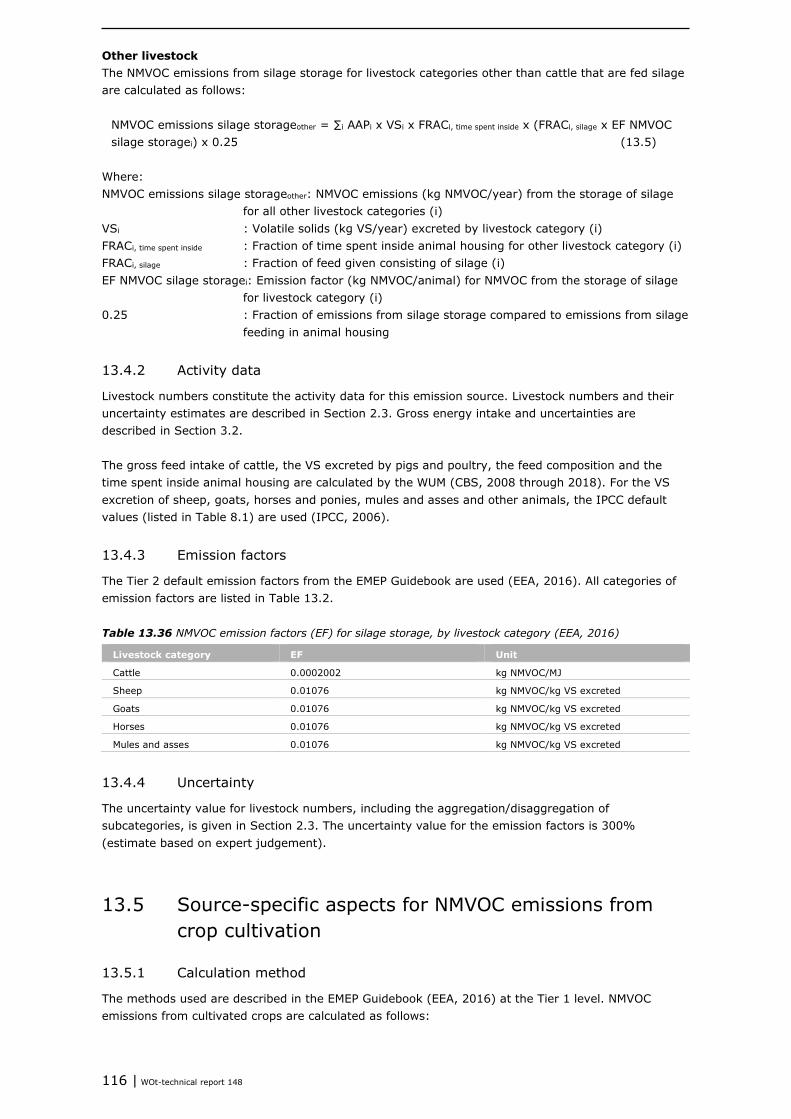
116 | WOt-technical report 148
Other livestock The NMVOC emissions from silage storage for livestock categories other than cattle that are fed silage are calculated as follows:
NMVOC emissions silage storageother = ∑i AAPi x VSi x FRACi, time spent inside x (FRACi, silage x EF NMVOC silage storagei) x 0.25 (13.5)
Where: NMVOC emissions silage storageother: NMVOC emissions (kg NMVOC/year) from the storage of silage
for all other livestock categories (i) VSi : Volatile solids (kg VS/year) excreted by livestock category (i) FRACi, time spent inside : Fraction of time spent inside animal housing for other livestock category (i) FRACi, silage : Fraction of feed given consisting of silage (i) EF NMVOC silage storagei: Emission factor (kg NMVOC/animal) for NMVOC from the storage of silage
for livestock category (i) 0.25 : Fraction of emissions from silage storage compared to emissions from silage
feeding in animal housing
13.4.2 Activity data
Livestock numbers constitute the activity data for this emission source. Livestock numbers and their uncertainty estimates are described in Section 2.3. Gross energy intake and uncertainties are described in Section 3.2. The gross feed intake of cattle, the VS excreted by pigs and poultry, the feed composition and the time spent inside animal housing are calculated by the WUM (CBS, 2008 through 2018). For the VS excretion of sheep, goats, horses and ponies, mules and asses and other animals, the IPCC default values (listed in Table 8.1) are used (IPCC, 2006).
13.4.3 Emission factors
The Tier 2 default emission factors from the EMEP Guidebook are used (EEA, 2016). All categories of emission factors are listed in Table 13.2. Table 13.36 NMVOC emission factors (EF) for silage storage, by livestock category (EEA, 2016)
Livestock category EF Unit
Cattle 0.0002002 kg NMVOC/MJ
Sheep 0.01076 kg NMVOC/kg VS excreted
Goats 0.01076 kg NMVOC/kg VS excreted
Horses 0.01076 kg NMVOC/kg VS excreted
Mules and asses 0.01076 kg NMVOC/kg VS excreted
13.4.4 Uncertainty
The uncertainty value for livestock numbers, including the aggregation/disaggregation of subcategories, is given in Section 2.3. The uncertainty value for the emission factors is 300% (estimate based on expert judgement).
13.5 Source-specific aspects for NMVOC emissions from crop cultivation
13.5.1 Calculation method
The methods used are described in the EMEP Guidebook (EEA, 2016) at the Tier 1 level. NMVOC emissions from cultivated crops are calculated as follows:
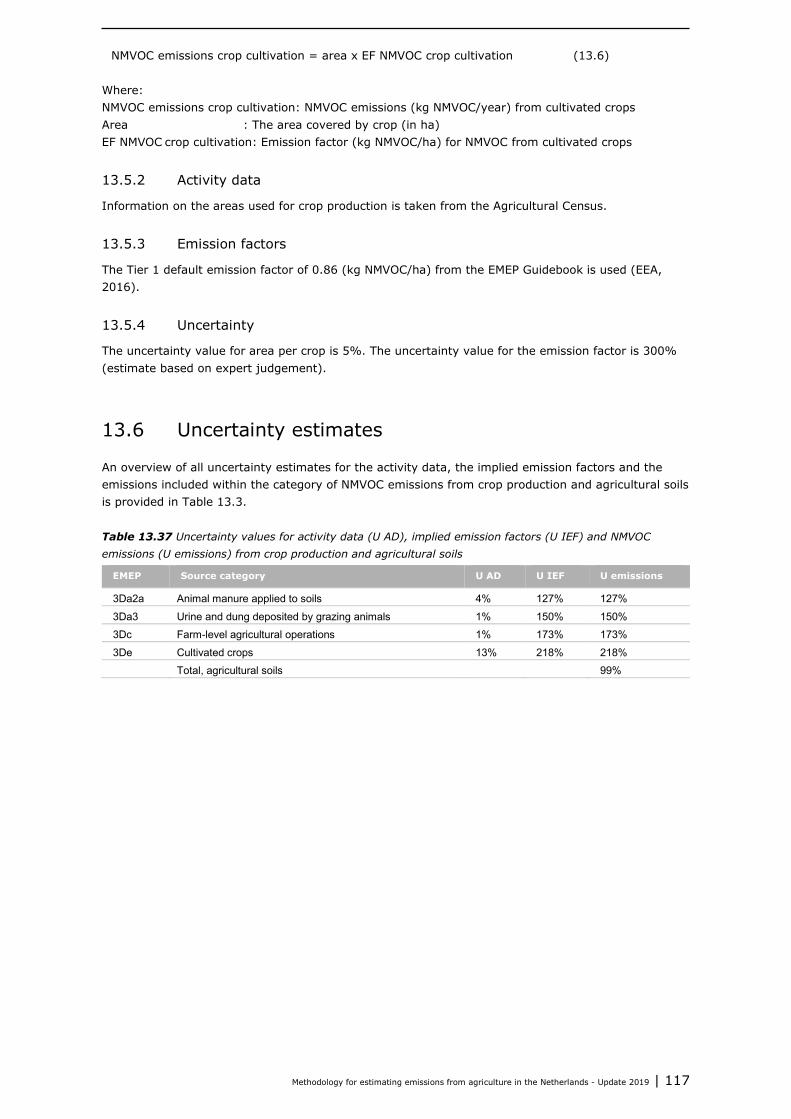
Methodology for estimating emissions from agriculture in the Netherlands - Update 2019 | 117
NMVOC emissions crop cultivation = area x EF NMVOC crop cultivation (13.6) Where: NMVOC emissions crop cultivation: NMVOC emissions (kg NMVOC/year) from cultivated crops Area : The area covered by crop (in ha) EF NMVOC crop cultivation: Emission factor (kg NMVOC/ha) for NMVOC from cultivated crops
13.5.2 Activity data
Information on the areas used for crop production is taken from the Agricultural Census.
13.5.3 Emission factors
The Tier 1 default emission factor of 0.86 (kg NMVOC/ha) from the EMEP Guidebook is used (EEA, 2016).
13.5.4 Uncertainty
The uncertainty value for area per crop is 5%. The uncertainty value for the emission factor is 300% (estimate based on expert judgement).
13.6 Uncertainty estimates
An overview of all uncertainty estimates for the activity data, the implied emission factors and the emissions included within the category of NMVOC emissions from crop production and agricultural soils is provided in Table 13.3. Table 13.37 Uncertainty values for activity data (U AD), implied emission factors (U IEF) and NMVOC emissions (U emissions) from crop production and agricultural soils
EMEP Source category U AD U IEF U emissions
3Da2a Animal manure applied to soils 4% 127% 127%
3Da3 Urine and dung deposited by grazing animals 1% 150% 150%
3Dc Farm-level agricultural operations 1% 173% 173%
3De Cultivated crops 13% 218% 218%
Total, agricultural soils 99%

Methodology for estimating emissions from agriculture in the Netherlands - Update 2019 | 119
14 PM10 and PM2.5 emissions from crop production and agricultural soils (NFR Category 3D)
14.1 Scope and definition
The NFR Source Category 3D (Crop production and agricultural soils) consists of the following: • 3Dc Farm-level agricultural operations, including the storage, handling and transport of agricultural
products • 3De Cultivated crops • 3Df Use of pesticides Emissions of PM occurring during the use of inorganic N fertilizers, as well as during the loading of fertilizer application equipment. These values are therefore not reported under Category 3Da1 (Inorganic N fertilizers, including urea application) but under Category 3Dc (Farm-level agricultural operations, including the storage, handling and transport of agricultural products). No emissions of PM occur in Source Categories 3Da2a (Livestock manure applied to soils), 3Da2a (Sewage sludge applied to soils), 3Da2c (Other organic fertilizers applied to soils, including compost), 3Da3 (Urine and dung deposited by grazing animals), 3Da4 (Crop residues applied to soils) and 3Db (Indirect emissions from managed soils). Activities falling under Category 3Dd (Off-farm storage, handling and transport of bulk agricultural products) are covered by other sectors. Given that field burning is prohibited by law (Article 10.2 of the Environmental Management Act; in Dutch, Wet Milieubeheer), no emissions take place in Category 3F (Field burning of agricultural residues). Finally, the Netherlands has opted not to report PM emissions under Category 3I (Agriculture other). Particulate matter emissions from crop production occur during soil cultivation or crop harvesting, and depend on crop sort, soil type, methods used and the weather. Particulate matter is also emitted during other agricultural activities (e.g. during haymaking and in the use of concentrates, inorganic N fertilizers and pesticides). These emissions are allocated to Categories 3De and 3Dc, respectively.
14.2 Source-specific aspects for PM emissions from farm-level operations
14.2.1 Calculation method
Emissions of PM from farm-level operations consist of PM10 and PM2.5 from the use of feed, fertilizer and pesticides. Emissions of PM during the transport and handling of feed, fertilizer and pesticide have been calculated once, using a country-specific method (Chardon and Van der Hoek, 2002) and kept constant for the entire time series.
14.2.2 Activity data
Activity data for the use of inorganic fertilizer are described in Section 10.2.2.
14.2.3 Emission factor
The emission estimates for farm-level operations are presented in Table 14.1.

120 | WOt-technical report 148
Table 14.38 Emission estimates for particulate matter from farm-level operations
Source category PM10 (ton/year) PM2.5(ton/year)
Inorganic fertilizers 105.0 21.0
Concentrates 90.0 18.0
Pesticides 125.0 25.0
Source: Chardon and Van der Hoek (2002).
14.2.4 Uncertainty
Uncertainty values for the use of fertilizer, pesticide and feed are estimated at 25% (based on expert judgement). The use of rinsing liquid does not result in any emission of PM, as a liquid is involved. Uncertainty values for the emission estimates are estimated at 100% (based on expert judgement).
14.3 Source-specific aspects for PM emissions from crop cultivation
14.3.1 Calculation method
Emissions of PM from crop cultivation are calculated using a Tier 2 method. The area of each crop is multiplied by a specific emission factor. The total PM emissions from all crop sorts are then calculated by summing the PM emissions for each crop. Crop cultivation is calculated using the following formula:
PM emissions crop cultivation = ∑ arean x EF PM crop cultivationn (14.1) Where: PM emissions crop cultivation: PM emissions (kg PM/year) from cultivated crops Arean : Cropped area for the defined crop (n) (ha) EF PM crop cultivationn : Emission factor (kg PM/ha) for the defined crop (n) The emission factor in the aforementioned formula considers the following operations in wet climate conditions: 1. Soil cultivation 2. Harvesting 3. Cleaning 4. Drying Emissions from haymaking have been calculated by multiplying production by an emission factor. Due to uncertainty values, however, the emissions are kept constant throughout the time series. These emissions are reported under NFR Category 3Dc (Farm-level agricultural operations, including the storage, handling and transport of agricultural products).
Comparison to EMEP methodology The methodology described above conforms to the method of the EMEP Guidebook (EEA, 2016).
14.3.2 Activity data
Information on the areas used for crop production is taken from the Agricultural Census. The production of haymaking is taken from Chardon and Van der Hoek (2002).
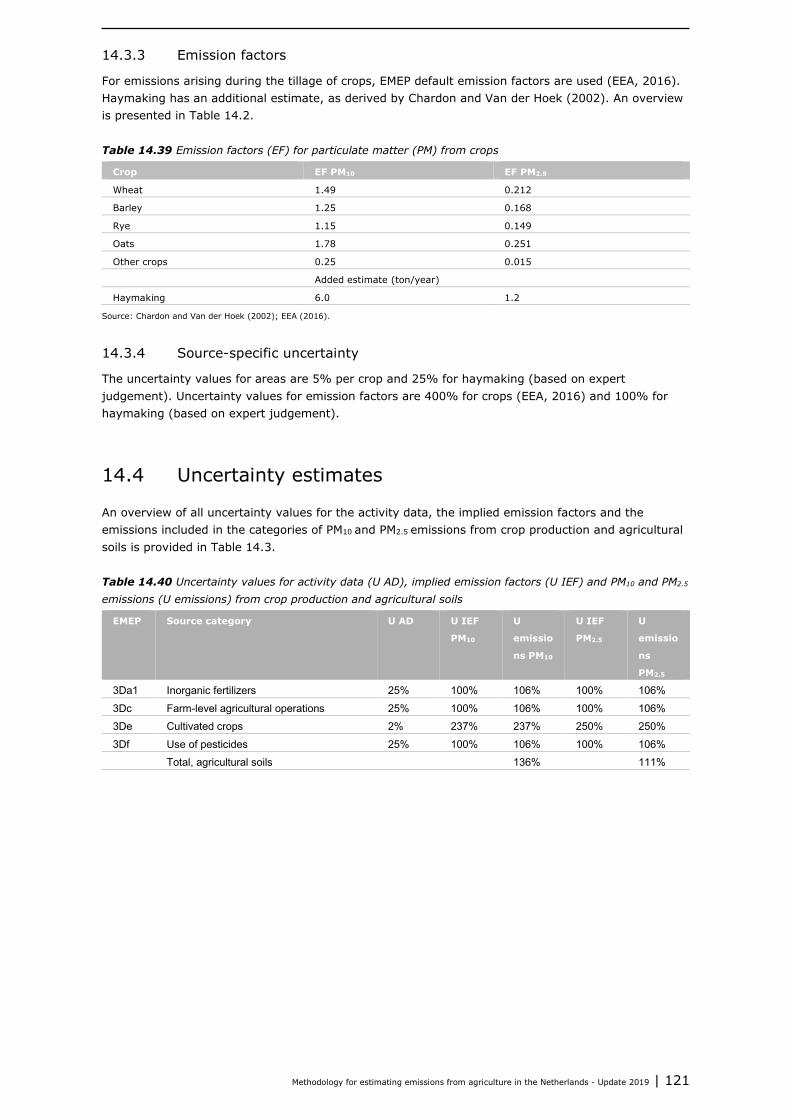
Methodology for estimating emissions from agriculture in the Netherlands - Update 2019 | 121
14.3.3 Emission factors
For emissions arising during the tillage of crops, EMEP default emission factors are used (EEA, 2016). Haymaking has an additional estimate, as derived by Chardon and Van der Hoek (2002). An overview is presented in Table 14.2. Table 14.39 Emission factors (EF) for particulate matter (PM) from crops
Crop EF PM10 EF PM2.5
Wheat 1.49 0.212
Barley 1.25 0.168
Rye 1.15 0.149
Oats 1.78 0.251
Other crops 0.25 0.015
Added estimate (ton/year)
Haymaking 6.0 1.2
Source: Chardon and Van der Hoek (2002); EEA (2016).
14.3.4 Source-specific uncertainty
The uncertainty values for areas are 5% per crop and 25% for haymaking (based on expert judgement). Uncertainty values for emission factors are 400% for crops (EEA, 2016) and 100% for haymaking (based on expert judgement).
14.4 Uncertainty estimates
An overview of all uncertainty values for the activity data, the implied emission factors and the emissions included in the categories of PM10 and PM2.5 emissions from crop production and agricultural soils is provided in Table 14.3. Table 14.40 Uncertainty values for activity data (U AD), implied emission factors (U IEF) and PM10 and PM2.5
emissions (U emissions) from crop production and agricultural soils
EMEP Source category U AD U IEF
PM10
U
emissio
ns PM10
U IEF
PM2.5
U
emissio
ns
PM2.5
3Da1 Inorganic fertilizers 25% 100% 106% 100% 106%
3Dc Farm-level agricultural operations 25% 100% 106% 100% 106%
3De Cultivated crops 2% 237% 237% 250% 250%
3Df Use of pesticides 25% 100% 106% 100% 106%
Total, agricultural soils 136% 111%

Methodology for estimating emissions from agriculture in the Netherlands - Update 2019 | 123
15 CO2 emissions from liming (CRF Category 3G)
15.1 Scope and definition
Calcareous fertilizers (calcic limestone (CaCO3) and dolomite (CaMg(CO3)2) are used to reduce soil acidity. Emissions of CO2 occur as carbonate lime dissolves and releases bicarbonate. Bicarbonate (2HCO3-) dissolves into H2O and CO2.
15.2 Source-specific aspects
15.2.1 Calculation method
Emissions of CO2 resulting from the use of lime on agricultural soils are determined for reporting in Table 3G of the CRF. The CO2 emissions can be calculated according to the following Tier 1 method:
CO2 emissions 3G = (limestone use x EF CO2 limestone + dolomite use x EF CO2 dolomite) x 44/12 (15.1)
Where: CO2 emissions 3G : Carbon dioxide emissions (kg CO2/year) from CRF Source Category 3G
(Liming) EF CO2 limestone : Emission factor (kg CO2-C/kg applied) for limestone EF CO2 dolomite : Emission factor (kg CO2-C/kg applied) for dolomite 44/12 : Conversion factor from CO2-C to CO2
15.2.2 Activity data
Information on the amount of carbonate applied to soil originates from Wageningen Economic Research. Input on the use of carbonate comes from industrial processing records and import/export data from retailers of lime fertilizers. Beginning with 2016, the usage of the various types of inorganic N fertilizers is taken from the statistics on inorganic fertilizer statistics available from the FADN. The available figures are totals, and they do not specify application on grassland and cropland separately. Given that all C will eventually be emitted as CO2, there is no need to derive separate emission factors. For this reason, totals are used.
15.2.3 Emission factors
IPCC 2006 Tier 1 default values are used for the use of lime on agricultural soils (i.e. 0.12 kg CO2-C/kg limestone and 0.13 kg CO2-C/kg dolomite). These values translate to 440 kg CO2/ton pure limestone and 477 kg CO2/ton pure dolomite.
15.2.4 Uncertainty
The uncertainty value for the use of limestone is 36.9%, and the uncertainty value for the use of dolomite is 34.0% (calculated from 25% in total use; based on expert judgement). The uncertainty value for both emission factors is 1% (based on expert judgement). This uncertainty is very low, as all C will ultimately be emitted as CO2.
15.3 Uncertainty estimates
The uncertainty values for liming, implied emission factors and resulting CO2 emissions are presented in Table 15.1.

124 | WOt-technical report 148
Table 15.41 Uncertainty values (U) for activity data (AD), implied emission factors (IEF) and CO2 emissions (U emissions) from liming
IPCC Source category U AD U IEF U emissions
Limestone 37% 1% 37%
Dolomite 34% 1% 34%
3G Liming 25%
Methodology for estimating emissions from agriculture in the Netherlands - Update 2019 | 125
References
Aarts, H.F.M., C.H.G. Daatselaar, and G. Holshof (2008). Bemesting, meststofbenutting en opbrengst van productiegrasland en snijmaïs op melkveebedrijven (in Dutch). Report 208 Plant Research International. Wageningen UR, Wageningen, the Netherlands
Arets, E.J.M.M., J.W.H. van der Kolk, G.M. Hengeveld, J.P. Lesschen, H. Kramer, P.J. Kuikman, and M.-J. Schelhaas (2019). Greenhouse gas reporting for the LULUCF sector in the Netherlands: methodological background, update 2019. WOt-technical report 146. Statutory Research Tasks Unit for Nature & the Environment. WUR, Wageningen, the Netherlands.
Bannink, A., J. Dijkstra, J.A.N. Mills, E. Kebreab, and J. France (2005). Nutritional strategies to reduce enteric methane formation in dairy cows, Emissions from European agriculture.
Bannink, A., J. Kogut, J. Dijkstra, J. France, E. Kebreab, A.M. Van Vuuren, and S. Tamminga (2006). Estimation of the stoichiometry of volatile fatty acid production in the rumen of lactating cows, Journal of theoretical biology, 238: 36-51.
Bannink, A., J. France, S. Lopez, W.J.J. Gerrits, E. Kebreab, S. Tamminga, and J. Dijkstra (2008). Modelling the implications of feeding strategy on rumen fermentation and functioning of the rumen wall, Animal Feed Science and Technology, 143: 3-26.
Bannink, A. (2011). Methane emissions from enteric fermentation in dairy cows, 1990-2008. Wageningen UR Livestock Research, Lelystad, the Netherlands
Bannink, A., M.W. Van Schijndel, and J. Dijkstra (2011). A model of enteric fermentation in dairy cows to estimate methane emission for the Dutch National Inventory Report using the IPCC Tier 3 approach. Background document on the calculation method and uncertainty analysis for the Dutch National Inventory Report on Greenhouse Gas emissions., Animal Feed Science and Technology, 166: 603-618.
Bannink, A., L. Šebek, and J. Dijkstra (2016). Evaluatie berekening VC_RE in NEMA 2015 (in Dutch). Confidential Report 465 Wageningen UR Livestock Research, Lelystad, the Netherlands
Bannink, A., J.W. Spek, J. Dijkstra, and L. Sebek (2017). Use of a Tier 3 method for enteric methane to estimate faecal N digestibility and ammoniacal N excretion in dairy cows.
Bannink, A., W.J. Spek, J. Dijkstra, and L.B.J. Šebek (2018). A Tier 3 Method for Enteric Methane in Dairy Cows Applied for Fecal N Digestibility in the Ammonia Inventory, 2.
Beline, F., J. Martinez, C. Marol, and G. Guiraud (1998). Nitrogen transformations during anaerobically stored 15N-labelled pig slurry, Bioresource technology, 64: 83-88.
Berends, H., W.J.J. Gerrits, J. France, J. Ellis, S.M. Van Zijderveld, and J. Dijkstra (2014). Evaluation of the SF6 tracer technique for estimating methane emission rates with reference to dairy cows using a mechanistic model, Journal of theoretical biology, 353: 1-8.
Bouwman, A.F., L.J.M. Boumans, and N.H. Batjes (2002). Estimation of global NH3 volatilization loss from synthetic fertilizers and animal manure applied to arable lands and grasslands, Global Biogeochemical Cycles, 16: 8-1-8-14.
Van Bruggen, C., A. Bannink, C.M. Groenestein, B.J. De Haan, J.F.M. Huijsmans, H.H. Luesink, S.M. Van der Sluis, G.L. Velthof, and J. Vonk (2014). Emissies naar lucht uit de landbouw in 2012: Berekeningen met het model NEMA (in Dutch). WOt-technincal report 3 Wettelijke Onderzoekstaken Natuur & Milieu, Wageningen UR, Wageningen, the Netherlands.
Van Bruggen, C., A. Bannink, C.M. Groenestein, J.F.M. Huijsmans, H.H. Luesink, S.M. van der Sluis, G.L. Velthof, and J. Vonk (2015). Emissies naar lucht uit de landbouw, 1990-2013: Berekeningen met het
126 | WOt-technical report 148
model NEMA (in Dutch). Wettelijke Onderzoekstaken Natuur & Milieu, Wageningen UR, Wageningen, the Netherlands.
Van Bruggen, C., and F. Faqiri (2015). Trends in beweiden en opstallen van melkkoeien en het effect op emissies naar lucht (in Dutch), CBS Web article 2015-2.
Van Bruggen, C., A. Bannink, C.M. Groenestein, J.M. Huijsmans, H.H. Luesink, S.V. Oude Voshaar, S.M. Van der Sluis, G.L. Velthof, and J. Vonk (2017). Emissies naar lucht uit de landbouw in 2015: Berekeningen met het model NEMA (in Dutch). WOt-technical report Wettelijke Onderzoekstaken Natuur & Milieu, Wageningen UR, Wageningen, the Netherlands.
Van Bruggen, C., A. Bannink, C.M. Groenestein, J.M. Huijsmans, L.A. Lagerwerf, H.H. Luesink, S.V. Oude Voshaar, S.M. Van der Sluis, G.L. Velthof, and J. Vonk (2018). Emissies naar lucht uit de landbouw in 2016: Berekeningen met het model NEMA (in Dutch). WOt-technical report Wettelijke Onderzoekstaken Natuur & Milieu, Wageningen UR, Wageningen, the Netherlands
Van Bruggen, C., A. Bannink, C.M. Groenestein, J.M. Huijsmans, L.A. Lagerwerf, H.H. Luesink, S.M. Van der Sluis, G.L. Velthof, and J. Vonk (2019). Emissies naar lucht uit de landbouw in 2017: Berekeningen met het model NEMA (in Dutch). WOt-technical report 147. Wettelijke Onderzoekstaken Natuur & Milieu, WUR, Wageningen, the Netherlands
Bussink, D.W. (1992). Ammonia volatilization from grassland receiving nitrogen fertilizer and rotationally grazed by dairy cattle, Fertilizer research, 33: 257-265.
Bussink, D.W. (1994). Relationships between ammonia volatilization and nitrogen fertilizer application rate, intake and excretion of herbage nitrogen by cattle on grazed swards, Fertilizer research, 38: 111-121.
Bussink, D.W. (1996). Ammonia volatilization from intensively managed dairy pastures. Wageningen University, Wageningen, the Netherlands.
CBS (2008 through 2018). Dierlijke mest en mineralen 2006 t/m 2018 (C. van Bruggen; in Dutch). Statistics Netherlands, Den Haag/Heerlen, the Netherlands.
CBS (2012a). Standardised calculation methods for animal manure and nutrients. Standard data 1990-2008. Statistics Netherlands, The Hague/Heerlen, the Netherlands
CBS (2012b). Uncertainty analysis of mineral excretion and manure production. Statistics Netherlands, The Hague/Heerlen, the Netherlands
CBS (2017). Dierlijke mest en mineralen 2016 (C. van Bruggen; in Dutch). Statistics Netherlands, Den Haag/Heerlen, the Netherlands.
Chardon, W.J., and K.W. Van der Hoek (2002). Berekeningsmethode voor de emissie van fijn stof vanuit de landbouw [Calculation of particulate matter emissions from agriculture] (in Dutch), Alterra Wageningen UR/National Institute for Public Health and the Environment, Wageningen/Bilthoven, the Netherlands, Alterra-report 682/RIVM-report 773004014.
Coenen, P.W.H.G., C.W.M. van der Maas, P.J. Zijlema, E.J.M.M. Arets, K. Baas, A.C.W.M. van den Berghe, E.P. van Huis, G. Geilenkirchen, M. Hoogsteen, J. Spijker, R. te Molder, R. Dröge, J.A. Montfoort, C. Peek, J. Vonk, S. Oude Voshaar, and S. Dellaert (2017). Greenhouse gas emissions in the Netherlands 1990-2015 : National Inventory Report 2017. National Institute for Public Health and the Environment, Bilthoven, the Netherlands
Denier van der Gon, H.A.C., A. Bleeker, T. Ligthart, J.H. Duijzer, P.J. Kuikman, J.W. Van Groenigen, W. Hamminga, C. Kroeze, H.P.J. De Wilde, and A. Hensen (2004). Indirect nitrous oxide emissions from the Netherlands: source strength, methodologies, uncertainties and potential for mitigation, TNO report, 2004: 275.
Van der Hoek, K.W. (2002). Uitgangspunten voor de mest-en ammoniakberekeningen 1999 tot en met 2001 zoals gebruikt in de Milieubalans 2001 en 2002, inclusief dataset landbouwemissies 1980-2001 (in Dutch). RIVM rapport 773004013. National Institute for Public Health and the Environment, Bilthoven, the Netherlands.

Methodology for estimating emissions from agriculture in the Netherlands - Update 2019 | 127
Van der Hoek, K.W., M.W. van Schijndel, and P.J. Kuikman (2007). Direct and indirect nitrous oxide emissions from agricultural soils, 1990-2003. Background document on the calculation method. . MNP report 500080003/2007 National Institute for Public Health and the Environment, Bilthoven, the Netherlands
Dijkstra, J., H.D.S.C. Neal, D.E. Beever, and J. France (1992). Simulation of nutrient digestion, absorption and outflow in the rumen: model description, The Journal of Nutrition, 122: 2239-2256.
EEA (2016). EMEP/EEA Air Pollutant Emission Inventory Guidebook, Agriculture European Environment Agency.
Ellis, J.L., J. Dijkstra, E. Kebreab, A. Bannink, N.E. Odongo, B.W. McBride, and J. France (2008). Aspects of rumen microbiology central to mechanistic modelling of methane production in cattle, The Journal of Agricultural Science, 146: 213-233.
Elzing, A., and G.J. Monteny (1997). Modeling and experimental determination of ammonia emissions rates from a scale model dairy-cow house, Transactions of the ASAE, 40: 721-726.
Gerrits, W.J.J., J. Dijkstra, and A. Bannink (2014). Methaanproductie bij witvleeskalveren (in Dutch). Wageningen UR Livestock Research, Lelystad, the Netherlands
Groenestein, C.M., J. Mosquera, and R.W. Melse (2016). Methaanemissie uit mest: schatters voor biochemisch methaan potentieel (BMP) en methaanconversiefactor (MCF) (in Dutch). Wageningen UR Livestock Research, Lelystad, the Netherlands
Groot Koerkamp, P.W.G. (1998). Ammonia emission from aviary housing systems for laying hens: inventory, characteristics and solutions.
Groot Koerkamp, P.W.G., and W. Kroodsma (2000). Ammoniak- en geuremissie tijdens opslag en aanwending van stapelbare pluimveemest (in Dutch). Nota 2000-P04. Instituut voor Milieu- en Agritechniek (IMAG), Wageningen, the Netherlands
De Haan, J.J., and W.C.A. Van Geel (2013). Adviesbasis voor de bemesting van akkerbouw-en vollegrondsgroentengewassen (in Dutch). Praktijkonderzoek Plant & Omgeving BV
Handhavingsamenwerking Noord-Brabant. 2013. 'Rapport: resultaten Brabantbrede toezichtsaanpak luchtwassers 2011-2012 (in Dutch)'. www.handhaveninbrabant.nl.
Handhavingsamenwerking Noord-Brabant. 2015. 'Evaluatie Project luchtwassers 2009 (in Dutch). '. www.handhaveninbrabant.nl.
Hristov, A.N., J. Oh, F. Giallongo, T.W. Frederick, M.T. Harper, H.L. Weeks, A.F. Branco, P.J. Moate, M.H. Deighton, and S.R.O. Williams (2015). An inhibitor persistently decreased enteric methane emission from dairy cows with no negative effect on milk production, Proceedings of the National Academy of Sciences, 112: 10663-10668.
Huijsmans, J.F.M., and P. Goedhart (2018). Verkenning emissiefactor bovengronds breedwerpig verspreiden jaren negentig rekening houdend met seizoensinvloeden. In Van Bruggen et al, 2018, bijlage 4.
Huijsmans, J.F.M., and R.M. De Mol (1999). A model for ammonia volatilization after surface application and subsequent incorporation of manure on arable land, Journal of Agricultural Engineering Research, 74: 73-82.
Huijsmans, J.F.M., and B.R. Verwijs (2008). Beoordeling mesttoediening in de praktijk. Plant Research International, Wageningen, the Netherlands.
Huijsmans, J.F.M., and R.L.M. Schils (2009). "Ammonia and nitrous oxide emissions following field-application of manure: state of the art measurements in the Netherlands." In.: International Fertiliser Society.
Huijsmans, J.F.M., and J. Hol (2012). Ammoniakemissie bij mesttoediening in wintertarwe op kleibouwland (in Dutch). Report 446 Plant Research International

128 | WOt-technical report 148
Huis in 't Veld, J.W.H., F. Dousma, and G.M. Nijeboer (2011). Gasvormige emissies en fijnstof uit konijnenstallen met mestopslag onder de welzijnshokken [Gasesous emissions and fine dust from rabbit housing systems] (in Dutch). Wageningen UR Livestock Research, Lelystad, the Netherlands
IPCC (2006). 2006 IPCC Guidelines for National Greenhouse Gas Inventories. Intergovernmental Panel on Climate Change
Kebreab, E., J. Dijkstra, A. Bannink, and J. France (2009). Recent advances in modeling nutrient utilization in ruminants Journal of Animal Science, 87: E111-E122.
De Koeijer, T.J., H.H. Luesink, and C.H.G. Daatselaar (2012). Synthese monitoring mestmarkt 2006-2011 (in Dutch). Wettelijke Onderzoekstaken Natuur & Milieu, Wageningen UR, Wageningen, the Netherlands.
De Koeijer, T.J., H.H. Luesink, and C.H.G. Daatselaar (2014). Synthese monitoring mestmarkt 2006-2012 (in Dutch), WOt technical report 18. Wettelijke Onderzoekstaken Natuur & Milieu, Wageningen UR, Wageningen, the Netherlands.
Kroeze, C. (1994). Nitrous oxide (N2O) Emission inventory and options for control in the Netherlands, RIVM report 773001004. National Institute for Public Health and the Environment, Bilthoven, the Netherlands.
Kuikman, P.J., J.J.H. Van den Akker, and F. De Vries (2005). Lachgasemissie uit organische landbouwbodems (in Dutch). Report 1035-2. Alterra Wageningen UR, Wageningen, the Netherlands.
Landwirtschaftliches Wochenblatt (2007). Hühnertrockenkot entlastet Düngerkonto (in German). Landwirtschaftliches Wochenblatt Westfalen-Lippe 28, p. 24 – 27.
Van Lingen, H.J., J.E. Edwards, J.D. Vaidya, S. Van Gastelen, E. Saccenti, B. Van den Bogert, A. Bannink, H. Smidt, C.M. Plugge, and J. Dijkstra (2017). Diurnal dynamics of gaseous and dissolved metabolites and microbiota composition in the bovine rumen, Frontiers in microbiology, 8: 425.
Luesink, H.H., P.W. Blokland, J.N. Bosma, and M.W. Hoogeveen (2008). Monitoring mestmarkt 2007: Achtergronddocumentatie (in Dutch). LEI-Wageningen UR, Den Haag, the Netherlands.
Luesink, H.H., P.W. Blokland, and J.N. Bosma (2011). Monitoring mestmarkt 2010: Achtergronddocumentatie (in Dutch). Report 2011-048. LEI-Wageningen UR, Den Haag, the Netherlands.
Melse, R.W., and C.M. Groenestein (2016). Emissiefactoren mestbewerking: inschatting van emissiefactoren voor ammoniak en lachgas uit mestbewerking (in Dutch). Wageningen UR Livestock Research, the Netherlands
Melse, R.W., G.M. Nijeboer, and N.W.M. Ogink (2018). Evaluatie geurverwijdering door luchtwassystemen bij stallen: Deel 2: Steekproef rendement luchtwassers in de praktijk (in Dutch). Report 1082. Wageningen Livestock Research, the Netherlands
Mills, J.A.N., J. Dijkstra, A. Bannink, S.B. Cammell, E. Kebreab, and J. France (2001). A mechanistic model of whole-tract digestion and methanogenesis in the lactating dairy cow: model development, evaluation, and application, Journal of Animal Science, 79: 1584-1597.
Mosquera, J., R.A. van Emous, A. Winkel, F. Dousma, E. Lovink, N.W.M. Ogink, and A.J.A. Aarnink (2009a). Fijnstofemissie uit stallen: (groot) ouderdieren van vleeskuikens [Dust emission from animal houses: broiler breeders] (in Dutch). Report 276. Wageningen UR Livestock Research, Lelystad, the Netherlands
Mosquera, J., A. Winkel, F. Dousma, E. Lovink, N.W.M. Ogink, and A.J.A. Aarnink (2009b). Fijnstofemissie uit stallen: leghennen in scharrelhuisvesting [Dust emission from animal houses: layer hens in floor housing] (in Dutch). Report 279. Wageningen UR Livestock Research, Lelystad, the Netherlands
Mosquera, J., A. Winkel, R.K. Kwikkel, F.A. Gerrits, N.W.M. Ogink, and A.J.A. Aarnink (2009c). Fijnstofemissie uit stallen: vleeskalkoenen [Dust emission from animal houses: turkey] (in Dutch). Report 277. Wageningen UR Livestock Research, Lelystad, the Netherlands
Mosquera, J., J.M.G. Hol, A. Winkel, J.W.H. Huis in 't Veld, F.A. Gerrits, N.W.M. Ogink, and A.J.A. Aarnink (2010a). Fijnstofemissie uit stallen: melkvee [Dust emission from animal houses: dairy cattle] (in Dutch). Report 296. Wageningen UR Livestock Research, Lelystad, the Netherlands
Methodology for estimating emissions from agriculture in the Netherlands - Update 2019 | 129
Mosquera, J., J.M.G. Hol, A. Winkel, E. Lovink, N.W.M. Ogink, and A.J.A. Aarnink (2010b). Fijnstofemissie uit stallen: vleesvarkens [Dust emission from animal houses: growing and finishing pigs] (in Dutch). Report 292. Wageningen UR Livestock Research, Lelystad, the Netherlands
Mosquera, J., J.M.G. Hol, A. Winkel, G.M. Nijeboer, N.W.M. Ogink, and A.J.A. Aarnink (2010c). Fijnstofemissie uit stallen: dragende zeugen [Dust emission from animal houses: pregnant sows] (in Dutch). Wageningen UR Livestock Research, Lelystad, the Netherlands
Mosquera, J., J.M.G. Hol, A. Winkel, J.W.H. Huis in 't Veld, F. Dousma, N.W.M. Ogink, and C.M. Groenestein (2011). Fijnstofemissie uit stallen: nertsen [Dust emission from animal houses: minks](in Dutch), Report 340. Wageningen UR Livestock Reseach, Lelystad, the Netherlands.
Oenema, O., and G.L. Velthof (1993). Ammonia volatilization from compound nitrogen-sulfur fertilizers. in, Optimization of plant nutrition. (Springer).
Oenema, O., G.L. Velthof, N. Verdoes, P.W.G. Groot Koerkamp, G.J. Monteny, A. Bannink, H.G. Van der Meer, and K.W. Van der Hoek (2000). Forfaitaire waarden voor gasvormige stikstofverliezen uit stallen en mestopslagen (in Dutch). Alterra Wageningen UR, Wageningen, the Netherlands.
Ogink, N.W.M., J. Mosquera, and R.W. Melse (2008). "Standardized testing procedures for assessing ammonia and odor emissions from animal housing systems in The Netherlands." In Proc. Conf. Mitigating Air Emissions from Animal Feeding Operations, 291-295.
Olivier, J.G.J., L.J. Brandes, and R.A.B. Te Molder (2009). Uncertainty in the Netherlands' greenhouse gas emissions inventory Estimation of the uncertainty about annual data and trend scenarios, using the IPCC Tier 1 approach. Bilthoven Netherlands Environmental Assessment Agency, the Netherlands.
PVE (2005). Productie en afvoer van paardenmest in Nederland (in Dutch). Memorandum Product Boards for Livestock, Meat and Eggs
RAMIRAN (2011). Glossary of terms on livestock and manure management 2011. Second Edition B. Pain & H. Menzi (Eds.)
Reidy, B., U. Dämmgen, H. Döhler, B. Eurich-Menden, F.K. Van Evert, N.J. Hutchings, H.H. Luesink, H. Menzi, T.H. Misselbrook, and G.-J. Monteny (2008). Comparison of models used for national agricultural ammonia emission inventories in Europe: Liquid manure systems, Atmospheric environment, 42: 3452-3464.
Reidy, B., J. Webb, T. Misselbrook, H. Menzi, H. Luesink, N. Hutchings, B. Eurich-Menden, H. Döhler, and U. Dämmgen (2009). Comparison of models used for national agricultural ammonia emission inventories in Europe: litter-based manure systems, Atmospheric environment, 43: 1632-1640.
De Ruijter, F., and J.F.M. Huijsmans (2012). Ammonia emission from crop residues: quantification of ammonia volatilization based on crop residue properties. Report 470 Plant Research International
De Ruijter, F.J., J.F.M. Huijsmans, M.C. Van Zanten, W.A.H. Asman, and W.A.J. van Pul (2013). Ammonia emission from standing crops and crop residues: contribution to total ammonia emission in the Netherlands. Report 535. Plant Research International. Wageningen UR, Wageningen, the Netherlands.
Ruyssenaars, P., P.W.H.G. Coenen, C.W.M. van der Maas, P.J. Zijlema, E.J.M.M. Arets, K. Baas, A.C.W.M. van den Berghe, E.P. van Huis, G. Geilenkirchen, L.A. Lagerwerf, M. Hoogsteen, J. Spijker, R. te Molder, R. Dröge, J.A. Montfoort, C. Peek, and S. Dellaert (2019). Greenhouse gas emissions in the Netherlands 1990-2017. National Inventory Report 2019. National Institute for Public Health and the Environment, Bilthoven, the Netherlands
Van Schijndel, M.W., and S.M. Van der Sluis (2011). Emissiefactoren voor de berekening van directe lachgasemissies uit landbouwbodems en als gevolg van bewieiding. Achtergrondnotitie bij de National Inventory Report.
Smink, M.C.J., K.W. van der Hoek, A. Bannink, and J. Dijkstra (2005). Calculation of methane production from enteric fermentation in dairy cows. SenterNovem
130 | WOt-technical report 148
Smink, W., K.D. Bos, A.F. Fitié, L.J. Van der Kolk, W.K.J. Rijm, G. Roelofs, and G.A.M. Van den Broek (2003). Methaanreductie melkvee. Een onderzoeksproject naar de inschatting van de methaanproductie vanuit de voeding en naar de reductiemogelijkheden via de voeding van melkkoeien (in Dutch). Report commissioned by Novem, project number 375102/0030 Feed Innovation Services (FIS), Aarle-Rixtel, the Netherlands
Smink, W. (2005). Calculation of methane production from enteric fermentation in cattle, excluding dairy cows. SenterNovem
Stichting Groen Label (1996). Beoordelingsrichtlijn emissie-arme stalsystemen (in Dutch). Issue March 1996
Tamminga, S., A.W. Jongbloed, M.M. Van Eerdt, H.F.M. Aarts, F. Mandersloot, and N.J.P. Hoogervorst (2000). De forfaitaire excretie van stikstof door landbouwhuisdieren (in Dutch). Wageningen UR Livestock Research, Lelystad, the Netherlands
Tamminga, S., H.F.M. Aarts, A. Bannink, O. Oenema, and G.J. Monteny (2004). Actualisering van geschatte N en P excreties door rundvee (in Dutch). Milieu en Landelijk gebied 25 Wageningen UR Livestock Research, Lelystad, the Netherlands
Tamminga, S., A. Bannink, J. Dijkstra, and R.L.G. Zom (2007). Feeding strategies to reduce methane loss in cattle. ASG report 34 Animal Sciences Group, Wageningen UR, Lelystad, the Netherlands.
Veen, W.A.G. (2000). Veevoedermaatregelen ter vermindering van methaanproductie door herkauwers: een deskstudie (in Dutch). (Instituut voor de Veevoeding De Schothorst, Lelystad, the Netherlands.).
Velthof, G.L., J.A. Nelemans, O. Oenema, and P.J. Kuikman (2005). Gaseous nitrogen and carbon losses from pig manure derived from different diets, Journal of Environmental Quality, 34: 698-706.
Velthof, G.L., C. Van Bruggen, C.M. Groenestein, B.J. De Haan, M.W. Hoogeveen, and J.F.M. Huijsmans (2009). Methodiek voor berekening van ammoniakemissie uit de landbouw in Nederland (in Dutch). WOt-report 70. Wettelijke Onderzoekstaken Natuur & Milieu, Wageningen UR, Wageningen, the Netherlands
Velthof, G.L., J. Mosquera, and E.W.J. Hummelink (2010). Effect of manure application technique on nitrous oxide emission from agricultural soils. Alterra report 1992 Alterra Wageningen UR, Wageningen, the Netherlands.
Velthof, G.L., and J. Mosquera (2011). Calculation of nitrous oxide emission from agriculture in the Netherlands: update of emission factors and leaching fraction. Alterra report 2151. Alterra Wageningen UR, Wageningen, the Netherlands.
Velthof, G.L., C. Van Bruggen, C.M. Groenestein, B.J. De Haan, M.W. Hoogeveen, and J.F.M. Huijsmans (2012). A model for inventory of ammonia emissions from agriculture in the Netherlands, Atmospheric environment, 46: 248-255.
Vonk, J., A. Bannink, C. Van Bruggen, C.M. Groenestein, J.F.M. Huijsmans, J.W.H. van der Kolk, H.H. Luesink, S.V. Oude Voshaar, S.M. van der Sluis, and G.L. Velthof (2016). Methodology for estimating emissions from agriculture in the Netherlands: calculations of CH4, NH3, N2O, NOx, PM10, PM2.5 and CO2 with the National Emission Model for Agriculture (NEMA). WOt-technical report 53. Wettelijke Onderzoekstaken Natuur & Milieu, Wageningen UR, Wageningen, the Netherlands.
Vonk, J., S.M. van der Sluis, A. Bannink, C. van Bruggen, C.M. Groenestein, J.F.M. Huijsmans, J.W.H. van der Kolk, L.A. Lagerwerf, H.H. Luesink, S.V. Oude Voshaar, and G.L. Velthof (2018). Methodology for estimating emissions from agriculture in the Netherlands; update 2018: calculations of CH4, NH3, N2O, NOx, PM10, PM2.5 and CO2 with the National Emission Model for Agriculture (NEMA). WOt-technical report 115. Wettelijke Onderzoekstaken Natuur & Milieu, WUR, Wageningen, the Netherlands.
Webb, J., S.G. Sommer, T. Kupper, K. Groenestein, N.J. Hutchings, B. Eurich-Menden, L. Rodhe, T.H. Misselbrook, and B. Amon (2012). Emissions of ammonia, nitrous oxide and methane during the management of solid manures. in, Agroecology and strategies for climate change. (Springer).
Whitehead, D.C., and N. Raistrick (1993). The volatilization of ammonia from cattle urine applied to soils as influenced by soil properties, Plant and Soil, 148: 43-51.

Methodology for estimating emissions from agriculture in the Netherlands - Update 2019 | 131
Winkel, A., J. Mosquera, J.M.G. Hol, G.M. Nijeboer, N.W.M. Ogink, and A.J.A. Aarnink (2009a). Fijnstofemissie uit stallen: leghennen in volièrehuisvesting [Dust emission from animal houses: layer hens in aviary systems] (in Dutch). Report 278. Wageningen UR Livestock Research, Lelystad, the Netherlands
Winkel, A., J. Mosquera, J.M.G. Hol, T.G. van Hattum, E. Lovink, N.W.M. Ogink, and A.J.A. Aarnink (2009b). Fijnstofemissie uit stallen: biggen [Dust emission from animal houses: piglets] (in Dutch). Report 293. Wageningen UR Livestock Research, Lelystad, the Netherlands
Winkel, A., J. Mosquera, R.K. Kwikkel, F.A. Gerrits, N.W.M. Ogink, and A.J.A. Aarnink (2009c). Fijnstofemissie uit stallen: vleeskuikens [Dust emission from animal houses: broilers] (in Dutch). Report 275. Wageningen UR Livestock Research, Lelystad, the Netherlands
Winkel, A., J. Mosquera, H.H. Ellen, J.M.G. Hol, G.M. Nijeboer, N.W.M. Ogink, and A.J.A. Aarnink (2011). Fijnstofemissie uit stallen: leghennen in stallen met een droogtunnel [Dust emission from animal houses: layer hens in houses with a tunnel drying system] (in Dutch). Wageningen UR Livestock Research, Lelystad, the Netherlands
WUM (1994). Uniformering berekening mest- en mineralencijfers; standaardcijfers pluimvee, 1990-1992 (in Dutch). Working group on Uniformity of calculations of Manure and mineral data (WUM)
Van Zanten, M.C., F.J. Sauter, R.J. Wichink Kruit, J.A. van Jaarsveld, and W.A.J. van Pul (2010). Description of the DEPAC module: Dry deposition modelling with DEPAC_GCN2010. RIVM rapport 680180001 National Institute for Public Health and the Environment, Bilthoven, the Netherlands
Zeeman, G. (1994). Methane production/emission in storages for animal manure, Fertilizer research, 37: 207-211.
Van Zijderveld, S.M., W.J.J. Gerrits, J. Dijkstra, J.R. Newbold, R.B.A. Hulshof, and H.B. Perdok (2011). Persistency of methane mitigation by dietary nitrate supplementation in dairy cows, Journal of Dairy Science, 94: 4028-4038.
Zom, R.L.G., and C.M. Groenestein (2015). Excretion of volatile solids by livestock to calculate methane production from manure, RAMIRAN 2015, 16th International Conference Rural-Urban Symbiosis, 8th-10th September 2015, Hamburg, Germany.
Unpublished references
Bussink, D.W. (2009). Personal communication, Nutriënten Management Instituut (NMI), Wageningen.
Reijneveld, A. (2009). Personal communication. Eurofins Agro, Wageningen


Methodology for estimating emissions from agriculture in the Netherlands - Update 2019 | 133
Justification
This report is an account of the methods used for the calculation of emissions to air from agriculture in the Netherlands over the 1990-2016 period, as reported in the National Inventory Report 2018 (NIR; for greenhouse gases) and Informative Inventory Report 2018 (IIR; for air pollutants). With these annual reports, the Netherlands fulfils the reporting requirements of the Kyoto and Gothenburg protocols. Yearly, the results were published in Van Bruggen et al. (in Dutch). Emissions are assessed with the National Emission Model for Agriculture (NEMA) which is approved by the independent Dutch Scientific Committee of the Manure Act (CDM). Statistics Netherlands (CBS) is the administrator of the NEMA model. The work is guided by the task force Agriculture and Land Use of the Pollutant Release and Transfer Register (PRTR, or ‘Emissieregistratie’ (ER) in Dutch). For greenhouse gas reporting, the Netherlands Enterprise Agency (RVO.nl) reviews proceedings acting as the National Inventory Entity (NIE). The methodologies used follow or comply with the 2006 IPCC Guidelines (greenhouse gases) and the 2016 EMEP Guidebook (air pollutants). The draft report was reviewed and approved by Peter Zijlema and Harry Vreuls (RVO.nl) and Margreet van Zanten (PRTR).

134 | WOt-technical report 148
Methodology for estimating emissions from agriculture in the Netherlands - Update 2019 | 135
Annex 1 Calculation of TAN excretion for dairy cattle and young stock
Translation with adaptation of the annex from L. Šebek & A. Bannink (Division Animal Husbandry, Animal Sciences Group (ASG), WUR) in Velthof et al. (2009).
Introduction
Until 2009, the NH3 emission is estimated by means of an emission percentage applied on total N excretion. It is however mainly the excretion of urine N that is responsible for the NH3 emission. Therefore, the current aim is to estimate NH3 emission based on excreted urine N. Excretion of urine N is comparable to that of total ammoniacal N (TAN). A description of the calculation method of TAN is given here.
Calculation method
The total N excretion is calculated in accordance with the method used by the WUM, also used by Tamminga et al. (2000; 2004), to derive the fixed excretion figures for various livestock categories. In this method the uptake of N with the separate ration components is calculated, and total N excretion as the difference between N uptake and N retained in animal products (milk, growth, offspring). For the results reported in the present document, the same method was used but it was extended with an estimation of the digestion coefficient (DC) for crude protein (CP). Introduction of DC-CP is required to be able to calculate TAN. The calculation is performed for each feedstuff in the ration separately. With the DC-CP per feedstuff the percentage of crude protein uptake can be calculated that is absorbed by the intestine (= digested). The remainder (100% - DC-CP) of crude protein uptake leaves the body with the faeces. Protein absorbed by the intestine is either used for production (milk, growth and offspring) or excreted as urine N by the kidneys. By setting the TAN equal to the excretion of urine N, TAN is calculated by the following steps: • Summation of the amount crude protein uptake that is absorbed in the intestine for all feedstuffs in
the ration; • Conversion of absorbed protein to absorbed N; • Calculation of N retained with animal production; • Calculation of excreted urine N as the difference between absorbed N and N retained with animal
production.
Calculation of the DC-CP The CVB animal feed table (Centraal Veevoederbureau, 2005b) lists DC-CP values (as a % of crude protein content) for all common products. For roughages this is dependent on the quality of the roughage. Regression equations have been published to calculate the DC-CP based on chemical composition (crude protein content, crude ash content and crude crude fibre content; Centraal Veevoederbureau (2005a)). In Table A1.1 the DC-CP is given for the various ration components fed to young stock. Faecal N digestibility of dairy is now calculated using the Tier 3 method because above method gives an overestimation. For young cattle above method is corrected using the difference calculated for dairy cattle.

136 | WOt-technical report 148
Used data
The amounts of feed that has been provided yearly to the different livestock categories are according to the report of the Working group on Uniformity of Manure and mineral data (WUM). Also, data are available for milk production, and the composition of roughages (based on yearly statistics on analyses of silages by the laboratory Eurofins Agro (formerly Blgg and AgroXpertus), concentrates (based on reports of feed manufacturers) and by-products (based on amounts of products marketed). These figures are recently used and described by Smink et al. (2005) for the calculation of the methane emission of dairy cattle and the same data are used in the present study. For moisture-rich by-products it is assumed that these consisted of 25, 40 and 35% of brewers’ grains, potato products and sugar beet pulp. This division compares well to the WUM report of the availability by-products for cattle (respectively 26, 35 and 26%; 30:40:30 ratio). For young stock the WUM rations of 1990 have been used in accordance with the starting points in the available WUM excretion data. The composition of roughages and concentrates was assumed equal to that of dairy cattle in the year 2001. Table A1.1 The CP content, the ammonia content and the faecal CP digestibility for the various ration components in the ration of young stock
CP content1) Ammonia content DC-CP2)
g CP/kg DM % CP %
Fresh grass / grass herbage 229 0 85
Grass silage (+ hay) 191 10 77
Maize silage 81 10 50
Standard concentrate 180 0 70
Protein-rich concentrate 330 0 82
By-products3)
Brewers’ grains 250 0 80
Potato pulp 85 0 36
Pressed sugar beet pulp 115 0 65
Whole milk 35 0 86 1) Including ammonia N. 2) Concerns an estimation of the real instead of apparent digestibility of crude protein. 3) Only most abundant product in the category mentioned here (brewers’ grains for category protein-rich by-products, potato pulp for category of
rest material potato processing industry, pressed sugar beet pulp for category of pulps and vegetables).
Other starting points/assumptions
Correction CP content for ammonia fraction. It was assumed that ammonia N (expressed as CP) accounted for 10% of the total CP content in both grass silage and maize silage. Correction feed uptake for so-called “feed losses”. For the time being no corrections have been made for feed losses because these also seem not to have been made in the calculation of the N excretions in WUM. If the corrections in the feeding of dairy cattle according to the current WUM methodology (0, 5, 3 and 2% feed losses for respectively fresh grass, grass silage, maize silage, moist by-products and concentrates) were to be made this would lead to much lower N excretions than the reported 131.0 kg N/dairy cow/year according to WUM. Composition urine N. For the time being 100% of the urine N is considered as TAN and no differentiation is made between N holding components that do not (quickly) lead to ammonia formation (Reijs, 2007).

Methodology for estimating emissions from agriculture in the Netherlands - Update 2019 | 137
References
Centraal Veevoederbureau (2005a). Ruwvoedertabel (in Dutch). CVB, Lelystad, the Netherlands.
Centraal Veevoederbureau (2005b). Veevoedertabel (in Dutch). CVB, Lelystad, the Netherlands.
Reijs, J.W. (2007). Improving slurry by diet adjustments: a novelty to reduce N losses from grassland based dairy farms.
Smink, M.C.J., K.W. Van der Hoek, A. Bannink, and J. Dijkstra (2005). Calculation of methane production from enteric fermentation in dairy cows. SenterNovem
Tamminga, S., H.F.M. Aarts, A. Bannink, O. Oenema, and G.J. Monteny (2004). Actualisering van geschatte N en P excreties door rundvee (in Dutch). Milieu en Landelijk gebied 25 Wageningen UR Livestock Research, Lelystad, the Netherlands
Tamminga, S., A.W. Jongbloed, M.M. Van Eerdt, H.F.M. Aarts, F. Mandersloot, and N.J.P. Hoogervorst (2000). De forfaitaire excretie van stikstof door landbouwhuisdieren (in Dutch). Wageningen UR Livestock Research, Lelystad, the Netherlands

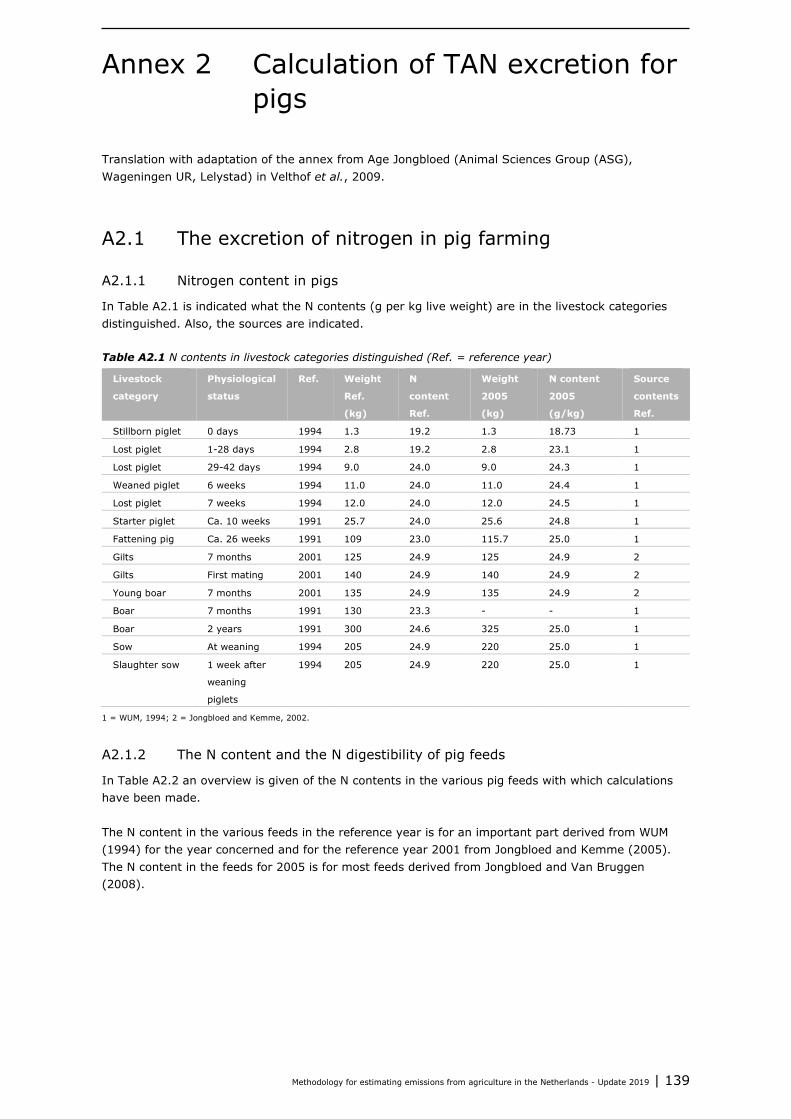
Methodology for estimating emissions from agriculture in the Netherlands - Update 2019 | 139
Annex 2 Calculation of TAN excretion for pigs
Translation with adaptation of the annex from Age Jongbloed (Animal Sciences Group (ASG), Wageningen UR, Lelystad) in Velthof et al., 2009.
A2.1 The excretion of nitrogen in pig farming
A2.1.1 Nitrogen content in pigs
In Table A2.1 is indicated what the N contents (g per kg live weight) are in the livestock categories distinguished. Also, the sources are indicated. Table A2.1 N contents in livestock categories distinguished (Ref. = reference year)
Livestock
category
Physiological
status
Ref. Weight
Ref.
(kg)
N
content
Ref.
Weight
2005
(kg)
N content
2005
(g/kg)
Source
contents
Ref.
Stillborn piglet 0 days 1994 1.3 19.2 1.3 18.73 1
Lost piglet 1-28 days 1994 2.8 19.2 2.8 23.1 1
Lost piglet 29-42 days 1994 9.0 24.0 9.0 24.3 1
Weaned piglet 6 weeks 1994 11.0 24.0 11.0 24.4 1
Lost piglet 7 weeks 1994 12.0 24.0 12.0 24.5 1
Starter piglet Ca. 10 weeks 1991 25.7 24.0 25.6 24.8 1
Fattening pig Ca. 26 weeks 1991 109 23.0 115.7 25.0 1
Gilts 7 months 2001 125 24.9 125 24.9 2
Gilts First mating 2001 140 24.9 140 24.9 2
Young boar 7 months 2001 135 24.9 135 24.9 2
Boar 7 months 1991 130 23.3 - - 1
Boar 2 years 1991 300 24.6 325 25.0 1
Sow At weaning 1994 205 24.9 220 25.0 1
Slaughter sow 1 week after
weaning
piglets
1994 205 24.9 220 25.0 1
1 = WUM, 1994; 2 = Jongbloed and Kemme, 2002.
A2.1.2 The N content and the N digestibility of pig feeds
In Table A2.2 an overview is given of the N contents in the various pig feeds with which calculations have been made. The N content in the various feeds in the reference year is for an important part derived from WUM (1994) for the year concerned and for the reference year 2001 from Jongbloed and Kemme (2005). The N content in the feeds for 2005 is for most feeds derived from Jongbloed and Van Bruggen (2008).

140 | WOt-technical report 148
Table A2.2 Overview of the N contents and the N digestibility (DC-N) in the various pig feeds for the reference year and 2005
Reference year 2005
Year N (g/kg) DC-N (%) N (g/kg) DC-N (%)
Piglet rearing feed/weaning feed 1994 29.0 83.0 28.8 83.0
Piglet feed (12-26 kg) 1994 29.0 83.0 28.8 83.0
Starting feed (26-40 kg) 1991 28.2 81.9 25.2 81.0
Starting feed gilts/young boars (26-40 kg) 2001 27.1 81.0 27.1 81.0
Fattening pig feed (40-110 kg) 1991 26.0 80.1 25.2 78.6
Gilts/young boars feed (40-125 kg) 2001 24.5 80.5 25.2 78.0
Standard sow feed 1991 25.7 79.0 - -
Standard sow feed 1994 25.4 79.0 - -
Lactating sow feed 1991 24.6 80.0 25.2 78.0
Lactating sow feed 1994 - - 25.2 78.0
Lactating sow feed 2001 24.5 80.0 25.2 78.0
Sow in pig feed 1994 - - 21.9 66.2
A2.1.3 Estimation of the N digestibility in the feeds
The digestibility of N in the feeds is for the reference year based on some publications in which the resource composition of feeds was given. On enquiry with several composite feed companies no information on this was available as it is stored for only five or six years. The digestibility of N is estimated based on the given digestibilities for those according to the Animal feed table (CVB, 2007). Unfortunately, only sporadic information was available of the resource composition of the feeds that were produced in 2005. In the same way as above the N digestibility was estimated. There where data were missing based on consultation with some specialists within and outside ASG a best possible estimation of the N digestibility was made.
A2.2 Breeding sows with piglets up to ca. 6 weeks of age (category 400)
A2.2.1 Starting points
The start weight of the sows for 1994 and for 2005 is set to 140 kg and the end weight is for 1994 and 2005 set to 205 respectively 220 kg. Based on Agrovision (1994, 2005) for 1994 calculations can be made with a farm litter index of 2.25 and for 2005 of 2.31. The replacement of sows amounted 47% in 1994 and in 2005 this was 45% (Agrovision, 1994; 2005). According to Agrovision (1994) a breeding sow of which the piglets are weaned at 4 weeks, takes up 1,079 kg of feed per year in 1994; in 2005 that is 1,145 kg, of which circa 65% as sow in pig feed and 35% as lactating sow feed. The number of live born piglets per litter is according to Agrovision (1994) on average 10.9 and in 2005 the number of live born piglets per litter is 12.0. The number stillborn piglets per litter was in 1994 and 2005 0.7 respectively 1.0 (Agrovision, 1994; 2005). The weight of piglets on 42 days is 11.0 kg in 1994 and 10.8 kg in 2005. The feed uptake of piglets up to day 42 after birth is set to 4.5 kg in 1994 (Backus et al., 1997) and 4.48 kg in 2005. This amount is in vast majority weaning feed. The N content of the weaning feed in 1994 was 29.0 g/kg and in 2005 28.8 g/kg. The N digestibility in the weaning pellet is derived from the feed composition according to Kloosterman and Huiskes (1992) and was 83.3%; for 2005 83.0% is taken. The sow feed in 1994 contained 25.4 g N/kg (WUM, 1994), while in 2005 the feed for sows with piglets and lactating sow feed contained 21.9 respectively 25.2 g N/kg (Jongbloed and Van Bruggen, 2008). The N digestibility of the sow feed in 1994 is estimated based on the feed composition according to Everts et al. (1991) and was 79.0%. The N digestibility of

Methodology for estimating emissions from agriculture in the Netherlands - Update 2019 | 141
the feed for sows with piglets is derived from the feed composition of a composite feed manufacturer during the first half of 2006 and was 66.2%. According to another composite feed manufacturer in 2005 the N digestibility of lactating sow feed was 78.0%.
A2.2.2 Results breeding sows with piglets up to ca. 6 weeks of age
In Table A2.3 is based on above mentioned starting points for breeding sows with piglets up to ca. 6 weeks of age an overview given of the nitrogen balance if a sow place would be occupied the whole year (no days lost). Table A2.3 Nitrogen balance (kg) in breeding sows with piglets up to ca. 6 weeks of age on yearly basis (category 400)
Category 400 1994 2005
g N/kg DC-N N uptake (kg) g N/kg DC-N N uptake (kg)
Weaning feed 29.0 83.3 2.71 28.8 83.0 3.15
Feed for sows with piglets 25.4 78.9 17.81 21.9 66.2 16.15
Lactating sow feed 25.4 78.9 9.59 25.2 78.0 10.27
Total uptake 30.12 29.57
Fixation 7.13 7.71
Excretion 22.98 21.86
In faeces 6.2 8.3
In urine 16.8 13.6
In urine (%) 72.9 62.2
Table A2.3 shows that the N excretion per sow per year compared to 1994, in 2005 has decreased by over 1.0 kg and that there has been a large shift towards much more N in the faeces and much less in the urine. The percentage of the N excretion in the urine decreased from 72.9 to 62.2. This shift is mostly due to the introduction of a feed for sows with piglets that has to contain much raw fibre in the framework of the Pig decree (1994).
A2.3 Breeding sows with piglets up to ca. 25 kg (category 401)
A2.3.1 Starting points
For data of the breeding sows is referred to the previous section (the description for category 400). The weight of piglets by the start of fattening is according to Agrovision (1994; 2005) 25.7 kg in 1994 and 25.6 kg in 2005. The age at the start of fattening is on average 80 days. The amount of weaning feed taken up per piglet is 4.5 kg. Based on a feed conversion of 1.65 a piglet takes up 30.0 kg of feed before start of fattening in 1994 and in 2005 feed conversion is 1.59 so that per piglet 28.7 kg of feed is taken up (Agrovision, 1994; 2004). The N contents of the piglet feed in 1994 and 2005 were 29.0 respectively 28.8 g/kg. The N digestibility of the piglet feed in 1994 is derived from the feed compositions according to Kloosterman and Huiskes (1992) and was 83.3%; for 2005 83.0% is taken.
A2.4 Results breeding sows with piglets up to ca. 25 kg
In Table A2.4 is based on abovementioned assumptions for breeding sows with piglets up to ca. 25 kg an overview given of the nitrogen balance if a sow place would be occupied the whole year (no days lost).

142 | WOt-technical report 148
Table A2.4 N uptake and N excretion (kg) by breeding sows with piglets up to ca. 25 kg on yearly basis (category 401)
Category 401 1994 2005
g N/kg DC-N N uptake (kg) g N/kg DC-N N uptake (kg)
Weaning feed 29.0 83.3 2.71 28.8 83.0 3.16
Piglet feed 29.0 83.3 15.38 28.8 83.0 16.71
Feed for sows with piglets 25.4 78.9 17.81 21.9 66.2 16.15
Lactating sow feed 25.4 78.9 9.59 25.2 78.0 10.27
Total uptake 45.49 46.30
Retention 14.11 16.53
Excretion 31.38 29.77
In faeces 8.8 11.1
In urine 22.6 18.7
In urine (%) 71.9 62.7
A2.4.1 Discussion breeding sows
Table A2.3 shows that the N excretion per sow per year compared to 1994, decreased with over 1.5 kg in 2005 and that there has been a large shift towards much more N in the faeces and much less in the urine. The percentage of the N excretion in the urine has declined from 71.9 to 62.7. This shift is mainly due to the introduction of a sow in pig feed that has to contain much raw fibre in the framework of the Pig decree (1994). It has been examined what the effect is on the excretion in faeces and urine if the N digestibility is 1% unit higher or lower. Table A2.5 gives the results of this. Table A2.5 N uptake and N excretion (kg) by breeding sows with piglets up to ca. 25 kg on yearly basis (category 401) with a higher or lower N digestibility
Category 401 1994 2005
DC-N 1
unit
lower
DC-N
starting
point
DC-N 1
unit higher
DC-N 1
unit lower
DC-N
starting
point
DC-N 1
unit higher
Total uptake 45.49 49.49 45.49 46.30 46.30 46.30
Excretion 31.38 31.38 31.38 29.77 29.77 29.77
In faeces 9.26 8.80 8.35 11.56 11.10 10.63
In urine 22.12 22.58 23.03 18.21 18.67 19.14
In urine (%) 70.5 71.9 73.4 61.2 62.7 64.3
From Table A2.5 follows that as a result of a difference in N digestibility of 2% units a shift of on average 3.0% units will occur.
A2.5 Gilts not yet in pig of ca. 25 kg to ca. 7 months (category 402)
A2.5.1 Starting points
The start and end weight of the gilts not yet in pig for both 2002 is set to 26 respectively 125 kg. This end weight is derived from Jongbloed and Kemme (2005). The average length of the period is calculated to be 133 days, such that the average growth is 744 g/day. In 2002 the ratio between the starting feed and rearing feed for gilts not yet in pig is set to 15:85 (Jongbloed and Kemme, 2005). The total amount of feed during the lay on period for this category of gilts not yet in pig is 287 kg for 2002. For 2005 the same starting points as for 2002 are taken. The N contents of the starting feed and rearing feed in 2002 were 27.1 respectively 24.5 g/kg. For 2005 these contents are 27.1 respectively 25.2 g/kg. The N digestibility of the starting feed is set to 81.0 and of the rearing feed to 78.0 which is equal to the N digestibility of the lactating sow feed.
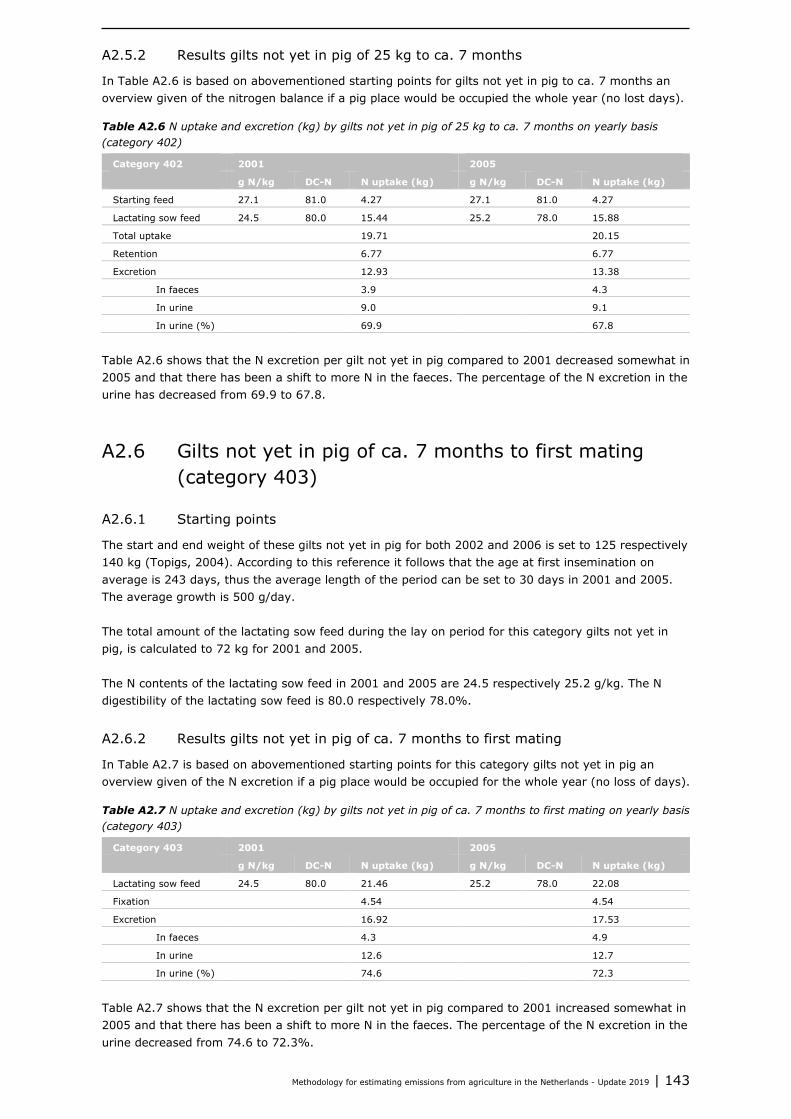
Methodology for estimating emissions from agriculture in the Netherlands - Update 2019 | 143
A2.5.2 Results gilts not yet in pig of 25 kg to ca. 7 months
In Table A2.6 is based on abovementioned starting points for gilts not yet in pig to ca. 7 months an overview given of the nitrogen balance if a pig place would be occupied the whole year (no lost days). Table A2.6 N uptake and excretion (kg) by gilts not yet in pig of 25 kg to ca. 7 months on yearly basis (category 402)
Category 402 2001 2005
g N/kg DC-N N uptake (kg) g N/kg DC-N N uptake (kg)
Starting feed 27.1 81.0 4.27 27.1 81.0 4.27
Lactating sow feed 24.5 80.0 15.44 25.2 78.0 15.88
Total uptake 19.71 20.15
Retention 6.77 6.77
Excretion 12.93 13.38
In faeces 3.9 4.3
In urine 9.0 9.1
In urine (%) 69.9 67.8
Table A2.6 shows that the N excretion per gilt not yet in pig compared to 2001 decreased somewhat in 2005 and that there has been a shift to more N in the faeces. The percentage of the N excretion in the urine has decreased from 69.9 to 67.8.
A2.6 Gilts not yet in pig of ca. 7 months to first mating (category 403)
A2.6.1 Starting points
The start and end weight of these gilts not yet in pig for both 2002 and 2006 is set to 125 respectively 140 kg (Topigs, 2004). According to this reference it follows that the age at first insemination on average is 243 days, thus the average length of the period can be set to 30 days in 2001 and 2005. The average growth is 500 g/day. The total amount of the lactating sow feed during the lay on period for this category gilts not yet in pig, is calculated to 72 kg for 2001 and 2005. The N contents of the lactating sow feed in 2001 and 2005 are 24.5 respectively 25.2 g/kg. The N digestibility of the lactating sow feed is 80.0 respectively 78.0%.
A2.6.2 Results gilts not yet in pig of ca. 7 months to first mating
In Table A2.7 is based on abovementioned starting points for this category gilts not yet in pig an overview given of the N excretion if a pig place would be occupied for the whole year (no loss of days). Table A2.7 N uptake and excretion (kg) by gilts not yet in pig of ca. 7 months to first mating on yearly basis (category 403)
Category 403 2001 2005
g N/kg DC-N N uptake (kg) g N/kg DC-N N uptake (kg)
Lactating sow feed 24.5 80.0 21.46 25.2 78.0 22.08
Fixation 4.54 4.54
Excretion 16.92 17.53
In faeces 4.3 4.9
In urine 12.6 12.7
In urine (%) 74.6 72.3
Table A2.7 shows that the N excretion per gilt not yet in pig compared to 2001 increased somewhat in 2005 and that there has been a shift to more N in the faeces. The percentage of the N excretion in the urine decreased from 74.6 to 72.3%.
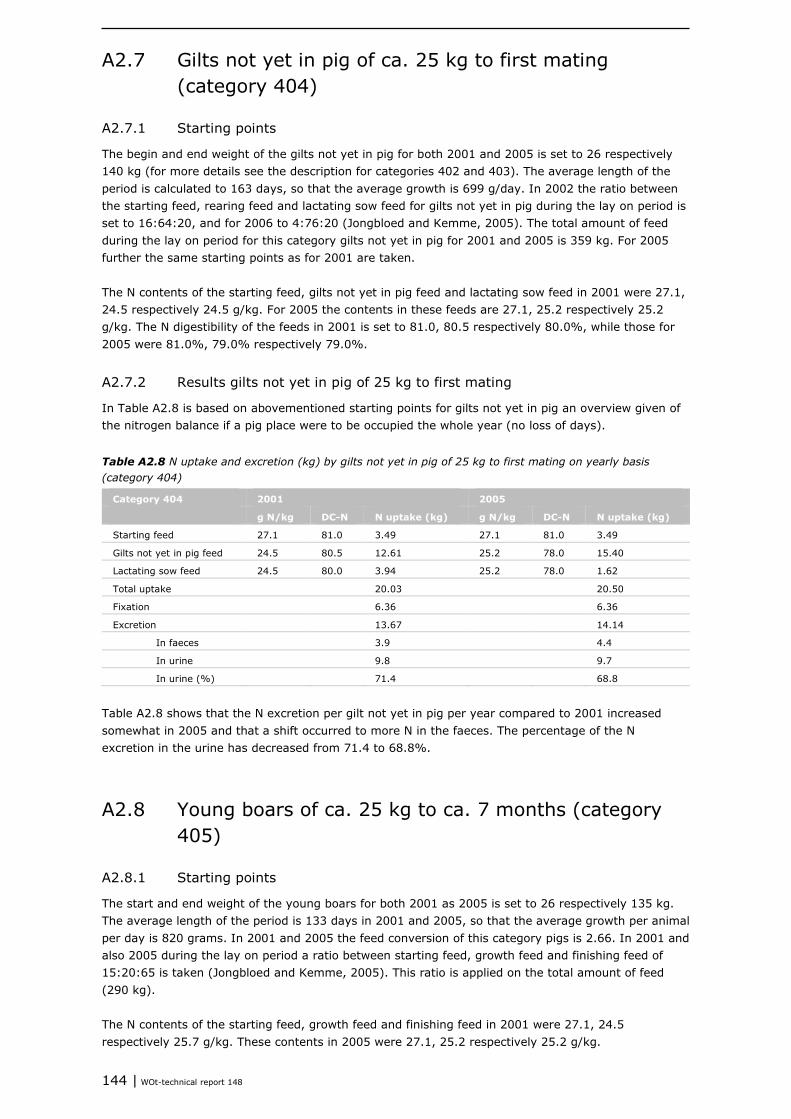
144 | WOt-technical report 148
A2.7 Gilts not yet in pig of ca. 25 kg to first mating (category 404)
A2.7.1 Starting points
The begin and end weight of the gilts not yet in pig for both 2001 and 2005 is set to 26 respectively 140 kg (for more details see the description for categories 402 and 403). The average length of the period is calculated to 163 days, so that the average growth is 699 g/day. In 2002 the ratio between the starting feed, rearing feed and lactating sow feed for gilts not yet in pig during the lay on period is set to 16:64:20, and for 2006 to 4:76:20 (Jongbloed and Kemme, 2005). The total amount of feed during the lay on period for this category gilts not yet in pig for 2001 and 2005 is 359 kg. For 2005 further the same starting points as for 2001 are taken. The N contents of the starting feed, gilts not yet in pig feed and lactating sow feed in 2001 were 27.1, 24.5 respectively 24.5 g/kg. For 2005 the contents in these feeds are 27.1, 25.2 respectively 25.2 g/kg. The N digestibility of the feeds in 2001 is set to 81.0, 80.5 respectively 80.0%, while those for 2005 were 81.0%, 79.0% respectively 79.0%.
A2.7.2 Results gilts not yet in pig of 25 kg to first mating
In Table A2.8 is based on abovementioned starting points for gilts not yet in pig an overview given of the nitrogen balance if a pig place were to be occupied the whole year (no loss of days).
Table A2.8 N uptake and excretion (kg) by gilts not yet in pig of 25 kg to first mating on yearly basis (category 404)
Category 404 2001 2005
g N/kg DC-N N uptake (kg) g N/kg DC-N N uptake (kg)
Starting feed 27.1 81.0 3.49 27.1 81.0 3.49
Gilts not yet in pig feed 24.5 80.5 12.61 25.2 78.0 15.40
Lactating sow feed 24.5 80.0 3.94 25.2 78.0 1.62
Total uptake 20.03 20.50
Fixation 6.36 6.36
Excretion 13.67 14.14
In faeces 3.9 4.4
In urine 9.8 9.7
In urine (%) 71.4 68.8
Table A2.8 shows that the N excretion per gilt not yet in pig per year compared to 2001 increased somewhat in 2005 and that a shift occurred to more N in the faeces. The percentage of the N excretion in the urine has decreased from 71.4 to 68.8%.
A2.8 Young boars of ca. 25 kg to ca. 7 months (category 405)
A2.8.1 Starting points
The start and end weight of the young boars for both 2001 as 2005 is set to 26 respectively 135 kg. The average length of the period is 133 days in 2001 and 2005, so that the average growth per animal per day is 820 grams. In 2001 and 2005 the feed conversion of this category pigs is 2.66. In 2001 and also 2005 during the lay on period a ratio between starting feed, growth feed and finishing feed of 15:20:65 is taken (Jongbloed and Kemme, 2005). This ratio is applied on the total amount of feed (290 kg). The N contents of the starting feed, growth feed and finishing feed in 2001 were 27.1, 24.5 respectively 25.7 g/kg. These contents in 2005 were 27.1, 25.2 respectively 25.2 g/kg.

Methodology for estimating emissions from agriculture in the Netherlands - Update 2019 | 145
The N digestibility of the feeds was in 2001 81.0%, 80.5% respectively 80.5% and in 2005 81.0%, 78.0% respectively 81.0%.
A2.8.2 Results young boars
In Table A2.9 is based on abovementioned starting points for young boars an overview given of the nitrogen balance if a pig place were to be occupied the whole year (no loss of days). Table A2.9 N uptake and excretion (kg) by young boars to ca. 7 months on yearly basis (category 405)
Category 405 1991 2005
g N/kg DC-N N uptake (kg) g N/kg DC-N N uptake (kg)
Starting feed 27.1 81.0 3.24 27.1 81.0 3.24
Lactating sow feed 24.5 80.5 16.57 25.2 78.0 17.05
Total uptake 19.81 20.28
Fixation 7.46 7.45
Excretion 12.35 12.83
In faeces 3.8 4.4
In urine 8.5 8.5
In urine (%) 68.9 66.0
Table A2.9 shows that the N excretion per young boar per year compared to 2001 increased somewhat in 2005 and that a shift occurred toward more N in the faeces. The percentage of the N excretion in the urine decreased from 68.9 to 66.0%.
A2.9 Breeding boars of ca. 7 months and older (category 406)
A2.9.1 Starting points
The start and end weight of the breeding boars for 1991 is set to 130 kg respectively 300 kg, for 2005 these weights are 135 kg respectively 325 kg. The average length of the period that these breeding boars are present is 548 days (WUM, 1994) which is also taken for 2005. The average feed uptake in 1991 is set to 2.9 kg/day (WUM, 1994) and in 2005 3.0 kg/day (Jongbloed and Kemme, 2005). The N content of the feed that is given to breeding boars (sow feed) was in 1991 25.7 g/kg and in 2005 the lactating sow feed contained 25.2 g/kg. The N digestibility in the sow feed was in 1991 and 2005 78.9% respectively 78.0%.
A2.9.2 Results breeding boars older than 7 months
In Table A2.10 is based on abovementioned assumptions for breeding boars an overview given of the nitrogen balance if a pig place would be occupied the whole year (no loss of days). Table A2.10 N uptake and excretion (kg) by breeding boars of 7 months and older on yearly basis (category 406)
Category 406 1991 2005
g N/kg DC-N N uptake (kg) g N/kg DC-N N uptake (kg)
Lactating sow feed 25.7 78.9 27.20 25.2 78.0 27.59
Fixation 2.90 3.18
Excretion 24.30 24.42
In faeces 5.7 6.1
In urine 18.6 18.3
In urine (%) 76.4 75.1
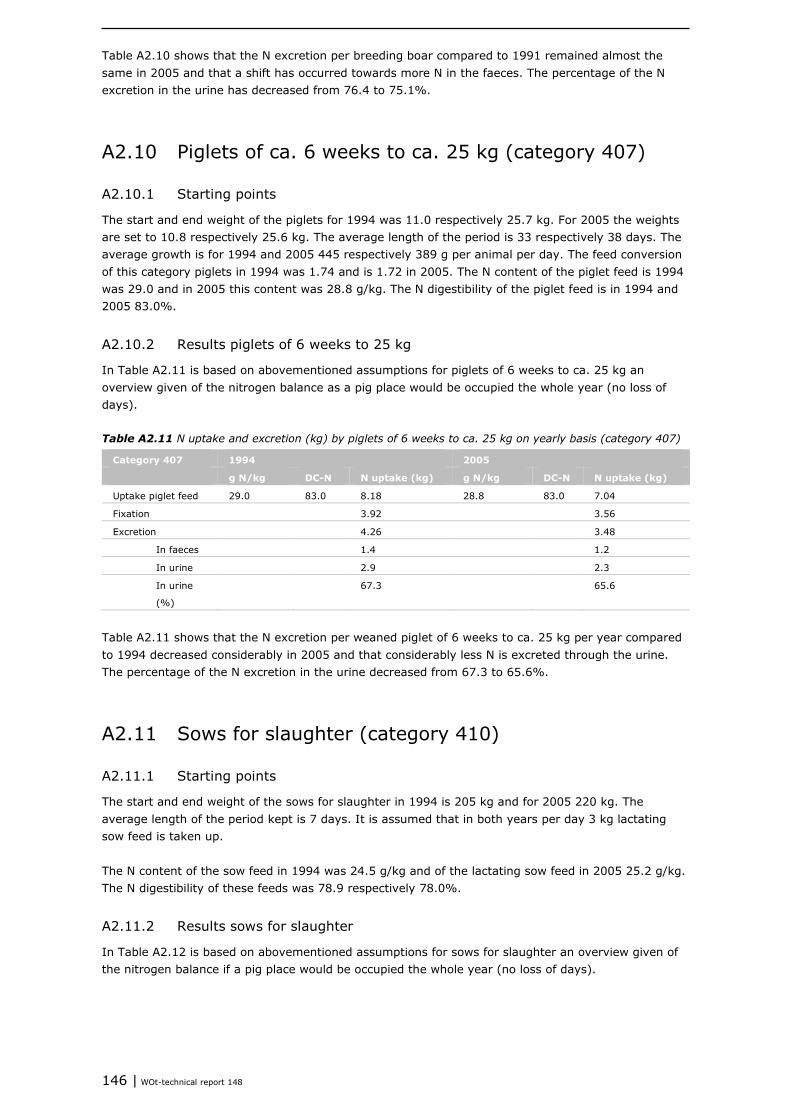
146 | WOt-technical report 148
Table A2.10 shows that the N excretion per breeding boar compared to 1991 remained almost the same in 2005 and that a shift has occurred towards more N in the faeces. The percentage of the N excretion in the urine has decreased from 76.4 to 75.1%.
A2.10 Piglets of ca. 6 weeks to ca. 25 kg (category 407)
A2.10.1 Starting points
The start and end weight of the piglets for 1994 was 11.0 respectively 25.7 kg. For 2005 the weights are set to 10.8 respectively 25.6 kg. The average length of the period is 33 respectively 38 days. The average growth is for 1994 and 2005 445 respectively 389 g per animal per day. The feed conversion of this category piglets in 1994 was 1.74 and is 1.72 in 2005. The N content of the piglet feed is 1994 was 29.0 and in 2005 this content was 28.8 g/kg. The N digestibility of the piglet feed is in 1994 and 2005 83.0%.
A2.10.2 Results piglets of 6 weeks to 25 kg
In Table A2.11 is based on abovementioned assumptions for piglets of 6 weeks to ca. 25 kg an overview given of the nitrogen balance as a pig place would be occupied the whole year (no loss of days). Table A2.11 N uptake and excretion (kg) by piglets of 6 weeks to ca. 25 kg on yearly basis (category 407)
Category 407 1994 2005
g N/kg DC-N N uptake (kg) g N/kg DC-N N uptake (kg)
Uptake piglet feed 29.0 83.0 8.18 28.8 83.0 7.04
Fixation 3.92 3.56
Excretion 4.26 3.48
In faeces 1.4 1.2
In urine 2.9 2.3
In urine
(%)
67.3 65.6
Table A2.11 shows that the N excretion per weaned piglet of 6 weeks to ca. 25 kg per year compared to 1994 decreased considerably in 2005 and that considerably less N is excreted through the urine. The percentage of the N excretion in the urine decreased from 67.3 to 65.6%.
A2.11 Sows for slaughter (category 410)
A2.11.1 Starting points
The start and end weight of the sows for slaughter in 1994 is 205 kg and for 2005 220 kg. The average length of the period kept is 7 days. It is assumed that in both years per day 3 kg lactating sow feed is taken up. The N content of the sow feed in 1994 was 24.5 g/kg and of the lactating sow feed in 2005 25.2 g/kg. The N digestibility of these feeds was 78.9 respectively 78.0%.
A2.11.2 Results sows for slaughter
In Table A2.12 is based on abovementioned assumptions for sows for slaughter an overview given of the nitrogen balance if a pig place would be occupied the whole year (no loss of days).

Methodology for estimating emissions from agriculture in the Netherlands - Update 2019 | 147
Table A2.12 N uptake and excretion (kg) by sows for slaughter of 220 kg on yearly basis (category 410)
Category 410 1994 2005
g N/kg DC-N N uptake (kg) g N/kg DC-N N uptake (kg)
Uptake sow feed 24.5 78.9 26.83 25.2 78.0 27.59
Fixation 0.0 0.0
Excretion 26.83 27.59
In faeces 5.7 6.1
In urine 21.2 21.5
In urine (%) 78.9 78.0
Table A2.12 shows that the N excretion per sow for slaughter per year compared to 1994 remained almost equal in 2005 and that the percentage of the N excretion in the urine decreased somewhat from 78.9 to 78.0%.
A2.12 Fattening pigs of ca. 25 to ca. 110 kg (category 411)
A2.12.1 Starting points
The start and end weight of the pigs in 1991 is set to 25 respectively 109 kg (WUM, 1994). In 2005 these weights are 25.6 respectively 115.7 kg (Agrovision, 2005). The average growth per animal per day was 712 g in 1991 (WUM, 1994) and in 2005 that was 773 g (Agrovision, 2005). The length of the growth period was therefore 118 respectively 117 days. The feed conversion of the fattening pigs was 2.87 in 1991 and in 2005 that was 2.67. In 1991 during the first part of the lay on period an average amount of 44 kg starting feed and 197 kg fattening pig feed was given (WUM, 1994). In 2005 45 kg starting feed per pig was taken up, 70 kg growth feed and 126 kg finishing feed (Agrovision, 2005). The N content of the starting feed and fattening pig feed in 1991 was 28.2 respectively 26.0 g/kg. For 2005 these contents in the feeds are on average 25.2 g/kg (Jongbloed and Van Bruggen, 2008). The N digestibility of the starting feed in 1991 is estimated based on the raw material composition according to Van der Peet-Schwering (1990) and Kloosterman and Huiskes (1992) and was on average 81.9%. The N digestibility of the fattening pig feed in 1991 is estimated based on the raw material composition according to Van der Peet-Schwering (1990), Kloosterman and Huiskes (1992) and Wahle and Huiskes (1992) and was on average 80.1%. The N digestibility of the starting feed in 2005 is estimated based on the starting point that as result of the addition of amino acids and somewhat different raw materials, so that it is ca. 1% unit lower than in 1991 and thus 81.0% is assumed. The N digestibility of the fattening pig feed in 2005 is estimated based on the raw material composition of a composite feed manufacturer in the first half year of 2006 and was on average 78.6% of the feeds with an energy value of 1.05 and 1.10.
A2.12.2 Results fattening pigs
In Table A2.13 is based on abovementioned starting points for fattening pigs an overview given of the nitrogen balance if a pig place would be occupied during the whole year (no lost days). Table A2.13 N uptake and excretion (kg) by fattening pigs of ca. 25 to 114 kg on yearly basis (category 411)
Category 411 1991 2005
g N/kg DC-N N uptake (kg) g N/kg DC-N N uptake (kg)
Starting feed 28.2 81.9 3.83 25.2 81.0 3.55
Fattening pig feed 26.0 80.1 15.83 25.2 78.6 15.43
Total uptake 19.66 18.98
Fixation 5.97 7.07
Excretion 13.70 11.91
In faeces 3.8 4.0
In urine 9.8 7.9
In urine
(%)
71.9 66.6

148 | WOt-technical report 148
A2.12.3 Discussion fattening pigs
Table A2.13 shows that the N excretion per fattening pig per year compared to 1991 decreased considerably in 2005. As result of the higher N retention the percentage of the N excretion in the urine decreased considerably from 71.9 to 66.6%. For fattening pigs is examined what the effect is on the excretion in faeces and urine if the digestibility of N in the feeds for fattening pigs is 1% unit lower or higher than in the starting situation (Table A2.14). Table A2.14 N uptake and excretion (kg) by fattening pigs of ca. 25 to 114 kg on yearly basis (category 411) at a higher or lower N digestibility
Category 411 1991 2005
DC-N 1
unit lower
DC-N
starting
point
DC-N 1
unit higher
DC-N 1
unit
lower
DC-N
starting
point
DC-N 1
unit
higher
Total uptake 19.66 19.66 19.66 18.98 18.98 18.98
Excretion 13.70 13.70 13.70 11.91 11.91 11.91
In faeces 4.04 3.84 3.65 4.17 3.98 3.79
In urine 9.65 9.85 10.05 7.75 7.94 8.13
In urine (%) 70.5 71.9 73.4 65.0 66.6 68.2
From Table A2.14 it can be seen that in the dependability of the digestibility of N with a deviation of 2% units, no large shifts occur in the division of N over faeces and urine; this is a difference of 2.9% units in 1991 and 3.2% units in 2005.
A2.13 General discussion
An important attention point is a good insight in the N contents of the various feeds. Also, because the use of a whole range of feeds for various categories pigs it is sometimes difficult to know how long those feeds are given. However, by means of data from Levies Office (Bureau Heffingen) that insight can be obtained for some important feeds but are lacking for small livestock categories. This needs to receive more attention. Another point is the N digestibility. Also because of a storage period of five to six years, data on this are lacking in the compound feed industry particularly for the reference years (1991 to 2002). The N digestibility also is not of interest in the formation of the feeds: for protein this is based on ileal or faecal digestible amino acids. Also, for the year 2005 it was not possible to gain a reliable insight in the N digestibility. Besides there is such a large array of feeds that it is difficult to classify these correctly. It is hard for the compound feed industry to calculate these data, and possibly competition is a reason not to make these available after all. Ways should be found to obtain more reliable data on the N digestibility in the feeds.
A.2.14 Summary pigs
In Table A2.15 a summary is given of the excretion of N and % TAN by various categories of pigs in the reference year and in 2005 in g/year.

Methodology for estimating emissions from agriculture in the Netherlands - Update 2019 | 149
Table A2.15 Overview of the excretion of N and % TAN by the various categories of pigs in the reference year and 2005 (kg/year)
Category Number Ref.
year
N in ref.
year
% TAN in
ref. year
N in
2005
% TAN
in 2005
Breeding sows with piglets up to 6
weeks of age
400 1994 23.0 72.9 21.9 62.2
Breeding sows with piglets to ca. 25 kg 401 1994 31.4 71.9 29.8 62.7
Gilts not yet in pig of ca. 25 kg to ca. 7
months
402 2001 12.9 69.9 13.4 67.8
Gilts not yet in pig of ca. 7 months to
first mating
403 2001 16.9 74.6 17.5 72.3
Gilts not yet in pig of ca. 25 kg to ca. 7
months
404 2001 13.7 71.4 14.1 68.8
Young boars of ca. 25 kg to ca. 7
months
405 1991 12.4 68.9 12.8 66.0
Breeding boars of ca. 7 months and
older
406 1991 24.3 76.4 24.4 75.1
Piglets of ca. 6 weeks to ca. 25 kg 407 1991 4.3 67.3 3.5 65.6
Sows for slaughter 410 1994 27.8 78.9 27.6 78.0
Fattening pigs 411 1991 13.7 71.9 11.9 66.6
A2.15 References
Agrovision, 2005. Publications of SIVA and Agrovision from 1994 to 2004. Kengetallenspiegel (in Dutch). SIVAsoftware B.V., Wageningen and Bedrijfsvergelijking Agrovision B.V., Deventer, the Netherlands.
CVB, 2007. Veevoedertabel 2007. Gegevens over chemische samenstelling, verteerbaarheid en voederwaarde van voedermiddelen (in Dutch). Centraal Veevoederbureau, Lelystad, the Netherlands.
Everts, H., L.B.J. Šebek & A. Hoofs, 1991. Het effect van twee-fasen-voedering op de technische resultaten van zeugen in vergelijking met één-fase-voedering (in Dutch). Trial report P 1.75. Varkensproefbedrijf “Zuid- en West-Nederland”, Sterksel, the Netherlands.
Jongbloed, A.W. & P.A. Kemme, 2002. De gehalten aan stikstof, fosfor en kalium in varkens vanaf geboorte tot ca. 120 kg en van opfokzeugen (in Dutch). Report 2222. ID-Lelystad, Lelystad, the Netherlands.
Jongbloed, A.W. & P.A. Kemme, 2005. De uitscheiding van stikstof en fosfor door varkens, kippen, kalkoenen, pelsdieren, eenden, konijnen en parelhoeders in 2002 en 2006 (in Dutch). Nutrition and Food report 05/I01077, 101 pp. Animal Sciences Group, Lelystad, the Netherlands.
Jongbloed, A.W. & C. van Bruggen (2008). Memorandum (in Dutch).
Kloosterman, A.A.M. & J.H. Huiskes, 1992. Invloed van voerstrategie van biggen tijdens de opfok op mesterijresultaten en slachtkwaliteit (in Dutch). Trial report P 1.72. Proefstation voor de Varkenshouderij, Rosmalen, the Netherlands.
Peet-Schwering, C. van der, 1990. Lysine- en eiwitgehalte in vleesvarkensvoer bij driefasenvoedering (in Dutch). Trial report P 1.53. Varkensproefbedrijf “Noord- en Oost-Nederland”, Raalte, the Netherlands.
Tamminga, S., A.W. Jongbloed, M.M. van Eerdt, H.F.M. Aarts, F. Mandersloot, N.J.P. Hoogervorst & H. Westhoek, 2000. De forfaitaire excretie van stikstof door landbouwhuisdieren (in Dutch). Report 00-2040, 71 pp. ID-Lelystad, Lelystad, the Netherlands.
Varkensbesluit, 1994. Besluit van 7 juli 1994, houdende regelen ter zake van het houden en huisvesten van varkens (in Dutch).
Wahle, E.R. & J.H. Huiskes, 1992. De invloed van een graanrijk voer op de mesterijresultaten, slachtkwaliteit en vleeskwaliteit bij vleesvarkens (in Dutch). Trial report P 1.79. Proefstation voor de Varkenshouderij, Rosmalen, the Netherlands.
WUM, 1994. Uniformering mest en mineralen. Standaardcijfers varkens 1990 t/m 1992 (in Dutch). Working group on Uniformity of calculations of Manure and mineral data (WUM), M.M. van Eerdt (Ed.).


Methodology for estimating emissions from agriculture in the Netherlands - Update 2019 | 151
Annex 3 Calculation of TAN excretion for poultry
Translation with adaptation of the annex from Age Jongbloed (Animal Sciences Group (ASG), WUR, Lelystad) in Velthof et al., 2009.
A3.1 The excretion of nitrogen in the poultry sector
For the approach followed reference can be made to section A2.1.2 and A2.1.3 (see Annex 2).
A.3.1.1 Contents of nitrogen in chickens and chicken eggs
In Table A3.1 is indicated what are the N contents (g per kg live weight or per kg produce) for the livestock categories distinguished. Also the references are indicated. The start weight of day-old chickens for respectively the meat sector and the laying sector is set to 42 and 36 g in these calculations. Table A3.1 Weights and contents of N in various categories of chickens (Ref. = reference year)
Livestock
category
Physiological
status
Ref. Weigh
t Ref.
(g)
N content
Ref.
(g/kg)
Weight
(g)
2005
N content
2005
(g/kg)
Literature
contents
Egg meat sector - 1993 62 19.2 62 19.3 1
Day-old chicken
meat
1 day 42 30.4 42 30.4 3
Broiler Delivery 2002 2,100 27.8 2,200 27.8 2
Broiler mother
breeder
19 weeks 2000 2,000 33.4 2,000 33.4 1
Broiler father
breeder
19 weeks 2000 2,750 34.5 2,750 34.5 1
Broiler mother
breeder
≥19 weeks 1996 3,600 28.4 3,900 28.4 1
Broiler father
breeder
≥19 weeks 1996 4,800 35.4 5,000 35.4 1
Egg laying sector - 1993 62.4 19.2 62.5 18.5 2
Day-old chicken
laying
1 day 1993 36 30.4 35 30.4 3
Laying hens
battery light
17 weeks 1991 1,215 28.0 1,285 28.0 2
Laying hens
battery heavy
17 weeks 1991 1,420 28.0 1,520 28.0 2
Laying hens other
heavy
17 weeks 1,520 28.0 1,520 28.0 2
Laying hens
battery light
≥18 weeks 1993 1,750 28.0 1,600 28.0 2
Laying hens
battery heavy
≥18 weeks 1993 2,050 28.0 1,800 28.0 2
Laying hens other
heavy
≥18 weeks 1998 1,900 28.0 1,800 28.0 2
1 = Versteegh and Jongbloed, 2000; 2 = Jongbloed and Kemme, 2002; 3 = LNV, 2004.
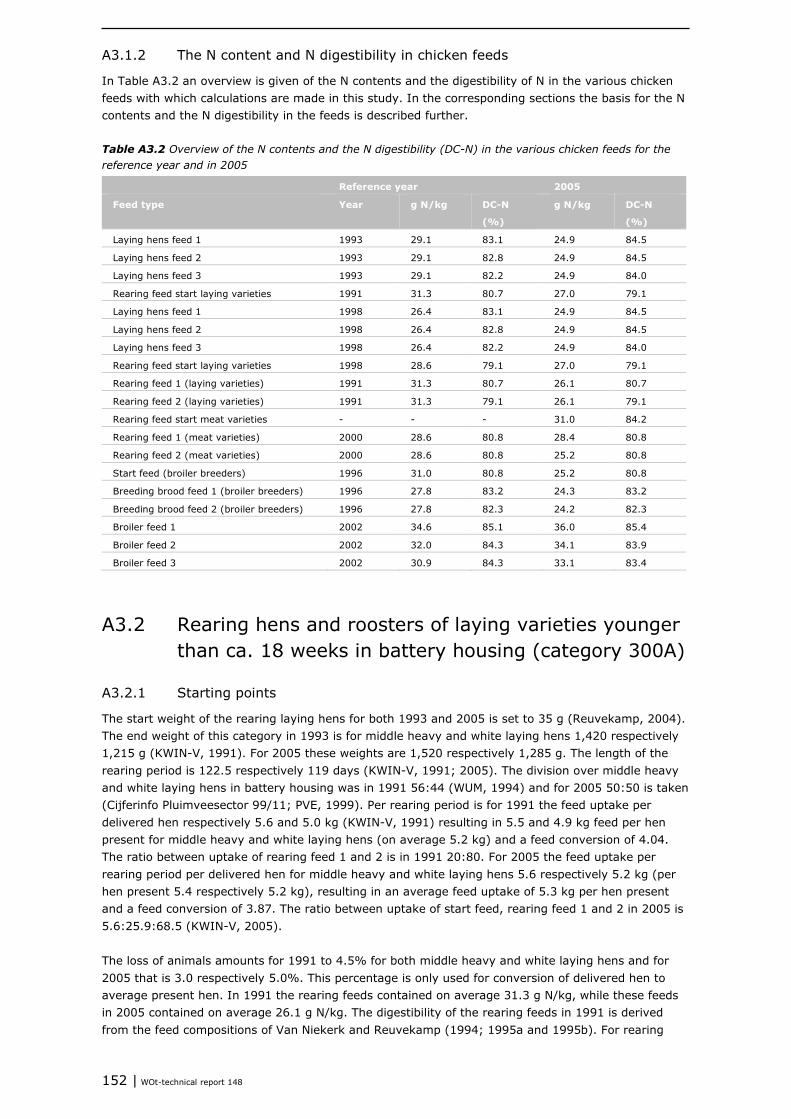
152 | WOt-technical report 148
A3.1.2 The N content and N digestibility in chicken feeds
In Table A3.2 an overview is given of the N contents and the digestibility of N in the various chicken feeds with which calculations are made in this study. In the corresponding sections the basis for the N contents and the N digestibility in the feeds is described further. Table A3.2 Overview of the N contents and the N digestibility (DC-N) in the various chicken feeds for the reference year and in 2005
Reference year 2005
Feed type Year g N/kg DC-N
(%)
g N/kg DC-N
(%)
Laying hens feed 1 1993 29.1 83.1 24.9 84.5
Laying hens feed 2 1993 29.1 82.8 24.9 84.5
Laying hens feed 3 1993 29.1 82.2 24.9 84.0
Rearing feed start laying varieties 1991 31.3 80.7 27.0 79.1
Laying hens feed 1 1998 26.4 83.1 24.9 84.5
Laying hens feed 2 1998 26.4 82.8 24.9 84.5
Laying hens feed 3 1998 26.4 82.2 24.9 84.0
Rearing feed start laying varieties 1998 28.6 79.1 27.0 79.1
Rearing feed 1 (laying varieties) 1991 31.3 80.7 26.1 80.7
Rearing feed 2 (laying varieties) 1991 31.3 79.1 26.1 79.1
Rearing feed start meat varieties - - - 31.0 84.2
Rearing feed 1 (meat varieties) 2000 28.6 80.8 28.4 80.8
Rearing feed 2 (meat varieties) 2000 28.6 80.8 25.2 80.8
Start feed (broiler breeders) 1996 31.0 80.8 25.2 80.8
Breeding brood feed 1 (broiler breeders) 1996 27.8 83.2 24.3 83.2
Breeding brood feed 2 (broiler breeders) 1996 27.8 82.3 24.2 82.3
Broiler feed 1 2002 34.6 85.1 36.0 85.4
Broiler feed 2 2002 32.0 84.3 34.1 83.9
Broiler feed 3 2002 30.9 84.3 33.1 83.4
A3.2 Rearing hens and roosters of laying varieties younger than ca. 18 weeks in battery housing (category 300A)
A3.2.1 Starting points
The start weight of the rearing laying hens for both 1993 and 2005 is set to 35 g (Reuvekamp, 2004). The end weight of this category in 1993 is for middle heavy and white laying hens 1,420 respectively 1,215 g (KWIN-V, 1991). For 2005 these weights are 1,520 respectively 1,285 g. The length of the rearing period is 122.5 respectively 119 days (KWIN-V, 1991; 2005). The division over middle heavy and white laying hens in battery housing was in 1991 56:44 (WUM, 1994) and for 2005 50:50 is taken (Cijferinfo Pluimveesector 99/11; PVE, 1999). Per rearing period is for 1991 the feed uptake per delivered hen respectively 5.6 and 5.0 kg (KWIN-V, 1991) resulting in 5.5 and 4.9 kg feed per hen present for middle heavy and white laying hens (on average 5.2 kg) and a feed conversion of 4.04. The ratio between uptake of rearing feed 1 and 2 is in 1991 20:80. For 2005 the feed uptake per rearing period per delivered hen for middle heavy and white laying hens 5.6 respectively 5.2 kg (per hen present 5.4 respectively 5.2 kg), resulting in an average feed uptake of 5.3 kg per hen present and a feed conversion of 3.87. The ratio between uptake of start feed, rearing feed 1 and 2 in 2005 is 5.6:25.9:68.5 (KWIN-V, 2005). The loss of animals amounts for 1991 to 4.5% for both middle heavy and white laying hens and for 2005 that is 3.0 respectively 5.0%. This percentage is only used for conversion of delivered hen to average present hen. In 1991 the rearing feeds contained on average 31.3 g N/kg, while these feeds in 2005 contained on average 26.1 g N/kg. The digestibility of the rearing feeds in 1991 is derived from the feed compositions of Van Niekerk and Reuvekamp (1994; 1995a and 1995b). For rearing
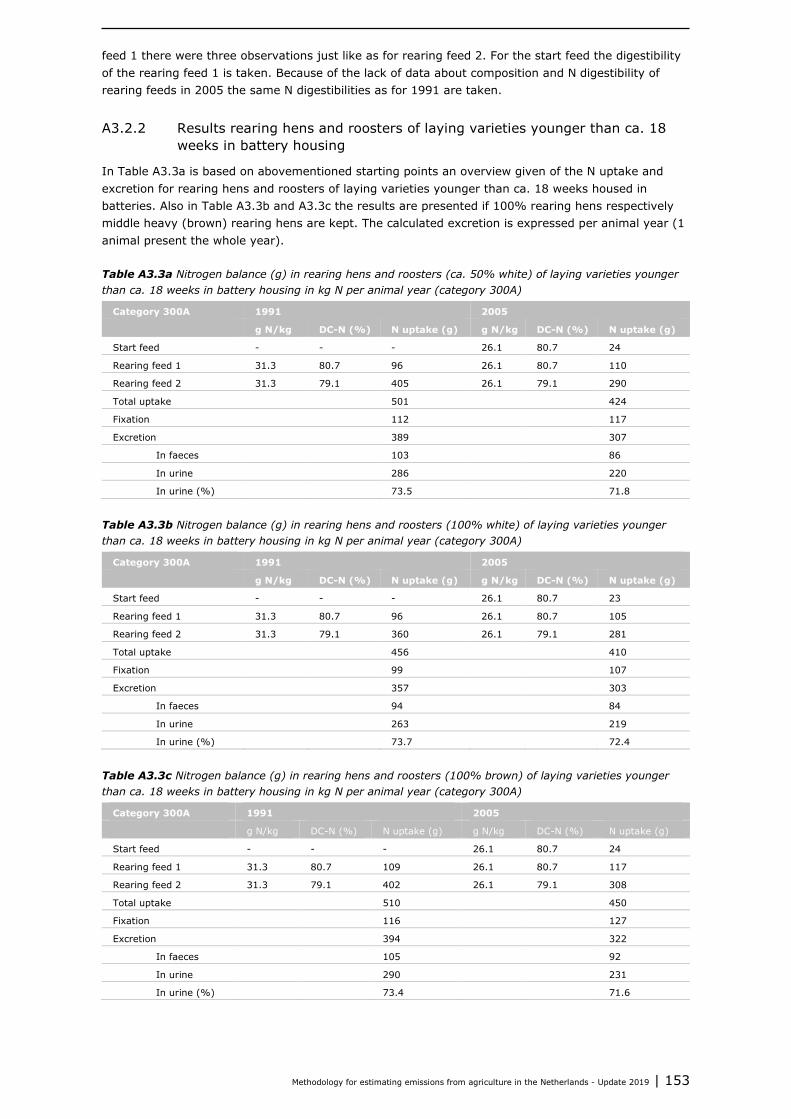
Methodology for estimating emissions from agriculture in the Netherlands - Update 2019 | 153
feed 1 there were three observations just like as for rearing feed 2. For the start feed the digestibility of the rearing feed 1 is taken. Because of the lack of data about composition and N digestibility of rearing feeds in 2005 the same N digestibilities as for 1991 are taken.
A3.2.2 Results rearing hens and roosters of laying varieties younger than ca. 18 weeks in battery housing
In Table A3.3a is based on abovementioned starting points an overview given of the N uptake and excretion for rearing hens and roosters of laying varieties younger than ca. 18 weeks housed in batteries. Also in Table A3.3b and A3.3c the results are presented if 100% rearing hens respectively middle heavy (brown) rearing hens are kept. The calculated excretion is expressed per animal year (1 animal present the whole year). Table A3.3a Nitrogen balance (g) in rearing hens and roosters (ca. 50% white) of laying varieties younger than ca. 18 weeks in battery housing in kg N per animal year (category 300A)
Category 300A 1991 2005
g N/kg DC-N (%) N uptake (g) g N/kg DC-N (%) N uptake (g)
Start feed - - - 26.1 80.7 24
Rearing feed 1 31.3 80.7 96 26.1 80.7 110
Rearing feed 2 31.3 79.1 405 26.1 79.1 290
Total uptake 501 424
Fixation 112 117
Excretion 389 307
In faeces 103 86
In urine 286 220
In urine (%) 73.5 71.8
Table A3.3b Nitrogen balance (g) in rearing hens and roosters (100% white) of laying varieties younger than ca. 18 weeks in battery housing in kg N per animal year (category 300A)
Category 300A 1991 2005
g N/kg DC-N (%) N uptake (g) g N/kg DC-N (%) N uptake (g)
Start feed - - - 26.1 80.7 23
Rearing feed 1 31.3 80.7 96 26.1 80.7 105
Rearing feed 2 31.3 79.1 360 26.1 79.1 281
Total uptake 456 410
Fixation 99 107
Excretion 357 303
In faeces 94 84
In urine 263 219
In urine (%) 73.7 72.4
Table A3.3c Nitrogen balance (g) in rearing hens and roosters (100% brown) of laying varieties younger than ca. 18 weeks in battery housing in kg N per animal year (category 300A)
Category 300A 1991 2005
g N/kg DC-N (%) N uptake (g) g N/kg DC-N (%) N uptake (g)
Start feed - - - 26.1 80.7 24
Rearing feed 1 31.3 80.7 109 26.1 80.7 117
Rearing feed 2 31.3 79.1 402 26.1 79.1 308
Total uptake 510 450
Fixation 116 127
Excretion 394 322
In faeces 105 92
In urine 290 231
In urine (%) 73.4 71.6

154 | WOt-technical report 148
Results in Tables A3.3a, A3.3b and A3.3c show that the N excretion in 2005 is much lower than in 1991, mainly because of the lower N content of the feeds. Since the N retention hardly differs between both years there is a much lower N excretion in the urine. The proportion of the percentage N in urine : N in faeces is on average 1.7% unit lower in 2005 compared to 1991.
A3.3 Rearing hens and roosters of laying varieties younger than ca. 18 weeks in housing other than battery (category 300B)
In section A3.2 some general remarks are made which are also valid for this section. Also it needs to be mentioned that to make an estimation of the technical results in this housing systems research data of free range housing is used.
A3.3.1 Starting points
In the alternative housing (free range) almost completely middle heavy hens are used (Cijferinfo Pluimveesector 99/11; PVE, 1999). Also the data from research concerns these hens. As a result it is chosen to take only middle heavy hens for this category, both for 2002 and 2006. The start weight of the rearing hens for both 2000 and 2005 is set to 35 g (Reuvekamp, 2004). The end weight of this category is for both 2000 and 2005 1,520 g (Managementgids Isabrown, 2004; Vermeij, 2005; Hendrix-Poultry, 2005). The length of the rearing period is 119 days (KWIN-V, 2000; 2005). Per rearing period for 2000 the feed uptake per delivered hen is 5.9 kg (per middle heavy hen present 5.8 kg) (KWIN-V, 2000). This results in a feed conversion of 4.20. The ratio between uptake of rearing feed 1 and 2 is 20:80. For 2005 the feed conversion per rearing period per animal present for middle heavy laying hens is 6.0 kg and the feed conversion is 3.96. The ratio between uptake of start feed, rearing feed 1 and 2 in 2005 is 5:26:69. The loss of animals for 2000 is 4.0% and for 2005 also 4.0%. The percentage animals lost is only used for the conversion of delivered hen to average present hen. In 2000 the rearing feeds contain on average 28.6 g N/kg, while these feeds in 2005 contain on average 26.1 g N/kg. The digestibility of the rearing feeds in 2000 is derived from the feed compo-sitions of Van Niekerk and Reuvekamp (1994; 1995a and 1995b). For rearing feed 1 there were three observations and for rearing feed 2 the same. For the start feed the digestibility of rearing feed 1 is taken. Because the lack of data on rearing feeds in 2005 the same digestibilities as in 2000 are used.
A3.3.2 Results rearing hens and roosters of laying varieties younger than ca. 18 weeks in housing other than battery
In Table A3.4 is based on abovementioned starting points an overview given of the N uptake and excretion for rearing hens and roosters of laying varieties younger than ca. 18 weeks in non-battery housing systems. The calculated excretion is expressed per animal year (1 animal that is present the whole year). With this the figure differs from usual parameters within the sector. Table A3.4 Nitrogen balance (g) in rearing hens and roosters (100% brown) of laying varieties younger than ca. 18 weeks in non-battery housing in kg N per animal year (category 300B)
Category 300B 2000 2005
g N/kg DC-N (%) N uptake (g) g N/kg DC-N (%) N uptake (g)
Start feed - - - 26.1 80.7 24
Rearing feed 1 28.6 80.7 99 26.1 80.7 121
Rearing feed 2 28.6 79.1 408 26.1 79.1 326
Total uptake 507 471
Fixation 119 128
Excretion 388 343
In faeces 104 96
In urine 284 247
In urine (%) 73.1 72.0
Methodology for estimating emissions from agriculture in the Netherlands - Update 2019 | 155
Results in Table A3.4 show that the N excretion in 2005 is somewhat lower than in 2000, mostly due to the somewhat lower N content of the feeds. Since the N retention hardly differs between both years the N excretion in the urine is lower. The division of the percentage N in urine : N in faeces becomes 1.1% unit lower in 2005 compared to 2000.
A.3.4 Hens and roosters of laying varieties ca. 18 weeks and older in battery housing (category 301A)
In this section the calculations for hens in battery systems are examined further. Here also the differences are calculated if only white leghorns or brown laying hens are kept in a battery system.
A3.4.1 Starting points
The start weight of the middle heavy and white laying hens for 1993 is 1,420 respectively 1,215 g (KWIN-V, 1993). For 2005 these weights are 1,520 respectively 1,285 g. The end weight of this category at the end of the laying period is in 1993 for middle heavy and white laying hens 2,050 respectively 1,750 g (KWIN-V, 1993). For 2005 these weights are 1,800 respectively 1,600 g. The length of the laying period is 417 days (399 days actual laying period, 18 days rearing) (KWIN-V, 1993). The division over middle heavy and white laying hens in battery housing is 56:44 (WUM, 1994) and for 2005 50:50 is taken (Cijferinfo Pluimveesector 99/11; PVE, 1999). The feed uptake of the middle heavy and white laying hens amounts 90 respectively 85 g/day during rearing and 117.5 respectively 110 g/day during the actual laying period for 1993, and for 2005 110 respectively 109.5 g/day is taken (KWIN-V 1993 respectively 2005). Per round the feed uptake in 1993 is on average 42.6 kg per hen present. In 1993 per hen laid on 19.9 (middle heavy) or 20.4 kg (white laying hen) eggs are produced. In this is calculated with another 5 eggs produced during rearing with the same egg weight. The average feed conversion is 2.23 (KWIN-V, 1993), which is based on feed uptake from 20 weeks on and egg production from 17 weeks. Per round the feed uptake in 2005 is on average 41.1 kg per hen present. In 2005 per hen laid on 20.5 (middle heavy) or 22.3 kg (white laying hen) eggs are produced. In this is calculated with another 5 eggs produced during rearing with the same egg weight. The average feed conversion is 2.02 (KWIN-V, 2005), which is based on feed uptake from 20 weeks on and egg production from 17 weeks. The loss of animals amounts to 6.3 and 7.3% for middle heavy and white laying hens in 1993 and for 2005 the same values have been taken. The percentage of animals lost is only used for the conversion of delivered hen to average present hen. The start and laying feeds contain in 1993 on average 29.1 g N/kg (WUM, 1994). For 2005 the average N content in the start and laying feeds was 24.9 g N/kg (Van Bruggen, 2007). The ratio between the laying feeds 1, 2 and 3 over the laying period is 40:40:20, both for 1993 and 2005. There are also businesses where laying feed 2 is used to the end of the laying period instead of switching to laying feed 3. In the calculations this is not taken into account. The digestibility of the laying hen feeds in 1993 is derived from the feed compositions of Van Niekerk and Reuvekamp (1994; 1995a; 1995b; 1997) and Emous et al. (1999). For laying feed 1 there were six observations with an average N digestibility of 84.1%. Of laying feed 2 there were six observations too with an average N digestibility of 83.8%, while for laying feed 3 there were four observations with an average N digestibility of 83.2%. For 2005 we had the disposal of data on laying feed 1 of the first half year of 2006. The average N digestibility was 84.5%. For laying feed 2 the same N digestibility was taken and for laying feed 3 an N digestibility of 84.0% was taken. The N digestibility of the start feed is set equal to that of the laying feed 2.

156 | WOt-technical report 148
A3.4.2 Results hens and roosters of laying varieties ca. 18 weeks and older in battery housing
In Tables A3.5a, A3.5b and A3.5c is based on abovementioned starting points an overview given of the N excretion for hens and roosters of laying varieties of ca. 18 weeks and older in batteries. Table A3.5a Nitrogen balance (g) in hens and roosters of laying varieties of ca. 18 weeks and older in battery housing (ca. 50% white) in kg N per animal year (category 301A)
Category 301A 1993 2005
g N/kg DC-N (%) N uptake (g) g N/kg DC-N (%) N uptake (g)
Rearing feed 29.1 79.1 39 27.0 79.1 40
Laying feed 1 29.1 84.1 464 24.9 84.5 380
Laying feed 2 29.1 83.8 464 24.9 84.5 380
Laying feed 3 29.1 83.2 232 24.9 84.0 190
Total uptake 1,200 990
Fixation 350 362
Excretion 850 628
In faeces 196 156
In urine 654 472
In urine
(%)
76.9 75.1
Table A3.5b Nitrogen balance (g) in hens and roosters of laying varieties of ca. 18 weeks and older in battery housing (100% white) in kg N per animal year (category 301A)
Category 301A 1993 2005
g N/kg DC-N (%) N uptake (g) g N/kg DC-N (%) N uptake (g)
Rearing feed 29.1 79.1 36 27.0 79.1 36
Laying feed 1 29.1 84.1 448 24.9 84.5 380
Laying feed 2 29.1 83.8 448 24.9 84.5 380
Laying feed 3 29.1 83.2 224 24.9 84.0 190
Total uptake 1,155 986
Fixation 345 365
Excretion 810 620
In faeces 189 156
In urine 622 465
In urine (%) 76.7 74.9
The results in Table A3.5a are for businesses with a division of ca. 50% white and 50% middle heavy (brown) laying hens; those in Table A3.5b and A3.5c are for businesses with 100% white respectively 100% brown laying hens. The calculated excretion is expressed in g N per animal year (1 animal that is present the whole year). As such this figure differs from the usual parameters in the sector.
A3.4.3 Discussion laying hens in battery housing
Tables A3.5a, A3.5b and A3.5c show that differences in total N excretion between the various laying varieties do exist, but that there are hardly differences in the share TAN in the excreta. Compared to 1993 the share TAN in the excreta decreased somewhat with on average 1.8% unit. Examined is also what the effect on the excretion of N in faeces and urine is, if the N digestibility is 1% unit higher or lower. Table A3.6 gives the results of this. Table A3.5c Nitrogen balance (g) in hens and roosters of laying varieties of ca. 18 weeks and older in battery housing (100% middle heavy; brown) in kg N per animal year (category 301A)
Category 301A 1993 2005
g N/kg DC-N (%) N uptake (g) g N/kg DC-N (%) N uptake (g)
Rearing feed 29.1 79.1 42 27.0 79.1 44
Laying feed 1 29.1 84.1 477 24.9 84.5 380
Laying feed 2 29.1 83.8 477 24.9 84.5 380

Methodology for estimating emissions from agriculture in the Netherlands - Update 2019 | 157
Category 301A 1993 2005
g N/kg DC-N (%) N uptake (g) g N/kg DC-N (%) N uptake (g)
Laying feed 3 29.1 83.2 239 24.9 84.0 190
Total uptake 1,235 994
Fixation 354 358
Excretion 881 636
In faeces 202 157
In urine 679 479
In urine (%) 77.1 75.2
Table A3.6 N uptake and N excretion (g) by hens and roosters of laying varieties of ca. 18 weeks and older in battery housing (ca. 50% white) in kg N per animal year (category 301A)
Category 301A 1993 2005
DC-N 1
unit
lower
DC-N
starting
point
DC-N 1
unit
higher
DC-N 1
unit
lower
DC-N
starting
point
DC-N 1
unit
higher
Total uptake 1,200 1,200 1,200 990 990 990
Excretion 850 850 850 628 628 628
In faeces 208 196 184 166 156 147
In urine 642 654 666 462 472 481
In urine (%) 75.5 76.9 78.3 73.5 75.1 76.7
From Table A3.6 follows that in the dependability of the differences in the N digestibility there are no large shifts in the relative N excretion through the faeces and urine; with a 2% unit difference in N digestibility the relative share in the urine increases with ca. 3% units.
A3.5 Hens and roosters of laying varieties ca. 18 weeks and older in housing other than battery (category 301B)
In section A3.4 some general remarks have been described that also concern this section. Also needs to be mentioned that in estimating the technical results in this housing systems research data of free range housing has been used. In this two types occur, with and without outside access. According to Statistics Netherlands (CBS, 2004) the number of animals is divided equally over both systems and the technical results over both systems are averages (KWIN-V, 1998; 2005).
A3.5.1 Starting points for 1998 and 2005
In the alternative housing (free range) almost completely middle heavy hens are used (Cijferinfo Pluimveesector 99/11; PVE, 1999). Also the data from research concern these hens. Therefore it has been chosen to take only the middle heavy hens for this category, both for 1998 as 2005. The start weight of the middle heavy laying hens for 1998 and 2005 is 1,470 respectively 1,520 g (KWIN-V, 1998; 2005). The end weight of this category at the end of the laying period for 1998 and 2005 is 1,900 respectively 1,800 g (KWIN-V, 1998; 2005). In 1998 the length of the laying period is 401 days (380 days actually laying period, 21 days rearing) and in 2005 that is 406 (385 actual laying period, 21 days rearing (KWIN-V, 1998; 2005). The feed uptake is 97.5 g/day during the rearing and 119 g/day during the actual laying period (KWIN-V, 1998), while in 2005 the uptakes are 100 respectively 121 g/day (KWIN-V, 2005). Per round the feed uptake for 1998 is on average 49.6 kg per hen present and 20.28 kg eggs are produced. This production takes place at an average feed conversion of 2.29. For 2005 the feed uptake is on average 48.7 kg per hen present and the egg production 20.19 kg, resulting in an average feed conversion of 2.25. The loss of animals amounts to 8.3% for 1998 and 9.3% for 2005.

158 | WOt-technical report 148
The percentage loss of animals is only used for the conversion of delivered hen to average hen present. The start and laying feeds in 1998 contain on average 26.4 g N/kg (Tamminga et al., 2000). For 2005 the average N content in the start and laying feeds was 24.9 g N/kg (Van Bruggen, 2007). The ratio between the laying feeds 1, 2 and 3 over the laying period is 40:40:20, both for 1993 and 2005. There are also businesses where laying feed 2 is given to the end of the laying period instead of switching to laying feed 3. In the calculations this is not considered. The digestibility of the laying hen feeds in 1998 is derived from the feed compositions of Van Niekerk and Reuvekamp (1994; 1995a; 1995b; 1997) and Emous et al. (1999). For laying feed 1 there were six observations with an average N digestibility of 84.1%. Of laying feed 2 there were also six observations with an average N digestibility of 83.8%, while for laying feed 3 there were four observation with an average N digestibility of 83.2%. For 2005 we had the disposal of data on laying feed 1 of the first half year of 2006. The average N digestibility was 84.5%. For laying feed 2 the same N digestibility as of laying feed 1 is taken and for laying feed 3 84.0% is taken. The N digestibility of the start feed is set equal to that of the rearing feed 2.
A3.5.2 Results hens and roosters of laying varieties ca. 18 weeks and older in housing other than battery
In Table A3.7 is based on abovementioned starting points an overview given of the N excretion for hens and roosters of laying varieties of ca. 18 weeks and older in housing other than batteries. The calculated excretion is expressed in g N per animal year (1 animal that is present the whole year). In this the figure differs from usual parameters in the sector. Table A3.7 N uptake and excretion (g) by hens and roosters of brown laying varieties ca. 18 weeks and older in housing other than batteries in kg N per animal year (category 301B)
Category 301B 1998 2005
Uptake kg feed g N/kg DC-N (%) kg N kg feed g N/kg DC-N (%) kg N
Rearing feed 1.8 28.6 79.1 51 1.9 27.0 79.1 51
Laying feed 1 16.5 26.4 83.1 436 16.8 24.9 84.5 417
Laying feed 2 16.5 26.4 82.8 436 16.8 24.9 84.5 417
Laying feed 3 8.2 26.4 82.2 218 8.4 24.9 84.5 209
Total 43.0 1,140 43.8 1,094
Fixation 348 357
Excretion 792 736
In faeces 187 173
In urine 605 563
In urine
(%)
76.4 76.5
From Table A3.7 follows that the N excretion form 1998 to 2005 decreased somewhat, but that there is no difference in the share TAN in the excreta.
A3.6 Rearing hens and roosters of meat varieties 0 to 19 weeks (category 310)
Category 310 concerns the young breeder animals for the broiler sector. Different from the laying sector this is a clearly distinguished category. Differences between hens and roosters have been taken into account. Conversion of parameters took place because in the manure legislation both the hens and roosters are counted, while parameters in some cases are expressed per hen.

Methodology for estimating emissions from agriculture in the Netherlands - Update 2019 | 159
A.3.6.1 Starting points for 2000 and 2005
The start weight of the rearing breeder animals (the chicks) is for both 2000 and 2005 set to 42 g (Van Middelkoop, 2000). The end weight of this category at ca. 19 weeks of age is for roosters and hens in 2000 2,750 respectively 2,000 g (Ross, 2004) and for 2005 the same weights are taken. The length of the rearing period is for 2000 and 2005 calculated to 126 days (KWIN-V, 2000; 2005). The number of roosters at lay on is 15%. On average there are 14.0% roosters per reared hen (KWIN-V, 2000; 2005). At the end of the rearing period selection of the roosters takes place. At lay on for the laying period 10% roosters are deployed. Per rearing period is for 2000 the feed uptake of rearing feed 1 and 2 per hen delivered 2.0 respectively 6.5 kg and per average hen present 1.68 respectively 5.47 kg, resulting in an average feed conversion of 3.49. For 2005 the same values are taken. The loss of animals in 2000 amounts to 7.0 and 14.0% for hens and roosters and also for 2005. The percentage animals lost is only used for the conversion of delivered hen to average present animal. The rearing feed contains in 2000 on average 28.3 g N/kg (Tamminga et al., 2000) and in 2005 the average N content of the start and rearing feed is 26.1 g/kg (Van Bruggen, 2007). These contents are copied from those of rearing laying hens, since no data was available for the rearing of broiler breeders. The digestibility of the rearing feeds in 2000 is derived from the feed compositions of Van der Haar and Meijerhof (1996) and of a feed supplier. For rearing feed 1 there were two observations (average 80.8%) and for rearing feed 2 seven observations (average 80.7%). For the start feed is based on information from a feed supplier an N digestibility of 84.2% taken. For the rearing feeds 1 and 2 is an average N digestibility taken of 80.7%. Since data on rearing feeds in 2005 are lacking the same digestibilities as in 2000 are used.
A3.6.2 Results rearing hens and roosters of meat varieties 0 to 19 weeks
In Table A3.8 is based on abovementioned starting points an overview given of the N excretion for rearing hens and roosters of meat varieties 0 to 19 weeks. The calculated excretion is expressed in kg N per animal year (1 animal that is present the whole year). In this the figure differs from usual parameters in the sector. Table A3.8 N uptake and excretion (g) by rearing hens and roosters of meat varieties 0 to 19 weeks in kg N per animal year (category 310)
Category 310 2000 2005
g
N/kg
DC-N (%) N uptake (g) g N/kg DC-N (%) N uptake (g)
Rearing feed start - - - 31.0 84.2 38
Rearing feed 1 28.6 80.8 140 28.4 80.8 104
Rearing feed 2 28.6 80.8 453 25.2 80.8 400
Total uptake 593 541
Fixation 200 200
Excretion 393 342
In faeces 114 99
In urine 280 242
In urine (%) 71.1 71.0
From Table A3.8 follows that the N excretion decreased somewhat from 2000 to 2005, but that there is no difference in the share TAN in the excreta.
A3.7 Breeders of meat varieties ca. 19 weeks and older (category 311)
Category 311 concerns the breeder animals for the broiler sector. Different from the laying sector this is a clearly distinguished category. Differences between hens and roosters are taken into account. Conversion of parameters took place because in the manure legislation both the hens and the roosters are counted, while parameters in some cases are expressed per hen.

160 | WOt-technical report 148
A3.7.1 Starting points
The start weight of the hens respectively roosters for 1996 is 1,900 respectively 2,600 g and for 2005 2,000 respectively 2,750 g (Ross, 2004). The end weight of this category at the end of the production period is for hens and roosters for 1996 3,600 respectively 4,800 g and for 2005 3,700 respectively 4,800 g (KWIN-V, 1996; 2005). The length of the production cycle is for 1998 and 2006 calculated to 346 respectively 343 days (KWIN-V, 1996; 2005). Goal for both 1996 as for 2005 is to have 10% roosters at the start of the laying period. Over the whole period on average 95.51 hens and 8.44 roosters are present. Per laying round is for 1996 the feed uptake on average 3.0 kg pre laying feed and 45.0 kg breeding brood feed per laid on hen (2.9 kg respectively 43.3 kg per average animal present) and 148 brood eggs and 10 consumption eggs of on average 62 grams apiece are produced. This results in 9.27 kg eggs per average present animal. For 2005 the feed uptake per round is on average 3.30 kg pre laying feed and 44.7 kg breeding brood feed per laid on hen (3.20 kg respectively 43.0 kg per average animal present) and 150 brood eggs and 10 consumption eggs of on average 62 grams are produced. This results in 9.54 kg eggs per average animal present. The loss of animals amounts for 1996 to 1.0 respectively 3.5% for hens and roosters during rearing and 10.0 respectively 35.0% during the laying period. For 2005 the percentages loss of animals during rearing are 1.0 respectively 3.6 and 10.0 respectively 35.0% during the laying period. The percentage animals lost is only used for the conversion of delivered hen to average present animal. The N content in the pre laying feed and the breeding brood feed for 1996 is calculated by taking the average content of 1992 (WUM, 1994) and that of Tamminga et al. (2000). The pre laying feed then contains 31.0 g N/kg and the breeding brood feed 27.8 g N/kg. In 2005 the pre laying feed, breeding brood feed 1 and 2 contained respectively 25.2, 24.3 and 24.2 g N/kg (Van Bruggen, 2007). Of the N digestibility of the feeds in 1996 no data are available. For 2005 for the pre laying feed the N digestibility of the rearing feed 2 (80.8%) was taken. Based on data of a composite feed manufacturer beginning 2008 an N digestibility of the breeding brood feed 1 and 2 of 83.2 respectively 82.3% was calculated. These digestibilities are also taken for the feeds of 1996.
A3.7.2 Results hens and roosters of meat varieties from ca. 19 weeks and older
In Table A3.9 is based on abovementioned starting points an overview given of the N uptake and excretion for hens and roosters of meat varieties from ca. 19 weeks and older. The calculated excretion is expressed in kg N per animal year (1 animal that is present the whole year). In this the figure differs from usual parameters in the sector. Table A3.9 Nitrogen balance (g) in hens and roosters of meat varieties ca. 19 weeks and older in kg N per animal year (category 311)
Category 311 1996 2005
g N/kg DC-N (%) N uptake (g) g N/kg DC-N (%) N uptake (g)
Start feed 31.0 80.8 103 25.2 80.8 92
Breeding brood feed 1 27.8 83.2 614 24.3 83.2 538
Breeding brood feed 2 27.8 82.3 768 24.2 82.3 662
Total uptake 1,484 1,293
Fixation 258 262
Excretion 1,227 1,030
In faeces 259 225
In urine 968 805
In urine (%) 78.9 78.1
From Table A3.9 follows that the N excretion clearly decreases from 1998 to 2005 but that there is hardly difference in the share TAN in the excreta.
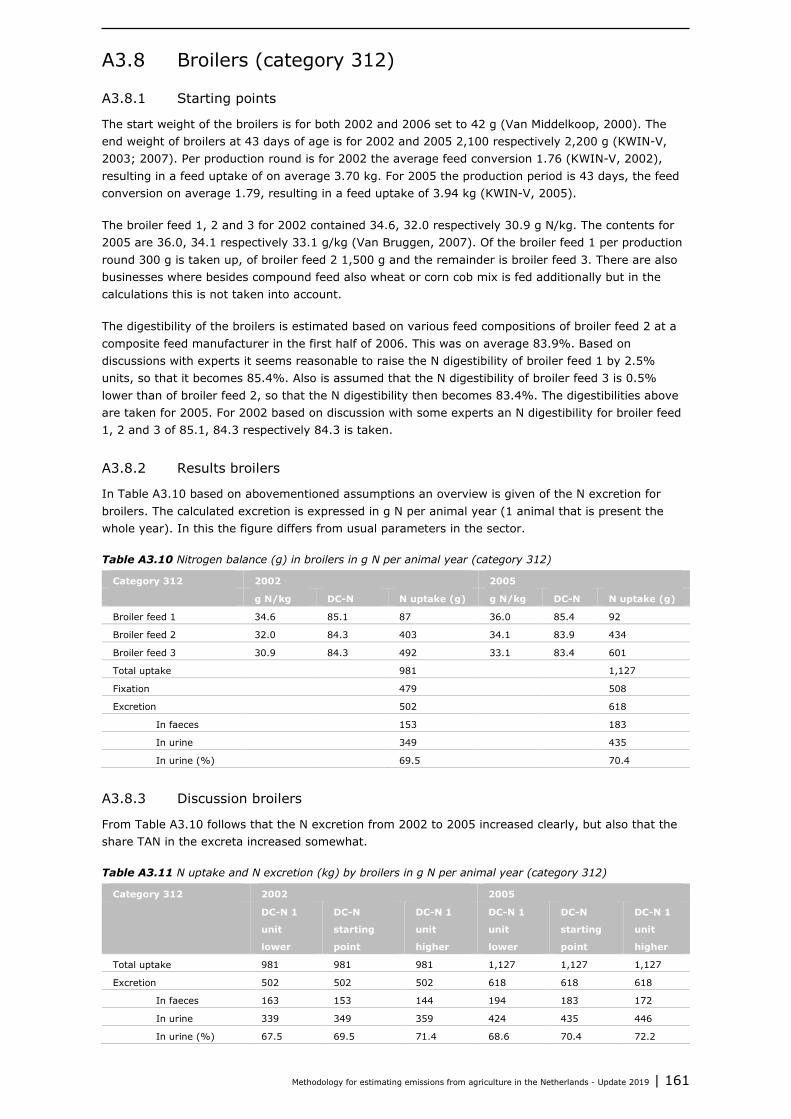
Methodology for estimating emissions from agriculture in the Netherlands - Update 2019 | 161
A3.8 Broilers (category 312)
A3.8.1 Starting points
The start weight of the broilers is for both 2002 and 2006 set to 42 g (Van Middelkoop, 2000). The end weight of broilers at 43 days of age is for 2002 and 2005 2,100 respectively 2,200 g (KWIN-V, 2003; 2007). Per production round is for 2002 the average feed conversion 1.76 (KWIN-V, 2002), resulting in a feed uptake of on average 3.70 kg. For 2005 the production period is 43 days, the feed conversion on average 1.79, resulting in a feed uptake of 3.94 kg (KWIN-V, 2005). The broiler feed 1, 2 and 3 for 2002 contained 34.6, 32.0 respectively 30.9 g N/kg. The contents for 2005 are 36.0, 34.1 respectively 33.1 g/kg (Van Bruggen, 2007). Of the broiler feed 1 per production round 300 g is taken up, of broiler feed 2 1,500 g and the remainder is broiler feed 3. There are also businesses where besides compound feed also wheat or corn cob mix is fed additionally but in the calculations this is not taken into account. The digestibility of the broilers is estimated based on various feed compositions of broiler feed 2 at a composite feed manufacturer in the first half of 2006. This was on average 83.9%. Based on discussions with experts it seems reasonable to raise the N digestibility of broiler feed 1 by 2.5% units, so that it becomes 85.4%. Also is assumed that the N digestibility of broiler feed 3 is 0.5% lower than of broiler feed 2, so that the N digestibility then becomes 83.4%. The digestibilities above are taken for 2005. For 2002 based on discussion with some experts an N digestibility for broiler feed 1, 2 and 3 of 85.1, 84.3 respectively 84.3 is taken.
A3.8.2 Results broilers
In Table A3.10 based on abovementioned assumptions an overview is given of the N excretion for broilers. The calculated excretion is expressed in g N per animal year (1 animal that is present the whole year). In this the figure differs from usual parameters in the sector. Table A3.10 Nitrogen balance (g) in broilers in g N per animal year (category 312)
Category 312 2002 2005
g N/kg DC-N N uptake (g) g N/kg DC-N N uptake (g)
Broiler feed 1 34.6 85.1 87 36.0 85.4 92
Broiler feed 2 32.0 84.3 403 34.1 83.9 434
Broiler feed 3 30.9 84.3 492 33.1 83.4 601
Total uptake 981 1,127
Fixation 479 508
Excretion 502 618
In faeces 153 183
In urine 349 435
In urine (%) 69.5 70.4
A3.8.3 Discussion broilers
From Table A3.10 follows that the N excretion from 2002 to 2005 increased clearly, but also that the share TAN in the excreta increased somewhat. Table A3.11 N uptake and N excretion (kg) by broilers in g N per animal year (category 312)
Category 312 2002 2005
DC-N 1
unit
lower
DC-N
starting
point
DC-N 1
unit
higher
DC-N 1
unit
lower
DC-N
starting
point
DC-N 1
unit
higher
Total uptake 981 981 981 1,127 1,127 1,127
Excretion 502 502 502 618 618 618
In faeces 163 153 144 194 183 172
In urine 339 349 359 424 435 446
In urine (%) 67.5 69.5 71.4 68.6 70.4 72.2
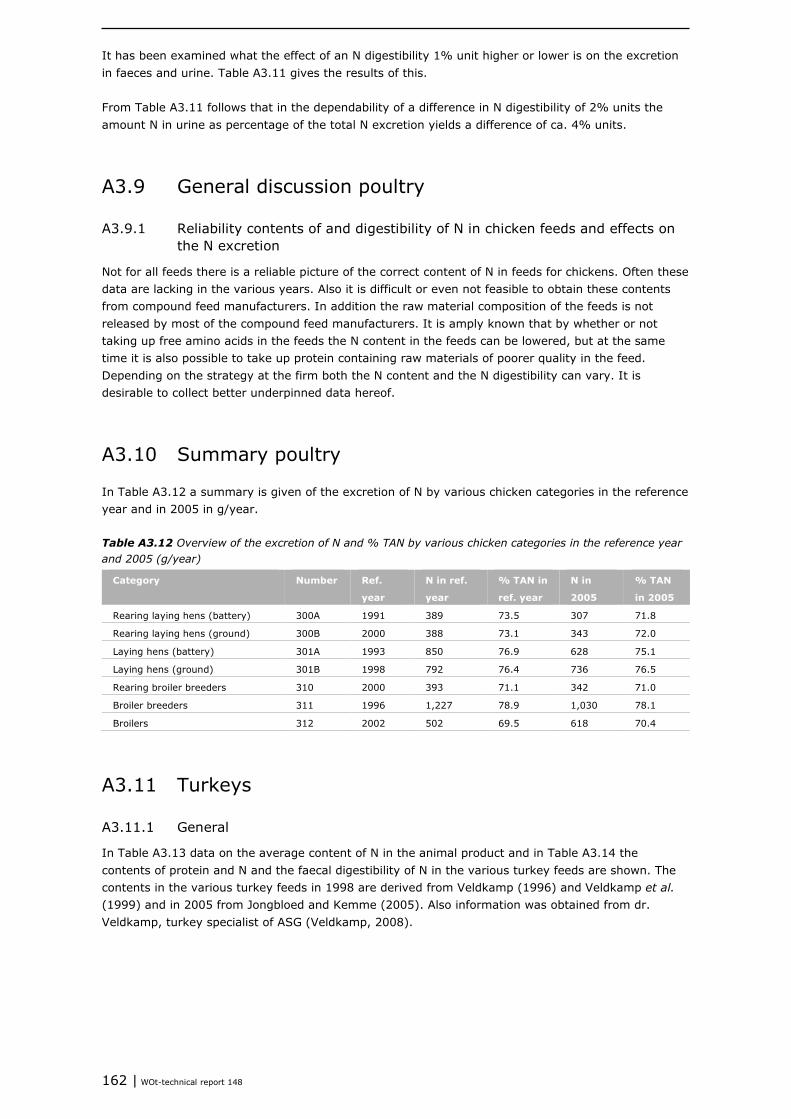
162 | WOt-technical report 148
It has been examined what the effect of an N digestibility 1% unit higher or lower is on the excretion in faeces and urine. Table A3.11 gives the results of this. From Table A3.11 follows that in the dependability of a difference in N digestibility of 2% units the amount N in urine as percentage of the total N excretion yields a difference of ca. 4% units.
A3.9 General discussion poultry
A3.9.1 Reliability contents of and digestibility of N in chicken feeds and effects on the N excretion
Not for all feeds there is a reliable picture of the correct content of N in feeds for chickens. Often these data are lacking in the various years. Also it is difficult or even not feasible to obtain these contents from compound feed manufacturers. In addition the raw material composition of the feeds is not released by most of the compound feed manufacturers. It is amply known that by whether or not taking up free amino acids in the feeds the N content in the feeds can be lowered, but at the same time it is also possible to take up protein containing raw materials of poorer quality in the feed. Depending on the strategy at the firm both the N content and the N digestibility can vary. It is desirable to collect better underpinned data hereof.
A3.10 Summary poultry
In Table A3.12 a summary is given of the excretion of N by various chicken categories in the reference year and in 2005 in g/year. Table A3.12 Overview of the excretion of N and % TAN by various chicken categories in the reference year and 2005 (g/year)
Category Number Ref.
year
N in ref.
year
% TAN in
ref. year
N in
2005
% TAN
in 2005
Rearing laying hens (battery) 300A 1991 389 73.5 307 71.8
Rearing laying hens (ground) 300B 2000 388 73.1 343 72.0
Laying hens (battery) 301A 1993 850 76.9 628 75.1
Laying hens (ground) 301B 1998 792 76.4 736 76.5
Rearing broiler breeders 310 2000 393 71.1 342 71.0
Broiler breeders 311 1996 1,227 78.9 1,030 78.1
Broilers 312 2002 502 69.5 618 70.4
A3.11 Turkeys
A3.11.1 General
In Table A3.13 data on the average content of N in the animal product and in Table A3.14 the contents of protein and N and the faecal digestibility of N in the various turkey feeds are shown. The contents in the various turkey feeds in 1998 are derived from Veldkamp (1996) and Veldkamp et al. (1999) and in 2005 from Jongbloed and Kemme (2005). Also information was obtained from dr. Veldkamp, turkey specialist of ASG (Veldkamp, 2008).

Methodology for estimating emissions from agriculture in the Netherlands - Update 2019 | 163
Table A3.13 Weights and contents of N in various turkey categories and in turkey eggs
Livestock category Weight (g)
1998
Weight (g)
2005
Physiological
status
N content
(g/kg)
Literature
contents
Turkey egg 89 89 - 19.4 WUM, 1994
One-day turkey chick 57 57 - 30.0 LNV, 2004
Turkey for slaughter hen 9,500 9,800 Ca. 16.5 weeks 33.0 LNV, 2004
Turkey for slaughter
rooster
18,500 19,500 Ca. 21 weeks 33.0 LNV, 2004
Table A3.14 Overview of the average N contents and digestibility of N in the various turkey feeds for 1998 and 2005
Reference year 2005
Feed type Year g N/kg DC-N (%) g N/kg DC-N (%)
Start feed 1998 45.8 85.0 44.7 85.0
Turkey feed phase 2 1998 41.4 83.6 40.9 83.6
Turkey feed phase 3 1998 37.4 83.4 35.8 83.4
Turkey feed phase 4 1998 31.3 83.1 29.6 83.1
Turkey feed phase 5 1998 31.3 83.1 26.1 83.1
Turkey feed phase 6 1998 27.6 84.0 24.2 84.0
A3.11.2 Turkeys for slaughter (category 210)
To assess various technical results of turkeys for slaughter the data of KWIN are used. Furthermore information given by dr. Veldkamp (2008) has been processed.
A3.11.3 Starting points for 1998 and for 2005
The start weight of turkeys for slaughter for both 1998 and 2005 is set to 57 g (Veldkamp, 2008). For 1998 the end weight of the roosters and hens on an age of 147 and 116 days (on average 132 days) is 18.50 respectively 9.50 kg (average 14.00 kg). For 2005 the end weight of the roosters respectively hens on an age of 145 respectively 112 days (on average 128 days) is 19.50 respectively 9.80 kg (average 14.60 kg). Per production period is for 1998 the average feed conversion per kg delivered weight 2.63, resulting in a feed uptake of 36.9 kg per round and 99.9 kg per year. For 2005 the average feed conversion is 2.63, resulting in a feed uptake of 38.7 kg per round and 105.7 kg per year. The division of the feed uptake over the various phases is derived from British United Turkeys (2006). The N contents in the various feeds for turkeys for slaughter are shown in Table A3.15. The N contents in the feeds for the year 1998 are derived from Veldkamp (1996) and Veldkamp et al. (1999) and are averages for each phase. The N contents in the various turkey feeds for 2005 are the same as mentioned by Jongbloed and Kemme (2005). Based on the feed composition according to Veldkamp et al. (1999) the digestibility of N in the various feeds for turkeys for slaughter are estimated. The digestibility of N in the distinguished feeds is kept equal for both years (Table A3.15) based on Veldkamp (2008).
A3.11.4 Results turkeys for slaughter
In Table A3.15 is based on abovementioned starting points an overview given of the N excretion for turkeys for slaughter. The calculated excretion is expressed in kg N per animal year (1 animal that is present the whole year). In this the figure differs from usual parameters in the sector. From the results according to Table A3.15 follows that N excretion has decreased because of the lower N content in the feeds and a higher retention of N. As a result less N is excreted through the urine and share N in urine as percentage of the total N excretion decreased from 72.6 to 70.5%.
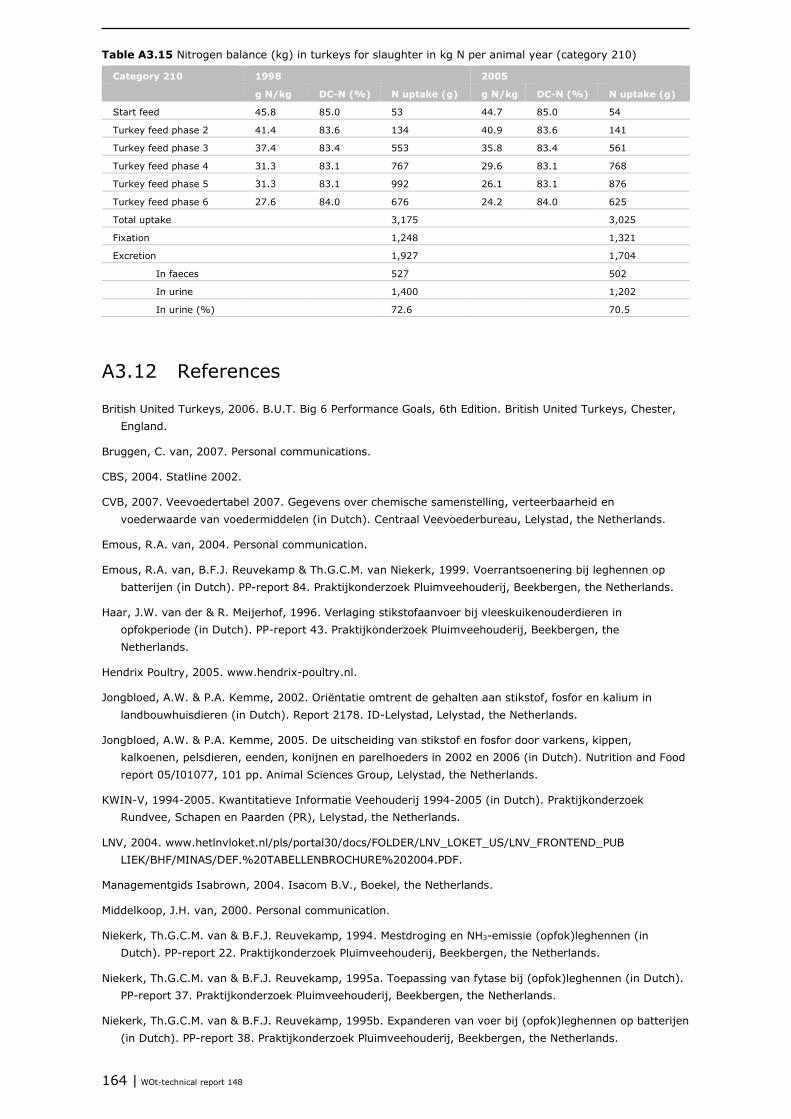
164 | WOt-technical report 148
Table A3.15 Nitrogen balance (kg) in turkeys for slaughter in kg N per animal year (category 210)
Category 210 1998 2005
g N/kg DC-N (%) N uptake (g) g N/kg DC-N (%) N uptake (g)
Start feed 45.8 85.0 53 44.7 85.0 54
Turkey feed phase 2 41.4 83.6 134 40.9 83.6 141
Turkey feed phase 3 37.4 83.4 553 35.8 83.4 561
Turkey feed phase 4 31.3 83.1 767 29.6 83.1 768
Turkey feed phase 5 31.3 83.1 992 26.1 83.1 876
Turkey feed phase 6 27.6 84.0 676 24.2 84.0 625
Total uptake 3,175 3,025
Fixation 1,248 1,321
Excretion 1,927 1,704
In faeces 527 502
In urine 1,400 1,202
In urine (%) 72.6 70.5
A3.12 References
British United Turkeys, 2006. B.U.T. Big 6 Performance Goals, 6th Edition. British United Turkeys, Chester, England.
Bruggen, C. van, 2007. Personal communications.
CBS, 2004. Statline 2002.
CVB, 2007. Veevoedertabel 2007. Gegevens over chemische samenstelling, verteerbaarheid en voederwaarde van voedermiddelen (in Dutch). Centraal Veevoederbureau, Lelystad, the Netherlands.
Emous, R.A. van, 2004. Personal communication.
Emous, R.A. van, B.F.J. Reuvekamp & Th.G.C.M. van Niekerk, 1999. Voerrantsoenering bij leghennen op batterijen (in Dutch). PP-report 84. Praktijkonderzoek Pluimveehouderij, Beekbergen, the Netherlands.
Haar, J.W. van der & R. Meijerhof, 1996. Verlaging stikstofaanvoer bij vleeskuikenouderdieren in opfokperiode (in Dutch). PP-report 43. Praktijkonderzoek Pluimveehouderij, Beekbergen, the Netherlands.
Hendrix Poultry, 2005. www.hendrix-poultry.nl.
Jongbloed, A.W. & P.A. Kemme, 2002. Oriëntatie omtrent de gehalten aan stikstof, fosfor en kalium in landbouwhuisdieren (in Dutch). Report 2178. ID-Lelystad, Lelystad, the Netherlands.
Jongbloed, A.W. & P.A. Kemme, 2005. De uitscheiding van stikstof en fosfor door varkens, kippen, kalkoenen, pelsdieren, eenden, konijnen en parelhoeders in 2002 en 2006 (in Dutch). Nutrition and Food report 05/I01077, 101 pp. Animal Sciences Group, Lelystad, the Netherlands.
KWIN-V, 1994-2005. Kwantitatieve Informatie Veehouderij 1994-2005 (in Dutch). Praktijkonderzoek Rundvee, Schapen en Paarden (PR), Lelystad, the Netherlands.
LNV, 2004. www.hetlnvloket.nl/pls/portal30/docs/FOLDER/LNV_LOKET_US/LNV_FRONTEND_PUB LIEK/BHF/MINAS/DEF.%20TABELLENBROCHURE%202004.PDF.
Managementgids Isabrown, 2004. Isacom B.V., Boekel, the Netherlands.
Middelkoop, J.H. van, 2000. Personal communication.
Niekerk, Th.G.C.M. van & B.F.J. Reuvekamp, 1994. Mestdroging en NH3-emissie (opfok)leghennen (in Dutch). PP-report 22. Praktijkonderzoek Pluimveehouderij, Beekbergen, the Netherlands.
Niekerk, Th.G.C.M. van & B.F.J. Reuvekamp, 1995a. Toepassing van fytase bij (opfok)leghennen (in Dutch). PP-report 37. Praktijkonderzoek Pluimveehouderij, Beekbergen, the Netherlands.
Niekerk, Th.G.C.M. van & B.F.J. Reuvekamp, 1995b. Expanderen van voer bij (opfok)leghennen op batterijen (in Dutch). PP-report 38. Praktijkonderzoek Pluimveehouderij, Beekbergen, the Netherlands.

Methodology for estimating emissions from agriculture in the Netherlands - Update 2019 | 165
Niekerk, Th.G.C.M. van & B.F.J. Reuvekamp, 1997. Alternatieve huisvesting leghennen (in Dutch). PP-report 57. Praktijkonderzoek Pluimveehouderij, Beekbergen, the Netherlands.
Productschap Pluimvee en Eieren, 1999. Cijferinfo Pluimveesector, Publicatie 99/11 (in Dutch).
Reuvekamp, B., 2004. Personal communications.
Ross, 2004. Vleeskuikenouderdieren Management Gids 1999 (in Dutch).
Tamminga, S., A.W. Jongbloed, M.M. van Eerdt, H.F.M. Aarts, F. Mandersloot, N.J.P. Hoogervorst & H. Westhoek, 2000. De forfaitaire excretie van stikstof door landbouwhuisdieren (in Dutch). Report 00-2040, 71 pp. ID-DLO, Lelystad, the Netherlands.
Veldkamp, T., 1996. Ammoniakemissie bij het traditionele houderijsysteem voor vleeskalkoenen (volledig strooiselvloer) (in Dutch). PP-report 50. Praktijkonderzoek Pluimveehouderij, Beekbergen, the Netherlands.
Veldkamp, T., A.L.J. Gielkens, J.G.M.J. Bosch & J. van Rooijen, 1999. Oriënterend onderzoek naar de relatie tussen dunne mest en locomotiestoornissen bij vleeskalkoenen (in Dutch). PP-report 85. Praktijkonderzoek Pluimveehouderij, Beekbergen, the Netherlands.
Veldkamp, T., 2008. Personal communication.
Vermeij, I., 2005. Personal communication.
Versteegh, H.A.J. & A.W. Jongbloed, 2000. De hoeveelheid droge stof, as, stikstof, calcium, magnesium, fosfor, natrium, kalium, koper, zink en ijzer in eieren en in vleeskuikenouderdieren op twee leeftijden (in Dutch). Report 99.059. ID-DLO, Lelystad, the Netherlands.
WUM, 1994. Uniformering berekening mest- en mineralencijfers; standaardcijfers pluimvee, 1990-1992 (in Dutch). Working group on Uniformity of calculations of Manure and mineral data (WUM).
WUM, 2002. Dierlijke mest en mineralen 2002 (in Dutch). www.cbs.nl/nl/publicaties/artikelen/milieu-enbodemgebruik/milieu/mest/2002/dierlijke-mest-mineralen-2002-03.htm (author C. van Bruggen)

Methodology for estimating emissions from agriculture in the Netherlands - Update 2019 | 167
Annex 4 Mineralization and immobilization of nitrogen in manure
Translation of the annex from G.L. Velthof in Velthof et al., 2009. Part of the organic matter in manure is easily degradable and will already be broken down in the animal house or storage. During this process, CH4 and CO2 and depending on the composition of the manure, also NH4+ are formed (mineralization). In manure containing straw (high C/N ratio) part of the NH4+ will be fixed (immobilized) as organic N. The method to calculate NH3 emission described in this report is based on TAN. As a result, changes in TAN during the storage of manure have to be taken into account. In the literature, only little data is available on mineralization and immobilization of ammonium in manure storages. This is mainly because these processes are hard to determine through a balance method in manure from which also NH3 is emitted. Another possibility to determine mineralization is the use of 15N labelled N, that is added to the ration of the animal or the manure. In an incubation study of Sommer et al. (2007) the N mineralization was low at 10 °C, for both cattle and pig slurry. The manure has been collected fresh and was stored frozen, until the start of the incubation study. The mineralization increased strongly at increasing temperature. About 80% of the organic N was mineralized at 15-20 °C for 100-200 days. Mineralization was higher in pig manure than in cattle manure. In an incubation study of Sørensen et al. (2003), mineralization of 9-50% of the organic N in cattle slurry was found. The fresh manure was incubated at 8 °C for 16 weeks first, and then for 4 weeks at 15 °C. Processing of data from an incubation study of Velthof et al. (2005) shows that the N mineralization of organic N of pig slurry at high temperature (90 days at 35 °C) was on average 15%, with a variation of -11 to +30% (depending of the ration). The manure was collected fresh and stored frozen, until the start of the incubation study. In an incubation study with pig manure to which 15N labelled urea was added (Beline et al., 1998) the N mineralization was 19% of the organic N during 84 days at 20 °C. The manure was collected from a farm and thus been stored for a while (it is not clear how long the storage period was). In models used in England and Germany for calculation of ammonia emissions on the national scale the N mineralization is set to 10% of the organic N (with reference to the research of Beline et al., 1998). In the models used by Denmark and Switzerland, mineralization is not (yet) taken into account. In the methodology described in this report, it is assumed that 10% of the organic N in slurry stored in the animal house mineralizes. This might be a conservative assumption. Given the uncertainties only mineralization in the animal houses is calculated and not in the outside storage. Also in the outside storage mineralization can occur, but this is possibly lower since the easily degradable organic N will mineralize quickly after excretion in the animal house. For solid manure except poultry manure, 25% immobilization is assumed. In poultry manure, both solid and slurry, and slurry manure of other animals (rabbits and fur-bearing animals) no mineralization or immobilization takes place. It is recommended to conduct further research into (net) mineralization in cattle and pig slurry, since this has an effect on calculated NH3 emissions from the animal house, manure storage and manure application.

168 | WOt-technical report 148
References
Beline, F., J. Martinez, C. Marol & G. Guiraud, 1998. Nitrogen transformations during anaerobically stored 15N-labeled pig slurry. Bioresource Technology 64, p. 83-88.
Sommer, S.G., S.O. Petersen, P. Sørensen, H.D. Poulsen & H.B. Møller, 2007. Methane and carbon dioxide emissions and nitrogen turnover during liquid manure storage. Nutrient Cycling in Agroecosystems 78, p. 27–36.
Sørensen, P., M. R. Weisbjerg & P. Lund, 2003. Dietary effects on the composition and plant utilization of nitrogen in dairy cattle manure. Journal of Agricultural Science 141, p. 79–91.
Velthof, G.L., J.A. Nelemans, O. Oenema & P.J. Kuikman, 2005. Gaseous nitrogen and carbon losses from pig manure derived from different diets. Journal of Environmental Quality 34, p. 698 – 706.
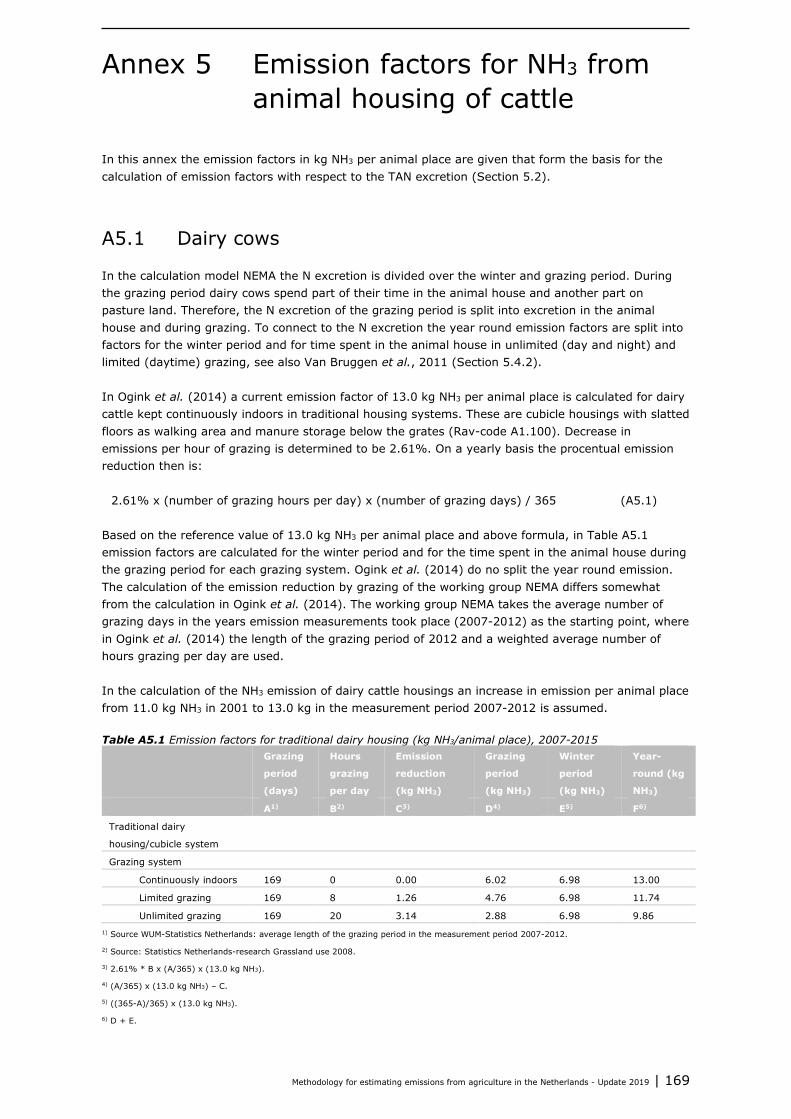
Methodology for estimating emissions from agriculture in the Netherlands - Update 2019 | 169
Annex 5 Emission factors for NH3 from animal housing of cattle
In this annex the emission factors in kg NH3 per animal place are given that form the basis for the calculation of emission factors with respect to the TAN excretion (Section 5.2).
A5.1 Dairy cows
In the calculation model NEMA the N excretion is divided over the winter and grazing period. During the grazing period dairy cows spend part of their time in the animal house and another part on pasture land. Therefore, the N excretion of the grazing period is split into excretion in the animal house and during grazing. To connect to the N excretion the year round emission factors are split into factors for the winter period and for time spent in the animal house in unlimited (day and night) and limited (daytime) grazing, see also Van Bruggen et al., 2011 (Section 5.4.2). In Ogink et al. (2014) a current emission factor of 13.0 kg NH3 per animal place is calculated for dairy cattle kept continuously indoors in traditional housing systems. These are cubicle housings with slatted floors as walking area and manure storage below the grates (Rav-code A1.100). Decrease in emissions per hour of grazing is determined to be 2.61%. On a yearly basis the procentual emission reduction then is:
2.61% x (number of grazing hours per day) x (number of grazing days) / 365 (A5.1) Based on the reference value of 13.0 kg NH3 per animal place and above formula, in Table A5.1 emission factors are calculated for the winter period and for the time spent in the animal house during the grazing period for each grazing system. Ogink et al. (2014) do no split the year round emission. The calculation of the emission reduction by grazing of the working group NEMA differs somewhat from the calculation in Ogink et al. (2014). The working group NEMA takes the average number of grazing days in the years emission measurements took place (2007-2012) as the starting point, where in Ogink et al. (2014) the length of the grazing period of 2012 and a weighted average number of hours grazing per day are used. In the calculation of the NH3 emission of dairy cattle housings an increase in emission per animal place from 11.0 kg NH3 in 2001 to 13.0 kg in the measurement period 2007-2012 is assumed. Table A5.1 Emission factors for traditional dairy housing (kg NH3/animal place), 2007-2015
Grazing
period
(days)
Hours
grazing
per day
Emission
reduction
(kg NH3)
Grazing
period
(kg NH3)
Winter
period
(kg NH3)
Year-
round (kg
NH3)
A1) B2) C3) D4) E5) F6)
Traditional dairy
housing/cubicle system
Grazing system
Continuously indoors 169 0 0.00 6.02 6.98 13.00
Limited grazing 169 8 1.26 4.76 6.98 11.74
Unlimited grazing 169 20 3.14 2.88 6.98 9.86 1) Source WUM-Statistics Netherlands: average length of the grazing period in the measurement period 2007-2012.
2) Source: Statistics Netherlands-research Grassland use 2008.
3) 2.61% * B x (A/365) x (13.0 kg NH3).
4) (A/365) x (13.0 kg NH3) – C.
5) ((365-A)/365) x (13.0 kg NH3).
6) D + E.

170 | WOt-technical report 148
For the emission year 2016 the hours grazing per day were reconsidered, limited grazing was set to 7 hours and unlimited grazing to 19 hours leading to year-round emission factors of 11.90 and 10.01 kg NH3/animal for limited and unlimited grazing respectively. The emission factors for low emission housing systems (low emission techniques in a traditional housing setup) are adjusted based on the proportion between the new and old factor for traditional housing according to Ogink et al. (2014). In continuously indoors this means multiplication with factor 13.0/11.0 and in limited grazing multiplication with factor 11.74/9.5. The average emission factor for low emission cubicle housing is derived from information in environmental permits (Van Bruggen et al., 2011 p. 25 and Van Bruggen et al., 2013 annex 1). The new year round emission factor for low emission housing with limited grazing then becomes: (11.74/9.5) x 7.5 = 9.27 and for continuously indoors: (13.0/11.0) x 8.8 = 10.40. In Van Bruggen et al. (2011) the year round emission factor is divided over winter and grazing period based on the proportion between winter and grazing period in traditional housing with limited grazing. This means that in low emission cubicle housing 5.5 kg NH3 is emitted during the winter period: (6.98/11.74) x 9.27. For low emission cubicle housing with unlimited grazing no year round emission can be calculated based on environmental permits and is therefore not considered. In Table A5.2 an overview is given of the emission factors for low emission housing of dairy cattle. Compared to Van Bruggen et al. (2014) the emission factor of tie-stall housing has also been adjusted in the way proposed by Ogink et al. (2014): 4.3 x (13.0/11.0). Table A5.2 Emission factors for low emission dairy housing (kg NH3/animal place), 2011-2014
Winter period (kg NH3) Grazing period(kg NH3) Year-round (kg NH3)
Low emission cubicle housing
Grazing system
continuously indoors 5.51 4.89 10.40
limited grazing 5.51 3.76 9.27
Tie-stall with slurry 3.02 2.06 5.08
For the emission years 2015, 2016 and 2017, information from the Agricultural census on low emission cubicle housing was available. With continuously indoors year-round emission was 10.02, 9.22 respectively 9.18 kg NH3/animal and limited grazing was calculated to be 9.05 for 2015 and 8.44 kg NH3/animal in 2016 and 2017. The emission factors in Tables A5.1 and A5.2 are converted into emission factors in percentage of the TAN excretion in the winter and grazing periods using the method described in section 5.2.
A5.2 Other cattle excluding veal calves
Ogink et al. (2014) propose to calculate NH3 emission factors per animal place for other cattle categories with the formula:
(TAN excretion in the animal house of livestock category)/(TAN excretion in the animal house dairy cattle) x 13.0 (A5.2)
This therefore means that the emission factor for traditional housing compared to the TAN excretion for all cattle categories is equal. In NEMA emission factors are calculated compared to the TAN excretion including 10% mineralization of organic N. Ogink et al. (2014) however do not consider the 10% mineralization of organic N and as a result emission factors calculated with above formula differ somewhat because the percentage organic N differs between cattle categories. To prevent these differences the calculation in Ogink et al. (2014) is applied on TAN excretion including 10% mineralization of organic N. In the calculation of the NH3 emission of dairy cattle housings an increase in emission per animal place from 11.0 kg NH3 in 2001 to 13.0 kg in the measurement period 2007-2012 is assumed. By relating
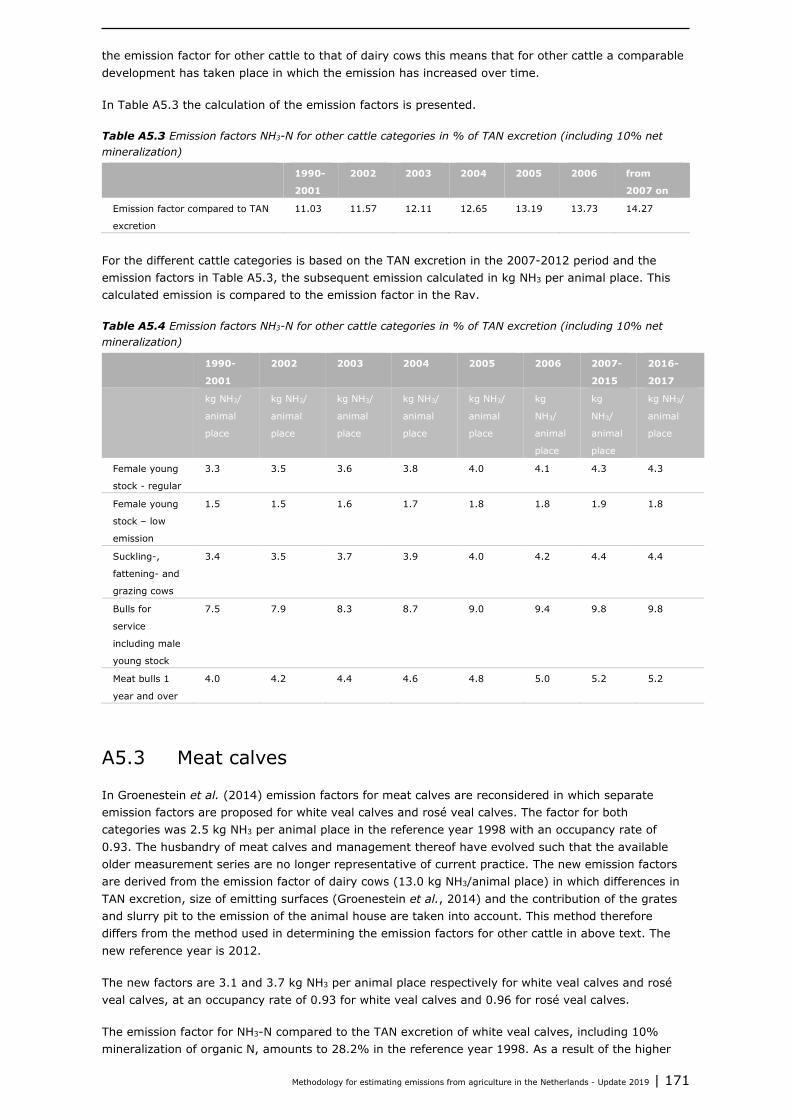
Methodology for estimating emissions from agriculture in the Netherlands - Update 2019 | 171
the emission factor for other cattle to that of dairy cows this means that for other cattle a comparable development has taken place in which the emission has increased over time. In Table A5.3 the calculation of the emission factors is presented. Table A5.3 Emission factors NH3-N for other cattle categories in % of TAN excretion (including 10% net mineralization)
1990-
2001
2002 2003 2004 2005 2006 from
2007 on
Emission factor compared to TAN
excretion
11.03 11.57 12.11 12.65 13.19 13.73 14.27
For the different cattle categories is based on the TAN excretion in the 2007-2012 period and the emission factors in Table A5.3, the subsequent emission calculated in kg NH3 per animal place. This calculated emission is compared to the emission factor in the Rav. Table A5.4 Emission factors NH3-N for other cattle categories in % of TAN excretion (including 10% net mineralization)
1990-
2001
2002 2003 2004 2005 2006 2007-
2015
2016-
2017
kg NH3/
animal
place
kg NH3/
animal
place
kg NH3/
animal
place
kg NH3/
animal
place
kg NH3/
animal
place
kg
NH3/
animal
place
kg
NH3/
animal
place
kg NH3/
animal
place
Female young
stock - regular
3.3 3.5 3.6 3.8 4.0 4.1 4.3 4.3
Female young
stock – low
emission
1.5 1.5 1.6 1.7 1.8 1.8 1.9 1.8
Suckling-,
fattening- and
grazing cows
3.4 3.5 3.7 3.9 4.0 4.2 4.4 4.4
Bulls for
service
including male
young stock
7.5 7.9 8.3 8.7 9.0 9.4 9.8 9.8
Meat bulls 1
year and over
4.0 4.2 4.4 4.6 4.8 5.0 5.2 5.2
A5.3 Meat calves
In Groenestein et al. (2014) emission factors for meat calves are reconsidered in which separate emission factors are proposed for white veal calves and rosé veal calves. The factor for both categories was 2.5 kg NH3 per animal place in the reference year 1998 with an occupancy rate of 0.93. The husbandry of meat calves and management thereof have evolved such that the available older measurement series are no longer representative of current practice. The new emission factors are derived from the emission factor of dairy cows (13.0 kg NH3/animal place) in which differences in TAN excretion, size of emitting surfaces (Groenestein et al., 2014) and the contribution of the grates and slurry pit to the emission of the animal house are taken into account. This method therefore differs from the method used in determining the emission factors for other cattle in above text. The new reference year is 2012. The new factors are 3.1 and 3.7 kg NH3 per animal place respectively for white veal calves and rosé veal calves, at an occupancy rate of 0.93 for white veal calves and 0.96 for rosé veal calves. The emission factor for NH3-N compared to the TAN excretion of white veal calves, including 10% mineralization of organic N, amounts to 28.2% in the reference year 1998. As a result of the higher

172 | WOt-technical report 148
TAN excretion in the new reference year 2012 belonging to the new emission factor per animal place the emission factor increases to 28.6%. For rosé veal calves the emission factor compared to the TAN excretion, including 10% mineralization of organic N, is 13.2% in the reference year 1998. The revised emission of 3.7 kg NH3 per animal place yields an emission factor of 22.9% compared to the TAN excretion in the reference year 2012. Between 1998 and 2012 the emission factor is gradually increased through interpolation. The occupancy rate is increased from 0.93 to 0.96. Since between the reference years 1998 and 2012 a gradual change in management took place, the emission factor is being interpolated. For meat calves two different methods for interpolation between 1998 and 2012 are possible: interpolation of the proposed Rav factor or interpolation of the emission factor compared to the TAN excretion. Interpolation of the proposed Rav factor means for white veal calves a gradual increase from 2.5 kg NH3 to 3.1 kg NH3 and for rosé veal calves an increase from 2.5 to 3.7 kg NH3 per animal place. In the second method of interpolation the emission factor compared to the TAN excretion is gradually adjusted. For white veal calves this means the emission factor increases from 28.2 to 28.6% and for rosé veal calves a gradual increase from 13.2 to 22.9%. Choice was made to interpolate the emission factor on the basis of net TAN excretion. With interpolation of the proposed Rav factor yearly fluctuations in the emission factor compared to the TAN excretion would occur, because TAN excretion also have yearly fluctuations. The latter is not logical since one would expect the emission factor compared to the TAN excretion to be constant or gradually changing because of changing management, but not to fluctuate yearly. The emission factor for low emission housing was previously established to be 0.60 kg NH3 per animal place based on the shares of various types of air scrubbers in the environmental permits of provinces. This meant an average emission reduction of 76% compared to the regular emission factor of 2.5 kg NH3 per animal place. With the same percentage reduction the emission factor for low emission housing in white veal calves becomes 0.24 x 3.1 = 0.74 kg NH3 per animal place and in rosé veal calves 0.24 x 3.7 = 0.89 kg NH3 per animal place. Based on information from the Agricultural census, emission factors of 0.47 for 2015, 0.34 for 2016 and 0.37 kg NH3/animal for 2017 were used for white veal calves. In rosé veal, emission factors were 0.56, 0.41 and 0.44 kg NH3/animal for 2015, 2016 and 2017, respectively.
A5.4 References
Bruggen, C. van, C.M. Groenestein, B.J. de Haan, M.W. Hoogeveen, J.F.M. Huijsmans. S.M. van der Sluis & G.L. Velthof, 2011. Ammoniakemissie uit dierlijke mest en kunstmest, 1990-2008. Berekeningen met het Nationaal Emissiemodel voor Ammoniak (NEMA) (in Dutch). WOt-Working Document 250. WOT Natuur & Milieu, Wageningen UR, Wageningen, the Netherlands.
Bruggen, C. van, C.M. Groenestein, B.J. de Haan, M.W. Hoogeveen, J.F.M. Huijsmans. S.M. van der Sluis & G.L. Velthof, 2013. Ammoniakemissie uit dierlijke mest en kunstmest in 2011. Berekeningen met het Nationaal Emissiemodel voor Ammoniak (NEMA) (in Dutch). WOt-Working Document 330. WOT Natuur & Milieu, Wageningen UR, Wageningen, the Netherlands.
Bruggen, C. van, A. Bannink, C.M. Groenestein, B.J. de Haan, J.F.M. Huijsmans, H.H. Luesink, S.M. van der Sluis, G.L. Velthof & J. Vonk, 2014. Emissies naar lucht uit de landbouw in 2012. Berekeningen van ammoniak, stikstofoxide, lachgas, methaan en fijn stof met het model NEMA (in Dutch). WOt-technical report 3. WOT Natuur & Milieu, Wageningen UR, Wageningen, the Netherlands.
Groenestein, C.M., S. Bokma & N.W.M. Ogink, 2014. Actualisering ammoniakemissiefactoren vleeskalveren tot circa 8 maanden. Advies voor aanpassing in de Regeling ammoniak en veehouderij (in Dutch). Report 778. Wageningen UR Livestock Research, Lelystad, the Netherlands.
Ogink, N.W.M., C.M. Groenestein & J. Mosquera, 2014. Actualisering ammoniakemissiefactoren rundvee: advies voor aanpassing in de Regeling ammoniak en veehouderij (in Dutch). Report 744. Wageningen UR Livestock Research, Lelystad, the Netherlands.
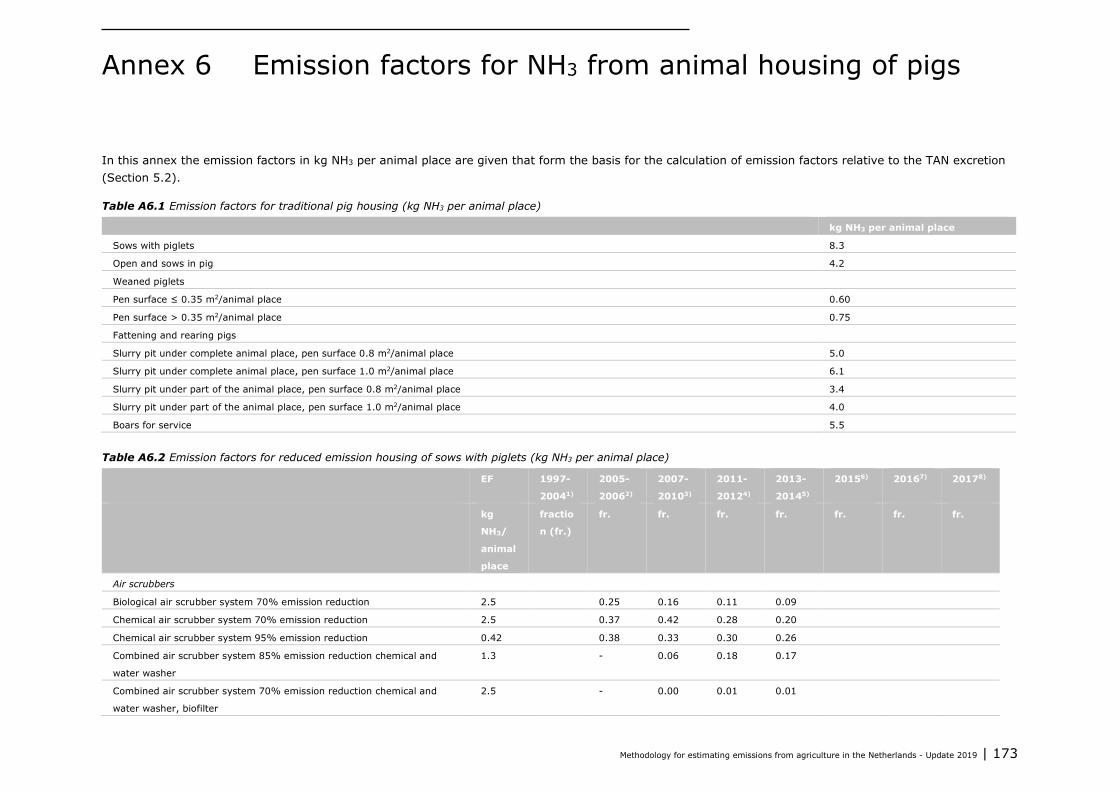
Methodology for estimating emissions from agriculture in the Netherlands - Update 2019 | 173
Annex 6 Emission factors for NH3 from animal housing of pigs
In this annex the emission factors in kg NH3 per animal place are given that form the basis for the calculation of emission factors relative to the TAN excretion (Section 5.2). Table A6.1 Emission factors for traditional pig housing (kg NH3 per animal place)
kg NH3 per animal place
Sows with piglets 8.3
Open and sows in pig 4.2
Weaned piglets
Pen surface ≤ 0.35 m2/animal place 0.60
Pen surface > 0.35 m2/animal place 0.75
Fattening and rearing pigs
Slurry pit under complete animal place, pen surface 0.8 m2/animal place 5.0
Slurry pit under complete animal place, pen surface 1.0 m2/animal place 6.1
Slurry pit under part of the animal place, pen surface 0.8 m2/animal place 3.4
Slurry pit under part of the animal place, pen surface 1.0 m2/animal place 4.0
Boars for service 5.5
Table A6.2 Emission factors for reduced emission housing of sows with piglets (kg NH3 per animal place)
EF 1997-
20041)
2005-
20062)
2007-
20103)
2011-
20124)
2013-
20145)
20156) 20167) 20178)
kg
NH3/
animal
place
fractio
n (fr.)
fr. fr. fr. fr. fr. fr. fr.
Air scrubbers
Biological air scrubber system 70% emission reduction 2.5 0.25 0.16 0.11 0.09
Chemical air scrubber system 70% emission reduction 2.5 0.37 0.42 0.28 0.20
Chemical air scrubber system 95% emission reduction 0.42 0.38 0.33 0.30 0.26
Combined air scrubber system 85% emission reduction chemical and
water washer
1.3 - 0.06 0.18 0.17
Combined air scrubber system 70% emission reduction chemical and
water washer, biofilter
2.5 - 0.00 0.01 0.01
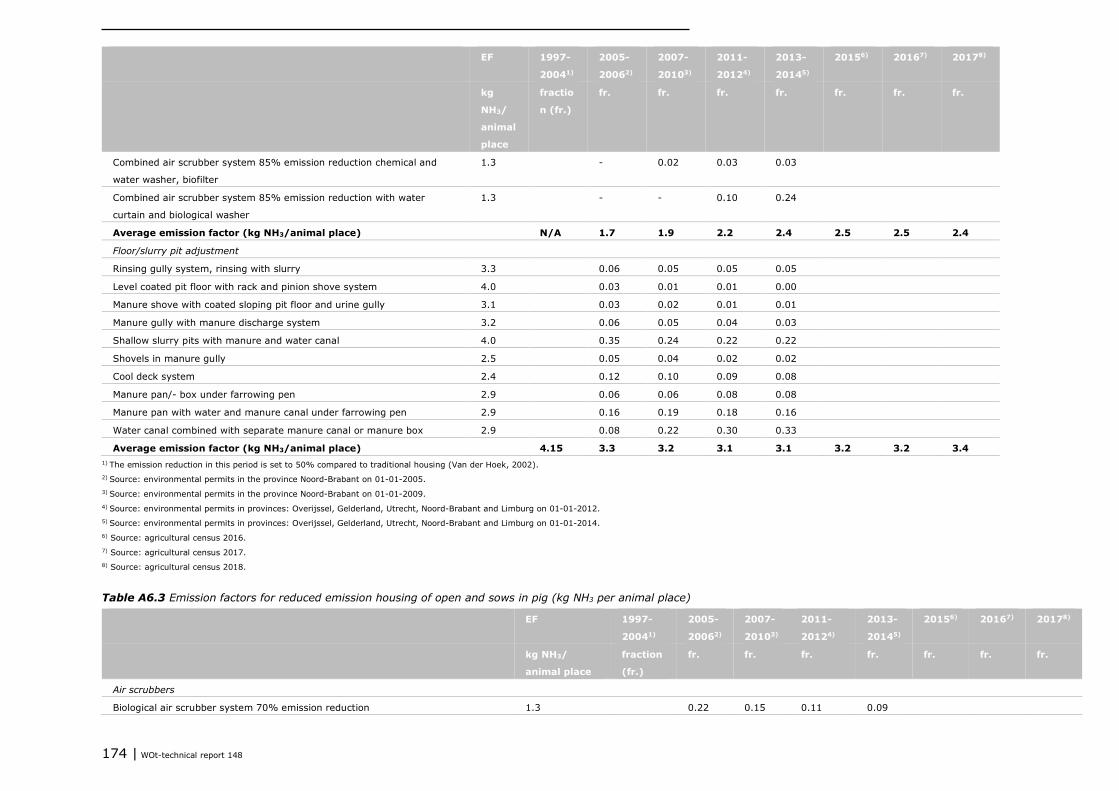
174 | WOt-technical report 148
EF 1997-
20041)
2005-
20062)
2007-
20103)
2011-
20124)
2013-
20145)
20156) 20167) 20178)
kg
NH3/
animal
place
fractio
n (fr.)
fr. fr. fr. fr. fr. fr. fr.
Combined air scrubber system 85% emission reduction chemical and
water washer, biofilter
1.3 - 0.02 0.03 0.03
Combined air scrubber system 85% emission reduction with water
curtain and biological washer
1.3 - - 0.10 0.24
Average emission factor (kg NH3/animal place) N/A 1.7 1.9 2.2 2.4 2.5 2.5 2.4
Floor/slurry pit adjustment
Rinsing gully system, rinsing with slurry 3.3 0.06 0.05 0.05 0.05
Level coated pit floor with rack and pinion shove system 4.0 0.03 0.01 0.01 0.00
Manure shove with coated sloping pit floor and urine gully 3.1 0.03 0.02 0.01 0.01
Manure gully with manure discharge system 3.2 0.06 0.05 0.04 0.03
Shallow slurry pits with manure and water canal 4.0 0.35 0.24 0.22 0.22
Shovels in manure gully 2.5 0.05 0.04 0.02 0.02
Cool deck system 2.4 0.12 0.10 0.09 0.08
Manure pan/- box under farrowing pen 2.9 0.06 0.06 0.08 0.08
Manure pan with water and manure canal under farrowing pen 2.9 0.16 0.19 0.18 0.16
Water canal combined with separate manure canal or manure box 2.9 0.08 0.22 0.30 0.33
Average emission factor (kg NH3/animal place) 4.15 3.3 3.2 3.1 3.1 3.2 3.2 3.4 1) The emission reduction in this period is set to 50% compared to traditional housing (Van der Hoek, 2002). 2) Source: environmental permits in the province Noord-Brabant on 01-01-2005. 3) Source: environmental permits in the province Noord-Brabant on 01-01-2009. 4) Source: environmental permits in provinces: Overijssel, Gelderland, Utrecht, Noord-Brabant and Limburg on 01-01-2012. 5) Source: environmental permits in provinces: Overijssel, Gelderland, Utrecht, Noord-Brabant and Limburg on 01-01-2014. 6) Source: agricultural census 2016. 7) Source: agricultural census 2017. 8) Source: agricultural census 2018.
Table A6.3 Emission factors for reduced emission housing of open and sows in pig (kg NH3 per animal place)
EF 1997-
20041)
2005-
20062)
2007-
20103)
2011-
20124)
2013-
20145)
20156) 20167) 20178)
kg NH3/
animal place
fraction
(fr.)
fr. fr. fr. fr. fr. fr. fr.
Air scrubbers
Biological air scrubber system 70% emission reduction 1.3 0.22 0.15 0.11 0.09

Methodology for estimating emissions from agriculture in the Netherlands - Update 2019 | 175
EF 1997-
20041)
2005-
20062)
2007-
20103)
2011-
20124)
2013-
20145)
20156) 20167) 20178)
kg NH3/
animal place
fraction
(fr.)
fr. fr. fr. fr. fr. fr. fr.
Chemical air scrubber system 70% emission reduction 1.3 0.42 0.45 0.29 0.22
Chemical air scrubber system 95% emission reduction 0.21 0.38 0.33 0.31 0.29
Combined air scrubber system 85% emission reduction chemical and water washer 0.63 - 0.05 0.13 0.12
Combined air scrubber system 70% emission reduction with water washer,
chemical washer and biofilter
1.3 - - 0.01 0.01
Combined air scrubber system 85% emission reduction chemical and water
washer, biofilter
0.63 - 0.01 0.03 0.03
Combined air scrubber system 85% emission reduction water curtain and
biological washer
0.63 - 0.00 0.11 0.23
Average emission factor (kg NH3/animal place) N/A 0.90 1.00 1.10 1.10 1.20 1.20 1.20
Floor/slurry pit adjustment
Narrow shallow manure canals with metal three sided grates and sewerage
(individual housing)
2.4 0.28 0.24 0.25 -
Manure gully with combined grates and frequent manure disposal (individual
housing)
1.8 0.06 0.05 0.04 -
Rinsing gully system with slurry (individual and group) 2.5 0.14 0.09 0.09 0.12
Shovels in manure gully (individual housing) 2.2 0.02 0.01 0.01 -
Cool deck system 115% cooling surface (individual and group) 2.2 0.12 0.08 0.07 0.10
Cool deck system 135% cooling surface (individual and group) 2.2 0.12 0.14 0.11 0.15
Group housing with feeding cubicles or feeding stations, without straw bed, tilting
pit walls, metal three sided grate
2.3 0.12 0.20 0.17 0.22
Group housing with feeding cubicles or feeding stations, without straw bed, tilting
pit walls, other material grate
2.5 0.02 0.06 0.12
Walk about housing with sow feeding station and straw bed (group) 2.6 0.14 0.15 0.20 0.28
Average emission factor (kg NH3/animal place) 2.1 2.3 2.3 2.4 2.4 2.6 2.4 2.4 1) The emission reduction in this period is set to 50% compared to traditional housing (Van der Hoek, 2002). 2) Source: environmental permits in province Noord-Brabant on 01-01-2005. 3) Source: environmental permits in province Noord-Brabant on 01-01-2009. 4) Source: environmental permits in provinces: Overijssel, Gelderland, Utrecht, Noord-Brabant and Limburg on 01-01-2012. 5) Source: environmental permits in provinces: Overijssel, Gelderland, Utrecht, Noord-Brabant and Limburg on 01-01-2014. 6) Source: agricultural census 2016. 7) Source: agricultural census 2017. 8) Source: agricultural census 2018.

176 | WOt-technical report 148
Table A6.4 Emission factors for reduced emission housing of weaned piglets (kg NH3 per animal place)
EF 1997-
20041)
2005-
20062)
2007-
20103)
2011-
20124)
2013-
20145)
20156) 20167) 20178)
kg NH3/
animal place
fraction
(fr.)
fr. fr. fr. fr. fr. fr.
Air scrubbers
Biological air scrubber system 70% emission reduction 0.18 0.23 0.14 0.10 0.08
Chemical air scrubber system 70% emission reduction 0.18 0.38 0.38 0.23 0.17
Chemical air scrubber system 95% emission reduction 0.03 0.39 0.39 0.28 0.22
Combined air scrubber system 85% emission reduction chemical and water washer 0.09 - 0.06 0.19 0.16
Combined air scrubber system 70% emission reduction with water washer, chemical
washer and biofilter
0.18 - 0.01 0.02 0.02
Combined air scrubber system 85% emission reduction with water washer, chemical
washer and biofilter
0.09 - 0.02 0.04 0.03
Combined air scrubber system 85% emission reduction water curtain and biological
washer
0.09 - 0.00 0.14 0.30
Various combinations of low emission built housing with air scrubbers ca. 0.03 - - 0.01 0.01
Average emission factor (kg NH3/animal place) N/A 0.12 0.13 0.15 0.18 0.18 0.18 0.18
Floor/slurry pit adjustment
Level coated pit floor with rack and pinion shove system 0.18 0.01 0.01 0.02 0.02
Rinsing gully system with slurry and partly slatted floor 0.21 0.07 0.05 0.03 0.03
Manure capture in water combined with a manure disposal system 0.13 0.40 0.46 0.50 0.50
Shallow slurry pits with water and manure channel of max. 0.13 m2 per animal place 0.26 0.09 0.07 0.08 0.08
Shallow slurry pits with water and manure channel of max. 0.19 m2 per animal place 0.33 0.01 0.00 0.01 0.01
Half grate with decreased manure surface 0.34 0.01 0.01 0.01 0.01
Manure collection in and rinsing with acidified liquid fully slatted floor 0.16 0.02 0.01 0.01 0.00
Manure collection in and rinsing with acidified liquid party slatted floor 0.22 0.01 0.00 0.00 0.00
Separated discharge manure and urine through tilting manure belt 0.20 0.01 0.00 0.00 0.00
Cool deck system (150% cooling surface) 0.15 0.12 0.09 0.08 0.09
Rearing pen with tilting pit wall max. 0.07 m2 emitting surface, regardless of group size 0.17 0.01 0.02 0.03 0.03
Rearing pen with tilting pit wall > 0.07 m2 < 0.10 m2 emitting surface, up to 30 piglets 0.21 0.01 0.02 0.04 0.07
Rearing pen with tilting pit wall > 0.35 m2 emitting surface > 0.07 m2 < 0.10 m2, from
30 piglets on
0.18 0.12 0.15 0.11 0.10
Fully slatted with water and manure canals eventually with tilted pit wall, emitting
surface < 0.10 m2
0.20 0.13 0.09 0.09 0.09
Average emission factor (kg NH3/animal place) 0.30 0.17 0.17 0.17 0.17 0.18 0.18 0.18 1) The emission reduction in this period is set to 50% compared to traditional housing (Van der Hoek, 2002). 2) Source: environmental permits in province Noord-Brabant on 01-01-2005.
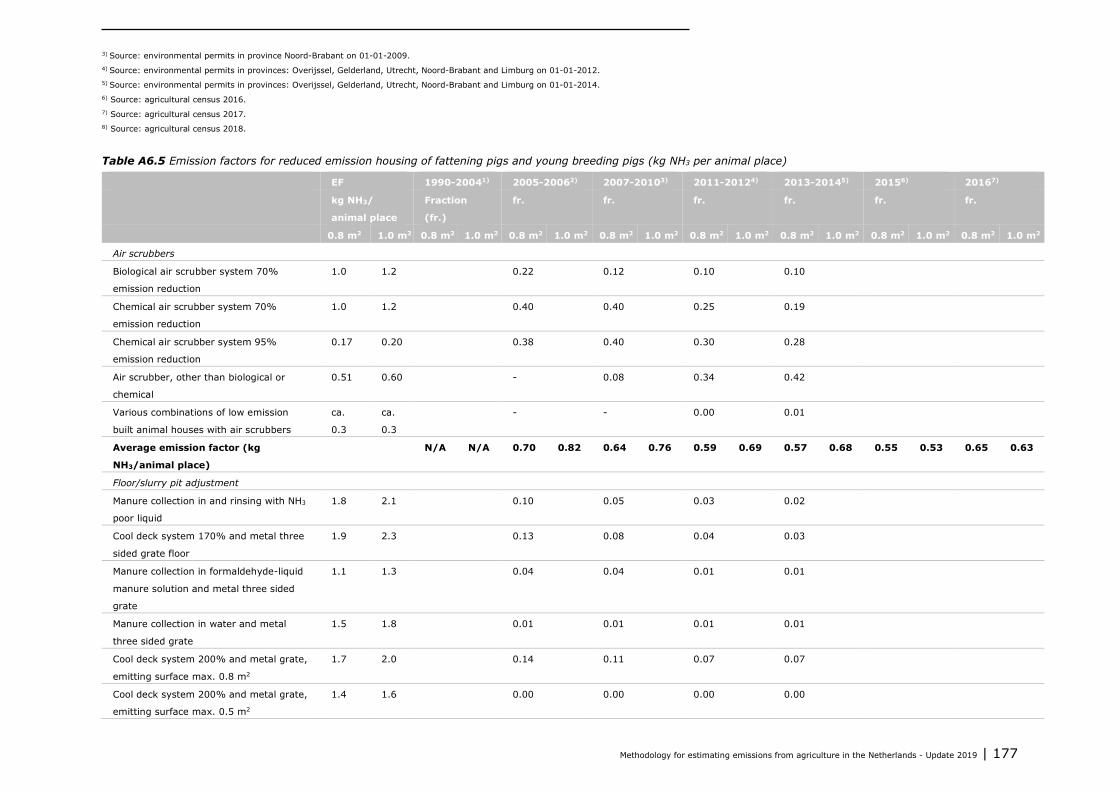
Methodology for estimating emissions from agriculture in the Netherlands - Update 2019 | 177
3) Source: environmental permits in province Noord-Brabant on 01-01-2009. 4) Source: environmental permits in provinces: Overijssel, Gelderland, Utrecht, Noord-Brabant and Limburg on 01-01-2012. 5) Source: environmental permits in provinces: Overijssel, Gelderland, Utrecht, Noord-Brabant and Limburg on 01-01-2014. 6) Source: agricultural census 2016. 7) Source: agricultural census 2017. 8) Source: agricultural census 2018. Table A6.5 Emission factors for reduced emission housing of fattening pigs and young breeding pigs (kg NH3 per animal place)
EF 1990-20041) 2005-20062) 2007-20103) 2011-20124) 2013-20145) 20156) 20167)
kg NH3/
animal place
Fraction
(fr.)
fr. fr. fr. fr. fr. fr.
0.8 m2 1.0 m2 0.8 m2 1.0 m2 0.8 m2 1.0 m2 0.8 m2 1.0 m2 0.8 m2 1.0 m2 0.8 m2 1.0 m2 0.8 m2 1.0 m2 0.8 m2 1.0 m2
Air scrubbers
Biological air scrubber system 70%
emission reduction
1.0 1.2 0.22 0.12 0.10 0.10
Chemical air scrubber system 70%
emission reduction
1.0 1.2 0.40 0.40 0.25 0.19
Chemical air scrubber system 95%
emission reduction
0.17 0.20 0.38 0.40 0.30 0.28
Air scrubber, other than biological or
chemical
0.51 0.60 - 0.08 0.34 0.42
Various combinations of low emission
built animal houses with air scrubbers
ca.
0.3
ca.
0.3
- - 0.00 0.01
Average emission factor (kg
NH3/animal place)
N/A N/A 0.70 0.82 0.64 0.76 0.59 0.69 0.57 0.68 0.55 0.53 0.65 0.63
Floor/slurry pit adjustment
Manure collection in and rinsing with NH3
poor liquid
1.8 2.1 0.10 0.05 0.03 0.02
Cool deck system 170% and metal three
sided grate floor
1.9 2.3 0.13 0.08 0.04 0.03
Manure collection in formaldehyde-liquid
manure solution and metal three sided
grate
1.1 1.3 0.04 0.04 0.01 0.01
Manure collection in water and metal
three sided grate
1.5 1.8 0.01 0.01 0.01 0.01
Cool deck system 200% and metal grate,
emitting surface max. 0.8 m2
1.7 2.0 0.14 0.11 0.07 0.07
Cool deck system 200% and metal grate,
emitting surface max. 0.5 m2
1.4 1.6 0.00 0.00 0.00 0.00

178 | WOt-technical report 148
EF 1990-20041) 2005-20062) 2007-20103) 2011-20124) 2013-20145) 20156) 20167)
kg NH3/
animal place
Fraction
(fr.)
fr. fr. fr. fr. fr. fr.
0.8 m2 1.0 m2 0.8 m2 1.0 m2 0.8 m2 1.0 m2 0.8 m2 1.0 m2 0.8 m2 1.0 m2 0.8 m2 1.0 m2 0.8 m2 1.0 m2 0.8 m2 1.0 m2
Cool deck system 200% and other than
metal grate, emitting surface max. 0.6 m2
1.8 2.1 0.04 0.05 0.04 0.03
Cool deck system 200% and other than
metal grate, 0.6 m2 < emitting surface <
0.8 m2
2.7 3.1 0.00 0.00 0.00 0.00
Water-manure channel, tilting pit wall,
metal three sided grate, emitting surface
max. 0.18 m2
1.2 1.2 0.20 0.17 0.24 0.24
Water-manure channel, tilting pit wall,
metal three sided grate, 0.18 m2 <
emitting surface < 0.27 m2
1.7 1.7 0.02 0.03 0.06 0.07
Water-manure channel, tilting pit wall,
grate other than metal, emitting surface
max. 0.18 m2
1.9 1.9 0.15 0.34 0.37 0.40
Water-manure channel, tilting pit wall,
grate other than metal, 0,18 m2 <
emitting surface < 0.27 m2
2.3 2.3 0.04 0.03 0.03 0.04
Spherical floor pen with concrete spill
grate and metal three sided grate
1.7 2.3 0.02 0.02 0.02 0.02
Pen with separate manure channels 2.1 2.1 0.01 0.01 0.01 0.01
Rinsing gully system with metal three
sided grates
1.4 1.6 0.03 0.02 0.02 0.02
Rinsing gully system with other than
three sided grates
2.0 2.3 0.07 0.06 0.04 0.04
Floating balls in the manure ca.
3.3
ca.
4.0
- - 0.00 0.01
Average emission factor (kg
NH3/animal place)
2.1 N/A 1.7 1.9 1.7 1.8 1.7 1.8 1.7 1.8 1.7 1.8 1.7 1.8
1) The emission reduction in this period is set to 50% compared to traditional housing (Van der Hoek, 2002). 2) Source: environmental permits in province Noord-Brabant on 01-01-2005. 3) Source: environmental permits in province Noord-Brabant on 01-01-2009. 4) Source: environmental permits in provinces: Overijssel, Gelderland, Utrecht, Noord-Brabant and Limburg on 01-01-2012. 5) Source: environmental permits in provinces: Overijssel, Gelderland, Utrecht, Noord-Brabant and Limburg on 01-01-2014. 6) Source: agricultural census 2016. 7) Source: agricultural census 2017. 8) Source: agricultural census 2018.

Methodology for estimating emissions from agriculture in the Netherlands - Update 2019 | 179
Table A6.6 Emission factors for reduced emission housing of boars (kg NH3 per animal place)
EF 1997-
20041)
2005-
20062)
2007-
20103)
2011-
20124)
2013-
20145)
20156) 20167) 20178)
kg NH3/
animal
place
Fraction
(fr.)
fr. fr. fr. fr. fr. fr. fr.
Air scrubbers
Biological air scrubber system 70% emission reduction 1.7 0.22 0.16 0.08 0.07
Chemical air scrubber system 70% emission reduction 1.7 0.47 0.50 0.48 0.27
Chemical air scrubber system 95% emission reduction 0.28 0.31 0.26 0.19 0.22
Combined air scrubber system 85% emission reduction chemical and water
washer
0.83 - 0.05 0.15 0.15
Combined air scrubber system 70% emission reduction with water washer,
chemical washer and biofilter
1.7 - 0.01 0.02 0.02
Combined air scrubber system 85% emission reduction with water washer,
chemical washer and biofilter
0.83 - 0.01 0.02 0.01
Combined air scrubber system 85% emission reduction water curtain and
biological washer
0.83 - - 0.06 0.26
Average emission factor (kg NH3/animal place) 1.65 1.3 1.4 1.6 1.6 1.6 1.6 1.6
Floor/slurry pit adjustment through floating balls in the manure 3.9 1) The emission reduction (air scrubber) in this period is set to 70% compared to traditional housing (Van der Hoek, 2002). 2) Source: environmental permits in province Noord-Brabant on 01-01-2005. 3) Source: environmental permits in province Noord-Brabant on 01-01-2009. 4) Source: environmental permits in provinces: Overijssel, Gelderland, Utrecht, Noord-Brabant and Limburg on 01-01-2012. 5) Source: environmental permits in provinces: Overijssel, Gelderland, Utrecht, Noord-Brabant and Limburg on 01-01-2014. 6) Source: agricultural census 2016. 7) Source: agricultural census 2017. 8) Source: agricultural census 2018.
References Hoek, K.W. van der, 2002. Uitgangspunten voor de mest- en ammoniakberekeningen 1999 tot en met 2001 zoals gebruikt in de Milieubalans 2001 en 2002, inclusief
datasets landbouwemissies 1980-2001 (in Dutch). RIVM report 773004013/2002. National Institute for Public Health and the Environment, Bilthoven, the Netherlands.


Methodology for estimating emissions from agriculture in the Netherlands - Update 2019 | 181
Annex 7 Emission factors for NH3 from animal housing of poultry
In this annex the emission factors in kg NH3 per animal place are given that form the basis for the calculation of emission factors relative to the TAN excretion (section 5.2).
A7.1 Laying hens younger than ca. 18 weeks
In Table A7.1 the housing systems are depicted according to the classification of the Agricultural census. For some systems that comprise of several subsystems an emission factor is derived using information in environmental permits. To the battery cage systems with slurry and manure belt also the compact battery is counted with an emission factor of 0.011 kg NH3/animal place. The share of this system in environmental permits is negligibly small with 0.1%. Table A7.1 (Derived) emission factors for laying hens under 18 weeks (kg NH3 per animal place)
1990-
20101)
2011-
20122)
2013-
20143)
20154) 20165) 20176)
kg NH3/
animal
place
kg NH3/
animal
place
kg
NH3/
animal
place
kg
NH3/
animal
place
kg
NH3/
animal
place
kg
NH3/
animal
place Battery cage with slurry
Open storage 0.045 0.045 0.045 0.045 0.045 0.045
Manure belt 0.020 0.020 0.020 0.020 0.020 0.020
Battery cage with solid manure
Manure belt, forced manure drying 0.2 m3/animal/hour
0.020 0.020 0.020 0.020 0.020 0.020
Manure belt, forced manure drying 0.4 m3/animal/hour
0.006 0.006 0.006 0.006 0.006 0.006
Manure belt, forced manure drying 0.4 m3/animal/hour with air scrubber
0.001 0.001 0.001 0.001 0.001 0.001
Other battery cage solid manure 0.020 0.020 0.020 0.016 0.016 0.016
Ground housing without manure aeration
0.170 0.170 0.170 0.170 0.170 0.170
Ground housing with air scrubber - - - 0.035 0.042 0.042
Aviary system
Aviary housing without forced manure drying
0.050 0.050 0.050 0.050 0.050 0.050
Aviary housing with forced manure drying
0.030 0.029 0.028 0.028 0.028 0.030
Ground/aviary housing with air scrubber 0.017 0.009 0.011 - - -
Other housing 0.139 0.157 0.094 0.106 0.108 0.109
1) Source: environmental permits in province Noord-Brabant on 1-1-2009.
2) Source: environmental permits in provinces: Overijssel, Gelderland, Utrecht, Noord-Brabant and Limburg on 01-01-2012.
3) Source: environmental permits in provinces: Overijssel, Gelderland, Utrecht, Noord-Brabant and Limburg on 01-01-2014.
4) Source: agricultural census 2016.
5) Source: agricultural census 2017.
6) Source: agricultural census 2018. It is not clear which systems have been filled in by businesses under 'other battery cage housing solid manure' in the Agricultural census of 2008. To the other battery cage systems with solid manure belong the channel animal house (E1.4) and the battery cage system with manure belt aeration and

182 | WOt-technical report 148
above laying drying tunnel (E1.6). Although it concerns over 7% of the animal places in the Agricultural census of 2008, systems mentioned hardly occur in the environmental permits. Possibly it concerns businesses with manure belt aeration with the aeration turned off but producing solid manure after all through after drying, and therefore have filled in battery cage housing with solid manure (Ellen, 2010). The emission factor of manure belt with forced manure drying 0.2 m3 per hour is applied as minimal value. The emission factor in the Rav applies to situations in which the manure is disposed of from the business immediately or stored for a maximum of two weeks in a covered container. In other cases an additional emission factor for post-processing techniques like after drying or other storage applies. The emission factor for the post-processing technique is to be added to the emission factor of the animal housing type. For rearing hens from the environmental permits an average additional emission factor for after drying of 0.005 kg NH3 is derived. Although in animals with ground housing in the Agricultural census in some cases a post-processing technique is applied, this is not accounted for. The Rav does not provide an additional emission factor for post-processing techniques in ground housing.
A7.2 Laying hens
In Table A7.2 the housing systems are depicted according to the classification of the Agricultural census. For some systems that consist of several subsystems an emission factor is derived using information in environmental permits.
It is assumed that the enriched cages and colony housing, both with manure belt aeration, have been filled in with battery cage housing with forced manure drying (0.7 m3/hour) by businesses. To the other battery cage systems with solid manure belong the canals animal house (E2.4 and the battery cage system with manure belt aeration and above lying drying tunnel (E2.6). These systems hardly occur. In other battery cage housing with solid manure it concerns most likely businesses with manure belt drying that have switched off the aeration. Possibly part of these businesses have after drying so that they produce solid manure after all (Ellen, 2010). For the share animals with housing type other battery cage solid manure the emission factor of manure belt with forced manure drying 0.042 m3 per hour is applied as minimal value.
In Table A7.2 also the emission factors for systems consisting of several variations are derived. Air scrubbers hardly occur and are not considered further. The emission factor in the Rav applies to situations in which the manure is disposed of immediately from the business or is stored for a period of at most two weeks in a covered container. In other cases an additional emission factor for post-processing techniques like after drying or other storage applies. The emission factor of the post-processing technique is to be added to the emission factor of the animal housing type. Based on information in environmental permits the average additional emission factor for after drying is 0.010 kg NH3 up to 2010 and for the years after 0.008 kg NH3 per animal place.
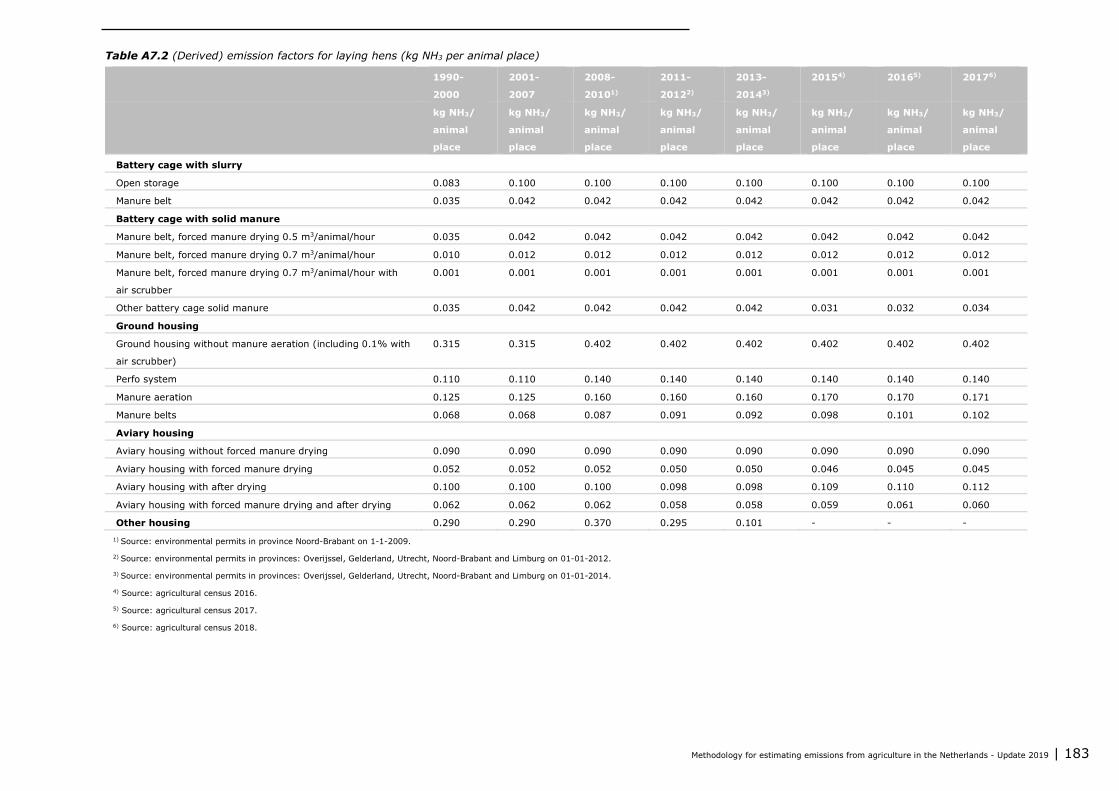
Methodology for estimating emissions from agriculture in the Netherlands - Update 2019 | 183
Table A7.2 (Derived) emission factors for laying hens (kg NH3 per animal place)
1990-
2000
2001-
2007
2008-
20101)
2011-
20122)
2013-
20143)
20154) 20165) 20176)
kg NH3/
animal
place
kg NH3/
animal
place
kg NH3/
animal
place
kg NH3/
animal
place
kg NH3/
animal
place
kg NH3/
animal
place
kg NH3/
animal
place
kg NH3/
animal
place
Battery cage with slurry
Open storage 0.083 0.100 0.100 0.100 0.100 0.100 0.100 0.100
Manure belt 0.035 0.042 0.042 0.042 0.042 0.042 0.042 0.042
Battery cage with solid manure
Manure belt, forced manure drying 0.5 m3/animal/hour 0.035 0.042 0.042 0.042 0.042 0.042 0.042 0.042
Manure belt, forced manure drying 0.7 m3/animal/hour 0.010 0.012 0.012 0.012 0.012 0.012 0.012 0.012
Manure belt, forced manure drying 0.7 m3/animal/hour with
air scrubber
0.001 0.001 0.001 0.001 0.001 0.001 0.001 0.001
Other battery cage solid manure 0.035 0.042 0.042 0.042 0.042 0.031 0.032 0.034
Ground housing
Ground housing without manure aeration (including 0.1% with
air scrubber)
0.315 0.315 0.402 0.402 0.402 0.402 0.402 0.402
Perfo system 0.110 0.110 0.140 0.140 0.140 0.140 0.140 0.140
Manure aeration 0.125 0.125 0.160 0.160 0.160 0.170 0.170 0.171
Manure belts 0.068 0.068 0.087 0.091 0.092 0.098 0.101 0.102
Aviary housing
Aviary housing without forced manure drying 0.090 0.090 0.090 0.090 0.090 0.090 0.090 0.090
Aviary housing with forced manure drying 0.052 0.052 0.052 0.050 0.050 0.046 0.045 0.045
Aviary housing with after drying 0.100 0.100 0.100 0.098 0.098 0.109 0.110 0.112
Aviary housing with forced manure drying and after drying 0.062 0.062 0.062 0.058 0.058 0.059 0.061 0.060
Other housing 0.290 0.290 0.370 0.295 0.101 - - - 1) Source: environmental permits in province Noord-Brabant on 1-1-2009.
2) Source: environmental permits in provinces: Overijssel, Gelderland, Utrecht, Noord-Brabant and Limburg on 01-01-2012.
3) Source: environmental permits in provinces: Overijssel, Gelderland, Utrecht, Noord-Brabant and Limburg on 01-01-2014.
4) Source: agricultural census 2016.
5) Source: agricultural census 2017.
6) Source: agricultural census 2018.
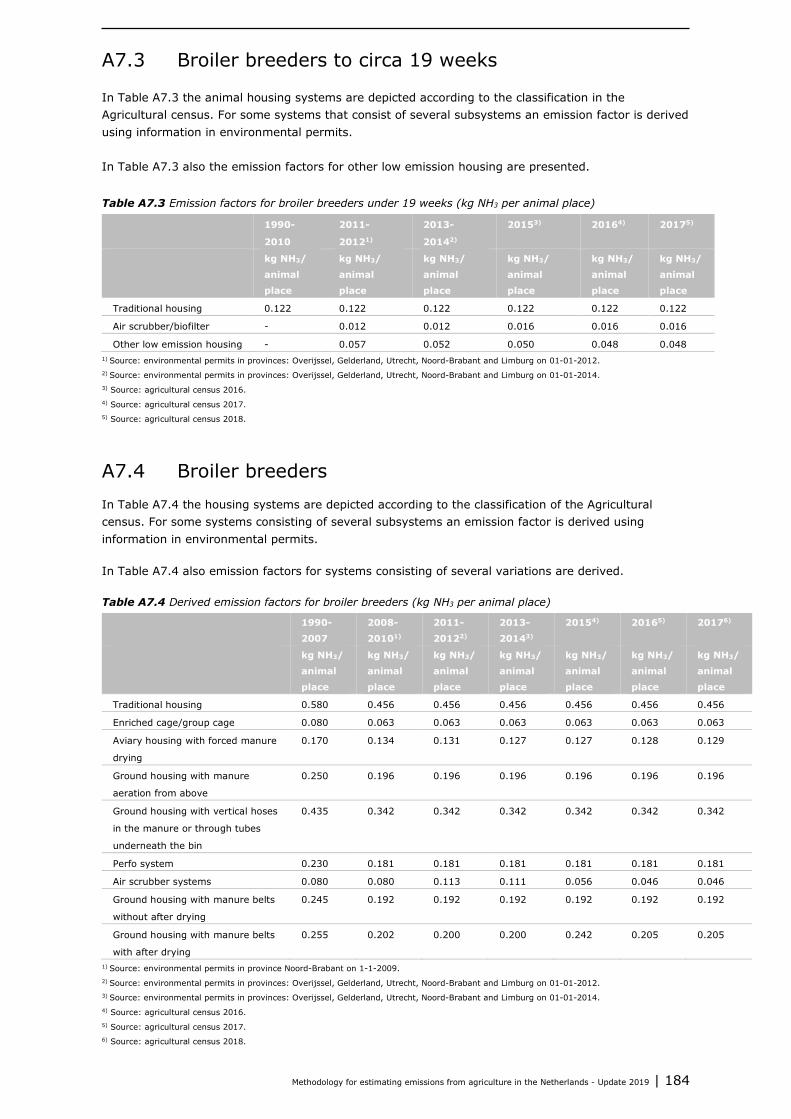
Methodology for estimating emissions from agriculture in the Netherlands - Update 2019 | 184
A7.3 Broiler breeders to circa 19 weeks
In Table A7.3 the animal housing systems are depicted according to the classification in the Agricultural census. For some systems that consist of several subsystems an emission factor is derived using information in environmental permits. In Table A7.3 also the emission factors for other low emission housing are presented.
Table A7.3 Emission factors for broiler breeders under 19 weeks (kg NH3 per animal place)
1990-
2010
2011-
20121)
2013-
20142)
20153) 20164) 20175)
kg NH3/
animal
place
kg NH3/
animal
place
kg NH3/
animal
place
kg NH3/
animal
place
kg NH3/
animal
place
kg NH3/
animal
place
Traditional housing 0.122 0.122 0.122 0.122 0.122 0.122
Air scrubber/biofilter - 0.012 0.012 0.016 0.016 0.016
Other low emission housing - 0.057 0.052 0.050 0.048 0.048 1) Source: environmental permits in provinces: Overijssel, Gelderland, Utrecht, Noord-Brabant and Limburg on 01-01-2012. 2) Source: environmental permits in provinces: Overijssel, Gelderland, Utrecht, Noord-Brabant and Limburg on 01-01-2014. 3) Source: agricultural census 2016. 4) Source: agricultural census 2017. 5) Source: agricultural census 2018.
A7.4 Broiler breeders In Table A7.4 the housing systems are depicted according to the classification of the Agricultural census. For some systems consisting of several subsystems an emission factor is derived using information in environmental permits. In Table A7.4 also emission factors for systems consisting of several variations are derived. Table A7.4 Derived emission factors for broiler breeders (kg NH3 per animal place)
1990-
2007
2008-
20101)
2011-
20122)
2013-
20143)
20154) 20165) 20176)
kg NH3/
animal
place
kg NH3/
animal
place
kg NH3/
animal
place
kg NH3/
animal
place
kg NH3/
animal
place
kg NH3/
animal
place
kg NH3/
animal
place
Traditional housing 0.580 0.456 0.456 0.456 0.456 0.456 0.456
Enriched cage/group cage 0.080 0.063 0.063 0.063 0.063 0.063 0.063
Aviary housing with forced manure
drying
0.170 0.134 0.131 0.127 0.127 0.128 0.129
Ground housing with manure
aeration from above
0.250 0.196 0.196 0.196 0.196 0.196 0.196
Ground housing with vertical hoses
in the manure or through tubes
underneath the bin
0.435 0.342 0.342 0.342 0.342 0.342 0.342
Perfo system 0.230 0.181 0.181 0.181 0.181 0.181 0.181
Air scrubber systems 0.080 0.080 0.113 0.111 0.056 0.046 0.046
Ground housing with manure belts
without after drying
0.245 0.192 0.192 0.192 0.192 0.192 0.192
Ground housing with manure belts
with after drying
0.255 0.202 0.200 0.200 0.242 0.205 0.205
1) Source: environmental permits in province Noord-Brabant on 1-1-2009. 2) Source: environmental permits in provinces: Overijssel, Gelderland, Utrecht, Noord-Brabant and Limburg on 01-01-2012. 3) Source: environmental permits in provinces: Overijssel, Gelderland, Utrecht, Noord-Brabant and Limburg on 01-01-2014. 4) Source: agricultural census 2016. 5) Source: agricultural census 2017. 6) Source: agricultural census 2018.

Methodology for estimating emissions from agriculture in the Netherlands - Update 2019 | 185
The emission factor in the Rav applies to situations in which the manure is removed from the farm directly or stored for a period of no more than two weeks in a covered container. In the remaining cases an additional emission factor for post-processing techniques like after drying or other storage applies. The emission factor of the post-processing technique has to be added to the emission factor of the housing type. Based on the information in environmental permits the average additional emission factor for after drying amounts to 0.010 kg NH3 up to 2010 and in the years after 0.008 kg NH3 per animal place.
A7.5 Broilers
In Table A7.5 the housing systems are depicted according to the classification of the Agricultural census. For some systems consisting of several subsystems an emission factor is derived using information in environmental permits.
In Table A7.5 also emission factors for systems consisting of several variations are derived. Table A7.5 (Derived) emission factors for broilers (kg NH3 per animal place)
1990-
20101)
2011-
20122)
2013-
20143)
20154) 20165) 20176)
kg
NH3/
animal
place
kg
NH3/
animal
place
kg NH3/
animal
place
kg
NH3/
animal
place
kg NH3/
animal
place
kg NH3/
animal
place
Traditional housing 0.068 0.068 0.068 0.068 0.068 0.068
Floor with litter drying 0.008 0.009 0.009 0.005 0.006 0.006
Storey systems 0.011 0.012 0.011 0.029 0.024 0.026
Air scrubber systems 0.008 0.010 0.010 0.010 0.010 0.010
Ground housing with floor heating and
cooling
0.038 0.038 0.038 0.038 0.038 0.038
Mixed air ventilation, warmth heaters and
fans, air blending
0.031 0.032 0.031 0.030 0.021 0.020
1) Source: environmental permits in province Noord-Brabant on 1-1-2009. 2) Source: environmental permits in provinces: Overijssel, Gelderland, Utrecht, Noord-Brabant and Limburg on 01-01-2012. 3) Source: environmental permits in provinces: Overijssel, Gelderland, Utrecht, Noord-Brabant and Limburg on 01-01-2014. 4) Source: agricultural census 2016. 5) Source: agricultural census 2017. 6) Source: agricultural census 2018.
A7.6 Ducks for slaughter
In ducks for slaughter only traditional housing occurs with an emission factor of 0.210 kg NH3 per animal place.
A7.7 Turkeys for slaughter
In Table A7.6 the housing systems are presented according to the classification of the Agricultural census. For some systems consisting of several subsystems an emission factor is derived using information of environmental permits.
In Table A7.6 also emission factors for systems consisting of several variations are derived.

186 | WOt-technical report 148
Table A7.6 (Derived) emission factors for turkeys (kg NH3 per animal place)
1990-
2007
2008-
20101)
2011-
20122)
2013-
20143)
20154) 20165) 20176)
kg NH3/
animal
place
kg NH3/
animal
place
kg NH3/
animal
place
kg NH3/
animal
place
kg NH3/
animal
place
kg NH3/
animal
place
kg
NH3/
animal
place
Traditional housing 0.680 0.932 0.932 0.932 0.932 0.932 0.932
Low emission housing 0.493 0.493 0.411 0.404 0.383 0.374 0.368 1) Source: environmental permits in province Noord-Brabant on 01-01-2009. 2) Source: environmental permits in provinces: Overijssel, Gelderland, Utrecht, Noord-Brabant and Limburg on 01-01-2012. 3) Source: environmental permits in provinces: Overijssel, Gelderland, Utrecht, Noord-Brabant and Limburg on 01-01-2014. 4) Source: agricultural census 2016. 5) Source: agricultural census 2017. 6) Source: agricultural census 2018.
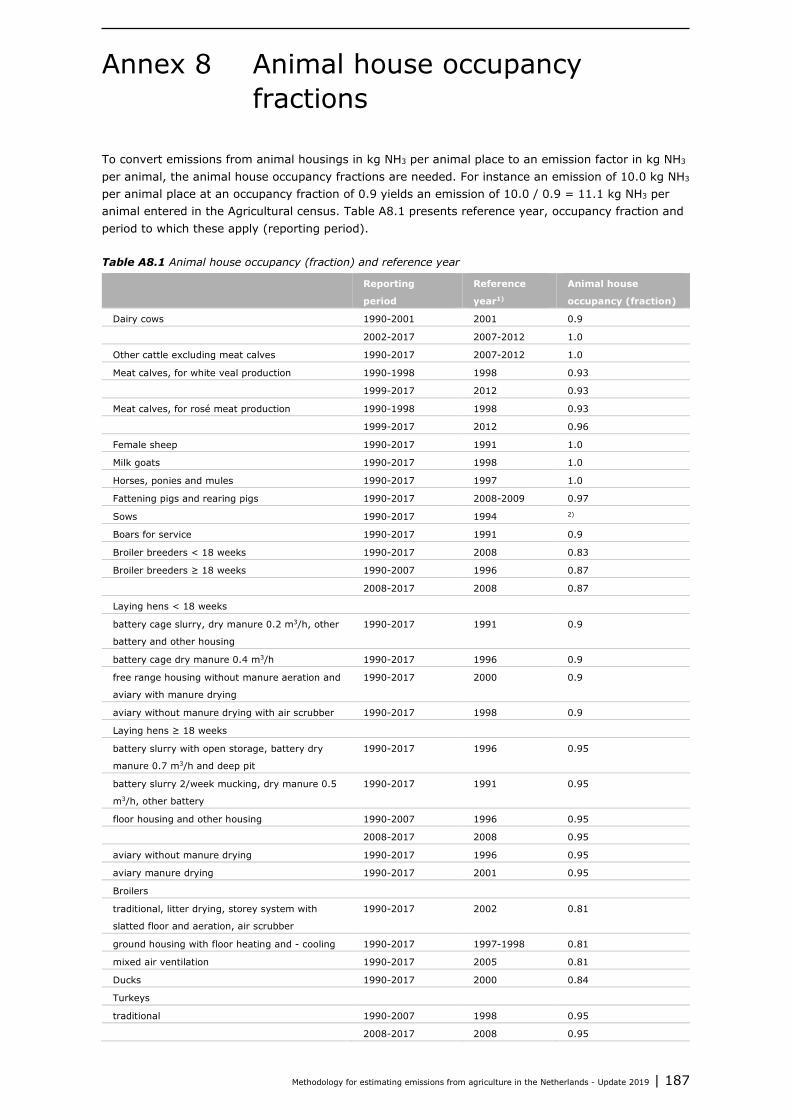
Methodology for estimating emissions from agriculture in the Netherlands - Update 2019 | 187
Annex 8 Animal house occupancy fractions
To convert emissions from animal housings in kg NH3 per animal place to an emission factor in kg NH3 per animal, the animal house occupancy fractions are needed. For instance an emission of 10.0 kg NH3 per animal place at an occupancy fraction of 0.9 yields an emission of 10.0 / 0.9 = 11.1 kg NH3 per animal entered in the Agricultural census. Table A8.1 presents reference year, occupancy fraction and period to which these apply (reporting period). Table A8.1 Animal house occupancy (fraction) and reference year
Reporting
period
Reference
year1)
Animal house
occupancy (fraction)
Dairy cows 1990-2001 2001 0.9
2002-2017 2007-2012 1.0
Other cattle excluding meat calves 1990-2017 2007-2012 1.0
Meat calves, for white veal production 1990-1998 1998 0.93
1999-2017 2012 0.93
Meat calves, for rosé meat production 1990-1998 1998 0.93
1999-2017 2012 0.96
Female sheep 1990-2017 1991 1.0
Milk goats 1990-2017 1998 1.0
Horses, ponies and mules 1990-2017 1997 1.0
Fattening pigs and rearing pigs 1990-2017 2008-2009 0.97
Sows 1990-2017 1994 2)
Boars for service 1990-2017 1991 0.9
Broiler breeders < 18 weeks 1990-2017 2008 0.83
Broiler breeders ≥ 18 weeks 1990-2007 1996 0.87
2008-2017 2008 0.87
Laying hens < 18 weeks
battery cage slurry, dry manure 0.2 m3/h, other
battery and other housing
1990-2017 1991 0.9
battery cage dry manure 0.4 m3/h 1990-2017 1996 0.9
free range housing without manure aeration and
aviary with manure drying
1990-2017 2000 0.9
aviary without manure drying with air scrubber 1990-2017 1998 0.9
Laying hens ≥ 18 weeks
battery slurry with open storage, battery dry
manure 0.7 m3/h and deep pit
1990-2017 1996 0.95
battery slurry 2/week mucking, dry manure 0.5
m3/h, other battery
1990-2017 1991 0.95
floor housing and other housing 1990-2007 1996 0.95
2008-2017 2008 0.95
aviary without manure drying 1990-2017 1996 0.95
aviary manure drying 1990-2017 2001 0.95
Broilers
traditional, litter drying, storey system with
slatted floor and aeration, air scrubber
1990-2017 2002 0.81
ground housing with floor heating and - cooling 1990-2017 1997-1998 0.81
mixed air ventilation 1990-2017 2005 0.81
Ducks 1990-2017 2000 0.84
Turkeys
traditional 1990-2007 1998 0.95
2008-2017 2008 0.95
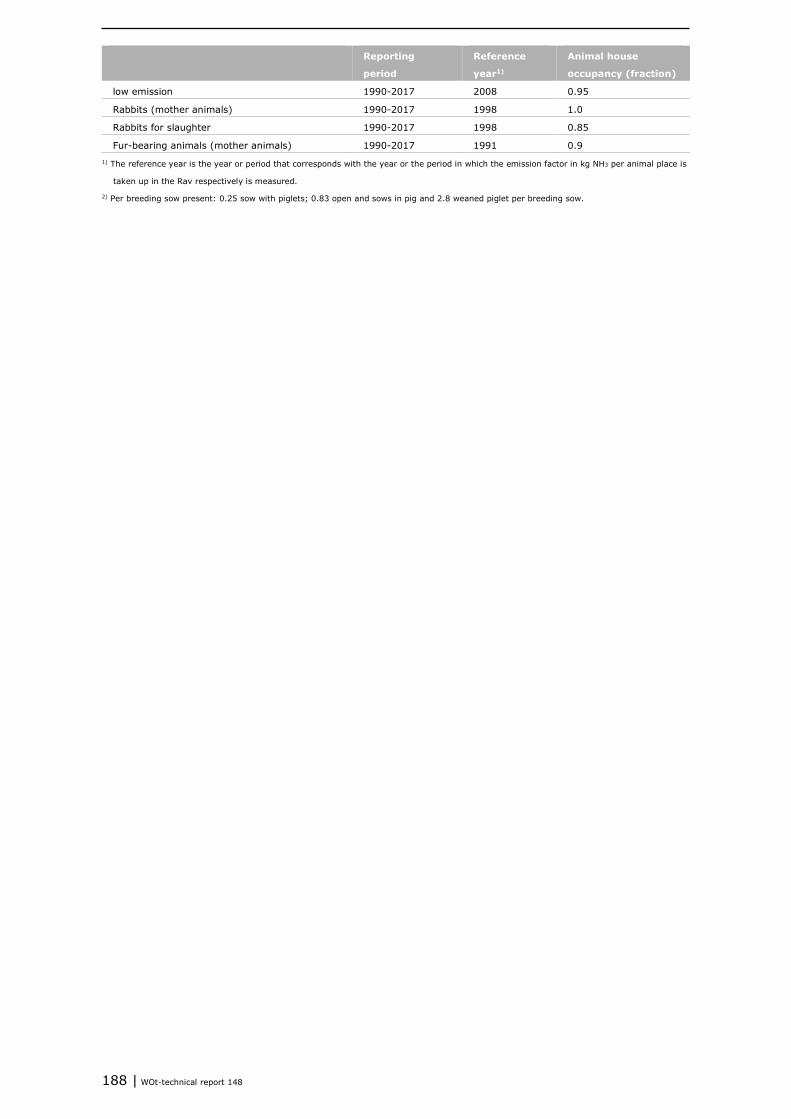
188 | WOt-technical report 148
Reporting
period
Reference
year1)
Animal house
occupancy (fraction)
low emission 1990-2017 2008 0.95
Rabbits (mother animals) 1990-2017 1998 1.0
Rabbits for slaughter 1990-2017 1998 0.85
Fur-bearing animals (mother animals) 1990-2017 1991 0.9 1) The reference year is the year or period that corresponds with the year or the period in which the emission factor in kg NH3 per animal place is
taken up in the Rav respectively is measured.
2) Per breeding sow present: 0.25 sow with piglets; 0.83 open and sows in pig and 2.8 weaned piglet per breeding sow.

Methodology for estimating emissions from agriculture in the Netherlands - Update 2019 | 189
Annex 9 Manure storage outside the animal house
Table A9.1 Manure storage outside animal housing (% of produced manure)
1990-20041) 20052) 20062) 20072) 20082) 20092) 2010-20113) 20123) 20134) 20145) 20156) 20167) 20178)
Cattle slurry 25 27 27 27 27 27 24 24 23 23 23 23 20
Pig slurry 10 15 15 15 15 15 21 21 19 19 19 19 19
Poultry slurry 15 88 88 88 88 88 100 100 100 100 100 100 100
Slurry of fur-bearing animals 50 50 50 50 50 50 50 50 50 50 50 50 50
Solid manure of grazing animals, pigs and rabbits 100 100 100 100 100 100 100 100 100 100 100 100 100
Solid poultry manure
deep pit housing 100 100 100 100 N/A N/A N/A N/A N/A N/A N/A N/A N/A
pre-dried belt manure (battery cage and aviary) 100 100 100 100 100 100 100 100 100 100 100 100 100
aviary without post-drying 100 100 100 100 100 100 100 100 100 100 100 100 100
post-dried manure 100 100 100 100 100 100 100 100 100 100 100 100 100
laying poultry – litter manure 100 90 60 40 0 0 0 40 40 45 35 35 40
broiler manure 100 85 65 70 40 35 25 25 30 35 20 25 25
duck manure 100 100 100 100 85 90 95 95 100 85 70 65 75
turkey manure 100 75 5 95 0 0 0 0 0 0 25 30 15 1) Agricultural census 1993.
2) Agricultural census 2007 and registered manure transports.
3) Agricultural census 2010 and registered manure transports.
4) Agricultural census 2014 and registered manure transports.
5) Agricultural census 2015 and registered manure transports.
6) Agricultural census 2016 and registered manure transports.
7) Agricultural census 2017 and registered manure transports.
8) Agricultural census 2018 and registered manure transports.
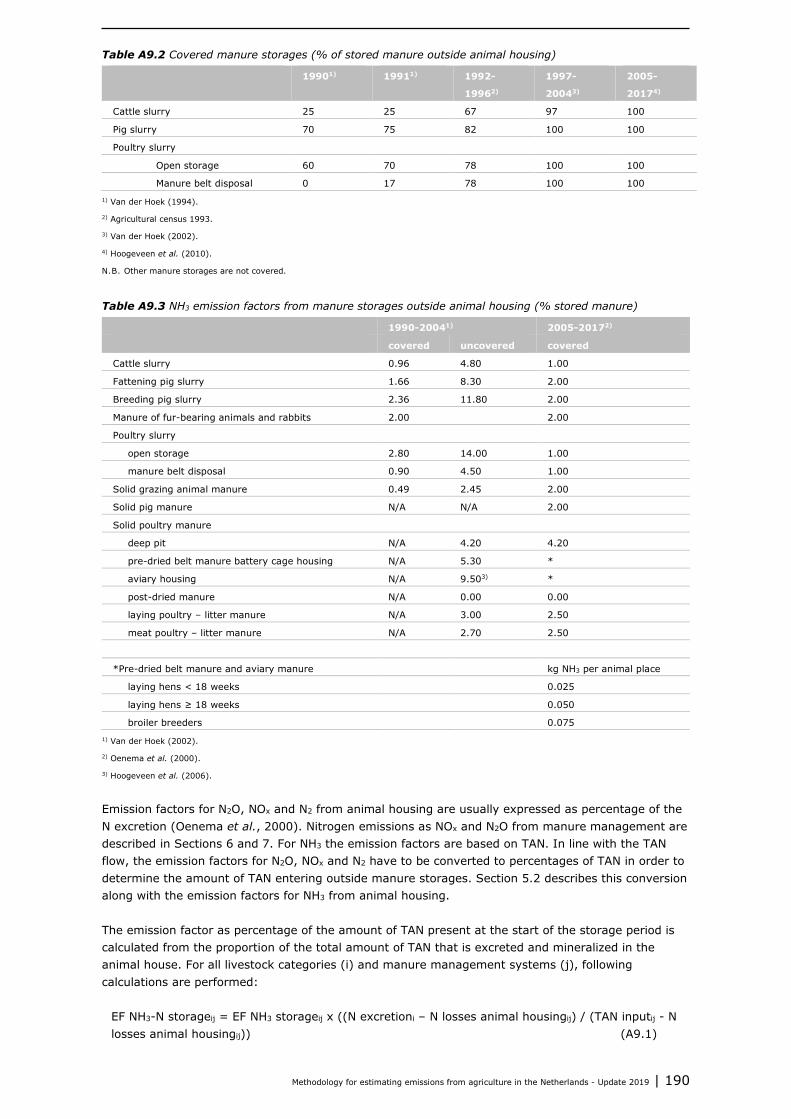
Methodology for estimating emissions from agriculture in the Netherlands - Update 2019 | 190
Table A9.2 Covered manure storages (% of stored manure outside animal housing)
19901) 19911) 1992-
19962)
1997-
20043)
2005-
20174)
Cattle slurry 25 25 67 97 100
Pig slurry 70 75 82 100 100
Poultry slurry
Open storage 60 70 78 100 100
Manure belt disposal 0 17 78 100 100 1) Van der Hoek (1994).
2) Agricultural census 1993.
3) Van der Hoek (2002).
4) Hoogeveen et al. (2010).
N.B. Other manure storages are not covered.
Table A9.3 NH3 emission factors from manure storages outside animal housing (% stored manure)
1990-20041) 2005-20172)
covered uncovered covered
Cattle slurry 0.96 4.80 1.00
Fattening pig slurry 1.66 8.30 2.00
Breeding pig slurry 2.36 11.80 2.00
Manure of fur-bearing animals and rabbits 2.00 2.00
Poultry slurry
open storage 2.80 14.00 1.00
manure belt disposal 0.90 4.50 1.00
Solid grazing animal manure 0.49 2.45 2.00
Solid pig manure N/A N/A 2.00
Solid poultry manure
deep pit N/A 4.20 4.20
pre-dried belt manure battery cage housing N/A 5.30 *
aviary housing N/A 9.503) *
post-dried manure N/A 0.00 0.00
laying poultry – litter manure N/A 3.00 2.50
meat poultry – litter manure N/A 2.70 2.50
*Pre-dried belt manure and aviary manure kg NH3 per animal place
laying hens < 18 weeks 0.025
laying hens ≥ 18 weeks 0.050
broiler breeders 0.075 1) Van der Hoek (2002).
2) Oenema et al. (2000).
3) Hoogeveen et al. (2006).
Emission factors for N2O, NOx and N2 from animal housing are usually expressed as percentage of the N excretion (Oenema et al., 2000). Nitrogen emissions as NOx and N2O from manure management are described in Sections 6 and 7. For NH3 the emission factors are based on TAN. In line with the TAN flow, the emission factors for N2O, NOx and N2 have to be converted to percentages of TAN in order to determine the amount of TAN entering outside manure storages. Section 5.2 describes this conversion along with the emission factors for NH3 from animal housing. The emission factor as percentage of the amount of TAN present at the start of the storage period is calculated from the proportion of the total amount of TAN that is excreted and mineralized in the animal house. For all livestock categories (i) and manure management systems (j), following calculations are performed:
EF NH3-N storageij = EF NH3 storageij x ((N excretioni – N losses animal housingij) / (TAN inputij - N losses animal housingij)) (A9.1)
Methodology for estimating emissions from agriculture in the Netherlands - Update 2019 | 191
Where EF NH3-N storageij : NH3 emission factor (% of TAN) for outside storages of livestock category (i)
and manure management system (j) EF NH3 storageij : NH3 emission factor (% of N stored) for outside manure storage of livestock
category (i) and manure management system (j) N losses animal housingij: Sum of NH3-N, N2O-N, NOx-N and N2-N losses (kg N/year) from animal
houses for livestock category (i) and manure management system (j) Also in manure storages emissions of N2, N2O and NOx occur, but as emission factors for these include both animal housing and manure storage according to the IPCC Guidelines, these are not calculated separately. Emissions from manure storages are therefore included in the EFs described in section 5.3 (equation 5.5). References Hoek, K.W. van der, 1994. Berekeningsmethodiek ammoniakemissie in Nederland voor de jaren 1990, 1991
en 1992 (in Dutch). RIVM report 773004003. National Institute for Public Health and the Environment, Bilthoven, the Netherlands.
Hoek, K.W. van der, 2002. Uitgangspunten voor de mest- en ammoniakberekeningen 1999 tot en met 2001 zoals gebruikt in de Milieubalans 2001 en 2002, inclusief datasets landbouwemissies 1980-2001 (in Dutch). RIVM report 773004013/2002. National Institute for Public Health and the Environment, Bilthoven, the Netherlands.
Hoogeveen, M.W., H.H. Luesink & C. van Bruggen, 2006. Gasvormige stikstofverliezen uit stal en opslag. Verschillen in berekeningsmethoden (in Dutch). Report 3.06.01. LEI, Den Haag, the Netherlands.
Hoogeveen, M.W., P.W. Blokland, H. van Kernebeek, H.H. Luesink & J.H. Wisman, 2010. Ammoniakemissie uit de landbouw in 1990 en 2005-2008; Achtergrondrapportage (in Dutch). WOt-Working Document 191. WOT Natuur & Milieu, Wageningen UR, Wageningen, the Netherlands.
Oenema, O., G.L. Velthof, N. Verdoes, P.W.G. Groot Koerkamp, G.J. Monteny, A. Bannink, H.G. van der Meer & K.W. van der Hoek, 2000. Forfaitaire waarden voor gasvormige stikstofverliezen uit stallen en mestopslagen (in Dutch). Report 107, revised edition. Alterra Wageningen UR, Wageningen, the Netherlands.


Methodology for estimating emissions from agriculture in the Netherlands - Update 2019 | 193
Annex 10 Emission factors for calculation direct nitrous oxide emissions from agricultural soils (including grazing)
Marian van Schijndel and Sietske van der Sluis (PBL), 2011 For fertilization with inorganic N fertilizers and animal manure and for grazing emission factors have been established and applied in the NIR 2011. For an overview see Table A10.1. This memorandum describes the derivation of the (weighted average) emission factors that are applied in the NIR 2011 for the period from 1990 to now in the ER-calculations of direct N2O emissions from agricultural soils (including grazing). Table A10.1 N2O-N emission factors (% of the N supply) for calculation of direct N2O emissions from agricultural soils and of N2O emissions as a result of grazing (based on Velthof and Mosquera, 2011b and Van der Hoek et al., 2007). The marked emission factors are applied since the NIR 2011 (Van der Maas et al., 2011).
N2O-emission
factor (%)
Grass
land
Arable
land
Weighted
average all land
use and soils
Was previously (1)* Remarks
Animal manure
emission low
All soils 0.9 2 (1.7) 1990: 1.5
2008: 1.9
Mineral soils 0.3 1.3 Like all soils
Peat soils 1 N/A Like all soils
Animal manure
surface application
All soils 0.4 1 (0.9)
Mineral soils 0.1 0.6 1 (0.8) 1990: 0.8
1999: 0.9
Peat soils 0.5 N/A 2 (1.6) 1990: 1.5
1995: 1.7
Inorganic N
fertilizer
All soils 1.3 1 (1.04)
Mineral soils 0.8 0.7 Nitrate containing 1
(0.97). Ammonium
containing 0.5 (0.48)
varying over
the years
Peat soils 3 N/A Nitrate containing 2
(1.94). Ammonium
containing 1 (0.97)
varying over
the years
Grazing All soils 3.3 1.68 (1.56)
Mineral soils 2.5 N/A
Peat soils 6.0 N/A
1 (0.93) faeces
2 (1.86) urine
Histosols Peat soils ** N/A ** 2 No adjustment
Crop residues Mineral soils N/A ** ** 1 No adjustment
Nitrogen fixation Mineral soils N/A ** ** 1 No adjustment
Sewage sludge ???? 1 No adjustment
(1) Van der Hoek et al., 2007.
* Between brackets the emission factors related to total gross N supply to soil (without deducting NH3-N in fertilizing). In the old method the
N2O-N was calculated based on net N supply to soil, i.e. after deduction of NH3-N. In the new method no NH3-N deduction is applied anymore.
Reason is that this also not happens in the N2O measurements in field experiments.
** No (new) data available.

194 | WOt-technical report 148
A10.1 Reason revision N2O-N emission factors
In 1994 based on laboratory scale experiments country-specific emission factors for the direct N2O emission from agricultural soils were derived (Kroeze, 1994) for the distinguished sources. The N2O-N emission factor for low emission manure application and surface spreading were respectively 2 and 1% of the N supply to the soil. Thus the emission factor for low emission manure application was compared to surface spreading a factor 2 higher. In 1997 this was summarized in a methodology description (Spakman et al., 1997). For surface spreading the country-specific N2O-N emission factor was somewhat lower than the IPCC 1996 default (1% versus 1.25% of the N supply). For the NIR 2005 (Klein Goldewijk et al., 2005) the methodology was developed further and adjusted (Van der Hoek et al., 2007). Amongst others the emission factor for inorganic N fertilizer is refined based on research of Velthof et al., 1997. This refinement comprised that for a separate category inorganic N fertilizers (ammonium containing inorganic N fertilizers that do not contain nitrate) a 50% lower emission factor was applied than used before for all kinds of inorganic N fertilizer. Based on field experiments in the Netherlands there seemed to be indications that the N2O-N emission factor for low emission manure application was lower than the 2% of the N supply used (Velthof et al., 2003 and Van Groeningen et al., 2004). This led to the question whether low emission manure application in practice indeed had a higher N2O-N emission factor than surface spreading. An overview of Dutch and international research results published after the publication of Kroeze in 1994 (Kuikman et al., 2006) offered insufficient reason to adjust and/or further refine the emission factors for low emission manure application and surface spreading (Van der Hoek et al., 2007). In the Netherlands only a very limited number of comparative experiments had been carried out between surface spreading and low emission manure application. These resulted in relatively low emission factors (< 0.1% of the N supply) for both application techniques (Velthof et al., 1997). Results of international comparative field experiments showed that the nitrous oxide emissions for low emission manure application were mostly higher than for surface spreading. However it was not possible to derive long year average N2O-N emission factors and adjust these for Dutch circumstances. It was concluded that more research was needed (see also the NIR 2006; Brandes et al., 2006). Between 2007 and 2010 in the Netherlands 2 to 3 year lasting comparative field experiments have been conducted to map the N2O emissions for surface spreading and low emission manure application, in which for comparison also the fertilization with inorganic N fertilizer was researched (Velthof et al., 2010 and Velthof and Mosquera, 2011a). It was found that low emission manure application has higher N2O-N emission factors than surface spreading. The emission factors derived based were lower than the emission factors used for both fertilization techniques, and there were differences in the N2O-N emission factors between grassland and arable land and between animal manure and inorganic N fertilizer. These findings were the incentive to follow-up research. Based on all available Dutch and other NW European measurements of N2O emission factors starting from the beginning of the nineties it was recommended to adjust the emission factors for manure application and inorganic N fertilizer use (Velthof and Mosquera, 2011b). PBL Netherlands Environmental Assessment Agency has reviewed the statistical analysis performed by Velthof and Mosquera on behalf of the Emission Registration (see annex 2 of this Annex).
A10.2 Motivation for calculating weighted average emission factors
Table 1 distinguishes for animal manure low emission manure application and surface fertilization. Further for animal manure, inorganic N fertilizer and grazing there are separate emission factors for mineral soils, peat soils, grassland and arable land (see data in italics) as determined by Velthof and Mosquera, 2011b.
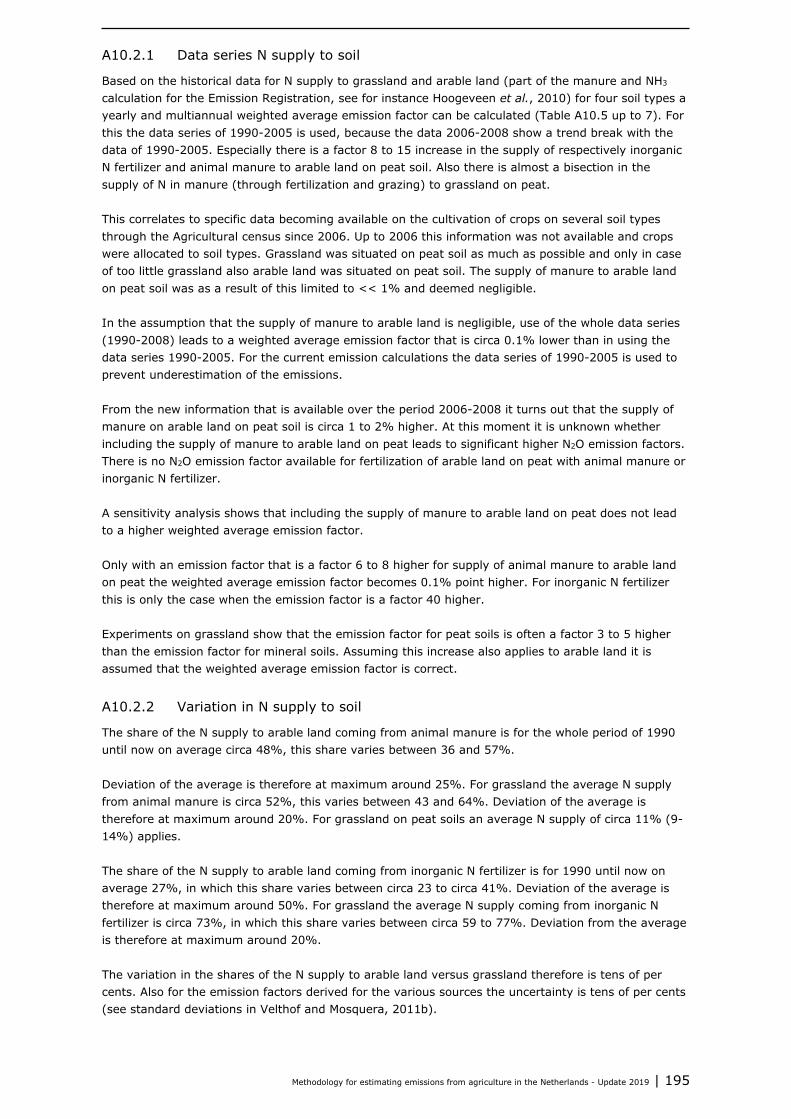
Methodology for estimating emissions from agriculture in the Netherlands - Update 2019 | 195
A10.2.1 Data series N supply to soil
Based on the historical data for N supply to grassland and arable land (part of the manure and NH3 calculation for the Emission Registration, see for instance Hoogeveen et al., 2010) for four soil types a yearly and multiannual weighted average emission factor can be calculated (Table A10.5 up to 7). For this the data series of 1990-2005 is used, because the data 2006-2008 show a trend break with the data of 1990-2005. Especially there is a factor 8 to 15 increase in the supply of respectively inorganic N fertilizer and animal manure to arable land on peat soil. Also there is almost a bisection in the supply of N in manure (through fertilization and grazing) to grassland on peat. This correlates to specific data becoming available on the cultivation of crops on several soil types through the Agricultural census since 2006. Up to 2006 this information was not available and crops were allocated to soil types. Grassland was situated on peat soil as much as possible and only in case of too little grassland also arable land was situated on peat soil. The supply of manure to arable land on peat soil was as a result of this limited to << 1% and deemed negligible. In the assumption that the supply of manure to arable land is negligible, use of the whole data series (1990-2008) leads to a weighted average emission factor that is circa 0.1% lower than in using the data series 1990-2005. For the current emission calculations the data series of 1990-2005 is used to prevent underestimation of the emissions. From the new information that is available over the period 2006-2008 it turns out that the supply of manure on arable land on peat soil is circa 1 to 2% higher. At this moment it is unknown whether including the supply of manure to arable land on peat leads to significant higher N2O emission factors. There is no N2O emission factor available for fertilization of arable land on peat with animal manure or inorganic N fertilizer. A sensitivity analysis shows that including the supply of manure to arable land on peat does not lead to a higher weighted average emission factor. Only with an emission factor that is a factor 6 to 8 higher for supply of animal manure to arable land on peat the weighted average emission factor becomes 0.1% point higher. For inorganic N fertilizer this is only the case when the emission factor is a factor 40 higher. Experiments on grassland show that the emission factor for peat soils is often a factor 3 to 5 higher than the emission factor for mineral soils. Assuming this increase also applies to arable land it is assumed that the weighted average emission factor is correct.
A10.2.2 Variation in N supply to soil
The share of the N supply to arable land coming from animal manure is for the whole period of 1990 until now on average circa 48%, this share varies between 36 and 57%. Deviation of the average is therefore at maximum around 25%. For grassland the average N supply from animal manure is circa 52%, this varies between 43 and 64%. Deviation of the average is therefore at maximum around 20%. For grassland on peat soils an average N supply of circa 11% (9-14%) applies. The share of the N supply to arable land coming from inorganic N fertilizer is for 1990 until now on average 27%, in which this share varies between circa 23 to circa 41%. Deviation of the average is therefore at maximum around 50%. For grassland the average N supply coming from inorganic N fertilizer is circa 73%, in which this share varies between circa 59 to 77%. Deviation from the average is therefore at maximum around 20%. The variation in the shares of the N supply to arable land versus grassland therefore is tens of per cents. Also for the emission factors derived for the various sources the uncertainty is tens of per cents (see standard deviations in Velthof and Mosquera, 2011b).

196 | WOt-technical report 148
The uncertainties of the emission factors and in the yearly N supply to mineral versus organic soils with grassland and arable land do not make it necessary to conduct yearly calculation for the distinguished sources. Also for the supply of N2O emission figures in international reports disaggregated emission factors are not necessary. From 2011 on the disaggregated data on N supply possibly will not become available yearly1. For these reasons multiannual weighted average emission factors are derived for surface spreading, for low emission manure application, for application of inorganic N fertilizers and for grazing.
A10.3 Weighted average emission factors
A10.3.1 Animal manure
For animal manure the (multiannual weighted average) N2O emission factor for surface spreading and low emission manure application is respectively 0.4% and 0.9% of the N supply to soil. That is circa a factor 2 lower than the value applied up to now. This applies to surface spreading (decrease from circa 1 to 0.4% of the N supply) as well as low emission manure application (decrease from circa 2 to 0.9% of the N supply). There is a significant difference in emission factors for low emission manure application and surface spreading. For low emission manure application the N2O-N emission factor is a factor 2 higher than for surface spreading, namely 0.9% versus 0.4% of the N supply (Velthof et al., 2010). The share of N in surface spreading decreases strongly between 1990 and 1995 (from 100 to 5%). This makes it necessary to calculate these sources separately in the yearly emission calculations and thus to differentiate separate emission factors for surface spreading and low emission manure application.
A10.3.2 Inorganic N fertilizer
For inorganic N fertilizer the (multiannual weighted average) N2O-N emission factor is circa 30% higher than the value applied up until now (from circa 1 to 1.3% of the N supply). Reason is that especially for grassland on peat soils the emission factor based on measurement turns out to be higher than assumed (3% instead of 2%). Also no longer a lower emission factor for ammonium containing (nitrate free) inorganic N fertilizer is applied, because the available measurements do not provide sufficient basis for different factors. In the Netherlands very few measurement were done; only 3 comparative experiments with a duration of more than 8 months. In 1 of the 3 experiments there seems to be a lower emission factor for the ammonium containing (nitrate fee) inorganic N fertilizer. In the other 2 experiments there is no difference or the emission factor is even higher. Also literature research into international measurements does not provide a definite answer (Velthof and Mosquera, 2011b).
A10.3.3 Grazing
For grazing the (multiannual weighted average) emission factor is circa a factor 2 higher based on measurements (urine/dung data in Appendix 1 of Velthof and Mosquera, 2011b); it increases from circa 1.7 to 3.3% N2O-N of the N supply.
A10.3.4 Other sources
For the emission factor of the smaller sources crop residues, N fixation, histosols and sewage sludge the ‘old’ values still apply because no new data is available. For histosols the emission factor is 2%. This is consistent with the average of the new emission factors that apply for grassland on peat soils for inorganic N fertilizer and low emission manure application (respectively 3 and 1%).
1 This as result of the transition to a new calculation methodology for the yearly national NH3 calculations (Velthof et al.,
2009 and Van Bruggen et al., 2011). The previously yearly used MAMBO model for the NH3 calculations will be applied by the ER possibly only for the purpose of regionalization. This will likely be less frequent than yearly, for instance 3 yearly.

Methodology for estimating emissions from agriculture in the Netherlands - Update 2019 | 197
For crop residues and nitrogen fixation the emission factor is 1%. This is consistent with the average of the emission factors that apply for arable land on mineral soils for inorganic N fertilizers and low emission manure application (respectively 1 and 1.3%).
A10.3.5 Comparison to IPCC defaults
The new emission factor for low emission manure application of 0.9% is lower than the IPCC 1996 default of 1.25%, but is approximately around the new IPCC 2006 default of 1%. For surface spreading the emission factor is a factor 2 lower than the IPCC 2006 default. The new emission factor for inorganic N fertilizer is somewhat higher than the IPCC 1996 default (1.3 versus 1.25%). In comparison to the new IPCC 2006 default of 1% of the N supply the country-specific value is circa 30% higher. The new emission factor for grazing is 3.3% of the N supply and with that circa 65% higher than the IPCC 1996 and IPCC 2006 defaults of 2%.
A10.3.6 Uncertainties of weighted average emission factors
Velthof and Mosquera (2011b) give uncertainties for the emission factors for animal manure, inorganic N fertilizer and grazing. For the calculation of the uncertainty of the weighted average emission factors an expert judgement (Luesink) was made on the uncertainty if the amount of manure going to different soil types and land use. Table A10.2 Animal manure
Agricultural soil Manure to soil U manure to soil EF (%) U EF
Low emission (total x2) 70%
Organic grassland 21.6 40% 1.0 45%*
Mineral grassland 106.5 40% 0.3 33%
Mineral arable land 108.7 40% 1.3 23%
Surface spreading (total x2) 81%
Organic grassland 1.1 40% 0.5 45%*
Mineral grassland 5.5 40% 0.1 20%
Mineral arable land 5.6 40% 0.6 33%
* Velthof and Mosquera (2011b) do not give an uncertainty. The highest uncertainty of the other emission factors in taken, rounded at 5%.
Table A10.3 Inorganic N fertilizer
Agricultural soil Inorganic fertilizer to soil U inorganic fertilizer to soil EF (%) U EF
Organic grassland 18.8 20% 3.0 20%
Mineral grassland 123.2 20% 0.8 13%
Mineral arable land 83.4 20% 0.7 43%
Total (2x) 37%
Table A10.4 Grazing
Agricultural soil Manure deposited in pastures U manure deposited in pastures EF (%) U EF
Organic grassland 12.0 20% 3.0 38%
Mineral grassland 64.3 20% 0.8 31%
Total (2x) 64%

Methodology for estimating emissions from agriculture in the Netherlands - Update 2019 | 198
Table A10.5 Calculation weighted average N2O-N emission factor for application animal manure based on N in animal manure to soil*
N supply (kg N) to N supply (kg N) to share N supply to share N supply to N2O-N emission factor (% of N supply)
year soil arable land grassland arable land** grassland low emission manure application surface spreading
1980 mineral 124,056,517 131,190,515 43% 46% 0.8 0.4
peat 12,025 31,254,013 11%
1984 mineral 149,064,760 121,560,842 50% 40% 0.9 0.4
peat 39,840 29,774,908 10%
1985 mineral 163,478,854 118,770,657 52% 38% 0.9 0.4
peat 48,463 29,830,481 10%
1987 mineral 177,840,312 109,262,083 56% 35% 0.9 0.4
peat 65,403 29,254,982 9%
1988 mineral 164,940,815 131,212,093 51% 40% 0.9 0.4
peat 135,656 29,503,622 9%
1989 mineral 175,935,382 120,319,586 54% 37% 0.9 0.4
peat 190,745 28,275,924 9%
1990 mineral 186,513,236 113,568,424 57% 35% 0.9 0.4
peat 227,961 28,102,535 9%
1991 mineral 160,111,819 149,104,352 46% 43% 0.8 0.4
peat 212,422 36,882,599 11%
1992 mineral 190,789,097 148,340,643 51% 40% 0.9 0.4
peat 272,982 35,694,657 10%
1993 mineral 168,860,398 172,584,027 44% 45% 0.8 0.4
peat 290,342 42,588,332 11%
1994 mineral 161,482,717 172,727,227 43% 46% 0.8 0.4
peat 312,744 39,521,343 11%
1995 mineral 127,921,589 175,486,807 36% 50% 0.8 0.3
peat 416,212 47,621,425 14%
1996 mineral 183,453,286 157,935,264 48% 41% 0.9 0.4
peat 1,599,323 42,963,547 11%
1997 mineral 161,978,074 133,007,449 49% 40% 0.9 0.4
peat 1,193,763 37,554,142 11%
1998 mineral 126,756,610 145,544,393 41% 47% 0.8 0.4
peat 447,910 37,769,955 12%
1999 mineral 163,289,415 129,991,784 50% 40% 0.9 0.4
peat 215,418 35,090,459 11%
2000 mineral 143,240,045 114,417,747 49% 39% 0.9 0.4
peat 341,562 32,961,633 11%

Methodology for estimating emissions from agriculture in the Netherlands - Update 2019 | 199
N supply (kg N) to N supply (kg N) to share N supply to share N supply to N2O-N emission factor (% of N supply)
year soil arable land grassland arable land** grassland low emission manure application surface spreading
2001 mineral 131,772,857 124,241,918 45% 43% 0.8 0.4
peat 230,807 36,298,625 12%
2002 mineral 122,698,262 119,650,533 44% 43% 0.8 0.4
peat 209,634 35,621,517 13%
2003 mineral 126,006,911 117,602,005 45% 42% 0.8 0.4
peat 164,073 35,520,456 13%
2004 mineral 124,227,089 105,717,392 47% 40% 0.9 0.4
peat 212,829 35,597,614 13%
2005 mineral 117,023,028 104,205,390 46% 41% 0.9 0.4
peat 251,242 35,832,769 14%
2006 mineral 101,398,282 114,285,064 42% 48% 0.8 0.4
peat 3,243,483 23,273,421 10%
2007 mineral 111,809,202 117,300,043 44% 46% 0.8 0.4
peat 3,634,559 23,164,601 9%
2008 mineral 114,272,963 112,003,903 45% 45% 0.8 0.4
peat 4,184,001 22,771,321 9%
avg 1980-2005*** 48% 41% 0.9 0.4
11%
avg 1980-2008 47% 42% 0.8 0.4
11%

Methodology for estimating emissions from agriculture in the Netherlands - Update 2019 | 200
Table A10.6 Calculation weighted average N2O emission factor for application inorganic N fertilizer based on N in inorganic N fertilizer to soil*
N supply
(kg N) to
N supply
(kg N) to
share N
supply to
share N
supply to
N2O-N emission facto
(% of N supply)
year soil arable land grassland arable land** grassland
1980 mineral 106,970,124 321,290,597 22% 68% 1.2
peat 845,784 47,364,270 10%
1984 mineral 115,242,899 306,592,441 25% 65% 1.2
peat 669,448 46,453,094 10%
1985 mineral 121,629,145 321,528,042 25% 65% 1.2
peat 980,333 51,032,821 10%
1987 mineral 117,364,458 321,205,471 24% 65% 1.2
peat 1,176,447 54,196,495 11%
1988 mineral 103,843,410 285,610,253 23% 64% 1.3
peat 567,437 58,982,461 13%
1989 mineral 109,035,951 271,123,012 25% 62% 1.2
peat 628,476 53,700,679 12%
1990 mineral 93,955,348 258,779,664 23% 64% 1.3
peat 587,758 50,443,644 13%
1991 mineral 95,188,438 247,537,905 24% 63% 1.2
peat 558,547 48,700,413 12%
1992 mineral 95,575,147 239,788,209 25% 63% 1.3
peat 606,476 47,919,077 13%
1993 mineral 90,046,707 242,183,075 24% 64% 1.3
peat 572,620 49,155,969 13%
1994 mineral 93,444,169 224,305,307 26% 62% 1.3
peat 735,972 45,573,592 13%
1995 mineral 105,665,020 252,386,044 27% 64% 1.2
peat 719,180 38,860,446 10%
1996 mineral 103,559,665 220,116,636 27% 58% 1.3
peat 1,503,317 56,088,691 15%
1997 mineral 92,783,862 236,991,849 25% 63% 1.2
peat 1,235,110 46,040,338 12%
1998 mineral 93,406,574 247,455,602 24% 65% 1.2
peat 436,096 42,469,506 11%
1999 mineral 91,272,134 239,316,122 24% 64% 1.2
peat 414,525 42,111,274 11%
2000 mineral 94,109,506 199,931,253 28% 61% 1.2
peat 452,482 36,361,014 11%
2001 mineral 99,873,727 141,112,710 36% 51% 1.3
peat 426,707 37,024,246 13%
2002 mineral 87,422,680 146,382,600 32% 54% 1.3
peat 367,928 37,970,173 14%
2003 mineral 86,331,855 148,396,464 32% 55% 1.3
peat 380,570 35,186,448 13%
2004 mineral 86,696,990 148,801,581 31% 54% 1.3
peat 346,690 41,245,514 15%
2005 mineral 87,869,786 129,741,007 34% 51% 1.3
peat 353,314 38,008,391 15%
2006 mineral 105,470,705 132,928,979 41% 51% 1.2
peat 2,874,346 21,094,967 8%
2007 mineral 83,018,237 128,571,402 36% 56% 1.2
peat 2,165,854 18,554,082 8%
2008 mineral 83,433,097 123,167,371 37% 55% 1.2
peat 1,913,870 18,795,236 8%

Methodology for estimating emissions from agriculture in the Netherlands - Update 2019 | 201
N supply
(kg N) to
N supply
(kg N) to
share N
supply to
share N
supply to
N2O-N emission facto
(% of N supply)
year soil arable land grassland arable land** grassland
avg 1990-2005*** 27% 60% 1.3
13%
avg 1990-2008 28% 60% 1.2
12%
Table A10.7 Calculation weighted average N2O emission factor for grazing based on N in pasture manure to soil*
N supply (kg N) to N supply (kg N) to
year mineral peat N2O-N emission factor (% of N supply)
1980 107,508,357 24,674,512 3.2
1984 119,347,758 27,232,572 3.2
1985 121,731,826 28,144,527 3.2
1987 123,537,968 28,990,668 3.2
1988 115,887,919 27,259,575 3.2
1989 115,780,711 27,211,678 3.2
1990 121,894,046 28,534,860 3.2
1991 124,259,557 29,059,000 3.2
1992 119,230,167 28,189,410 3.2
1993 119,802,693 28,642,606 3.2
1994 110,172,205 26,420,847 3.2
1995 110,190,780 26,542,838 3.2
1996 112,515,810 30,676,162 3.2
1997 105,550,182 32,090,792 3.3
1998 94,709,103 28,909,070 3.3
1999 81,121,551 25,597,115 3.3
2000 74,318,394 23,178,293 3.3
2001 75,716,792 23,705,551 3.3
2002 60,076,981 19,368,654 3.4
2003 61,799,968 19,573,558 3.3
2004 60,023,293 21,370,347 3.4
2005 59,810,261 21,389,229 3.4
2006 66,689,712 12,502,196 3.1
2007 60,286,513 11,358,872 3.1
2008 64,312,534 11,955,203 3.0
avg 1990-2005*** 3.3
avg 1990-2008 3.2
* N to soil after subtraction of NH3-N during application because data without subtraction of NH3-N for N to peat respectively mineral soils are not
available; in the emission calculations the weighted average emission factors however are related to the total gross N supply to soil (without
subtraction of NH3-N during application). Assumption is that the differences in evaporation of NH3 in arable land and grassland are so small
that these will not influence the division of the gross N supply over grassland and arable land.
1980-1997: MestAmm data LEI
1997-2005: MAM data LEI
2006-2008: MAMBO data LEI
** In calculation of the shares N to arable land and grassland the N supply to arable land on peat is neglected. The share is relatively small (<
0.2%) and for this source no emission factors are available.
*** The data 2006-2008 show a break in the trend with the data 1980-2005. Especially there is a factor 8 to 15 increase in the supply of
respectively inorganic N fertilizer and animal manure to arable land on peat. Also there is almost a halving in the supply of N in manure
(through fertilization and grazing) to grassland on peat. This correlates to specific data becoming available on the cultivation of crops on
several soil types through the Agricultural census from 2006 on.
In the assumption that the supply of manure to arable land is negligible, use of the whole data series (1990-2008) leads to a weighted
average emission factor that is circa 0.1% point lower than in use of the data series 1990-2005. For the emission calculation the weighted
average emission factor based on the data series 1990-2005 is used to prevent underestimation of the emissions. From a sensitivity analysis
follows that there is a reasonable chance that weighing in the supply of manure to arable land on peat does not lead to an even higher
weighted average emission factor.

202 | WOt-technical report 148
A10.4 References
Brandes, L.J., G.E.M. Alkemade, P.G. Ruyssenaars, H.H.J. Vreuls & P.W.H.G. Coenen, 2006. Greenhouse Gas Emissions in the Netherlands 1990-2004. National Inventory Report 2006. MNP report 500080001/2006. Netherlands Environmental Assessment Agency, Bilthoven, the Netherlands.
Hoek, K.W. van der, M.W. van Schijndel & P.J. Kuikman, 2007. Direct and indirect nitrous oxide emissions from agricultural soils, 1990-2003. Background document on the calculation method for the Dutch NIR. MNP report 500080003, RIVM report 680125003. Netherlands Environmental Assessment Agency/National Institute for Public Health and the Environment, Bilthoven, the Netherlands.
Hoogeveen, M.W., P.W. Blokland, H. van Kernebeek, H.H. Luesink & J.H. Wisman, 2010. Ammoniakemissie uit de landbouw in 1990 en 2005-2008. Achtergrondrapportage (in Dutch). WOt-Working Document 191, WOT Natuur & Milieu, Wageningen UR, Wageningen, the Netherlands.
Klein Goldewijk, K., J.G.J. Olivier, J.A.H.W. Peters, P.W.H.G. Coenen & H.H.J. Vreuls, 2005. Greenhouse Gas Emissions in the Netherlands 1990-2003. National Inventory Report 2005. RIVM report 773201009/2005. National Institute for Public Health and the Environment, Bilthoven, the Netherlands.
Maas, C.W.M. van der, P.W.H.G. Coenen, P.J. Zijlema, K. Baas, G. van den Berghe, J.D. te Biesebeek, A.T. Brandt, G. Geilenkirchen, K.W. van der Hoek, R. te Molder, R. Dröge, C.J. Peek, J. Vonk & I. van den Wyngaert, 2011. Greenhouse Gas Emissions in the Netherlands 1990-2009. National Inventory Report 2011. RIVM report 680355004. National Institute for Public Health and the Environment, Bilthoven, the Netherlands.
Velthof, G.L., O. Oenema, R. Postma & M.L. van Beusichem, 1997. Effects of type and amount of applied nitrogen fertilizer on nitrous oxide fluxes from intensively managed grassland. Nutrient Cycling in Agroecosystems 46, pp. 257-267.
Velthof, G.L., J. Mosquera, J. Huis in ‘t Veld & E. Hummelink, 2010. Effect of manure application technique on nitrous oxide emission from agricultural soils. Report 1992, Alterra Wageningen UR, Wageningen, the Netherlands.
Velthof, G.L. & J. Mosquera, 2011a. The impact of manure application technique on nitrous oxide emission from agricultural soils. Agriculture, Ecosystems and Environment 140 (1-2), p. 298-308. www.sciencedirect.com/science/article/pii/S0167880910003440
Velthof, G.L. & J. Mosquera, 2011b. Calculation of nitrous oxide emission from agriculture in the Netherlands. Update of emission factors and leaching fraction. Report 2151, Alterra Wageningen UR, Wageningen, the Netherlands.

Methodology for estimating emissions from agriculture in the Netherlands - Update 2019 | 203
Annex 11 Uncertainty, quality assurance and verification
A11.1 Estimating uncertainties
For the PRTR dataset of 2015 uncertainties are calculated with the propagation of error method based on literature and expert judgements. Since calculation methods of activity data and emission factors do not change often, this dataset of uncertainties can be used for multiple years. When a calculation method is changed also the uncertainty of the considered activity data or emission factor is adjusted based on literature and expert judgements, to keep the data set of uncertainties up to date. List of experts consulted Eric Arets André Bannink Cor van Bruggen Arthur Denneman Jan Dijkstra Karin Groenestein Marga Hoogeveen Jan Huijsmans Harry Luesink Frank de Ruijter Gerard Velthof Jan Vonk References consulted CBS (2012b) EEA (2016) Groenestein et al. (2016) Huis in 't Veld et al. (2011) IPCC (2006) Kroeze, (1994) Mosquera et al. (2010a) Mosquera et al. (2010b) Mosquera et al. (2010c) Mosquera et al. (2011) Winkel et al. (2009) Winkel et al. (2011)
A11.2 Quality assurance and quality control (QA/QC)
The PRTR task force leader on Agriculture is responsible for: 1. well documented and adopted data; 2. calculations having been implemented correctly; 3. assumptions are consistent, specific parameters (e.g. activity data) are used consistently; 4. complete and consistent data sets have been supplied. A yearly check on the above mentioned responsibilities is performed. Any actions that result from these checks are noted on an ‘action list’ by the ER secretary. The task force leader is responsible for improvements and communicates by e-mail regarding these QC checks, actions and results with the ER secretary.
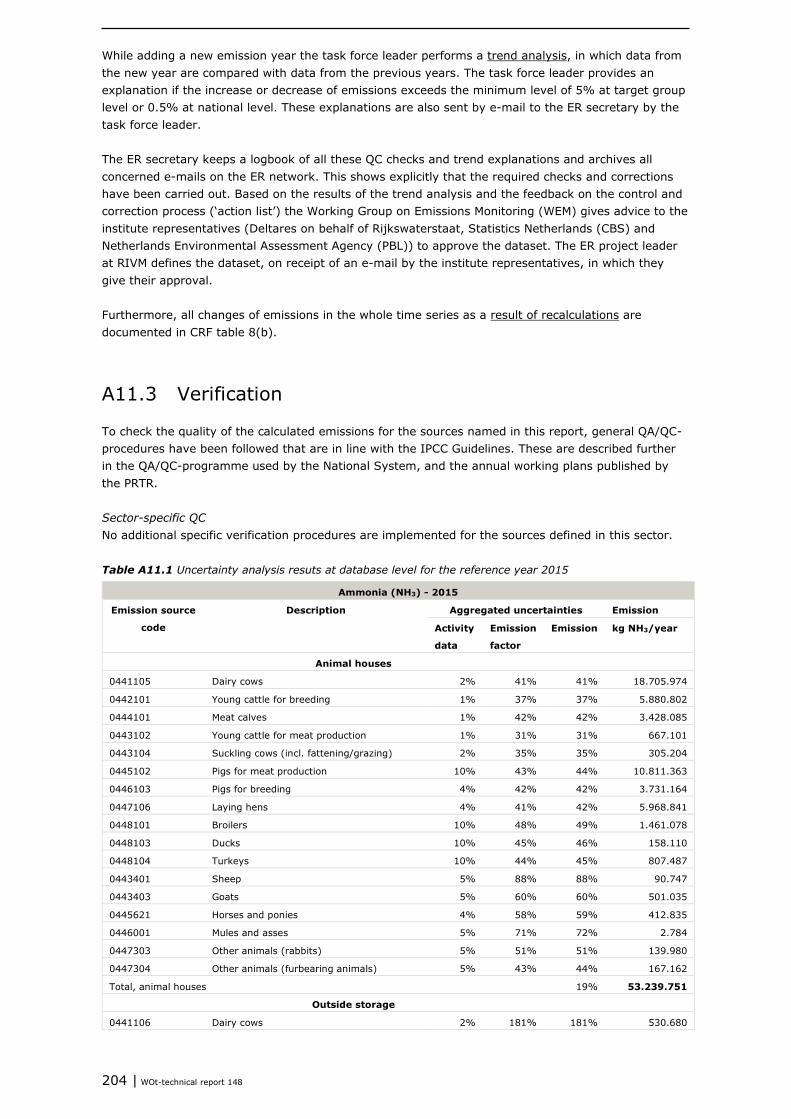
204 | WOt-technical report 148
While adding a new emission year the task force leader performs a trend analysis, in which data from the new year are compared with data from the previous years. The task force leader provides an explanation if the increase or decrease of emissions exceeds the minimum level of 5% at target group level or 0.5% at national level. These explanations are also sent by e-mail to the ER secretary by the task force leader. The ER secretary keeps a logbook of all these QC checks and trend explanations and archives all concerned e-mails on the ER network. This shows explicitly that the required checks and corrections have been carried out. Based on the results of the trend analysis and the feedback on the control and correction process (‘action list’) the Working Group on Emissions Monitoring (WEM) gives advice to the institute representatives (Deltares on behalf of Rijkswaterstaat, Statistics Netherlands (CBS) and Netherlands Environmental Assessment Agency (PBL)) to approve the dataset. The ER project leader at RIVM defines the dataset, on receipt of an e-mail by the institute representatives, in which they give their approval. Furthermore, all changes of emissions in the whole time series as a result of recalculations are documented in CRF table 8(b).
A11.3 Verification
To check the quality of the calculated emissions for the sources named in this report, general QA/QC-procedures have been followed that are in line with the IPCC Guidelines. These are described further in the QA/QC-programme used by the National System, and the annual working plans published by the PRTR. Sector-specific QC No additional specific verification procedures are implemented for the sources defined in this sector. Table A11.1 Uncertainty analysis resuts at database level for the reference year 2015
Ammonia (NH3) - 2015
Emission source
code
Description Aggregated uncertainties Emission
Activity
data
Emission
factor
Emission kg NH3/year
Animal houses
0441105 Dairy cows 2% 41% 41% 18.705.974
0442101 Young cattle for breeding 1% 37% 37% 5.880.802
0444101 Meat calves 1% 42% 42% 3.428.085
0443102 Young cattle for meat production 1% 31% 31% 667.101
0443104 Suckling cows (incl. fattening/grazing) 2% 35% 35% 305.204
0445102 Pigs for meat production 10% 43% 44% 10.811.363
0446103 Pigs for breeding 4% 42% 42% 3.731.164
0447106 Laying hens 4% 41% 42% 5.968.841
0448101 Broilers 10% 48% 49% 1.461.078
0448103 Ducks 10% 45% 46% 158.110
0448104 Turkeys 10% 44% 45% 807.487
0443401 Sheep 5% 88% 88% 90.747
0443403 Goats 5% 60% 60% 501.035
0445621 Horses and ponies 4% 58% 59% 412.835
0446001 Mules and asses 5% 71% 72% 2.784
0447303 Other animals (rabbits) 5% 51% 51% 139.980
0447304 Other animals (furbearing animals) 5% 43% 44% 167.162
Total, animal houses 19% 53.239.751
Outside storage
0441106 Dairy cows 2% 181% 181% 530.680

Methodology for estimating emissions from agriculture in the Netherlands - Update 2019 | 205
Ammonia (NH3) - 2015
0442103 Young cattle for breeding 1% 160% 160% 303.462
0443105 Suckling cows (incl. fattening/grazing) 2% 203% 203% 26.560
0443103 Young cattle for meat production 1% 146% 146% 80.024
0445103 Pigs for meat production 10% 208% 211% 240.122
0446104 Pigs for breeding 4% 166% 166% 123.245
0447107 Laying hens 4% 53% 53% 1.610.897
0448102 Broilers 10% 69% 70% 109.103
0448105 Ducks 10% 66% 67% 10.591
0448106 Turkeys 10% 67% 68% 4.892
0443402 Sheep 5% 269% 269% 10.338
0443404 Goats 5% 245% 245% 95.141
0445622 Horses and ponies 4% 209% 209% 61.594
0446002 Mules and asses 5% 254% 254% 282
0447305 Other animals (rabbits) 5% 238% 238% 6.679
0447306 Other animals (furbearing animals) 5% 211% 211% 27.427
Total, outside storage 47% 3.241.036
Manure treatment
0441404 Dairy cows 50% 40% 67% 166.013
0441405 Young cattle 50% 40% 67% 41.621
0441407 Meat calves 50% 40% 67% 48.010
0441409 Fattening pigs 38% 34% 51% 323.841
0441410 Breeding pigs 44% 39% 59% 129.464
0441412 Laying hens 18% 41% 45% 85.289
0441411 Broilers 23% 28% 36% 19.240
0441413 Turkeys 25% 41% 48% 730
0441400 Dairy cows digestion 50% 40% 67% 31.966
0441401 Young cattle digestion 50% 40% 67% 8.014
0441402 Fattening pigs digestion 50% 40% 67% 114.136
0441403 Breeding pigs digestion 50% 40% 67% 56.730
Total, manure treatment 23% 1.025.055
Pasture land
0441301 Dairy cows 2% 110% 110% 689.897
0442300 Young cattle for breeding 1% 86% 86% 474.900
0443302 Suckling cows (incl. fattening/grazing) 2% 101% 101% 90.515
0443303 Young cattle for meat production 1% 91% 91% 35.725
0443600 Sheep 5% 101% 101% 185.623
0445630 Horses and ponies 4% 88% 88% 105.502
0446004 Mules and asses 5% 107% 107% 746
Total, pasture land 56% 1.582.909
Application
0441200 Dairy cows 2% 69% 69% 18.967.445
0442200 Young cattle for breeding 1% 42% 42% 5.969.149
0443201 Young cattle for meat production 1% 34% 34% 1.203.223
0443202 Suckling cows (incl. fattening/grazing) 2% 42% 42% 493.278
0444200 Meat calves 1% 95% 95% 1.035.559
0445200 Pigs for meat production 10% 78% 79% 3.694.099
0446200 Pigs for breeding 4% 54% 54% 2.688.570
0447200 Laying hens 4% 4% 0% 0
0448200 Broilers 10% 113% 113% 268.154
0448201 Ducks 10% 107% 108% 125.519
0448202 Turkeys 10% 109% 110% 29.295
0443503 Sheep 5% 86% 86% 117.166
0443504 Goats 5% 63% 63% 948.387
0445610 Horses and ponies 4% 56% 56% 610.998

206 | WOt-technical report 148
Ammonia (NH3) - 2015
0446003 Mules and asses 5% 73% 73% 3.822
0447401 Other animals (rabbits) 5% 61% 61% 37.697
0447402 Other animals (furbearing animals) 5% 89% 90% 160.079
Total, application 38% 36.352.441
Other sources
0400700 Fertlizer application 26% 26% 37% 11.704.533
0506802 Sewage sludge 25% 84% 88% 62.115
0400613 Compost 23% 106% 111% 429.821
0444601 Crop residues 7% 59% 59% 1.851.317
0400210 Ripening crops 300% 1.821.429
Total, other sources 44% 15.869.214
Application on nature territory, fertilizer and horses (outside agriculture)
0447011 Application on nature territory 15% 25% 29% 3.337.728
0802001 Horses and ponies outside agriculture 50% 119% 129% 3.043.947
Total, outside agriculture 63% 6.381.674
Total agriculture 25% 111.310.406
Total outside agriculture 63% 6.381.674
Total of all sources 24% 117.692.080
Nitrous oxide (N2O) - 2015
Emission source
code
Description Aggregated uncertainties Emission
Activity
rate
Emission
factor
Emission kg
N2O/year
Manure management
0441101 Cows in milk and in calf 2% 200% 200% 560.016
0441103 Young stock for breeding 1% 200% 200% 207.321
0444102 Meat calves 1% 201% 201% 47.186
0441104 Young stock for fattening 1% 200% 200% 38.438
0442102 Suckling cows 2% 201% 201% 14.315
0446102 Fattening pigs 10% 202% 202% 145.404
0446100 Breeding pigs 4% 201% 201% 78.256
0447104 Laying hens 4% 201% 201% 60.859
0447103 Broilers 10% 207% 207% 33.182
0447108 Ducks 10% 204% 204% 1.084
0447109 Turkeys 10% 203% 203% 2.360
0443100 Sheep 5% 222% 222% 4.932
0444100 Goats 5% 203% 203% 85.362
0445600 Horses and ponies 36% 222% 225% 80.566
0445900 Mules and asses 5% 217% 217% 112
0447110 Rabbits 5% 201% 201% 3.178
0447111 Furbearing animals 5% 202% 202% 7.717
0444701 Atmospheric deposition manure
management
17% 400% 406% 777.013
Total manure management 159% 2.147.301
Manure treatment
0441404 Cows in milk and in calf 50% 200% 229% 46.704
0441405 Young stock for breeding 50% 200% 229% 11.709
0441407 Meat calves 50% 200% 229% 217.459
0441409 Fattening pigs 38% 170% 175% 65.998
0441410 Breeding pigs 44% 197% 202% 26.385
143% 368.255
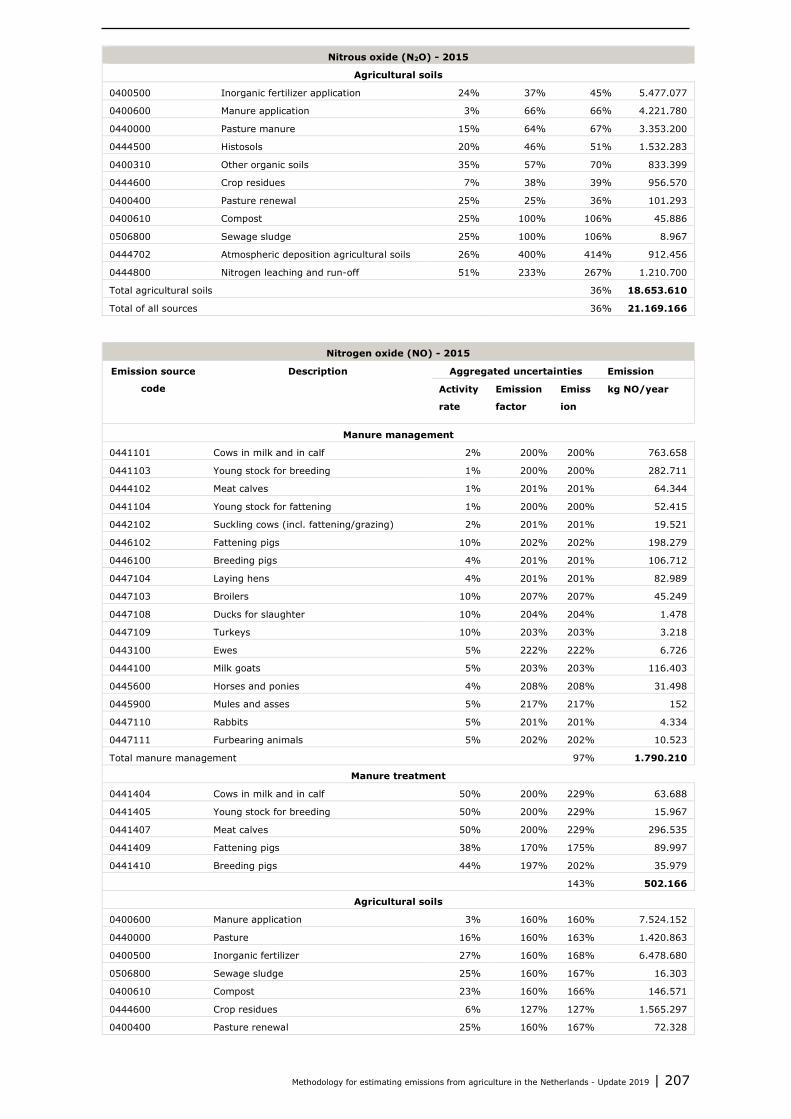
Methodology for estimating emissions from agriculture in the Netherlands - Update 2019 | 207
Nitrous oxide (N2O) - 2015
Agricultural soils
0400500 Inorganic fertilizer application 24% 37% 45% 5.477.077
0400600 Manure application 3% 66% 66% 4.221.780
0440000 Pasture manure 15% 64% 67% 3.353.200
0444500 Histosols 20% 46% 51% 1.532.283
0400310 Other organic soils 35% 57% 70% 833.399
0444600 Crop residues 7% 38% 39% 956.570
0400400 Pasture renewal 25% 25% 36% 101.293
0400610 Compost 25% 100% 106% 45.886
0506800 Sewage sludge 25% 100% 106% 8.967
0444702 Atmospheric deposition agricultural soils 26% 400% 414% 912.456
0444800 Nitrogen leaching and run-off 51% 233% 267% 1.210.700
Total agricultural soils 36% 18.653.610
Total of all sources 36% 21.169.166
Nitrogen oxide (NO) - 2015
Emission source
code
Description Aggregated uncertainties Emission
Activity
rate
Emission
factor
Emiss
ion
kg NO/year
Manure management
0441101 Cows in milk and in calf 2% 200% 200% 763.658
0441103 Young stock for breeding 1% 200% 200% 282.711
0444102 Meat calves 1% 201% 201% 64.344
0441104 Young stock for fattening 1% 200% 200% 52.415
0442102 Suckling cows (incl. fattening/grazing) 2% 201% 201% 19.521
0446102 Fattening pigs 10% 202% 202% 198.279
0446100 Breeding pigs 4% 201% 201% 106.712
0447104 Laying hens 4% 201% 201% 82.989
0447103 Broilers 10% 207% 207% 45.249
0447108 Ducks for slaughter 10% 204% 204% 1.478
0447109 Turkeys 10% 203% 203% 3.218
0443100 Ewes 5% 222% 222% 6.726
0444100 Milk goats 5% 203% 203% 116.403
0445600 Horses and ponies 4% 208% 208% 31.498
0445900 Mules and asses 5% 217% 217% 152
0447110 Rabbits 5% 201% 201% 4.334
0447111 Furbearing animals 5% 202% 202% 10.523
Total manure management 97% 1.790.210
Manure treatment
0441404 Cows in milk and in calf 50% 200% 229% 63.688
0441405 Young stock for breeding 50% 200% 229% 15.967
0441407 Meat calves 50% 200% 229% 296.535
0441409 Fattening pigs 38% 170% 175% 89.997
0441410 Breeding pigs 44% 197% 202% 35.979
143% 502.166
Agricultural soils
0400600 Manure application 3% 160% 160% 7.524.152
0440000 Pasture 16% 160% 163% 1.420.863
0400500 Inorganic fertilizer 27% 160% 168% 6.478.680
0506800 Sewage sludge 25% 160% 167% 16.303
0400610 Compost 23% 160% 166% 146.571
0444600 Crop residues 6% 127% 127% 1.565.297
0400400 Pasture renewal 25% 160% 167% 72.328
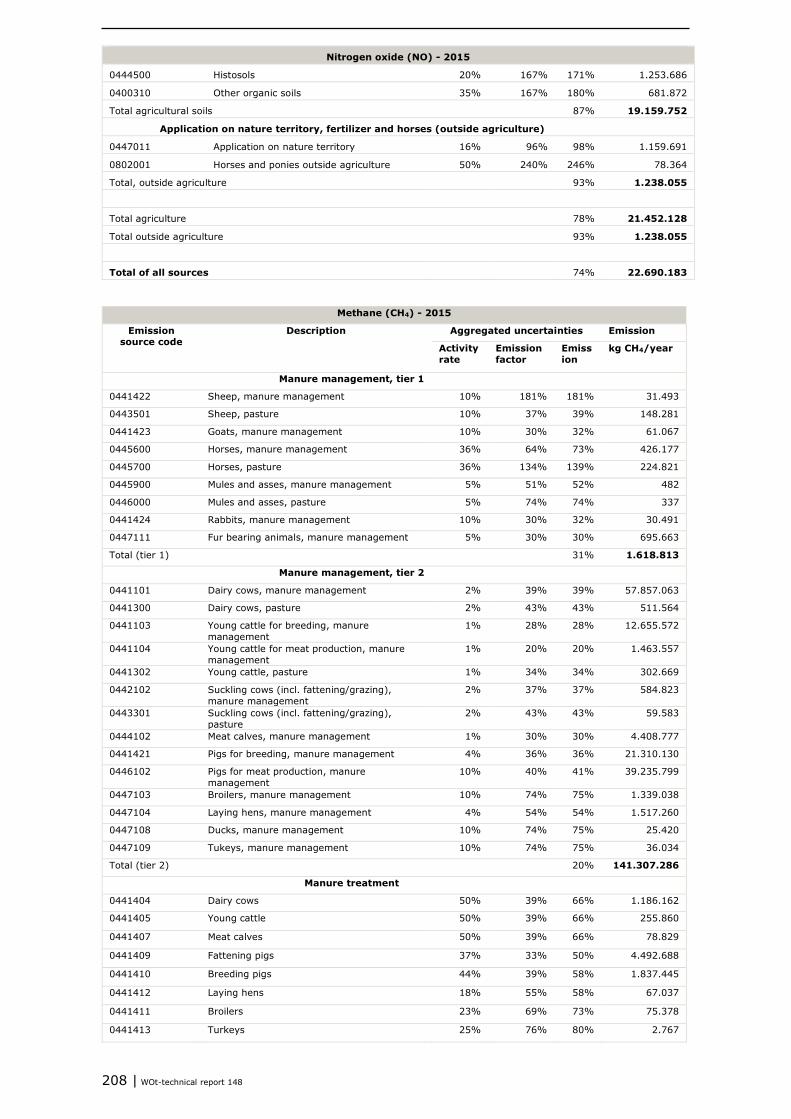
208 | WOt-technical report 148
Nitrogen oxide (NO) - 2015
0444500 Histosols 20% 167% 171% 1.253.686
0400310 Other organic soils 35% 167% 180% 681.872
Total agricultural soils 87% 19.159.752
Application on nature territory, fertilizer and horses (outside agriculture)
0447011 Application on nature territory 16% 96% 98% 1.159.691
0802001 Horses and ponies outside agriculture 50% 240% 246% 78.364
Total, outside agriculture 93% 1.238.055
Total agriculture 78% 21.452.128
Total outside agriculture 93% 1.238.055
Total of all sources 74% 22.690.183
Methane (CH4) - 2015
Emission source code
Description Aggregated uncertainties Emission
Activity rate
Emission factor
Emission
kg CH4/year
Manure management, tier 1
0441422 Sheep, manure management 10% 181% 181% 31.493
0443501 Sheep, pasture 10% 37% 39% 148.281
0441423 Goats, manure management 10% 30% 32% 61.067
0445600 Horses, manure management 36% 64% 73% 426.177
0445700 Horses, pasture 36% 134% 139% 224.821
0445900 Mules and asses, manure management 5% 51% 52% 482
0446000 Mules and asses, pasture 5% 74% 74% 337
0441424 Rabbits, manure management 10% 30% 32% 30.491
0447111 Fur bearing animals, manure management 5% 30% 30% 695.663
Total (tier 1) 31% 1.618.813
Manure management, tier 2
0441101 Dairy cows, manure management 2% 39% 39% 57.857.063
0441300 Dairy cows, pasture 2% 43% 43% 511.564
0441103 Young cattle for breeding, manure management
1% 28% 28% 12.655.572
0441104 Young cattle for meat production, manure management
1% 20% 20% 1.463.557
0441302 Young cattle, pasture 1% 34% 34% 302.669
0442102 Suckling cows (incl. fattening/grazing), manure management
2% 37% 37% 584.823
0443301 Suckling cows (incl. fattening/grazing), pasture
2% 43% 43% 59.583
0444102 Meat calves, manure management 1% 30% 30% 4.408.777
0441421 Pigs for breeding, manure management 4% 36% 36% 21.310.130
0446102 Pigs for meat production, manure management
10% 40% 41% 39.235.799
0447103 Broilers, manure management 10% 74% 75% 1.339.038
0447104 Laying hens, manure management 4% 54% 54% 1.517.260
0447108 Ducks, manure management 10% 74% 75% 25.420
0447109 Tukeys, manure management 10% 74% 75% 36.034
Total (tier 2) 20% 141.307.286
Manure treatment
0441404 Dairy cows 50% 39% 66% 1.186.162
0441405 Young cattle 50% 39% 66% 255.860
0441407 Meat calves 50% 39% 66% 78.829
0441409 Fattening pigs 37% 33% 50% 4.492.688
0441410 Breeding pigs 44% 39% 58% 1.837.445
0441412 Laying hens 18% 55% 58% 67.037
0441411 Broilers 23% 69% 73% 75.378
0441413 Turkeys 25% 76% 80% 2.767

Methodology for estimating emissions from agriculture in the Netherlands - Update 2019 | 209
Methane (CH4) - 2015
0441400 Dairy cows digestion 50% 39% 66% 298.273
0441401 Young cattle digestion 50% 39% 66% 64.339
0441402 Fattening pigs digestion 50% 40% 67% 511.580
0441403 Breeding pigs digestion 50% 40% 67% 270.347
Total, manure treatment 29% 9.140.705
Total (manure) 19% 152.066.805
Fermentation, tier 1
0443500 Sheep 10% 40% 41% 7.569.432
0444501 Goats 10% 40% 41% 2.348.745
0445500 Horses 36% 40% 56% 7.511.526
0445800 Mules and asses 5% 40% 40% 10.780
0446500 Pigs 6% 40% 41% 18.904.332
Total (tier 1) 26% 36.344.815
Fermentation, tier 2 and 3
0441501 Young cattle 1% 11% 11% 88.440.112
0442500 Suckling cows (incl. fattening/grazing) 2% 21% 21% 6.361.936
0441600 Dairy cows NW 3% 21% 21% 87.631.725
0441700 Dairy cows SE 2% 21% 21% 121.597.848
Total (tier 2 and 3)
11% 304.031.622
Total (fermentation) 10% 340.376.437
Total of all sources
9% 492.443.242
Non-methane volatile organic components (NMVOC) - 2015
Emission
source code
Description Aggregated uncertainties Emission
Activity
rate
Emission
factor
Emission kg
NMVOC/year
Manure management
0441103 Young stock for breeding 1% 191% 191% 9.901.924
0441101 Cows in milk and in calf 2% 221% 221% 41.643.326
0444102 Meat calves 1% 231% 231% 1.398.421
0441104 Young stock for fattening 1% 142% 142% 1.650.645
0442102 Suckling cows (incl. fattening/grazing) 2% 307% 307% 303.962
0446102 Fattening pigs 10% 303% 303% 1.082.827
0446100 Breeding pigs 4% 295% 295% 2.285.846
0447103 Broilers 10% 303% 303% 3.852.145
0447104 Layers 4% 218% 218% 3.660.850
0447108 Ducks for slaughter 10% 303% 303% 45.117
0447109 Turkeys 10% 303% 303% 60.304
0443100 Sheep 5% 309% 309% 19.610
0444100 Goats 5% 302% 302% 405.517
0445600 Horses and ponies 4% 272% 272% 71.253
0445900 Mules and asses 5% 309% 309% 274
0447110 Rabbits 5% 302% 302% 2.972
0447111 Fur animals 5% 302% 302% 345.896
Total, manure management 143% 66.730.890
Agricultural soils
0400600 Manure application 4% 127% 127% 12.661.953
0440000 Pasture manure 1% 150% 150% 292.298
0441430 Silage storage 1% 173% 173% 11.562.616
0400201 Crops 13% 218% 218% 1.497.565
Total, crop production and agricultural soils 99% 26.014.431
Total, agriculture 107% 92.745.321

210 | WOt-technical report 148
Non-methane volatile organic components (NMVOC) - 2015
Outside agriculture
0802001 Horses and ponies private 50% 225% 231% 409.784
Total 106% 93.155.105
Particulate matter < 10µm (PM10) - 2015
Emission
source code
Description Aggregated uncertainties Emission
Activity
rate
Emission
factor
Emission kg PM10/year
Manure management
0441103 Young stock for breeding 1% 23% 23% 66.808
0441101 Cows in milk and in calf 2% 24% 24% 206.642
0444102 Meat calves 1% 33% 33% 31.897
0441104 Young stock for fattening 1% 26% 26% 19.861
0442102 Suckling cows (incl. fattening/grazing) 2% 32% 32% 6.934
0446102 Fattening pigs 10% 35% 36% 659.099
0446100 Breeding pigs 7% 31% 32% 315.175
0447103 Broilers 10% 32% 34% 1.283.673
0447104 Layers 4% 36% 37% 2.891.801
0447108 Ducks for slaughter 10% 35% 36% 94.928
0447109 Turkeys 10% 33% 35% 82.069
0447110 Rabbits 5% 49% 49% 515
0447111 Fur-bearing animals 5% 49% 49% 8.287
0443100 Sheep 10% 32% 34% 1.726
0444100 Goats 5% 32% 32% 8.925
0445600 Horses and ponies 4% 40% 40% 25.808
0445900 Mules and asses 5% 40% 40% 172
Total, animal houses 21% 5.704.321
Outside agriculture
0802001 Horses and ponies private 50% 45% 67% 66.000
Agricultural soils
0449300 Concentrates 25% 100% 106% 90.000
0449400 Inorganic fertilizer 25% 100% 106% 105.000
0449500 Pesticides 25% 100% 106% 125.000
0449600 Harvesting 2% 237% 237% 409.863
Total, agricultural soils 136% 729.863
Total agriculture 24% 6.434.184
Total outside agriculture 67% 66.000
Total of all sources 24% 6.500.184
Particulate matter < 2.5 µm (PM2.5) - 2015
Emission source code
Description Aggregated uncertainties Emission
Activity rate
Emission factor
Emission kg PM2.5/year
Manure management
0441103 Young stock for breeding 1% 25% 25% 18.423
0441101 Cows in milk and in calf 2% 26% 26% 56.958
0444102 Meat calves 1% 36% 36% 8.757
0441104 Young stock for fattening 1% 28% 28% 5.468
0442102 Suckling cows (incl. fattening/grazing) 2% 35% 35% 1.914
0446102 Fattening pigs 10% 43% 44% 31.034
0446100 Breeding pigs 7% 30% 31% 15.226
0447103 Broilers 10% 43% 44% 95.948
0447104 Layers 4% 79% 79% 177.061

Methodology for estimating emissions from agriculture in the Netherlands - Update 2019 | 211
Particulate matter < 2.5 µm (PM2.5) - 2015
0447108 Ducks for slaughter 10% 47% 48% 4.545
0447109 Turkeys 10% 45% 46% 38.489
0447110 Rabbits 5% 100% 100% 101
0447111 Fur-bearing animals 5% 100% 100% 4.297
0443100 Sheep 10% 35% 37% 518
0444100 Goats 5% 35% 35% 2.678
0445600 Horses and ponies 4% 40% 40% 16.423
0445900 Mules and asses 5% 40% 40% 108
Total, animal houses 31% 477.949
Outside agriculture
0802001 Horses and ponies private 50% 45% 67% 42.000
Agricultural soils
0449300 Concentrates 25% 100% 106% 18.000
0449400 Inorganic fertilizer 25% 100% 106% 21.000
0449500 Pesticides 25% 100% 106% 25.000
0449600 Harvesting 2% 250% 250% 46.300
Total, agricultural soils 111% 110.300
Total agriculture 33% 588.249
Total outside agriculture 67% 42.000
Total of all sources 31% 630.249
Carbon dioxide (CO2) - 2015
CRF code Description Aggregated uncertainties Emission
Activity rate
Emission factor
Emission kg CO2/year
N320000 Limestone 37% 1% 37% 31.553.454
N320001 Dolomite 34% 1% 34% 37.163.773
Total of all sources 25% 68.717.227
A11.4 References
CBS (2012b). Uncertainty analysis of mineral excretion and manure production. Statistics Netherlands, The Hague/Heerlen, the Netherlands
EEA (2016). EMEP/EEA Air Pollutant Emission Inventory Guidebook, Agriculture European Environment Agency.
Groenestein, C.M., J. Mosquera, and R.W. Melse (2016). Methaanemissie uit mest: schatters voor biochemisch methaan potentieel (BMP) en methaanconversiefactor (MCF) (in Dutch). Wageningen UR Livestock Research, Lelystad, the Netherlands
Huis in 't Veld, J.W.H., F. Dousma, and G.M. Nijeboer (2011). Gasvormige emissies en fijnstof uit konijnenstallen met mestopslag onder de welzijnshokken [Gasesous emissions and fine dust from rabbit housing systems] (in Dutch). Wageningen UR Livestock Research, Lelystad, the Netherlands
IPCC (2006). 2006 IPCC Guidelines for National Greenhouse Gas Inventories. Intergovernmental Panel on Climate Change
Kroeze, C. (1994). Nitrous oxide (N2O) Emission inventory and options for control in the Netherlands, RIVM report 773001004. National Institute for Public Health and the Environment, Bilthoven, the Netherlands.
Mosquera, J., J.M.G. Hol, A. Winkel, E. Lovink, N.W.M. Ogink, and A.J.A. Aarnink (2010b). Fijnstofemissie uit stallen: vleesvarkens [Dust emission from animal houses: growing and finishing pigs] (in Dutch). Report 292. Wageningen UR Livestock Research, Lelystad, the Netherlands
Mosquera, J., J.M.G. Hol, A. Winkel, G.M. Nijeboer, N.W.M. Ogink, and A.J.A. Aarnink (2010c). Fijnstofemissie uit stallen: dragende zeugen [Dust emission from animal houses: pregnant sows] (in Dutch). Wageningen UR Livestock Research, Lelystad, the Netherlands
Mosquera, J., J.M.G. Hol, A. Winkel, J.W.H. Huis in 't Veld, F. Dousma, N.W.M. Ogink, and C.M. Groenestein (2011). Fijnstofemissie uit stallen: nertsen [Dust emission from animal houses: minks] (in Dutch), Report 340. Wageningen UR Livestock Reseach, Lelystad, the Netherlands.
212 | WOt-technical report 148
Mosquera, J., J.M.G. Hol, A. Winkel, J.W.H. Huis in 't Veld, F.A. Gerrits, N.W.M. Ogink, and A.J.A. Aarnink (2010a). Fijnstofemissie uit stallen: melkvee [Dust emission from animal houses: dairy cattle] (in Dutch). Report 296. Wageningen UR Livestock Research, Lelystad, the Netherlands
Winkel, A., J. Mosquera, H.H. Ellen, J.M.G. Hol, G.M. Nijeboer, N.W.M. Ogink, and A.J.A. Aarnink (2011). Fijnstofemissie uit stallen: leghennen in stallen met een droogtunnel [Dust emission from animal houses: layer hens in houses with a tunnel drying system] (in Dutch). Wageningen UR Livestock Research, Lelystad, the Netherlands
Winkel, A., J. Mosquera, R.K. Kwikkel, F.A. Gerrits, N.W.M. Ogink, and A.J.A. Aarnink (2009). Fijnstofemissie uit stallen: vleeskuikens [Dust emission from animal houses: broilers] (in Dutch). Report 275. Wageningen UR Livestock Research, Lelystad, the Netherlands
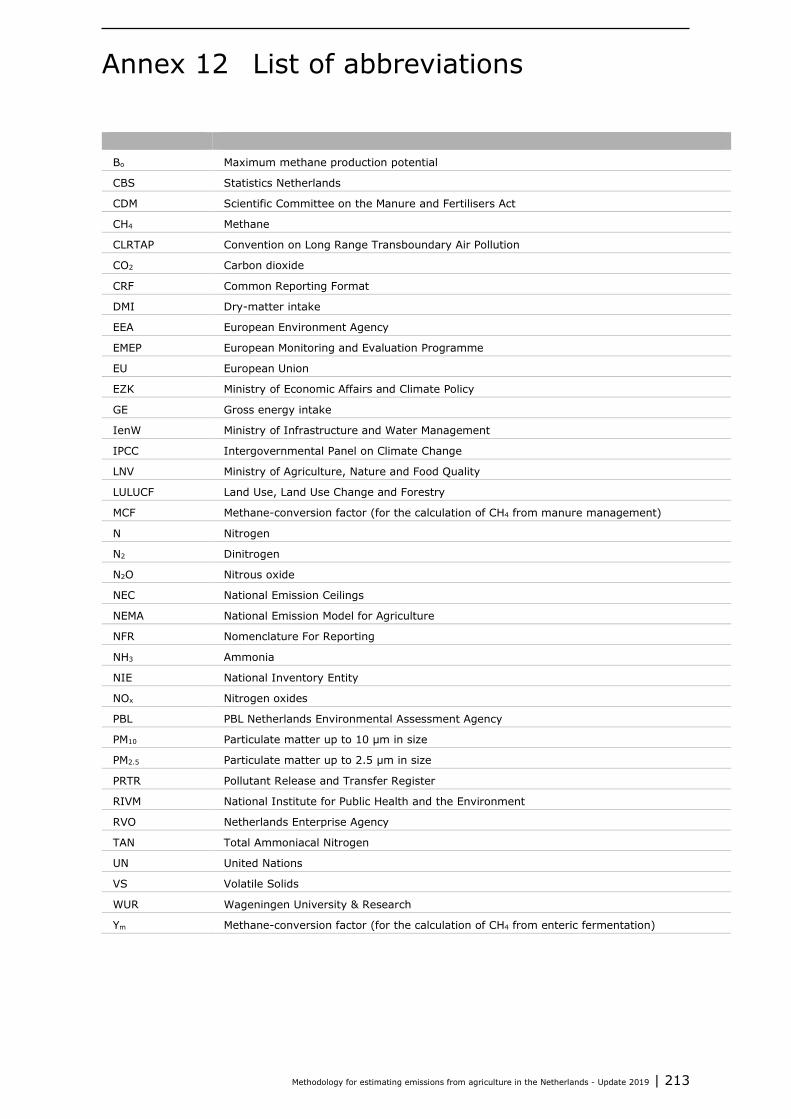
Methodology for estimating emissions from agriculture in the Netherlands - Update 2019 | 213
Annex 12 List of abbreviations
Bo Maximum methane production potential
CBS Statistics Netherlands
CDM Scientific Committee on the Manure and Fertilisers Act
CH4 Methane
CLRTAP Convention on Long Range Transboundary Air Pollution
CO2 Carbon dioxide
CRF Common Reporting Format
DMI Dry-matter intake
EEA European Environment Agency
EMEP European Monitoring and Evaluation Programme
EU European Union
EZK Ministry of Economic Affairs and Climate Policy
GE Gross energy intake
IenW Ministry of Infrastructure and Water Management
IPCC Intergovernmental Panel on Climate Change
LNV Ministry of Agriculture, Nature and Food Quality
LULUCF Land Use, Land Use Change and Forestry
MCF Methane-conversion factor (for the calculation of CH4 from manure management)
N Nitrogen
N2 Dinitrogen
N2O Nitrous oxide
NEC National Emission Ceilings
NEMA National Emission Model for Agriculture
NFR Nomenclature For Reporting
NH3 Ammonia
NIE National Inventory Entity
NOx Nitrogen oxides
PBL PBL Netherlands Environmental Assessment Agency
PM10 Particulate matter up to 10 µm in size
PM2.5 Particulate matter up to 2.5 µm in size
PRTR Pollutant Release and Transfer Register
RIVM National Institute for Public Health and the Environment
RVO Netherlands Enterprise Agency
TAN Total Ammoniacal Nitrogen
UN United Nations
VS Volatile Solids
WUR Wageningen University & Research
Ym Methane-conversion factor (for the calculation of CH4 from enteric fermentation)
214 | WOt-technical report 148
Published documents in the Technical reports series of the Statutory Research Tasks Unit for Nature & the Environment from 2018 onwards. WOt-technical reports are available from the secretary’s office, T 0317 – 48 54 71; E [email protected] Reports can also be downloaded from www.wur.nl/wotnatuurenmilieu.
113 Arets, E.J.M.M., J.W.H van der Kolk, G.M. Hengeveld,
J.P. Lesschen, H. Kramer, P.J. Kuikman & M.J.
Schelhaas (2018). Greenhouse gas reporting for the
LULUCF sector in the Netherlands. Methodological
background, update 2018
114 Bos-Groenendijk, G.I. en C.A.M. van Swaay (2018).
Standaard Data Formulieren Natura 2000-gebieden;
Aanvullingen vanwege wijzigingen in Natura 2000-
aanwijzingsbesluiten
115 Vonk, J. , S.M. van der Sluis, A. Bannink, C. van
Bruggen, C.M. Groenestein, J.F.M. Huijsmans,
J.W.H. van der Kolk, L.A. Lagerwerf, H.H. Luesink,
S.V. Oude Voshaar & G.L. Velthof (2018.)
Methodology for estimating emissions from
agriculture in the Netherlands – update 2018.
Calculations of CH4, NH3, N2O, NOx, PM10, PM2.5
and CO2 with the National Emission Model for
Agriculture (NEMA)
116 IJsseldijk, L.L., M.J.L. Kik, & A. Gröne (2018).
Postmortaal onderzoek van bruinvissen (Phocoena
phocoena) uit Nederlandse wateren, 2017.
Biologische gegevens, gezondheidsstatus en
doodsoorzaken.
117 Mattijssen, T.J.M. & I.J. Terluin (2018). Ecologische
citizen science; een weg naar grotere
maatschappelijke betrokkenheid bij de natuur?
118 Aalbers, C.B.E.M., D. A. Kamphorst & F. Langers
(2018). Bedrijfs- en burgerinitiatieven in stedelijke
natuur. Hun succesfactoren en knelpunten en hoe
de lokale overheid ze kan helpen slagen.
119 Bruggen, C. van, A. Bannink, C.M. Groenestein, J.F.M.
Huijsmans, L.A. Lagerwerf, H.H. Luesink, S.M. van
der Sluis, G.L. Velthof & J. Vonk (2018). Emissies
naar lucht uit de landbouw in 2016. Berekeningen
met het model NEMA
120 Sanders, M.E., F. Langers, R.J.H.G. Henkens, J.L.M.
Donders, R.I. van Dam, T.J.M. Mattijssen & A.E.
Buijs (2018). Maatschappelijke initiatieven voor
natuur en biodiversiteit; Een schets van de
reikwijdte en ecologische effecten en potenties van
maatschappelijke initiatieven voor natuur in feiten
en cijfers
121 Farjon, J.M.J., A.L. Gerritsen, J.L.M. Donders, F.
Langers & W. Nieuwenhuizen (2018). Condities voor
natuurinclusief handelen. Analyse van vier
praktijken van natuurinclusief ondernemen
122 Gerritsen, A.L., D.A. Kamphorst & W. Nieuwenhuizen
(2018). Instrumenten voor maatschappelijke
betrokkenheid. Overzicht en analyse van vier cases
123 Vullings, L.A.E., A.E. Buijs, J.L.M. Donders, D.A.
Kamphorst, H. Kramer & S. de Vries (2018).
Monitoring van groene burgerinitiatieven; Analyse
van de resultaten van een pilot en nulmeting in vier
gemeenten
124 Boonstra, F.G., Th.C.P. Melman, W. Nieuwenhuizen &
A. Gerritsen (2018). Aanpak evaluatie
stelselvernieuwing agrarisch natuurbeheer;
Uitgangspunten en opties voor een beleidsevaluatie
125 Vullings, L.A.E., A.E. Buijs, J.L.M. Donders & D.A.
Kamphorst (2018). Monitoring van groene
burgerinitiatieven; Methodiek, indicatoren en
ervaring met pilot en nulmeting.
126 Beltman, W.H.J., M.M.S. ter Horst, P.I. Adriaanse & A.
de Jong (2018). Manual for FOCUS_TOXSWA v5.5.3
and for expert use of TOXSWA kernel v3.3; User’s
Guide version 5
127 Van der Heide, C.M. & M.M.M. Overbeek (2018).
Natuurinclusief handelen en ondernemen.
Scopingstudie ‘Bedrijven, economie en natuur’
128 Langers, F. (2018). Recreatie in groenblauwe
gebieden; Actualisatie van CLO-indicator 1258
(Bezoek aan groenblauwe gebieden) op basis van
data van het Continu Vrijetijdsonderzoek uit 2015
129 Glorius, S.T., I.Y.M. Tulp, A. Meijboom, L.J. Bolle and
C. Chen (2018). Developments in benthos and fish
in gullies in an area closed for human use in the
Wadden Sea; 2002-2016
130 Kamphorst, D.A & T.J.M. Mattijssen (2018).
Scopingstudie Vermaatschappelijking van natuur.
Een overzicht van onderzoek bij Wageningen
Universiteit & Research voor het Planbureau voor de
Leefomgeving en het ministerie van Landbouw,
Natuur en Voedselkwaliteit
131 Breman, B.C., T.J.M. Mattijssen & T.M. Stevens
(2018). Natuur 2.0. Het natuurdebat op social
media.
132 Vries, S. de & W. Nieuwenhuizen (2018) HappyHier:
hoe gelukkig is men waar?; Gegevensverzameling
en bepaling van de invloed van het type
grondgebruik, deel II
133 Kistenkas, F.H., W. Nieuwenhuizen, D.A. Kamphorst &
M.E.A. Broekmeyer (2018). Natuur- en landschap in
de Omgevingswet.
134 Michels, R, V. Diogo, W.H.G.J. Hennen, L.F. Puister
(2018). Instrumentarium Kosten Natuurbeleid
2018; IKN versie 3.0
135 Sanders, M.E. (2018). Voortgang realisatie
natuurnetwerk. Technische achtergronden bij de
digitale Balans van de Leefomgeving 2018
136 Koffijberg K., J.S.M. Cremer, P. de Boer, J. Nienhuis,
K. Oosterbeek & J. Postma (2018). Broedsucces van
kustbroedvogels in de Waddenzee in 2017

Methodology for estimating emissions from agriculture in the Netherlands - Update 2019 | 215
137 Egmond, F.M. van, S. van der Veeke, M. Knotters,
R.L. Koomans, D. Walvoort, J. Limburg (2018).
Mapping soil texture with a gamma-ray
spectrometer: comparison between UAV and
proximal measurements and traditional sampling;
Validation study
138 Glorius, S.T., A. Meijboom, J.T. Wal van der, J.S.M.
Cremer (2018). Ontwikkeling van enkele
droogvallende mosselbanken in de Nederlandse
Waddenzee; situatie 2017.
139 Berg, F. van den, A. Tiktak, D.W.G. van Kraalingen,
J.G. Groenwold & J.J.T.I. Boesten (2018). User
manual for GeoPEARL version 4.4.4.
140 Kuiters, A.T., G.A. de Groot, D.R. Lammertsma,
H.A.H. Jansman & J. Bovenschen (2018).
Genetische monitoring van de Nederlandse
otterpopulatie; Ontwikkeling van populatieomvang
en genetische status 2017/2018
141 Müskens G.J.D.M., M.J.J. La Haye, R.J.M. van Kats &
A.T. Kuiters (2018). Ontwikkeling van de
hamsterpopulatie in Limburg. Stand van zaken
voorjaar 2018
142 Glorius, S.T. (2018). Ontwikkeling van de
bodemdiergemeenschap in de geulen van
referentiegebied Rottum; Tussenrapportage twaalf
jaar na sluiting (najaar 2017).
143 Brouwer, F., F. de Vries en D.J.J. Walvoort (2018).
Basisregistratie Ondergrond (BRO); Actualisatie
bodemkaart: herkartering van de bodem in
Flevoland
144 Knotters, M. en F.M. van Egmond (2018). Selectie van
inwinningstechnieken voor bodemdata; Selecteren
vanuit de (onderzoeks)vraag
145 Stuyt, L.C.P.M., M. Knotters, D.J.J. Walvoort, F.
Brouwer & H.T.L. Massop (2018). Basisregistratie
Ondergrond - Gd-kartering Laag-Nederland 2018;
Provincie Flevoland
146 Arets, E.J.M.M., J.W.H van der Kolk, G.M. Hengeveld,
J.P. Lesschen, H. Kramer, P.J. Kuikman & M.J.
Schelhaas (2019). Greenhouse gas reporting of the
LULUCF sector in the Netherlands. Methodological
background, update 2019
148 Lagerwerf, L.A., A. Bannink, C. van Bruggen, C.M.
Groenestein, J.F.M. Huijsmans, J.W.H. van der Kolk,
H.H. Luesink, S.M. van der Sluis, G.L. Velthof & J.
Vonk (2019). Methodology for estimating emissions
from agriculture in the Netherlands. Calculations of
CH4, NH3, N2O, NOx, NMVOC, PM10, PM2.5 and
CO2 with the National Emission Model for
Agriculture (NEMA) – update 2019.
Theme Agri-Environment Wettelijke Onderzoekstaken Natuur & MilieuP.O. Box 476700 AA WageningenT (0317) 48 54 71E [email protected]
ISSN 2352-2739
www.wur.nl/wotnatuurenmilieu
The mission of Wageningen University and Research is “To explore the potential of nature to improve the quality of life”. Under the banner Wageningen University & Research, Wageningen University and the specialised research institutes of the Wageningen Research Foundation have joined forces in contributing to finding solutions to important questions in the domain of healthy food and living environment. With its roughly 30 branches, 5,000 employees and 10,000 students, Wageningen University & Research is one of the leading organisations in its domain. The unique Wageningen approach lies in its integrated approach to issues and the collaboration between different disciplines.