METHOD Open Access Improving RNA-Seq expression estimates ... · METHOD Open Access Improving...
14
METHOD Open Access Improving RNA-Seq expression estimates by correcting for fragment bias Adam Roberts 1 , Cole Trapnell 2,3 , Julie Donaghey 2 , John L Rinn 2,3 and Lior Pachter 1,4* Abstract The biochemistry of RNA-Seq library preparation results in cDNA fragments that are not uniformly distributed within the transcripts they represent. This non-uniformity must be accounted for when estimating expression levels, and we show how to perform the needed corrections using a likelihood based approach. We find improvements in expression estimates as measured by correlation with independently performed qRT-PCR and show that correction of bias leads to improved replicability of results across libraries and sequencing technologies. Background RNA-Seq technology offers the possibility of accurately measuring transcript abundances in a sample of RNA by sequencing of double stranded cDNA [1]. Unfortunately, current technological limitations of sequencers require that the cDNA molecules represent only partial frag- ments of the RNA being probed. The cDNA fragments are obtained by a series of steps, often including reverse transcription primed by random hexamers (RH), or by oligo (dT). Most protocols also include a fragmentation step, typically RNA hydrolysis or nebulization, or alter- natively cDNA fragmentation by DNase I treatment or sonication. Many sequencing technologies also require constrained cDNA lengths, so a final gel cutting step for size selection may be included. Figure 1 shows how some of these procedures are combined in a typical experiment. The randomness inherent in many of the preparation steps for RNA-Seq leads to fragments whose starting points (relative to the transcripts from which they were sequenced) appear to be chosen approximately uni- formly at random. This observation has been the basis of assumptions underlying a number of RNA-Seq analy- sis approaches that, in computer science terms, invert the ‘ reduction’ of transcriptome estimation to DNA sequencing [2-6]. However, recent careful analysis has revealed both positional [7] and sequence-specific [8,9] biases in sequenced fragments. Positional bias refers to a local effect in which fragments are preferentially located towards either the beginning or end of transcripts. Sequence-specific bias is a global effect where the sequence surrounding the beginning or end of potential fragments affects their likelihood of being selected for sequencing. These biases can affect expression estimates [10], and it is therefore important to correct for them during RNA-Seq analysis. Although many biases can be traced back to specifics of the preparation protocols (see Figure 2 and [8]), it is currently not possible to predict fragment distributions directly from a protocol. This is due to many factors, including uncertainty in the biochemistry of many steps and the unknown shape and effect of RNA secondary structure on certain procedures [10]. It is therefore desirable to estimate the extent and nature of bias indir- ectly by inferring it from the data (fragment alignments) in an experiment. However, such inference is non-trivial due to the fact that fragment abundances are propor- tional to transcript abundances, so that the expression levels of transcripts from which fragments originate must be taken into account when estimating bias, as Figure 2 demonstrates. At the same time, expression estimates made without correcting for bias may lead to the over- or under-representation of fragments. There- fore the problems of bias estimation and expression esti- mation are fundamentally linked, and must be solved together. Likelihood based approaches are well suited to resolving this difficulty, as the bias and abundance para- meters can be estimated jointly by maximizing a likeli- hood function for the data. * Correspondence: [email protected] 1 Department of Computer Science, 387 Soda Hall, UC Berkeley, Berkeley, CA 94720, USA Full list of author information is available at the end of the article Roberts et al. Genome Biology 2011, 12:R22 http://genomebiology.com/2011/12/3/R22 © 2011 Roberts et al.; licensee BioMed Central Ltd. This is an open access article distributed under the terms of the Creative Commons Attribution License (http://creativecommons.org/licenses/by/2.0), which permits unrestricted use, distribution, and reproduction in any medium, provided the original work is properly cited.
Transcript of METHOD Open Access Improving RNA-Seq expression estimates ... · METHOD Open Access Improving...
METHOD Open Access
Improving RNA-Seq expression estimates bycorrecting for fragment biasAdam Roberts1, Cole Trapnell2,3, Julie Donaghey2, John L Rinn2,3 and Lior Pachter1,4*
Abstract
The biochemistry of RNA-Seq library preparation results in cDNA fragments that are not uniformly distributedwithin the transcripts they represent. This non-uniformity must be accounted for when estimating expressionlevels, and we show how to perform the needed corrections using a likelihood based approach. We findimprovements in expression estimates as measured by correlation with independently performed qRT-PCR andshow that correction of bias leads to improved replicability of results across libraries and sequencing technologies.
BackgroundRNA-Seq technology offers the possibility of accuratelymeasuring transcript abundances in a sample of RNA bysequencing of double stranded cDNA [1]. Unfortunately,current technological limitations of sequencers requirethat the cDNA molecules represent only partial frag-ments of the RNA being probed. The cDNA fragmentsare obtained by a series of steps, often including reversetranscription primed by random hexamers (RH), or byoligo (dT). Most protocols also include a fragmentationstep, typically RNA hydrolysis or nebulization, or alter-natively cDNA fragmentation by DNase I treatment orsonication. Many sequencing technologies also requireconstrained cDNA lengths, so a final gel cutting step forsize selection may be included. Figure 1 shows howsome of these procedures are combined in a typicalexperiment.The randomness inherent in many of the preparation
steps for RNA-Seq leads to fragments whose startingpoints (relative to the transcripts from which they weresequenced) appear to be chosen approximately uni-formly at random. This observation has been the basisof assumptions underlying a number of RNA-Seq analy-sis approaches that, in computer science terms, invertthe ‘reduction’ of transcriptome estimation to DNAsequencing [2-6]. However, recent careful analysis hasrevealed both positional [7] and sequence-specific [8,9]biases in sequenced fragments. Positional bias refers to a
local effect in which fragments are preferentially locatedtowards either the beginning or end of transcripts.Sequence-specific bias is a global effect where thesequence surrounding the beginning or end of potentialfragments affects their likelihood of being selected forsequencing. These biases can affect expression estimates[10], and it is therefore important to correct for themduring RNA-Seq analysis.Although many biases can be traced back to specifics
of the preparation protocols (see Figure 2 and [8]), it iscurrently not possible to predict fragment distributionsdirectly from a protocol. This is due to many factors,including uncertainty in the biochemistry of many stepsand the unknown shape and effect of RNA secondarystructure on certain procedures [10]. It is thereforedesirable to estimate the extent and nature of bias indir-ectly by inferring it from the data (fragment alignments)in an experiment. However, such inference is non-trivialdue to the fact that fragment abundances are propor-tional to transcript abundances, so that the expressionlevels of transcripts from which fragments originatemust be taken into account when estimating bias, asFigure 2 demonstrates. At the same time, expressionestimates made without correcting for bias may lead tothe over- or under-representation of fragments. There-fore the problems of bias estimation and expression esti-mation are fundamentally linked, and must be solvedtogether. Likelihood based approaches are well suited toresolving this difficulty, as the bias and abundance para-meters can be estimated jointly by maximizing a likeli-hood function for the data.
* Correspondence: [email protected] of Computer Science, 387 Soda Hall, UC Berkeley, Berkeley, CA94720, USAFull list of author information is available at the end of the article
Roberts et al. Genome Biology 2011, 12:R22http://genomebiology.com/2011/12/3/R22
© 2011 Roberts et al.; licensee BioMed Central Ltd. This is an open access article distributed under the terms of the Creative CommonsAttribution License (http://creativecommons.org/licenses/by/2.0), which permits unrestricted use, distribution, and reproduction inany medium, provided the original work is properly cited.
1. fragmentation of RNA
2. random priming to make sscDNArst-strand synthesis)
3. construction of dscDNA(second-strand synthesis)
4. size selection
5. sequencing
6. mapping
RNA molecules
RNA fragments
sscDNA
dscDNA
Gel cutout
RNA sequence
paired-end read
sense
anti-sense
shortlong
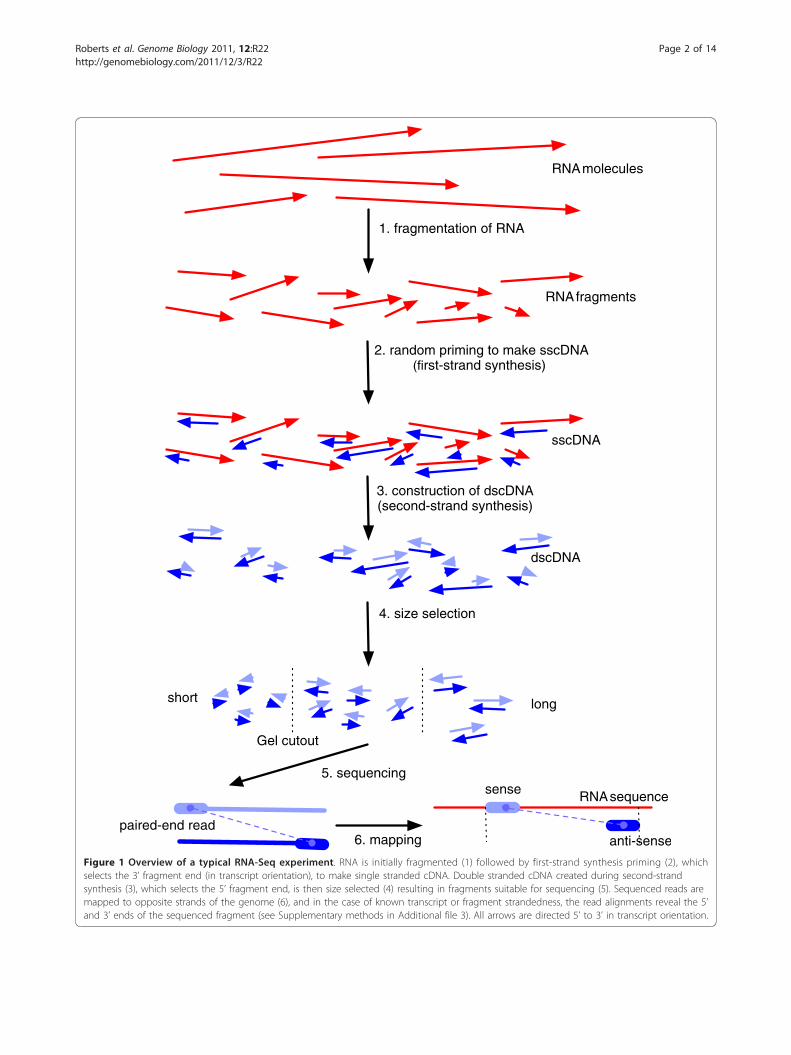
Figure 1 Overview of a typical RNA-Seq experiment. RNA is initially fragmented (1) followed by first-strand synthesis priming (2), whichselects the 3’ fragment end (in transcript orientation), to make single stranded cDNA. Double stranded cDNA created during second-strandsynthesis (3), which selects the 5’ fragment end, is then size selected (4) resulting in fragments suitable for sequencing (5). Sequenced reads aremapped to opposite strands of the genome (6), and in the case of known transcript or fragment strandedness, the read alignments reveal the 5’and 3’ ends of the sequenced fragment (see Supplementary methods in Additional file 3). All arrows are directed 5’ to 3’ in transcript orientation.
Roberts et al. Genome Biology 2011, 12:R22http://genomebiology.com/2011/12/3/R22
Page 2 of 14

Our main result is the development of a likelihoodbased approach for simultaneous estimation of bias para-meters and expression levels using the likelihood frame-work of [6]. This complements work of [8,10] wherecorrections are developed based on another likelihoodmodel, and also extends their work by incorporatingsimultaneous estimation and correction of positionalbias. We demonstrate that our method improves expres-sion estimates in comparison with independentlyobtained qRT-PCR on a benchmark dataset. Using thesame data, we also show that our method improves onthe approaches of [8,10]. RNA-Seq technology is chan-ging rapidly, and this is evident in the development of
numerous preparation protocols (for a recent review see[11]) and increasingly longer read lengths from sequen-cing machines [12]. When assessing the impact of biascorrection, we have therefore included both early RNA-Seq data of the type that many laboratories might be pro-ducing with older machines, as well as newer data thatreflects recent protocol choices and demonstrates theimprovements in sequencing technologies. This hasrequired us to make our methods robust to both single-and paired-end reads, strand specific and non-specificprotocols, and a variety of priming and fragmentationmethods. One of our main findings is that bias correctionimproves the correlation of expression estimates obtained
WebLogo 3.0
0.0
0.5
1.0
de
nsity
-10TCGA
TCAG
TCAGTCGA
CTGA
-5TCAG
GTACCGATCTAGTCGA
0CTAGTCAGTCAGACTGTCAG
5TACGCTGACTAGCTGACTGA
10CTAGCTGACTGA
WebLogo 3.0
0.0
0.5
1.0
de
nsity
-10GCTAGCTACGTACGTAGCTA
-5CGTAGCTA
GCATCTAGCGTA
0CTAG
CTAGCTGACATG
CTAG
5CTAG
CGTACGTACGTACGTA
10CGTACGTACGTA
WebLogo 3.0
0.0
0.5
1.0
-10AGCTGACTGACTGACTGACT
-5GACTGACTAGTCAGTCAGTC
0GATCAGTCAGCTGACTGATC
5GATCGATCGATCGATCAGTC
10AGTCAGTCGACT
WebLogo 3.0
0.0
0.5
1.0
-10GCATGCATGCATGCATGCAT
-5CGATGCATGACTGACTAGTC
0GACTAGCTGACTGACTGATC
5GACTGACTGACTGCATGCAT
10GCATGCATGCAT
WebLogo 3.0
0.0
0.5
1.0
de
nsity
-10CGTACGTACGTACGTACGTA
-5CGTACGTACGTACGTACGTA
0CGTACGTACGTACGTACGTA
5CGTACGTACGTACGTACGTA
10CGTACGTACGTA
3' fragment end5' fragment end
(b)
(c)
(d)
(a)
WebLogo 3.0
0.0
0.5
1.0
-10GCATGCATGCATGCATGCAT
-5GCATGCATGCATGCATGCAT
0GCATGCATGCATGCATGCAT
5GCATGCATGCATGCATGCAT
10GCATGCATGCAT
Norm
aliz
ed
Count
Expecte
d
Offset from 5' fragment end Offset from 3' fragment end
Ratio (
bia
s w
eig
ht)
-10 -5 0 5 10- -
-10 -5 0 5 10- -
-10 -5 0 5 10- -
Figure 2 Nucleotide distribution surrounding fragment ends and calculation of bias weights. (a) Sequence logos showing the distributionof nucleotides in a 23 bp window surrounding the ends of fragments from an experiment primed with ‘not not so random’ (NNSR) hexamers[11]. The 3’ end sequences are complemented (but not reversed) to show the sequence of the primer during first-strand synthesis (see Figure 1).The offset is calculated so that zero is the ‘first’ base of the end sequence and only non-negative values are internal to the fragment. Countswere taken only from transcripts mapping to single-isoform genes. (b) Sequence logo showing normalized nucleotide frequencies afterreweighting by initial (not bias corrected) FPKM in order to account for differences in abundance. (c) The background distribution for the yeasttranscriptome, assuming uniform expression of all single-isoform genes. The difference in 5’ and 3’ distributions are due to the ends beingprimed from opposite strands. Comparing (c) to (a) and (b) shows that while the bias is confounded with expression in (a), the abundancenormalization reveals the true bias to extend from 5 bp upstream to 5 bp downstream of the fragment end. Taking the ratio of the normalizednucleotide frequencies (b) to the background (c) for the NNSR dataset gives bias weights (d), which further reveal that the bias is partially dueto selection for upstream sequences similar to the strand tags, namely TCCGATCTCT in first-strand synthesis (which selects the 5’ end) andTCCGATCTGA in second-strand synthesis (which selects the 3’ end). Although the weights here are based on independent frequencies, we foundcorrelations among sites in the window and take these into account in our full model to produce more informative weights (see Supplementarymethods in Additional file 3). A similar figure to this for the standard Illumina Random Hexamer protocol and plots similar to (d) for all datasetsin the paper can be found in Figures S1 and S2 of Additional file 1 respectively.
Roberts et al. Genome Biology 2011, 12:R22http://genomebiology.com/2011/12/3/R22
Page 3 of 14

from sequence data generated using different sample pre-parations and different sequencing technologies.
Results and DiscussionEstimating fragment bias in existing protocolsFragment counts in an RNA-Seq experiment are deter-mined by two different phenomena: fragments originat-ing from highly expressed transcripts will appear moreoften in the data than those originating from lower-expressed transcripts, and library preparations includebiases that may preferentially select some potential frag-ments over others. By fragment bias we mean only theover- or under-representation of fragments due tosequence-specific or positional bias as discussed in theBackground. Because expression levels also affect frag-ment abundances, it is necessary to jointly estimatetranscript abundances and bias parameters in order toproperly learn the bias directly from RNA-Seq data.This issue is illustrated by example in Figure 2 where
the need for joint estimation of bias parameters andexpression values is evidenced by comparison of theraw counts of bases at the starts/ends of fragments(panel a) and the adjusted counts normalized by theabundances of transcripts (panel b). The latter calcula-tion is affected by the bias parameters, so that jointestimation is required. We expanded the likelihood fra-mework described in [6] in order to perform suchparameter estimation (see Materials and methods),resulting in ‘learned’ bias weights (panel d Figure 2)that were used to adjust expected fragment counts inthe computation of abundances using our likelihoodmodel. Figure 3 shows an example of how well thesebias estimates capture the over- and under-representa-tions of reads at different positions of a transcript,based on its sequence.
Validation by comparison to alternative expression assaysWe emphasize that our goal was not to validate RNA-Seq per se, but rather to show that bias correctionimproves expression estimation. Therefore, in interpret-ing the correlations throughout the paper, we focusedon improvements in correlation with bias correctionand not on the absolute value. In this regard, we reportmost of our results as fraction discrepancy explained,which we calculated by dividing the change in R2 afterbias correction by the difference of the initial R2 from 1(a perfect correlation). Selected correlation plots can befound in Figure S3 of Additional file 1 and all rawexpression data in Additional file 2. Furthermore, wemention that we observed that correlation results weresensitive to the extent of filtering of low abundancefragments and we therefore attempted to eliminate fil-tering in the experiments we performed (see Materialsand methods for more detail).
A major problem with validating RNA-Seq expressionestimates is that there is no clear ‘gold standard’ forexpression estimation. Comparison of RNA-Seq tomicroarrays has suggested that the former technology ismore accurate than the latter [13]. We examined therecently published NanoString nCounter gene expres-sion system [14], but noticed many unexplainable out-liers and high variance between technical replicates (seeFigure S4 of Additional file 1 and data in Additional file2). Quantitative reverse transcription PCR (qRT-PCR)has served as a benchmark in numerous studies but it isnot a perfect expression measurement assay [15], and itis therefore a priori unclear which technology currentlyproduces the most accurate expression estimates. Never-theless, at present we believe it to be the best measureof expression aside from, perhaps, RNA-Seq itself. Dueto the previously demonstrated superiority of RNA-Seqover microarrays, and the problems with NanoString,we performed all our benchmarking with respect toqRT-PCR.We began by comparing the expression estimates on
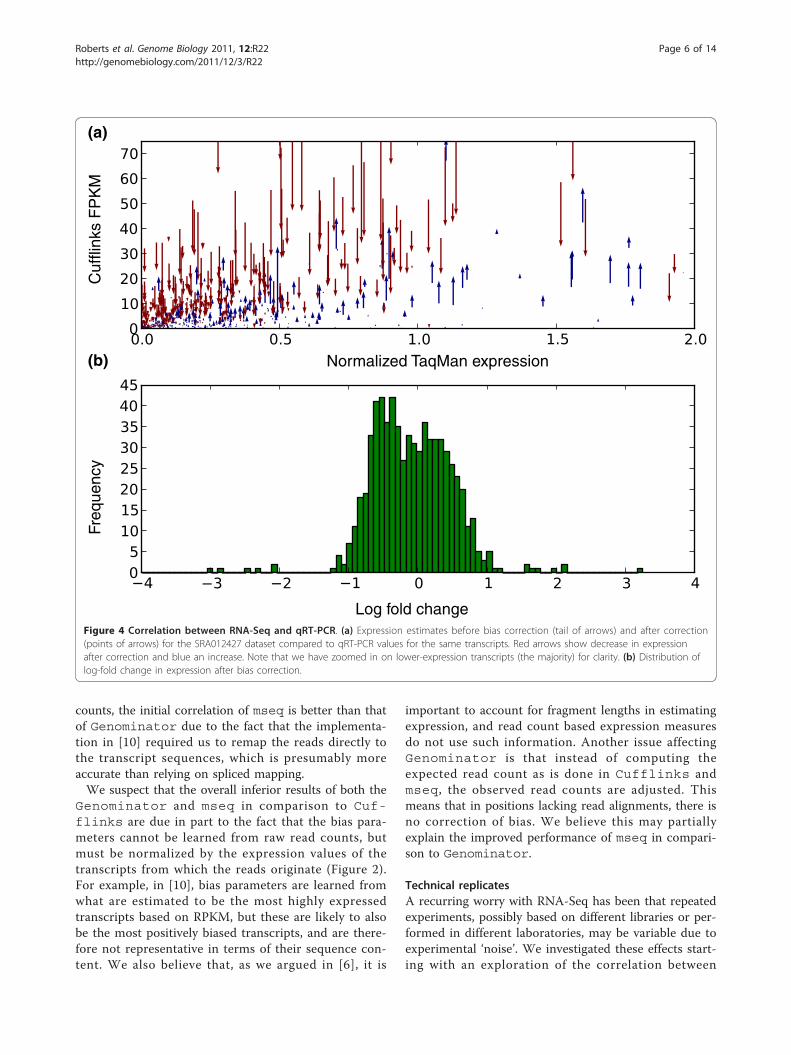
the Microarray Quality Control (MAQC) Human BrainReference (HBR) dataset, which includes 907 transcriptswith uniquely mapping TaqMan qRT-PCR probes [16],with RNA-Seq data from the same sample sequenced byIllumina (SRA012427) [17] (Figure 4). We examined thecorrelation of the Cufflinks output with the qRT-PCR expression data and observed an increase of R2
from 0.753 before correction to 0.807 after correction.We examined the basis for change in correlation by
further investigating, for each transcript, whether itsexpression estimate increased or decreased after biascorrection, and by how much. The arrows in Figure 4show the direction and extent of expression change withcorrection, and the overall fold-change distribution.Many fragments show large changes in expression witha median absolute fold change of 1.5 (Figure 4b). Toestablish the significance of the improvement in correla-tion, we performed a permutation test where we chan-ged the expression estimates of transcripts randomlyaccording to the fold change distribution in Figure 4b.We obtained a P-value of 0.0007, meaning that theimprovement in R2 our correction accomplishes ishighly significant. Together, these results show that biascorrection may dramatically affect expression estimatesvia both increases and decreases of expression values,and that these changes provide an overall improvementin abundance estimates.
Comparison with previous methodsIn [8], a method for bias correction is proposed that isbased on correcting read counts for transcripts accord-ing to the bias learned for patterns at the start of reads(normalized using sequences in the interior of reads).
Roberts et al. Genome Biology 2011, 12:R22http://genomebiology.com/2011/12/3/R22
Page 4 of 14

This approach uses less information than our method,as it is restricted to learning bias within the readsequence, and cannot capture bias surrounding the startsite. Furthermore, count-based methods do not fullyexploit the information available in paired-end readswhich allow for the determination of fragment length.Fragment length can help in assigning ambiguouslymapped fragments to transcripts and our method takesadvantage of this. On the other hand, since read countshave been promoted as an acceptable way to measureabundance [18], we compared the method to ours usingthe MAQC qRT-PCR data from the previous section.Figure 5 shows the results of the method of [8], bothbefore and after bias correction (R2 = 0.711 before andR2 = 0.715 after correction). To obtain these results weused the software package Genominator[8], following
the guidelines in the documentation, with the exceptionthat bias was learned separately for each chromosome,as the software was not able to load an entire genomeinto memory. More details are provided in the Materialsand methods section.We also compared our approach to the mseq method
in [10]. We again used the MAQC HBR qRT-PCR dataand this time prepared the sequences and learned para-meters for models following the suggested guidelines in[10], that is we trained the parameters of a MARTmodel for bias by learning from the 100 most expressedtranscripts in the experiment, and then tested on the setof 907 transcripts with uniquely mapping TaqManprobes. In this case, we observed an uncorrected R2 =0.730 and corrected R2 = 0.755. Note that the eventhough the expression was again calculated using
Read c
ounts
Bia
s w
eig
ht
NM_004684
Offset from start of transcript
Figure 3 Bias correction within transcripts. An example showing the effect of bias correction on the read counts for human transcriptNM_004684. The top panel shows raw read counts (number of 3’ ends of fragments at each location), and the bottom panel shows theproduct of the bias parameters (total bias weight defined in the Supplementary methods in Additional file 3) at the same locations. We correctlyidentify bias at different positions and can therefore correct for the non-uniformity. Note that the bias parameters were learned from the entiredataset excluding reads mapped to this transcript in order to cross-validate our results. The RNA-Seq for the experiment was performed with theNSR protocol [21], which is why 3’ counts were used instead of 5’.
Roberts et al. Genome Biology 2011, 12:R22http://genomebiology.com/2011/12/3/R22
Page 5 of 14
counts, the initial correlation of mseq is better than thatof Genominator due to the fact that the implementa-tion in [10] required us to remap the reads directly tothe transcript sequences, which is presumably moreaccurate than relying on spliced mapping.We suspect that the overall inferior results of both the
Genominator and mseq in comparison to Cuf-flinks are due in part to the fact that the bias para-meters cannot be learned from raw read counts, butmust be normalized by the expression values of thetranscripts from which the reads originate (Figure 2).For example, in [10], bias parameters are learned fromwhat are estimated to be the most highly expressedtranscripts based on RPKM, but these are likely to alsobe the most positively biased transcripts, and are there-fore not representative in terms of their sequence con-tent. We also believe that, as we argued in [6], it is
important to account for fragment lengths in estimatingexpression, and read count based expression measuresdo not use such information. Another issue affectingGenominator is that instead of computing theexpected read count as is done in Cufflinks andmseq, the observed read counts are adjusted. Thismeans that in positions lacking read alignments, there isno correction of bias. We believe this may partiallyexplain the improved performance of mseq in compari-son to Genominator.
Technical replicatesA recurring worry with RNA-Seq has been that repeatedexperiments, possibly based on different libraries or per-formed in different laboratories, may be variable due toexperimental ‘noise’. We investigated these effects start-ing with an exploration of the correlation between
Normalized TaqMan expression
Log fold change
Cufflin
ks F
PK
MF
requency
(a)
(b)
Figure 4 Correlation between RNA-Seq and qRT-PCR. (a) Expression estimates before bias correction (tail of arrows) and after correction(points of arrows) for the SRA012427 dataset compared to qRT-PCR values for the same transcripts. Red arrows show decrease in expressionafter correction and blue an increase. Note that we have zoomed in on lower-expression transcripts (the majority) for clarity. (b) Distribution oflog-fold change in expression after bias correction.
Roberts et al. Genome Biology 2011, 12:R22http://genomebiology.com/2011/12/3/R22
Page 6 of 14

technical replicates before and after bias correction. Wedefine technical replicates to be the sequencing of twodifferent libraries that have been prepared using thesame protocol from a single sample. This differs slightlyfrom some previous uses; in particular, technical replica-tion has also referred to two sequencing experimentsfrom the same library. Such replicates have already beenshown to exhibit very little variability [18,19].We postulated that the differences between expression
estimates from two different libraries should be reducedafter bias correction. We tested this hypothesis in a ser-ies of analyses whose results are shown in Figure 6.First, we examined libraries prepared in two differentexperiments from the same MAQC Universal HumanReference (UHR) sample. In the first experiment [20],which we will refer to by its accession SRA008403, thesample was sequenced from one library preparation. Inthe second experiment [19], which we will refer to asSRA010153, the sample was sequenced in four separatelibrary preparations. Although the same protocol wasused in all five replicates, the learned bias weights differsomewhat between the data produced by the two labs(see Figure S2 in Additional file 1).Figure 6 shows how correlations of the replicates with
qRT-PCR and each other were affected by bias correc-tion. Although the method does improve the pairwisecorrelations between different library preparationswithin SRA010153, the initial correlation is already sohigh (average R2 > 0.96) that we only show the average
pairwise correlations against qRT-PCR and theSRA008403 dataset. The greater correlation among theSRA010153 replicates as compared to the correlationbetween them and SRA008403 further indicates thatbias is more similar when the protocol is carried out bythe same lab, presumably by the same person. Bias cor-rection clearly recovers much of the differences in quan-tification between the replicates introduced by sequenceand positional bias. Furthermore, as in the initial valida-tion example, the correction brings both sets closer inline with the qRT-PCR standard.
Library preparation methodsIn Figure 7 we demonstrate our ability to correct bias spe-cific to libraries prepared using different protocols. Forthis experiment, we tried our method on several librariesfrom a study comparing strand-specific protocols(SRA020818) using the same yeast sample [11], as well asa dataset generated using the ‘not so random’ (NSR) prim-ing protocol on the human MAQC HBR sample [21]. Wecompared all of these datasets with a standard RandomHexamer (RH) control for the given sample. Note thatalthough the control (RH) and dUTP libraries have the
Genominator mseq Cufflinks
CorrectedInitial
R2
0.5
0.6
0.7
0.8
0.9
1.0
Figure 5 Comparison with previous methods. A comparison ofour method (Cufflinks) with Genominator[8] and mseq[10].The y-axis shows the R2 value for the correlation betweenuncorrected (green) and bias corrected (orange) RNA-Seqexpression estimates and qRT-PCR for the three methods.Correlation plots for these data can be found in Figure S3 ofAdditional file 1.
Sequence specific + positionalSequence specific
Fra
ctio
n e
xp
lain
ed
dis
cre
pa
ncy
0.0
0.1
0.2
0.3
0.4
SRA008403 SRA010153 SRA008403vs. qPCR vs. qPCR vs. SRA010153
Figure 6 Variable technical replicates. Results of correlation testsshowing improvement after bias correction for technical replicates.Fraction Explained Discrepancy was calculated by dividing thechange in R2 after bias correction by the difference of the initial R2
from one (a perfect correlation). Note that when two RNA-Seqdatasets are compared, the correction in the legend was applied toboth. The pairwise correlations of the four SRA010153 replicatesversus qRT-PCR and SRA008403, respectively, were averaged for thefigure. Even though the same RH priming protocol was used inboth labs, the bias differs slightly (see Figure S2 of Additional file 1)between the preps, which is why our correction method was ableto improve the correlation.
Roberts et al. Genome Biology 2011, 12:R22http://genomebiology.com/2011/12/3/R22
Page 7 of 14
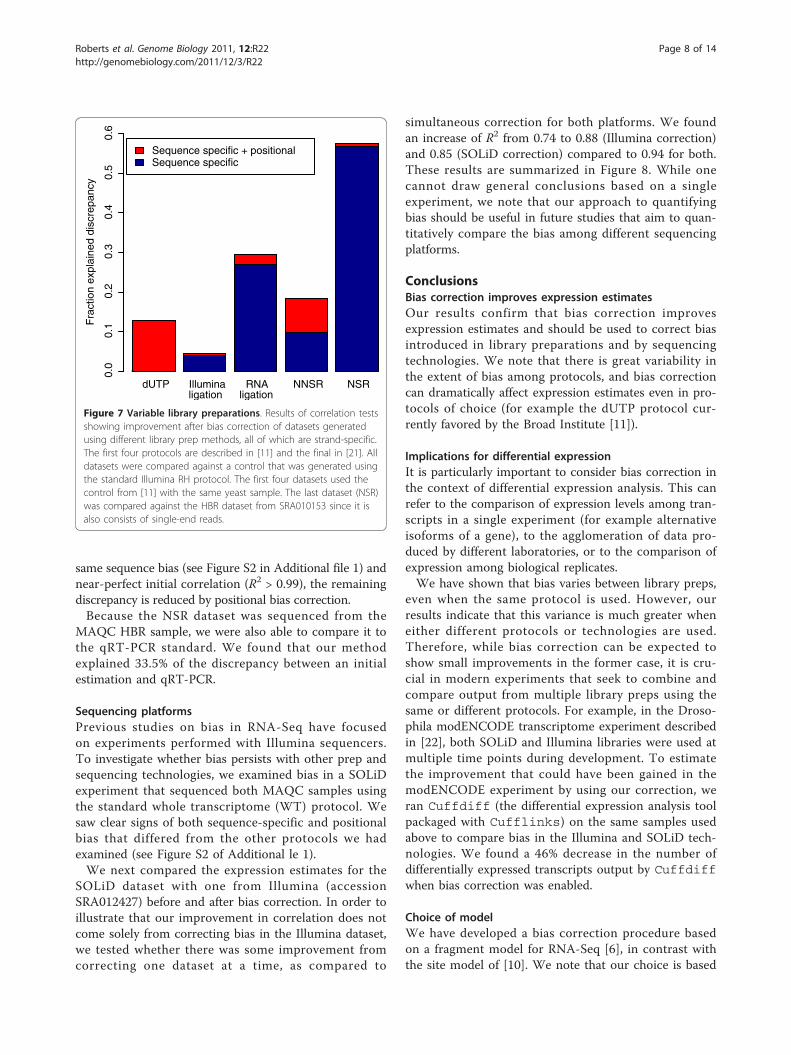
same sequence bias (see Figure S2 in Additional file 1) andnear-perfect initial correlation (R2 > 0.99), the remainingdiscrepancy is reduced by positional bias correction.Because the NSR dataset was sequenced from the
MAQC HBR sample, we were also able to compare it tothe qRT-PCR standard. We found that our methodexplained 33.5% of the discrepancy between an initialestimation and qRT-PCR.
Sequencing platformsPrevious studies on bias in RNA-Seq have focusedon experiments performed with Illumina sequencers.To investigate whether bias persists with other prep andsequencing technologies, we examined bias in a SOLiDexperiment that sequenced both MAQC samples usingthe standard whole transcriptome (WT) protocol. Wesaw clear signs of both sequence-specific and positionalbias that differed from the other protocols we hadexamined (see Figure S2 of Additional le 1).We next compared the expression estimates for the
SOLiD dataset with one from Illumina (accessionSRA012427) before and after bias correction. In order toillustrate that our improvement in correlation does notcome solely from correcting bias in the Illumina dataset,we tested whether there was some improvement fromcorrecting one dataset at a time, as compared to
simultaneous correction for both platforms. We foundan increase of R2 from 0.74 to 0.88 (Illumina correction)and 0.85 (SOLiD correction) compared to 0.94 for both.These results are summarized in Figure 8. While onecannot draw general conclusions based on a singleexperiment, we note that our approach to quantifyingbias should be useful in future studies that aim to quan-titatively compare the bias among different sequencingplatforms.
ConclusionsBias correction improves expression estimatesOur results confirm that bias correction improvesexpression estimates and should be used to correct biasintroduced in library preparations and by sequencingtechnologies. We note that there is great variability inthe extent of bias among protocols, and bias correctioncan dramatically affect expression estimates even in pro-tocols of choice (for example the dUTP protocol cur-rently favored by the Broad Institute [11]).
Implications for differential expressionIt is particularly important to consider bias correction inthe context of differential expression analysis. This canrefer to the comparison of expression levels among tran-scripts in a single experiment (for example alternativeisoforms of a gene), to the agglomeration of data pro-duced by different laboratories, or to the comparison ofexpression among biological replicates.We have shown that bias varies between library preps,
even when the same protocol is used. However, ourresults indicate that this variance is much greater wheneither different protocols or technologies are used.Therefore, while bias correction can be expected toshow small improvements in the former case, it is cru-cial in modern experiments that seek to combine andcompare output from multiple library preps using thesame or different protocols. For example, in the Droso-phila modENCODE transcriptome experiment describedin [22], both SOLiD and Illumina libraries were used atmultiple time points during development. To estimatethe improvement that could have been gained in themodENCODE experiment by using our correction, weran Cuffdiff (the differential expression analysis toolpackaged with Cufflinks) on the same samples usedabove to compare bias in the Illumina and SOLiD tech-nologies. We found a 46% decrease in the number ofdifferentially expressed transcripts output by Cuffdiffwhen bias correction was enabled.
Choice of modelWe have developed a bias correction procedure basedon a fragment model for RNA-Seq [6], in contrast withthe site model of [10]. We note that our choice is based
Sequence specific + positionalSequence specific
Fra
ction e
xpla
ined d
iscre
pancy
0.0
0.1
0.2
0.3
0.4
0.5
0.6
dUTP Illumina RNA NNSR NSRligation ligation
Figure 7 Variable library preparations. Results of correlation testsshowing improvement after bias correction of datasets generatedusing different library prep methods, all of which are strand-specific.The first four protocols are described in [11] and the final in [21]. Alldatasets were compared against a control that was generated usingthe standard Illumina RH protocol. The first four datasets used thecontrol from [11] with the same yeast sample. The last dataset (NSR)was compared against the HBR dataset from SRA010153 since it isalso consists of single-end reads.
Roberts et al. Genome Biology 2011, 12:R22http://genomebiology.com/2011/12/3/R22
Page 8 of 14

partly on the observation in [10] that even after biascorrection, variability in the counts of reads at individualsites differ considerably from the variance estimateobtained from the binomial model. Thus, it may be thatthe model of [10] is not robust in multiple isoformgenes where few sites may distinguish isoforms. It islikely, however, that as RNA-Seq protocols improve and
are better understood, site models will be preferable dueto their improved resolution.The choice of model has an important implication for
the impact of positional bias correction: In our fragmentmodel, positional bias correction without sequence-specific correction does not affect relative expressionestimates. However, positional bias correction in
Figure 8 Bias in different sequence technologies. Results of correlation tests showing improvement after bias correction of datasetsgenerated using different sequencing technologies. The Illumina dataset is SRA012427 (x-axes) and the SOLiD data is SOLiD4_ HBR_PE_50x25 (y-axes). Both used the same MAQC HBR sample. Red axes and lines denote uncorrected FPKM values and blue corrected, while purple regressionlines denote a comparison between corrected and uncorrected values. Both datasets are being corrected for different biases, which causes theirexpression estimates to become more correlated. Note that the plot is zoomed in on the lower abundance transcripts for clarity but capturesover 98% of those in the experiment.
Roberts et al. Genome Biology 2011, 12:R22http://genomebiology.com/2011/12/3/R22
Page 9 of 14

multiple isoform genes, or when coupled with sequence-specific correction, can affect relative expressionestimates (Figure 9). Validation of the improvement inexpression estimates in multiple isoform genes whentaking positional bias into account is complicated by the
difficulty in selecting isoform specific primers, and isbeyond the scope of this paper. It is important to notethat in the site model, positional bias correction canaffect relative expression estimates even in single iso-form genes because the location of fragments withintranscripts directly affects the likelihood function.
GC content and biasPrevious RNA-Seq investigations have revealed correla-tions between expression levels and GC content, and cor-rections have been proposed to ‘normalize’ the data withrespect to this effect [23]. When examining thesequence-specific bias profiles (see Figure S2 of Addi-tional file 1) we noticed GC effects in the estimated para-meters and so we investigated the relationship betweensequence-specific bias correction and GC content.To make the comparison, we defined the bias of a
transcript to be the log fold change in effective length,which is a direct measure of the extent of correction ofexpression estimate in single isoform genes when incor-porating bias correction.Figure 10 shows the relationship between transcript
bias and GC content in two different experiments. Inpanel a, an example from human RNA-Seq (SRA012427)the correlation is very strong, and shows that GC correc-tions may be proxies for sequence-specific bias correc-tion. On the other hand, GC content may not always bean effective marker for bias, as shown in panel b fromyeast (SRA020818_RH).
1.0
0.5
Single isoform
Multiple isoforms
De
nsity
Log effective length fold change
Figure 9 Positional bias correction effect on expression. Thisfigure shows the effective length fold change due to positional biascorrection for the SRA012427 dataset. So that the parameters wouldbe consistent for all transcripts, we have limited the analysis totranscripts with length greater than 2,433, which is the largest of the5 length bins we use for measuring positional bias. As expected, allsingle isoform genes are adjusted in the same way, whereas isoformdeconvolution is altered based on the difference in relative positionwithin a transcript for a read that maps to multiple isoforms.
Figure 10 Correlation of GC content with measured bias. Panel a shows an example from human and panel b from yeast. Since the log foldchange in effective length does not capture the full bias measurement for multiple isoform genes, the plots are limited to those with singleisoforms. GC content appears to be correlated with our sequence bias measurements in some datasets, but not in others. GC content alone isnot always a good proxy for fragment end bias.
Roberts et al. Genome Biology 2011, 12:R22http://genomebiology.com/2011/12/3/R22
Page 10 of 14
We concluded that although normalization of expres-sion values by GC content may be a simple way toremove some bias, it may well be a proxy for othereffects rather than of inherent significance.
ImplementationRNA-Seq data processing pipelines require multiple stepsthat include read mapping, transcript assembly, expressionestimation and differential expression analysis. A difficultywith analysis is that many of these steps are closely related,and improvements in one area can be leveraged in anotheronly if properly integrated. We have shown that in thecase of bias correction, estimation of parameters togetherwith abundances can improve expression estimates, andthese can in turn affect differential expression analyses,mapping probabilities, and even assemblies.In order to maximize the benefits of bias correction
throughout the RNA-Seq analysis pipeline, we haveincorporated it into the Cufflinks RNA-Seq analysissuite [6], and have pre-configured the software for speci-fic protocols so that users can reap the benefits of biascorrection for both stranded and unstranded protocols,as well as single- and paired-end reads. The software isfreely available [24] and is distributed open sourceunder the Boost Software License, version 1.0.
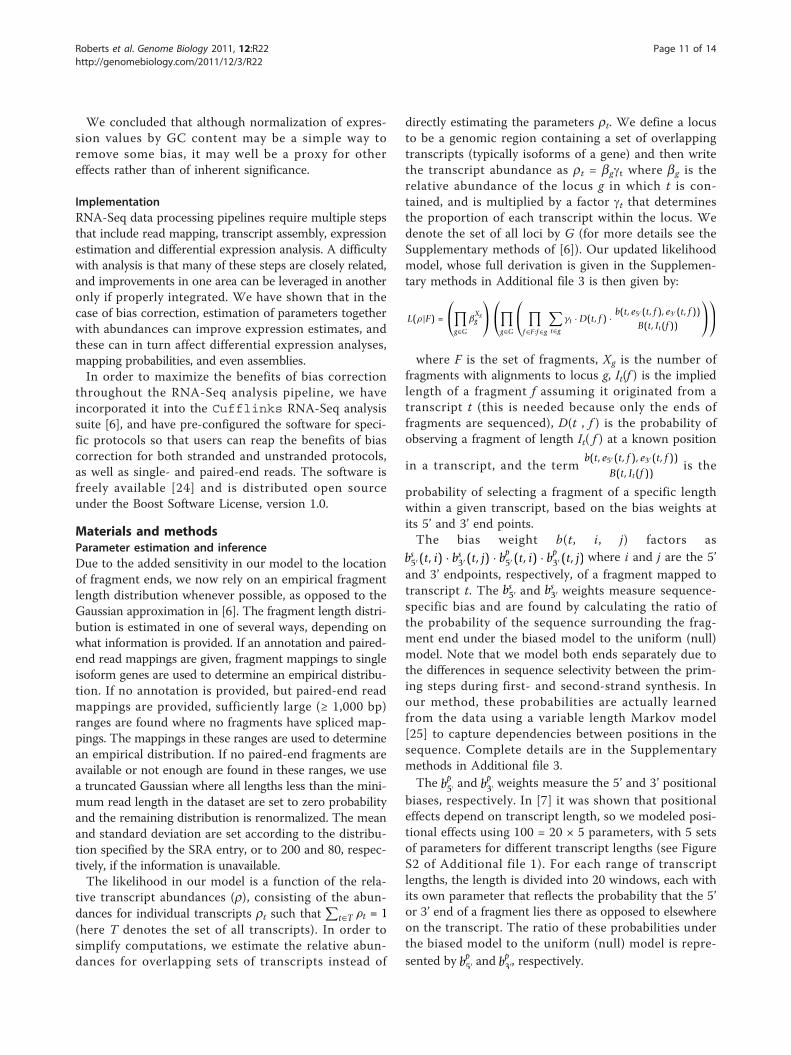
Materials and methodsParameter estimation and inferenceDue to the added sensitivity in our model to the locationof fragment ends, we now rely on an empirical fragmentlength distribution whenever possible, as opposed to theGaussian approximation in [6]. The fragment length distri-bution is estimated in one of several ways, depending onwhat information is provided. If an annotation and paired-end read mappings are given, fragment mappings to singleisoform genes are used to determine an empirical distribu-tion. If no annotation is provided, but paired-end readmappings are provided, sufficiently large (≥ 1,000 bp)ranges are found where no fragments have spliced map-pings. The mappings in these ranges are used to determinean empirical distribution. If no paired-end fragments areavailable or not enough are found in these ranges, we usea truncated Gaussian where all lengths less than the mini-mum read length in the dataset are set to zero probabilityand the remaining distribution is renormalized. The meanand standard deviation are set according to the distribu-tion specified by the SRA entry, or to 200 and 80, respec-tively, if the information is unavailable.The likelihood in our model is a function of the rela-
tive transcript abundances (r), consisting of the abun-dances for individual transcripts rt such that
∑t∈T ρt = 1
(here T denotes the set of all transcripts). In order tosimplify computations, we estimate the relative abun-dances for overlapping sets of transcripts instead of
directly estimating the parameters rt. We define a locusto be a genomic region containing a set of overlappingtranscripts (typically isoforms of a gene) and then writethe transcript abundance as rt = bggt where bg is therelative abundance of the locus g in which t is con-tained, and is multiplied by a factor gt that determinesthe proportion of each transcript within the locus. Wedenote the set of all loci by G (for more details see theSupplementary methods of [6]). Our updated likelihoodmodel, whose full derivation is given in the Supplemen-tary methods in Additional file 3 is then given by:
L(ρ|F) =⎛⎝∏
g∈GβXgg
⎞⎠
⎛⎝∏
g∈G
⎛⎝ ∏
f∈F:f∈g
∑t∈g
γt · D(t, f ) · b(t, e5′(t, f ), e3′(t, f ))B(t, It(f ))
⎞⎠
⎞⎠
where F is the set of fragments, Xg is the number offragments with alignments to locus g, It(f ) is the impliedlength of a fragment f assuming it originated from atranscript t (this is needed because only the ends offragments are sequenced), D(t , f ) is the probability ofobserving a fragment of length It( f ) at a known position
in a transcript, and the termb(t, e5′(t, f ), e3′(t, f ))
B(t, It(f ))is the
probability of selecting a fragment of a specific lengthwithin a given transcript, based on the bias weights atits 5’ and 3’ end points.The bias weight b(t, i, j) factors as
bs5′(t, i) · bs3′(t, j) · bp5′(t, i) · bp3′(t, j) where i and j are the 5’and 3’ endpoints, respectively, of a fragment mapped totranscript t. The bs5′ and bs3′ weights measure sequence-specific bias and are found by calculating the ratio ofthe probability of the sequence surrounding the frag-ment end under the biased model to the uniform (null)model. Note that we model both ends separately due tothe differences in sequence selectivity between the prim-ing steps during first- and second-strand synthesis. Inour method, these probabilities are actually learnedfrom the data using a variable length Markov model[25] to capture dependencies between positions in thesequence. Complete details are in the Supplementarymethods in Additional file 3.The bp5′ and bp3′ weights measure the 5’ and 3’ positional
biases, respectively. In [7] it was shown that positionaleffects depend on transcript length, so we modeled posi-tional effects using 100 = 20 × 5 parameters, with 5 setsof parameters for different transcript lengths (see FigureS2 of Additional file 1). For each range of transcriptlengths, the length is divided into 20 windows, each withits own parameter that reflects the probability that the 5’or 3’ end of a fragment lies there as opposed to elsewhereon the transcript. The ratio of these probabilities underthe biased model to the uniform (null) model is repre-sented by bp5′ and bp3′, respectively.
Roberts et al. Genome Biology 2011, 12:R22http://genomebiology.com/2011/12/3/R22
Page 11 of 14
The parameters that need to be estimated in thelikelihood function are the abundances r and the biasparameters described above. We estimate the para-meters using coordinate ascent. The model is linear inthe r parameters for fixed bias parameters, and wemaximize them as in [6]. For fixed r, the bias para-meters can be maximized as described in the Supple-mentary methods in Additional file 3. Therefore, weemploy an iterative coordinate ascent procedure that,in effect, jointly maximizes all parameters. We found,however, that the gains in likelihood after the firstiteration do not justify the time requirements, and wetherefore limit all experiments to a single iteration. Aninitial r0 estimation with uniform bias weights seedsthe maximization of the bias parameters. r is thenmaximized using these bias parameters, and is used asthe final abundance estimate.
NanoString experimentCell culture/RNA prep and NanoString: Mouse embryo-nic stem cells (V6.5) were co-cultured with irradiatedmouse embryonic broblasts as described in [26]. mESCswere passaged once on gelatin alone before RNA extrac-tion. Total RNA was extracted from mESCs using theprotocol specified in the RNeasy kit (Qiagen). 100 ng oftotal RNA was hybridized for 17 hours with lincRNAcodeset in technical triplicate. The hybridized materialwas loaded into the nCounter prep station followed byquantification on the nCounter Digital Analyzer as out-lined by NanoString Technologies in their Total RNAGene Expression nCounter protocol.
RNA-Seq dataAll accession numbers refer to data available from theshort read archive (SRA) [27]. The SOLiD data wasdownloaded from [28]. The NSR data was provided bythe authors of [21].
Mapping and annotationTo allow for consistent comparison across datasets, allread mapping was carried out using TopHat 1.1.0 [29]with supplied annotations and the –no-novel-juncsoption set, except for the SOLiD datasets, which wereonly available in a pre-aligned form with mapping byBioScope 1.2.1. All expression estimation and biascorrection were done using Cufflinks 0.9.3 with thesame annotation and reference sequence as TopHat. Inthe case of strand-specific libraries, the correct–library-type option was used as per the Cuf-flinks manual. For the mouse dataset in the Nano-String experiment, the RefSeq refGene annotation forassembly NCBI37/mm9 was used, and was downloadedfrom the UCSC Genome Browser. For all human data-sets, the RefSeq refGene annotation for assembly
NCBI36/hg18 [30] was used, and was downloaded fromthe UCSC Genome Browser. The only filtering was toremove non-chromosomal and ‘random’ contigs. Afterquanti cation with Cufflinks, the subset of tran-scripts with 1-to-1 mappings to the TaqMan qRT-PCRprobes were selected (as listed in the supplement to[16]) to be used in the correlation tests. All yeast data-sets used the Ensembl Saccharomyces cerevisiae annota-tion, release 59, which was downloaded from theEnsembl website [31]. Mitochondrial, non-coding, andribosomal RNA sites were masked in the annotation.All remaining transcripts were used in our correlationtests.
Comparison with previous methodsGenominator
We downloaded the Genominator package version1.4.0 using Bioconductor. We then followed the instruc-tors provided with the Genominator for ‘Workingwith the ShortRead Package’. We used the same annota-tions as in our Cufflinks experiment to define theranges and transcript lengths for the RPKM calculations.We also used the same read mapping as was used forCufflinks. Due to memory limitations of the soft-ware, we were forced to learn the weights separately foreach chromosome.mseq
We downloaded the mseq package version 1.1 from theComprehensive R Archive Network (CRAN). Due to thespecific mseq input format requirements, we remappedthe reads using Bowtie version 0.12.5 [32] with the–best option and default parameters otherwise. Themapping was then converted to the mseq input formatusing a custom Python script we wrote and that is pro-vided in Additional file 4. We followed the instructionsof [10] and trained the MART model with suggestedparameters on the top 100 expressed transcripts, whichwe determined by computing the RPKM for every tran-script. The UTR regions and an additional 100 bases onthe ends of transcripts were excluded from the training.The surrounding sequence window was set to be 8bases before and 12 bases after the first nucleotide inthe read, which matches the window of our variablelength Markov model and is where we observed bias forthe dataset. The resulting sequence preferences wereused to find the corrected RPKMs.
Statistical analysisAll correlation tests used least squares linear regression,as implemented in the R programming language. Wefound the P-value in Section 2.2 by sampling (with repla-cement) from the empirical distribution of fold changes50,000 times for each transcript in order to generate50,000 randomly adjusted sets of expression values.
Roberts et al. Genome Biology 2011, 12:R22http://genomebiology.com/2011/12/3/R22
Page 12 of 14

Of these, only 35 showed correlations better than thevalues that were corrected by our method (R2 = 0.81).
Additional material
Additional file 1: Supplementary figures. Additional figures referred toin the text.
Additional file 2: Raw expression data. Raw expression estimates usedin comparisons, including the NanoString expression measurements.
Additional file 3: Supplementary methods. More detail on thelikelihood model.
Additional file 4: Script for mseq format conversion. Python scriptthat converts standard SAM and FASTA input into the mseq inputformat.
Abbreviationsbp: base pair; CRAN: Comprehensive R archive network; FPKM: Fragmentsper kilobase per million reads sequenced; HBR: Human brain reference;MAQC: Microarray quality control; NNSR: Not not so random (hexamerpriming); NSR: Not so random (hexamer priming); qRT-PCR: Quantitativereverse transcription polymerase chain reaction; RH: Random hexamer(priming); RPKM: Reads per kilobase per million reads sequenced; SRA: Shortread archive; UHR: Universal human reference; WT: whole transcriptome.
AcknowledgementsWe thank Joshua Levin and Mitchell Guttman for their help with theNanoString experiment. Anat Caspi was instrumental in helping us obtainthe SOLiD data. Adam Roberts was supported by an NSF graduate researchfellowship.
Author details1Department of Computer Science, 387 Soda Hall, UC Berkeley, Berkeley, CA94720, USA. 2Broad Institute, 7 Cambridge Center, Cambridge, MA 02142,USA. 3Department of Stem Cell and Regenerative Biology, 7 Divinity Avenue,Harvard University, Cambridge, MA 02138, USA. 4Departments ofMathematics and Molecular & Cell Biology, 970 Evans Hall, UC Berkeley,Berkeley, CA 94720, USA.
Authors’ contributionsAR, CT and LP developed the bias correction approach. AR implemented theimprovements to the Cufflinks software. JLR provided reagents andguidance. JD performed the NanoString experiment. AR performed theanalysis. AR and LP wrote the paper. All authors read and approved the finalmanuscript.
Received: 4 December 2010 Revised: 20 February 2011Accepted: 16 March 2011 Published: 16 March 2011
References1. Marguerat S, Bähler J: RNA-Seq: from technology to biology. Cellular and
Molecular Life Sciences 2010, 67:569-579.2. Jiang H, Wong W: Statistical inferences for isoform expression in RNA-
Seq. Bioinformatics 2009, 25:1026-1032.3. Li B, Ruotti V, Stewart R, Thomson J, Dewey C: RNA-Seq gene expression
estimation with read mapping uncertainty. Bioinformatics 2010,26:493-500.
4. Nicolae M, Mangul S, Măndoiu I, Zelikovsky A: Estimation of alternativesplicing isoform frequencies from RNA-Seq data. Algorithms inBioinformatics 2010, 6293:202-214.
5. Paşaniuc B, Zaitlen N, Halperin E: Accurate estimation of expression levelsof homologous genes in RNA-seq experiments. In Research inComputational Molecular Biology. Edited by: Berger B. Berlin/Heidelberg:Springer; 2010:397-409, [Lecture Notes in Computer Science, vol 6044.].
6. Trapnell C, Williams B, Pertea G, Mortazavi AGK, van Baren M, Salzberg S,Wold B, Pachter L: Transcript assembly and quantification by RNA-Seq
reveals unannotated transcripts and isoform switching during celldifferentiation. Nature Biotechnology 2010, 28:511-515.
7. Bohnert R, Rätsch G: rQuant.web: a tool for RNA-Seq-based transcriptquantitation. Nucleic Acids Research 2010, 38:W348-W351.
8. Hansen K, Brenner S, Dudoit S: Biases in Illumina transcriptomesequencing caused by random hexamer priming. Nucleic Acids Research2010, 38:1-7.
9. Srivastava S, Chen L: A two-parameter generalized Poisson model toimprove the analysis of RNA-seq data. Nucleic Acids Research 2010, 38:e170.
10. Li J, Jiang H, Wong W: Modeling non-uniformity in short-read rates inRNA-Seq data. Genome Biology 2010, 11:R50.
11. Levin J, Adiconis X, Yassour M, Thompson D, Guttman M, Berger M, Fan L,Friedman N, Nusbaum C, Gnirke A, Regev A: Development and evaluationof RNA-Seq methods. Genome Biology 2010, 11:P26.
12. Kircher M, Kelso J: High-throughput DNA sequencing - concepts andlimitations. BioEssays 2010, 32:524-536.
13. Bradford J, Hey Y, Yates T, Li Y, Pepper S, Miller C: A comparison ofmassively parallel nucleotide sequencing with oligonucleotidemicroarrays for global transcription profiling. BMC Genomics 2010, 11:282.
14. Geiss G, Bumgarner R, Birditt B, Dahl T, Dowidar N, Dunaway D, Fell H,Ferree S, George R, Grogan T, James J, Maysuria M, Mitton J, Oliveri P,Osborn J, Peng T, Ratcliffe A, Webster P, Davidson E, Hood L, Dimitrov K:Direct multiplexed measurement of gene expression with color-codedprobe pairs. Nature Biotechnology 2008, 26:317-325.
15. Fleige S, Pfaffl M: RNA integrity and the effect on the real time qRT-PCRperformance. Molecular Aspects of Medicine 2006, 27:126-139.
16. Shi L, Reid L, Jones W, Shippy R, Warrington J, Baker S, Collins P, deLongueville F, Kawakasi E, Lee K, Luo Y, Sun Y, Willey J, Setterquist R,Fischer G, Tong W, Dragan Y, Dix D, Frueh F, Goodsaid F, Herman D,Jensen R, Johnson C, Lobenhofer E, Puri R, Schrf U, Thiery-Mieg J, Wang C,Wilson M, Wolber P, et al: The MicroArray Quality Control (MAQC) projectshows inter- and intraplatform reproducibility of gene expressionmeasurements. Nature Biotechnology 2006, 24:1151-1161.
17. Au K, Jiang H, Lin L, Xing Y, Wong W: Detection of splice junctions frompaired-end RNA-Seq data by SpliceMap. Nucleic Acids Research 2010,38:4570-4578.
18. Anders S, Hüber W: Differential expression analysis for sequence countdata. Genome Biology 2010, 11:R106.
19. Bullard J, Purdom E, Hansen K, Dudoit S: Evaluation of statistical methodsfor normalization and differential expression in mRNA-Seq experiments.BMC Bioinformatics 2010, 11:94.
20. Wang E, Sandberg R, Luo S, Khrebtukova I, Zhang L, Mayr C, Kingsmore S,Schroth G, Burge C: Alternative isoform regulation in human tissuetranscriptomes. Nature 2008, 456:470-476.
21. Armour C, Castle J, Chen R, Babak T, Loerch P, Jackson S, Shah J, Dey J,Rohl C, Johnson J, Raymond C: Digital transcriptome profiling usingselective hexamer priming for cDNA synthesis. Nature Methods 2009,6:647-649.
22. Graveley B, Brooks A, Carlson J, Landolin J, Yang L, Artieri C, van Baren M,Boley N, Booth B, Brown J, Cherbas L, Davis C, Dobin A, Li R, Lin W,Malone J, Mattiuzzo N, Miller D, Sturgill D, Tuch B, Zaleski C, Zhang D,Blanchette M, Dudoit S, Eads B, Green R, Hammonds A, Jiang L, Kapranov P,Langton L, et al: The developmental transcriptome of Drosophilamelanogaster. Nature 20101, 471:473-479.
23. Pickrell J, Marioni J, Pai A, Degner J, Engelhardt B, Nkadori E, Veyrieras J,Stephens M, Gilad Y, Pritchard J: Understanding mechanisms underlyinghuman gene expression variation with RNA sequencing. Nature 2010,464:768-772.
24. Cufflinks software. [http://bio.math.berkeley.edu/cufflinks/].25. Bühlmann P, Wyner A: Variable length Markov chains. The Annals of
Statistics 1999, 2:480-513.26. Guttman M, Garber M, Levin J, Donaghey J, Robinson J, Adiconis X, Fan L,
Koziol M, Gnirke A, Nusbaum C, Rinn J, Lander E, Regev A: Ab initioreconstruction of cell type-specific transcriptomes in mouse reveals theconserved multi-exonic structure of lincRNAs. Nature Biotechnology 2010,28:503-510.
27. Short read archive. [http://www.ncbi.nlm.nih.gov/sra].28. SOLiD software and tools. [http://solidsoftwaretools.com/gf/project/wtpe/].29. Trapnell C, Pachter L, Salzberg S: TopHat: discovering splice junctions with
RNA-Seq. Bioinformatics 2009, 25:1105-1111.
Roberts et al. Genome Biology 2011, 12:R22http://genomebiology.com/2011/12/3/R22
Page 13 of 14

30. Pruitt K, Tatusova T, Klimke W, Maglott D: NCBI reference sequences:current status, policy and new initiatives. Nucleic Acids Research 2008, 37:D32-D36.
31. Flicek P, Amode MR, Barrell D, Beal K, Brent S, Chen Y, Clapham P, Coates G,Fairley S, Fitzgerald S, Gordon L, Hendrix M, Hourlier T, Johnson N, Kähäri A,Keefe D, Keenan S, Kinsella R, Kokocinski F, Kulesha E, Larsson P, Longen I,McLaren W, Overduin B, Pritchard B, Riat HS, Rios D, Ritchie GRS, Ruffier M,Schuster M, et al: Ensembl 2011. Nucleic Acids Research 2011, 39:D800-D806.
32. Langmead B, Trapnell C, Pop M, Salzberg S: Ultrafast and memory-efficientalignment of short DNA sequences to the human genome. GenomeBiology 2009, 10:R25.
doi:10.1186/gb-2011-12-3-r22Cite this article as: Roberts et al.: Improving RNA-Seq expressionestimates by correcting for fragment bias. Genome Biology 2011 12:R22.
Submit your next manuscript to BioMed Centraland take full advantage of:
• Convenient online submission
• Thorough peer review
• No space constraints or color figure charges
• Immediate publication on acceptance
• Inclusion in PubMed, CAS, Scopus and Google Scholar
• Research which is freely available for redistribution
Submit your manuscript at www.biomedcentral.com/submit
Roberts et al. Genome Biology 2011, 12:R22http://genomebiology.com/2011/12/3/R22
Page 14 of 14