Method of Analysis by the U.S. Geological Survey
33
U.S. Geological Survey U.S. Department of the Interior San Francisco Sacramento U.S. Geological Survey U.S. Department of the Interior U.S. Geological Survey Scientific Investigations Report 2004-5003 Method of Analysis by the U.S. Geological Survey California District Sacramento Laboratory—Determination of Trihalomethane Formation Potential, Method Validation, and Quality-Control Practices Los Angeles
Transcript of Method of Analysis by the U.S. Geological Survey

U.S. Geological Survey
U.S. Department of the Interior
San Francisco
Sacramento
U.S. Geological Survey
U.S. Department of the Interior
U.S. Geological Survey
Scientific Investigations Report 2004-5003
Method of Analysis by the U.S. Geological Survey California District Sacramento Laboratory—Determination of Trihalomethane Formation Potential, Method Validation, and Quality-Control Practices
Los Angeles

Method of Analysis by the U.S. Geological Survey California District Sacramento Laboratory—Determination of Trihalomethane Formation Potential, Method Validation, and Quality-Control Practices
By Kathryn L. Crepeau, Miranda S. Fram, and Noël Bush
Scientific Investigations Report 2004-5003
U.S. Department of the Interior U.S. Geological Survey

U.S. Department of the InteriorGale A. Norton, Secretary
U.S. Geological SurveyCharles G. Groat, Director
U.S. Geological Survey, Reston, Virginia: 2004For sale by U.S. Geological Survey, Information Services Box 25286, Denver Federal Center Denver, CO 80225-0286
For more information about the USGS and its products: Telephone: 1-888-ASK-USGS
World Wide Web: http://www.usgs.gov/
Any use of trade, product, or firm names in this publication is for descriptive purposes only and does not imply endorsement by the U.S. Government.
Although this report is in the public domain, permission must be secured from the individual copyright owners to reproduce any copyrighted materials contained within this report.
Suggested citation: Crepeau, K.L., Fram, M.S., and Bush, Noël, 2004, Method of Analysis by the U.S. Geological Survey California District Sacramento Laboratory—Determination of Trihalomethane Formation Potential, Method Validation, and Quality-Control Practices: U.S. Geological Survey Scientific Investigations Report 2004–5003, 21 p.
iii
Contents
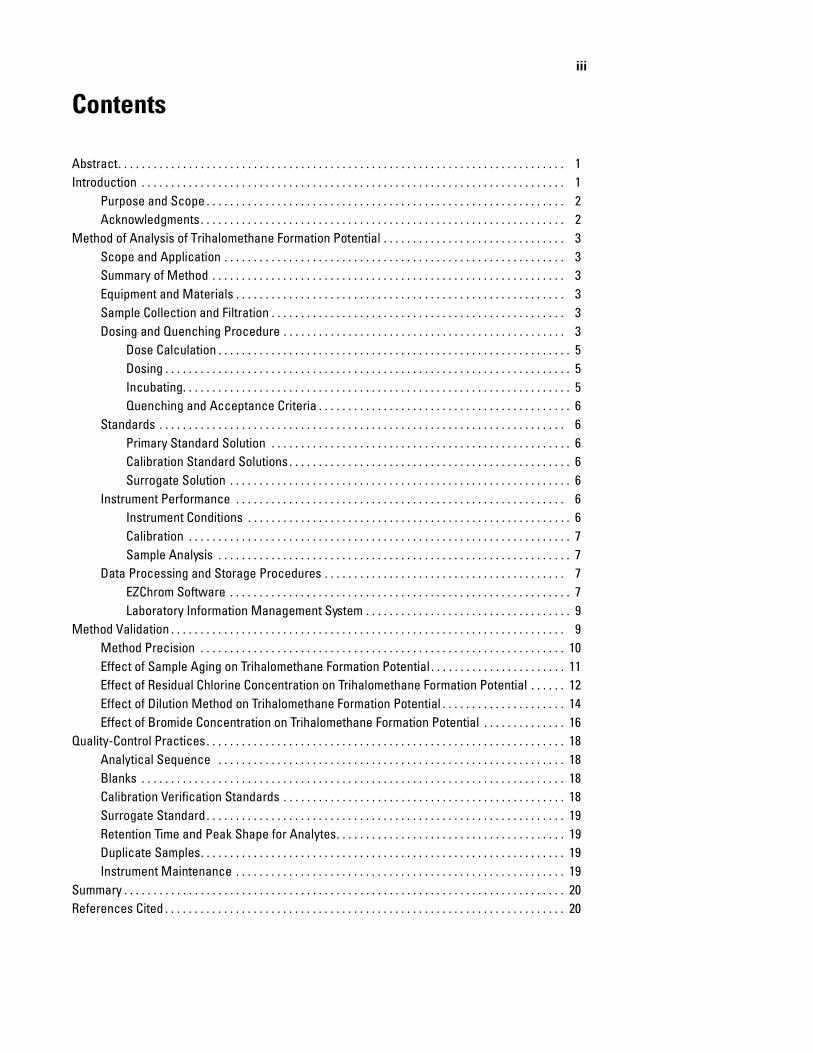
Abstract. . . . . . . . . . . . . . . . . . . . . . . . . . . . . . . . . . . . . . . . . . . . . . . . . . . . . . . . . . . . . . . . . . . . . . . . . . . . 1Introduction . . . . . . . . . . . . . . . . . . . . . . . . . . . . . . . . . . . . . . . . . . . . . . . . . . . . . . . . . . . . . . . . . . . . . . . . 1
Purpose and Scope . . . . . . . . . . . . . . . . . . . . . . . . . . . . . . . . . . . . . . . . . . . . . . . . . . . . . . . . . . . . . 2Acknowledgments. . . . . . . . . . . . . . . . . . . . . . . . . . . . . . . . . . . . . . . . . . . . . . . . . . . . . . . . . . . . . . 2
Method of Analysis of Trihalomethane Formation Potential . . . . . . . . . . . . . . . . . . . . . . . . . . . . . . . 3Scope and Application . . . . . . . . . . . . . . . . . . . . . . . . . . . . . . . . . . . . . . . . . . . . . . . . . . . . . . . . . . 3Summary of Method . . . . . . . . . . . . . . . . . . . . . . . . . . . . . . . . . . . . . . . . . . . . . . . . . . . . . . . . . . . . 3Equipment and Materials . . . . . . . . . . . . . . . . . . . . . . . . . . . . . . . . . . . . . . . . . . . . . . . . . . . . . . . . 3Sample Collection and Filtration . . . . . . . . . . . . . . . . . . . . . . . . . . . . . . . . . . . . . . . . . . . . . . . . . . 3Dosing and Quenching Procedure . . . . . . . . . . . . . . . . . . . . . . . . . . . . . . . . . . . . . . . . . . . . . . . . 3
Dose Calculation . . . . . . . . . . . . . . . . . . . . . . . . . . . . . . . . . . . . . . . . . . . . . . . . . . . . . . . . . . . . 5Dosing . . . . . . . . . . . . . . . . . . . . . . . . . . . . . . . . . . . . . . . . . . . . . . . . . . . . . . . . . . . . . . . . . . . . . 5Incubating. . . . . . . . . . . . . . . . . . . . . . . . . . . . . . . . . . . . . . . . . . . . . . . . . . . . . . . . . . . . . . . . . . 5Quenching and Acceptance Criteria . . . . . . . . . . . . . . . . . . . . . . . . . . . . . . . . . . . . . . . . . . . 6
Standards . . . . . . . . . . . . . . . . . . . . . . . . . . . . . . . . . . . . . . . . . . . . . . . . . . . . . . . . . . . . . . . . . . . . . 6Primary Standard Solution . . . . . . . . . . . . . . . . . . . . . . . . . . . . . . . . . . . . . . . . . . . . . . . . . . . 6Calibration Standard Solutions . . . . . . . . . . . . . . . . . . . . . . . . . . . . . . . . . . . . . . . . . . . . . . . . 6Surrogate Solution . . . . . . . . . . . . . . . . . . . . . . . . . . . . . . . . . . . . . . . . . . . . . . . . . . . . . . . . . . 6
Instrument Performance . . . . . . . . . . . . . . . . . . . . . . . . . . . . . . . . . . . . . . . . . . . . . . . . . . . . . . . . 6Instrument Conditions . . . . . . . . . . . . . . . . . . . . . . . . . . . . . . . . . . . . . . . . . . . . . . . . . . . . . . . 6Calibration . . . . . . . . . . . . . . . . . . . . . . . . . . . . . . . . . . . . . . . . . . . . . . . . . . . . . . . . . . . . . . . . . 7Sample Analysis . . . . . . . . . . . . . . . . . . . . . . . . . . . . . . . . . . . . . . . . . . . . . . . . . . . . . . . . . . . . 7
Data Processing and Storage Procedures . . . . . . . . . . . . . . . . . . . . . . . . . . . . . . . . . . . . . . . . . 7EZChrom Software . . . . . . . . . . . . . . . . . . . . . . . . . . . . . . . . . . . . . . . . . . . . . . . . . . . . . . . . . . 7Laboratory Information Management System . . . . . . . . . . . . . . . . . . . . . . . . . . . . . . . . . . . 9
Method Validation . . . . . . . . . . . . . . . . . . . . . . . . . . . . . . . . . . . . . . . . . . . . . . . . . . . . . . . . . . . . . . . . . . . 9Method Precision . . . . . . . . . . . . . . . . . . . . . . . . . . . . . . . . . . . . . . . . . . . . . . . . . . . . . . . . . . . . . . 10Effect of Sample Aging on Trihalomethane Formation Potential . . . . . . . . . . . . . . . . . . . . . . . 11Effect of Residual Chlorine Concentration on Trihalomethane Formation Potential . . . . . . 12Effect of Dilution Method on Trihalomethane Formation Potential . . . . . . . . . . . . . . . . . . . . . 14Effect of Bromide Concentration on Trihalomethane Formation Potential . . . . . . . . . . . . . . 16
Quality-Control Practices. . . . . . . . . . . . . . . . . . . . . . . . . . . . . . . . . . . . . . . . . . . . . . . . . . . . . . . . . . . . . 18Analytical Sequence . . . . . . . . . . . . . . . . . . . . . . . . . . . . . . . . . . . . . . . . . . . . . . . . . . . . . . . . . . . 18Blanks . . . . . . . . . . . . . . . . . . . . . . . . . . . . . . . . . . . . . . . . . . . . . . . . . . . . . . . . . . . . . . . . . . . . . . . . 18Calibration Verification Standards . . . . . . . . . . . . . . . . . . . . . . . . . . . . . . . . . . . . . . . . . . . . . . . . 18Surrogate Standard. . . . . . . . . . . . . . . . . . . . . . . . . . . . . . . . . . . . . . . . . . . . . . . . . . . . . . . . . . . . . 19Retention Time and Peak Shape for Analytes. . . . . . . . . . . . . . . . . . . . . . . . . . . . . . . . . . . . . . . 19Duplicate Samples. . . . . . . . . . . . . . . . . . . . . . . . . . . . . . . . . . . . . . . . . . . . . . . . . . . . . . . . . . . . . . 19Instrument Maintenance . . . . . . . . . . . . . . . . . . . . . . . . . . . . . . . . . . . . . . . . . . . . . . . . . . . . . . . . 19
Summary . . . . . . . . . . . . . . . . . . . . . . . . . . . . . . . . . . . . . . . . . . . . . . . . . . . . . . . . . . . . . . . . . . . . . . . . . . . 20References Cited . . . . . . . . . . . . . . . . . . . . . . . . . . . . . . . . . . . . . . . . . . . . . . . . . . . . . . . . . . . . . . . . . . . . 20

iv
Figures
Figure 1. Graphs showing chromatograms of (A) a typical mid-range standard, and (B) an instrument blank run after a high standard containing the four trihalomethane species and methylene chloride (files 120502011 and 010203004) . . . . . . . . . . . . . . . . . . . . . . . . . . . . . . . . . . . . . . . . . . . . . . . . . . . . . . . . . . . . . . 8
Figure 2. Graph showing trihalomethane formation potential of aliquots of samples AR and SE analyzed 0–6 weeks after sample collection . . . . . . . . . . . . . . . . . . . . . . . 11
Figure 3. Graph showing trihalomethane formation potential of aliquots of samples AR and ARBr3 dosed to yield a range of residual-free chlorine concentrations at the end of the incubation period . . . . . . . . . . . . . . . . . . . . . . . . . . . 12
Figure 4. Graphs showing formation potentials of chloroform, bromodichloromethane, dibromochloromethane, and bromoform in aliquots of samples (A) AR and (B) ARBr3 dosed to yield a range of residual-free chlorine concentrations at the end of the incubation period . . . . . . . . . . . . . . . . . . . . . . . . . . . . . . . . . . . . . . . . . 13
Figure 5. Graph showing trihalomethane formation potential of aliquots of samples AR and ArBr3 analyzed using different dilution methods . . . . . . . . . . . . . . . . . . . . . . 14
Figure 6. Graph showing trihalomethane formation potential of aliquots of sample TW1 that were diluted to different dissolved organic carbon concentrations before dosing with chlorine . . . . . . . . . . . . . . . . . . . . . . . . . . . . . . . . . . . . . . . . . . . . . . . 15
Figure 7. Graph showing trihalomethane formation potential of samples AR, ARBr1, ARBr2, and ARBr3 dosed to yield a constant residual-free chlorine concentration . . . . . . . . . . . . . . . . . . . . . . . . . . . . . . . . . . . . . . . . . . . . . . . . . . . . . . . . . . . 16
Figure 8. Graph showing proportions of chloroform, bromodichloromethane, dibromochloromethane, and bromoform formation potentials in samples AR, ARBr1, ARBr2, and ARBr3 dosed to yield a constant residual-free chlorine concentration . . . . . . . . . . . . . . . . . . . . . . . . . . . . . . . . . . . . . . . 17
v
Tables
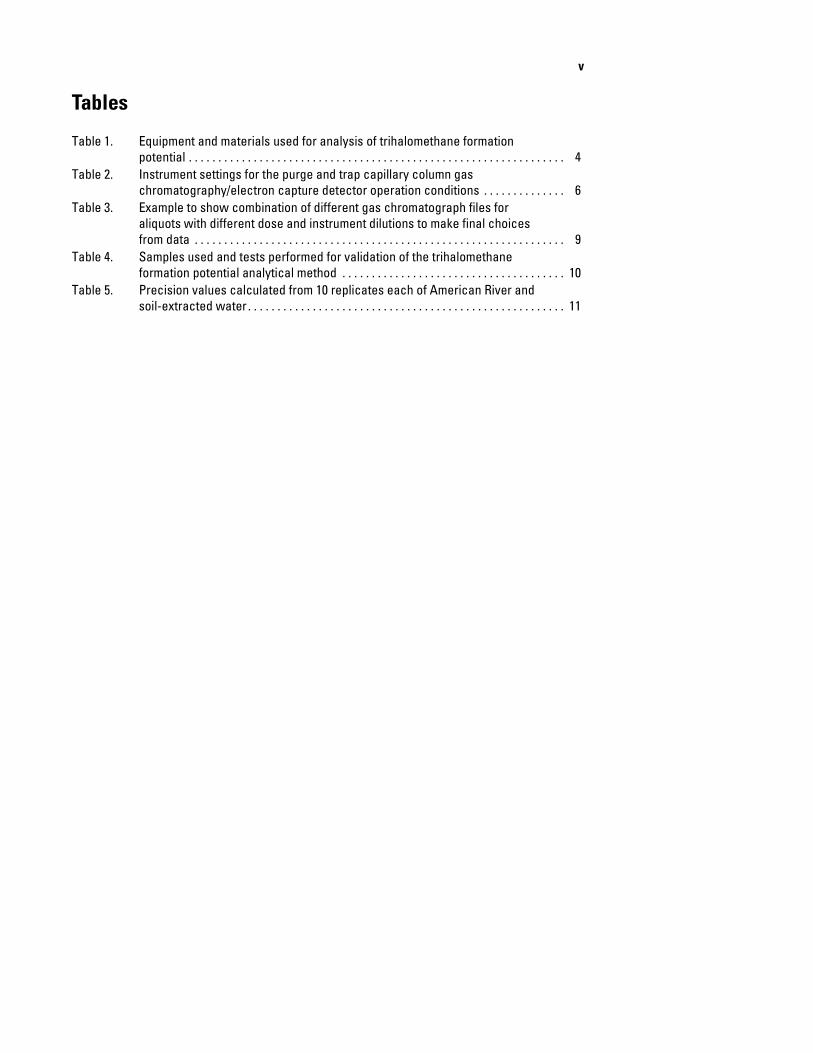
Table 1. Equipment and materials used for analysis of trihalomethane formation potential . . . . . . . . . . . . . . . . . . . . . . . . . . . . . . . . . . . . . . . . . . . . . . . . . . . . . . . . . . . . . . . . 4
Table 2. Instrument settings for the purge and trap capillary column gas chromatography/electron capture detector operation conditions . . . . . . . . . . . . . . 6
Table 3. Example to show combination of different gas chromatograph files for aliquots with different dose and instrument dilutions to make final choices from data . . . . . . . . . . . . . . . . . . . . . . . . . . . . . . . . . . . . . . . . . . . . . . . . . . . . . . . . . . . . . . . 9
Table 4. Samples used and tests performed for validation of the trihalomethane formation potential analytical method . . . . . . . . . . . . . . . . . . . . . . . . . . . . . . . . . . . . . . 10
Table 5. Precision values calculated from 10 replicates each of American River and soil-extracted water . . . . . . . . . . . . . . . . . . . . . . . . . . . . . . . . . . . . . . . . . . . . . . . . . . . . . . 11

vi
Conversion Factors, Abbreviations, and Acronyms
Temperature in degrees Celsius (°C) may be converted to degrees Fahrenheit (°F) as follows:
°F = (1.8 x °C) + 32
Concentrations of chemical constituents in water are given either in milligrams per liter (mg/L) or micrograms per liter (µg/L).
Abbreviations and Acronyms
ABBREVIATIONS d, daysHz, hertzm, metermg, milligrammg/L, milligrams per litermL, millilitermL/min, milliliter per minutemmol, millimolemmol/mol, millimoles per moleM, molarnm, nanometersµg/L, micrograms per literµg/mL, micrograms per milliliterµL, microliterµM, micromolarµmol/L, micromoles per literµmol, micromoleV, volts
Br, elemental bromineBr-, bromide ion; bromide dissolved, bromideCl, elemental chlorineCH2Cl2, methylene chlorideCH2ClCHBrCH3, 2-bromo-1-chloropropaneCH3OH, methanolCHBr3, bromoformCHCl2Br, bromodichloromethaneCHCl3, chloroformCHClBr2, dibromochloromethaneCl-, chloride; chloride ionCl2, chlorinedil, dilutionDOC, dissolved organic carbon
Multiply By To obtain
pound per square inch (lb/in2) 6.895 kilopascal (kPa)

vii
DPD, N-diethyl-p-phenylenediamineH+, hydrogen ionH2O, waterH3BO3, boric acidHCl, hydrochloric acidHOBr, hypobromous acidHOCl, hypochlorous acidN2, nitrogen gasNaBr, sodium bromideNaOCl, sodium hypochloriteNaOH, sodium hydroxideNa2SO3, sodium sulfiteNH3-N, ammonia-nitrogenOCl-, hypochloritepKa, dissociation constant of acidsPOC, particulate organic carbonSDS-THM, simulated distribution system trihalomethanesSTHMFP, specific trihalomethane formation potentialSTTHMFP, specific total trihalomethane formation potentialTHM, trihalomethaneTHMFP, trihalomethane formation potentialTTHM, total trihalomethaneTTHMFP, total trihalomethane formation potential
ACS, American Chemical SocietyDBP, disinfection by-productECD, electron capture detectorUSEPA, U.S. Environmental Protection AgencyGC, gas chromatographID, internal diameterLIMS, Laboratory Information Management SystemMCL, maximum contaminant levelMDL, method detection limitNWIS, National Water Information SystemRSD, relative standard deviationTOC, total organic carbonUFC, Uniform Formation ConditionUSGS, U.S. Geological SurveyVOC, volatile organic compound

viii

Method of Analysis by the U.S. Geological Survey California District Sacramento Laboratory— Determination of Trihalomethane Formation Potential, Method Validation, and Quality-Control Practices
By Kathryn L. Crepeau, Miranda S. Fram, and Noël Bush
Abstract
An analytical method for the determination of the trihalomethane formation potential of water samples has been developed. The trihalomethane formation potential is measured by dosing samples with chlorine under specified conditions of pH, temperature, incubation time, darkness, and residual-free chlorine, and then analyzing the resulting trihalomethanes by purge and trap/gas chromatography equipped with an electron capture detector. Detailed explanations of the method and quality-control practices are provided. Method validation experiments showed that the trihalomethane formation potential varies as a function of time between sample collection and analysis, residual-free chlorine concentration, method of sample dilution, and the concentration of bromide in the sample.
Introduction
Trihalomethanes (THMs) are volatile, halogenated organic compounds that commonly are present in treated drinking water. THMs are one type of undesirable disinfection by-products (DBPs) that form during the disinfection stage of the drinking water-treatment process. Natural organic carbon present in the source water reacts with disinfectants [usually chlorine (Cl2)] added during treatment to form THMs and other DBPs. Dissolved organic carbon (DOC) comprises the majority of the natural organic carbon in most drinking water source waters; particulate organic carbon (POC) usually is less important. THMs are of concern because they are carcinogenic
and have been reported to cause miscarriages (Waller, and others, 1998; Bove and others, 2002). THMs include chloroform (CHCl3), bromodichloromethane (CHCl2Br), dibromochloromethane (CHClBr2), and bromoform (CHBr3); the sum of these four compounds is the total trihalomethanes (TTHM). The TTHM concentrations in drinking water are regulated and the current maximum contaminant level (MCL) is 80 micrograms per liter (µg/L) (U.S. Environmental Protection Agency, 1998).
THMs contain C1 and Br because the added Cl2 reacts with dissolved Br- (bromide) as well as with the DOC. Cl2 is a strong oxidant and is added to water as Cl2 gas or sodium hypochlorite (NaOCl, bleach). Cl2 gas hydrolyzes rapidly to form hypochlorous acid (HOCl), chloride ion (Cl-), and hydrogen ion (H+) (reaction 1):
(1)
HOCl (reaction 2) dissociates to hypochlorite (OCl-) and H+ with a dissociation constant of acids (pKa) of 7.6. Both species are reactive.
(2)
HOCl reacts with Br- to form hypobromous acid (HOBr) (reaction 3), and effectively scavenges all of the Br- out of the water.
(3)
HOBr reacts faster with DOC than HOCl to form THMs (Morris, 1978; Symons and others, 1993).
Cl2 H2O+ HOCl Cl – H ++ +→
HOCl OCl – H ++↔
HOCl Br –+ HOBr Cl –+→
2 Method of Analysis—Determination of Trihalomethane Formation Potential, Method Validation, and Quality-Control Practices
The amount of THMs formed from a given amount of DOC depends on the chemical structure of the DOC, the contact time between DOC and Cl2, the relative concentrations of DOC and Cl2 (residual Cl2), the initial Br- concentration of the water, and the pH and temperature of the water (Reckhow and others, 1990). Trihalomethane formation potential (THMFP) is defined as the amount of THMs formed under specified conditions of pH, contact time, residual Cl2 concentration, and temperature and is reported in units of micrograms per liter or micromoles per liter of total THMs. The specific trihalomethane (STHMFP) is the THMFP normalized to the DOC concentration and is reported in units of millimoles of THM per mole of carbon in the DOC. STHMFP is a measure of the reactivity of the DOC to form THMs. Note that THMFP and STHMFP are equivalent to total trihalomethane formation potential (TTHMFP) and specific TTHMFP (STTHMFP), terms also used in the literature.
There are at least four standard methods for measuring THMFP: U.S. Environmental Protection Agency (EPA) method 510.1 and 502.2 (U.S. Environmental Protection Agency, 1983; 1995); THMFP Standard Method 5710B, 6232, and 6230D (American Public Health Association and others, 1995); Simulated Distribution System Trihalomethanes (SDS-THM) Standard Method 5710C (American Public Health Association and others, 1995); and Uniform Formation Condition (UFC) (Summers and others, 1996). Each method specifies different conditions of pH, contact time, temperature, and residual Cl2 and, thus, each method would yield different results for the THMFP of a water sample. The U.S. Geological Survey (USGS) Sacramento Laboratory uses a modified version of the EPA methods. The procedure and quality-assurance/quality-control procedures are modified from EPA methods 510.1 and 502.2 (U.S. Environmental Protection Agency, 1983; 1995), the USGS National Water Quality Laboratory volatile organic compound method (Connor and others, 1998), and the standard operating procedures for analysis of THMFP by the California Department of Water Resources Bryte Laboratory (Sid Fong, California Department of Water Resources, written commun., 1997).
Purpose and Scope
This report presents detailed descriptions of the analytical procedures and quality-assurance/quality-control protocols used for determination of THM formation potential by the USGS California District, Sacramento Laboratory.
This report also presents evaluations of three procedural variables—sample aging, residual Cl2 tolerance, and method of dilution—on the THMFP. Ideally, all water samples would be analyzed immediately on arrival at the laboratory, but in reality, delays occur and samples are placed in refrigerated storage for a period of time prior to analysis. No preservatives, such as acid, are added to the samples during storage. The effect of “aging” of the water sample on the THMFP was determined by analyzing the same water sample weekly during a 6-week period. The Cl2 demand of a water sample is a function of DOC concentration and composition, ammonia-nitrogen (NH3-N) concentration, and the inorganic matrix of the sample and, thus, is difficult to predict precisely. Therefore, it is necessary to allow the residual-free Cl2 concentration to vary within a small range. The effect of residual Cl2 concentration on THMFP was determined by analyzing samples at a range of residual Cl2 concentrations. Many chlorinated water samples produced THM concentrations that are much higher than the concentration range measurable by the detector on the gas chromatograph (GC). Samples that have DOC concentrations greater than about 3 milligrams per liter (mg/L) must be diluted. The effect of different dilution procedures was examined by comparing THMFP of samples diluted before and after chlorination, and by comparing THMFP of samples diluted by different amounts.
Finally, this report presents an evaluation of the effect of Br- concentration on THMFP. Water samples analyzed for THMFP in the USGS Sacramento Laboratory range from fresh to brackish in terms of salinity and, thus, have a wide range of Br- concentrations. THMFP data are used to provide information about the DOC in the water sample, but this information may be confounded if Br- alters the THM formation reaction. The effect of Br- concentration on THMFP was evaluated by measuring THMFP of water samples with and without a Br- spike.
Acknowledgments
The authors gratefully acknowledge Ben Harper, Kelley Paxton, Tania Owen, and Barbara Zazzi for laboratory assistance with these experiments.
Method of Analysis of Trihalomethane Formation Potential 3
Method of Analysis of Trihalomethane Formation Potential
Scope and Application
An analytical method was developed for determining the THMFP of water samples; this method is designed for measuring THMFP under controlled, standard conditions of pH, temperature, darkness, contact time between Cl2 and the water sample, and residual Cl2 concentration. Because THMFP depends on experimental conditions, particularly pH and contact time, data obtained using this method must only be compared to data obtained from methods using the same conditions. This method is suitable for filtered ground-water and surface-water samples and for filtered-water samples produced in laboratory experiments. A modified procedure for unfiltered samples also is given. The calibration range for the method is 0.17 to 160 µg/L of CHCl3 and 0.037 to 40 µg/L of CHCl2Br, CHClBr2, CHBr3, which corresponds to a DOC range in the water sample of approximately 0 to 3 mg/L. Water samples having higher DOC concentrations are diluted for analysis.
Summary of Method
Water samples are collected and filtered to remove suspended particulate matter. The DOC and NH3-N concentrations in the water samples are used to determine the appropriate amount of Cl2 solution to add. The water samples are diluted as necessary to keep the DOC in the range of 0 to 3 mg/L. The pH is adjusted and buffered to 8.3. After the samples are dosed, they are incubated for 7 days.
At the end of the 7 days, the pH and residual-free Cl2 are measured and the samples are quenched with sodium sulfite (Na2SO3) solution to neutralize any remaining free Cl2. The THMs are purged from the sample matrix by bubbling nitrogen through an aliquot of the sample. The THMs are collected on an adsorbent trap and thermally desorbed into the inlet of a GC. The four THM species (CHCl3, CHCl2Br, CHClBr2, and CHBr3) are separated by capillary gas chromatography and detected by an electron capture detector.
Equipment and Materials
The equipment and materials used for analysis of THMFP are listed in table 1.
The organic carbon-free water is produced onsite using a recirculating Picotech water system (Hydro Service and Supplies, Inc.). Inlet water for the Picotech system is deionized and is produced onsite with a Culligan deionizing system from Culligan International Company. The Picotech system is housed in a laboratory that contains no organic solvents, and the THMFP analysis procedure is performed in a laboratory
that contains no organic solvents in order to eliminate vapor-phase contamination of the water. Scheduled routine maintenance and replacement of cartridges are done on the Picotech and Culligan deionizing systems. The organic carbon-free water is tested frequently by analysis of DOC and THMFP (see “Blank Samples” section in this report).
Vials and other glassware items used for THMFP analysis are cleaned rigorously. Glassware is washed with Liquinox soap and rinsed with copious amounts of organic-free water. Openings are covered using aluminum foil and the glassware is baked at 450ºC in a muffle furnace for 4 hours. Baked glassware is stored in closed drawers or cabinets until use. Glass-fiber filters are baked under the same conditions, wrapped in aluminum foil, and stored in closed drawers or cabinets. Samples are stored in baked amber glass bottles sealed with Teflon-lined caps. Bottles supplied by the USGS Ocala Water-Quality Laboratory are made of virgin glass and are baked at 500ºC for 1.5 hours and, thus, are used without further cleaning.
Sample Collection and Filtration
Water samples for THMFP analysis should be collected using baked glass, Teflon, or stainless-steel sampling containers. Exposure to organic solvents must be prevented. For example, shallow surface-water grab samples can be collected directly into baked amber glass bottles, and deeper surface-water grab samples can be collected using a Teflon or stainless-steel Van Dorn-type sampler for transfer into baked amber glass bottles. If the sampler is cleaned with methanol (CH3OH), copious amounts of water must be used to rinse the sampler to ensure that the CH3OH is removed completely prior to collecting the sample. Samples must be filtered prior to analysis of the THMFP of the DOC. The THMFP of the total organic carbon (TOC) in the sample (the sum of the DOC and the particulate organic carbon) can be determined by analyzing the THMFP of unfiltered samples; however, care must be taken to assure that the sample is well mixed. Procedures for collecting and filtering samples, such as those given in chapters A4 and A5 of the USGS National Field Manual for the Collection of Water-Quality Data (Radtke and others, 2002), can be used if modified to avoid contact between the sample and solvents or plastics. No preservatives are added to the samples. Each sample is assigned a unique number as it is logged into the Laboratory Information Management System (LIMS) (LabWorks, Analytical Automation Specialists, Inc.), and it is stored at 4ºC until analyzed.
Dosing and Quenching Procedure
The samples are dosed with Cl2, incubated at 25°C for as many as 7 days, quenched using sodium sulfite (Na2SO3), and analyzed immediately by purge and trap/gas chromatography with an electron-capture detector.

4 Method of Analysis—Determination of Trihalomethane Formation Potential, Method Validation, and Quality-Control Practices
Table 1. Equipment and materials used for analysis of trihalomethane formation potential
[Sources for some items are listed to maintain quality standards. DPB, disinfection by-product]
Sample containers
Baked amber glass bottles with Teflon-lined lids
Ammonia and chlorine measurements
Ammonia salicylate and cyanurate reagent powder pillows (Hach, Loveland, Colorado)
Hach DPD free-chlorine reagent powder pillows, # 14077-28 or Dispenser # 10445
2-dram Opticlear vials, screw thread, # 60910-2 (Kimble Glass, Inc.)
Spectrophotometer, Genesys20 (ThermoSpectronic)
Pipettes, 1- and 5-milliliter adjustable Oxford Benchmate (Nichiryo Co., LTD) with disposable plastic tips (Labsource, Fisherbrand, or equivalent)
Dilution
Glass beakers and graduated cylinders
Bottle-top dispenser, adjustable from 10 to 109 milliliter (Fisher/Wheaton)
Pipettes, 1- and 5-milliliter adjustable Oxford Benchmate (Nichiryo Co., LTD) with disposable plastic tips (Labsource, Fisherbrand, or equivalent)
Dosing and quenching
Analytical balance, accuracy of 0.050 gram ± 0.0001 gram
Boric acid (Mallinckrodt analytical reagent grade or equivalent)
Dilute NaOH or HCl for pH adjustment
Sodium hydroxide pellets (American Chemical Society reagent grade, Aldrich Chemical, Milwaukee, Wisconsin)
Sodium hypochlorite 4 to 6 percent (Fisher purified grade, Fisher Scientific, Pittsburgh, Pennsylvania)
40-milliliter vials, amber borosilicate, TraceClean (VWR Scientific, West Chester, Pennsylvania)
Sodium sulfite, anhydrous (American Chemical Society reagent grade, Fisher Scientific, Pittsburgh, Pennsylvania)
pH meter, Orion model 420A with Triode gel electrode (Orion Research Inc., Beverly, Massachusetts)
pH buffer 7 and 10 (U.S. Geological Survey Ocala Water-Quality Laboratory, Ocala, Florida)
Trihalomethane analysis
Gas chromatograph, Hewlett-Packard 5890 (Wilmington, Delaware)
Archon purge and trap auto sampler (Varian, Walnut Creek, California)
Sample concentrator (Tekmar 3100)
Column, 30-meter megabore DB-VRX (J & W Scientific, Folsom, California)
Nitrogen, ultra-high purity (Sierra Air Gas, Sacramento, California)
Helium, ultra-high purity (Sierra Air Gas, Sacramento, California)
Solvents
Methanol, purge and trap grade
Organic-free water, produced onsite with Pico-pure water system (Hydro Service and Supplies, Inc.)
Standards
Chloroform and trihalomethane mix in methanol (Supelco, Bellefonte, Pennsylvania)
Neat 2-bromo-1-chloro-propane (Supelco, Bellefonte, Pennsylvania)
Volumetric flasks

Method of Analysis of Trihalomethane Formation Potential 5
Dose Calculation
The reactivity-based method used for determining the Cl2 dose is an empirical equation using the DOC and NH3-N concentrations in the sample (California Department of Water Resources, 1994; Krasner and Sclimenti, 1994). This dose will provide enough free Cl2 to satisfy the Cl2 demand of NH3-N in the sample, react with the DOC to form THM, and leave residual-free Cl2 content of 2 to 4 mg/L at the end of the experiment. The formula for calculating the free Cl2 dose in mg/L is as follows:
Free Cl2 dose = [3 × DOC+10 × NH3-N] × Fdose × Fdil (4)
where
The DOC of the sample is measured using a Shimadzu TOC 5000A analyzer. The DOC method and quality-assurance practices are described by Bird and others, 2003.
The NH3-N content of the sample is measured using the Hach salicylate colorimetric method (Hach, 1997). The method is applicable to samples with NH3-N contents of 0 to 0.5 mg/L. The concentration of NH3-N in a sample is determined by the intensity of green color formed after the addition of two reagents. A 5-mL sample is measured into an optically clear vial and ammonia salicylate is added. The vials are shaken and placed in the dark. Light interferes with the chemical reaction. After 3 minutes, ammonia cyanurate is added. The vials are shaken and returned to the dark. After 15 minutes, the vials are placed in the spectrophotometer set at 655 nanometers (nm) to record the absorbance. If the measured absorbance is greater than the absorbance of the highest standard that is used to establish the linear standard calibration, then the sample is diluted and reanalyzed. The absorbance readings are recorded directly into the LIMS using an RS-232 connection between the spectrophotometer and a networked computer. The spectrophotometer is calibrated using standards so the absorbance readings can be converted to NH3-N concentration.
The dose factor depends on the sample matrix and is an empirically determined value ranging from 1 to 3. Parameters considered by the analyst in determining the dose factor are the sample site, the DOC, the time of year, the NH3-N
concentration, and past results obtained using the same or similar water samples. The dilution factor depends on the amount of DOC in the sample. The DOC should be less than 3 mg/L to produce THMs within the calibration range of the instrument. The dilution factor generally ranges from 0.01 to 1. Samples containing Br- may be split in aliquots prepared using different dilution factors to ensure that the concentration of each of the four THM species is within the ranges of the standard curve for at least one of the dilutions. The dose and dilution factors are recorded in the LIMS.
Dosing
The samples are dosed using a solution containing 1 molar (M) boric acid (H3BO3)/0.11 M sodium hydroxide (NaOH) buffer and approximately 3,500 mg/L free Cl2 from sodium hypochlorite (NaOCl). The pH and free Cl2 are tested daily and the solution is remade if either parameter is out of tolerance. The pH of the dose solution must be 8.3 ±0.1 and the free Cl2 must be between 3,000 and 4,000 mg/L. A new solution is made weekly. Samples are diluted with organic-free water to bring the DOC below 3 mg/L before dosing. The pH of the sample is adjusted to a range between 8.3 and 8.7 by addition of dilute NaOH or hydrochloric acid (HCl). Three 40-mL amber vials are filled with sample and dosed by adding the appropriate volume of dose solution calculated from equation 4. The dose solution is added using a 100- or 250-microliter (µL) gas-tight syringe. The sample vials are filled carefully and capped so that little or no sample is lost. They are capped immediately with zero headspace after dosing to prevent loss of the volatile THM compounds.
The free Cl2 of the dose solution or a sample is measured by the Hach N, N-diethyl-p-phenylenediamine (DPD) colorimetric method (Hach, 1997). The dose solution must be diluted for this measurement. A packet of DPD free-Cl2 reagent is added to 5 mL of sample, shaken for 1 minute and the intensity of pink color is measured on the spectrophotometer set to measure absorbance at 530 nm. The spectrophotometer has been calibrated using standards so absorbance readings can be converted to free Cl2 concentration.
Incubating
The dosed samples are stored in an incubator maintained at 25°C for 7 days. Samples may be stored for different periods of time if determination of THMFP at different Cl2-DOC contact times is needed for a particular project.
DOC is the dissolved organic carbon concentration, in mg/L,
NH3 – N is the ammonia nitrogen concentration, in mg/L,
Fdose is the dose factor, and
Fdil is the dilution factor.
6 Method of Analysis—Determination of Trihalomethane Formation Potential, Method Validation, and Quality-Control Practices
Quenching and Acceptance Criteria
After completion of the incubation period, two vials of each sample are quenched with 50 µL of 0.4 M Na2SO3 solution to neutralize any remaining free Cl2. The sample pH and free Cl2 are measured in the third vial that has not been quenched. The pH must be 8.3 ± 0.1, and the residual-free Cl2 must be between 2 and 4 mg/L. The residual-free C12 specified by the EPA method and by the standard method are 0.5 to 1.5 mg/L and 3 to 5 mg/L, respectively. For this method, we chose a residual-free C12 range, which is between these two other methods. If either of these parameters is out of range, the sample is reanalyzed. Cl2 concentration and pH data are recorded directly into the LIMS by RS-232 connections between the pH meter and spectrophotometer to the networked computer.
Standards
Primary Standard Solution
A THM calibration mix containing 2,000 micrograms per milliliter (µg/mL) of each of the four compounds in methanol and a 5,000-µg/mL CHCl3 standard in methanol are purchased from Supelco. A methanol solution containing 80-µg/mL CHCl3 and 20-µg/mL CHCl2Br, CHClBr2, and CHBr3 is prepared by measuring 250 µL of the THM calibration mix and 300 µL of the CHCl3 standard and bringing to volume with methanol in a 25-mL volumetric flask. This solution is stored in a freezer and new solution is prepared every 2 months. The primary Standard Solution is diluted 25 times to give a solution containing 3.2-µg/mL CHC13 and 0.8-µg/mL CHC12Br, CHC1Br2, and CHBr3. This diluted primary standard solution is used to make the three lowest calibration standard solutions.
Calibration Standard Solutions
A series of 14 aqueous solutions containing 0.2 to 160 µg/L of CHCl3 and 0.04 to 40 µg/L of the three brominated species are prepared from the primary standards for use as calibration standards. The solutions are prepared immediately prior to analysis by measuring 0.5 to 100 µL of the primary standard solution using gas-tight syringes and bringing to volume with organic-free water in 50-mL volumetric flasks. The three lowest solutions are prepared by measuring 2.5 to 10 µL of the diluted primary standard solution.
Surrogate Solution
A neat standard of 2-bromo-1-chloropropane (CH2ClCHBrCH3) is purchased from Supelco. A methanol solution containing 0.3 µg/mL of CH2ClCHBrCH3 is prepared
by measuring 10 µL of the neat standard with a gas-tight syringe and bringing it to volume with methanol in a 50-mL volumetric flask. Each sample receives 1 µL of this surrogate solution injected automatically by the Varian Archon auto sampler, and the surrogate is an indicator of leaks in the instrument or of matrix effects from the water sample.
Instrument Performance
Instrument Conditions
The purge and trap instrument is composed of a Varian Archon auto-sampler, connected to the Tekmar model 3100 concentrator and a Hewlett-Packard 5890 GC equipped with an electron capture detector (ECD). The instrument settings for the purge and trap using capillary column GC/ECD are summarized in table 2.
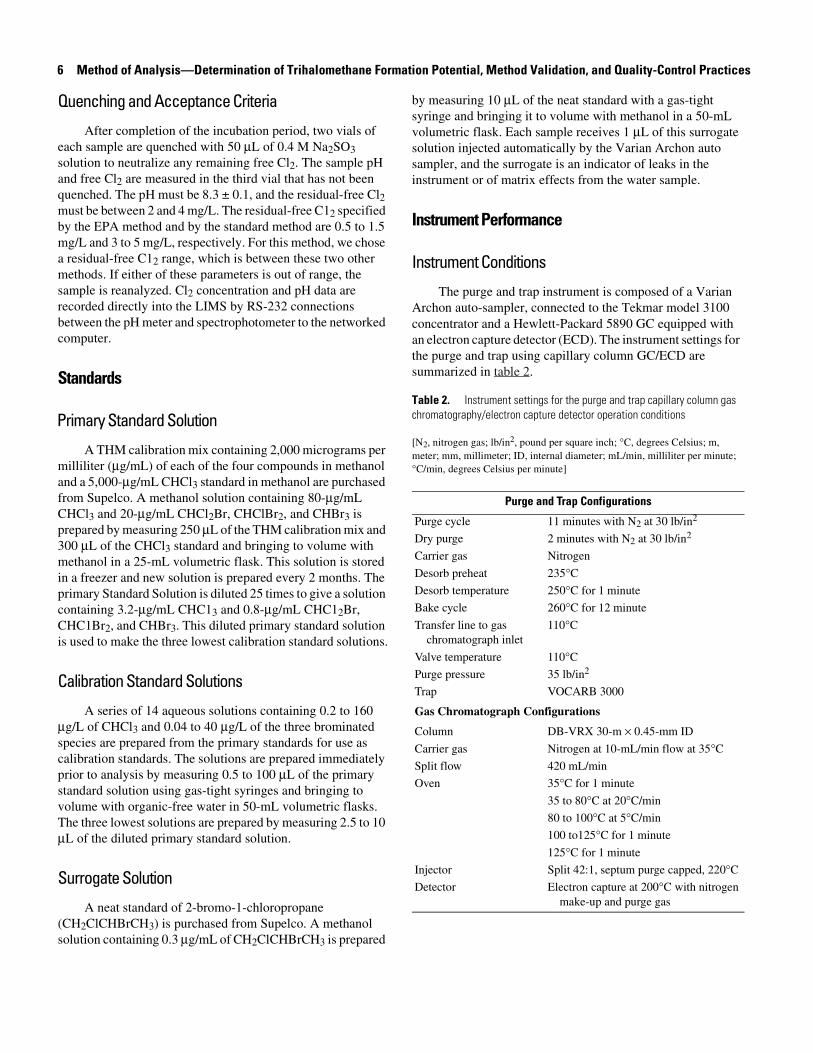
Table 2. Instrument settings for the purge and trap capillary column gas chromatography/electron capture detector operation conditions
[N2, nitrogen gas; lb/in2, pound per square inch; °C, degrees Celsius; m, meter; mm, millimeter; ID, internal diameter; mL/min, milliliter per minute; °C/min, degrees Celsius per minute]
Purge and Trap Configurations
Purge cycle 11 minutes with N2 at 30 lb/in2
Dry purge 2 minutes with N2 at 30 lb/in2
Carrier gas Nitrogen
Desorb preheat 235°C
Desorb temperature 250°C for 1 minute
Bake cycle 260°C for 12 minute
Transfer line to gas chromatograph inlet
110°C
Valve temperature 110°C
Purge pressure 35 lb/in2
Trap VOCARB 3000
Gas Chromatograph Configurations
Column DB-VRX 30-m × 0.45-mm ID
Carrier gas Nitrogen at 10-mL/min flow at 35°C
Split flow 420 mL/min
Oven 35°C for 1 minute
35 to 80°C at 20°C/min
80 to 100°C at 5°C/min
100 to125°C for 1 minute
125°C for 1 minute
Injector Split 42:1, septum purge capped, 220°C
Detector Electron capture at 200°C with nitrogen make-up and purge gas
Method of Analysis of Trihalomethane Formation Potential 7
The Varian Archon autosampler is set to run 5-mL samples and to automatically add a 1-µL injection of the surrogate as the sample is transferred to the purge tube. After the sample is transferred, the autosampler begins a cleaning process in which heated water rinses the purge tube between samples. Once this process is complete, the autosampler pauses until the concentrator and the GC have finished with the sample before analyzing the next vial.
The Tekmar concentrator is set up with a 5-mL purge tube and VOCARB 3000 trap. When first installed, the trap is conditioned by heating to 270ºC for 60 minutes. At the beginning of each new analysis, the bake cycle of the trap is run to remove possible contaminants. The efficiency of the trap is verified by tracking the change in area counts of the four compounds in one of the calibration verification standards. When the change in area count is greater than 20 percent, a new trap is installed.
The Hewlett-Packard 5890 GC is set up with a DB-VRX 30-m × 0.45-mm internal diameter (ID) column for the THM analysis. The transfer line from the Tekmar has been plumbed into the carrier gas inlet in the injector and the septum purge line has been capped. Each time the instrument is run, the gas flows and temperatures must be set and a new calibration curve is run. The column flow and the split flow are set to 10 and 420 mL/min, respectively. The ECD is turned on and heated to 200ºC. The ECD signal must stabilize to a value below 15.0 (150 Hertz (Hz)) before starting the analyses.
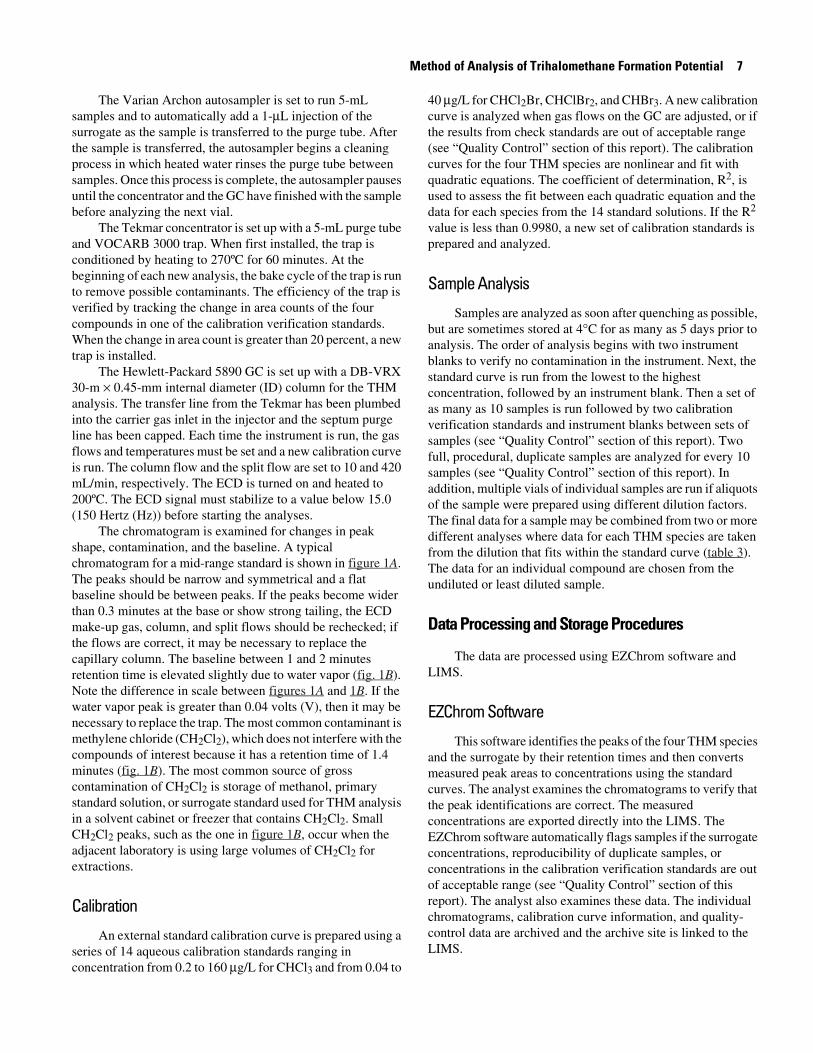
The chromatogram is examined for changes in peak shape, contamination, and the baseline. A typical chromatogram for a mid-range standard is shown in figure 1A. The peaks should be narrow and symmetrical and a flat baseline should be between peaks. If the peaks become wider than 0.3 minutes at the base or show strong tailing, the ECD make-up gas, column, and split flows should be rechecked; if the flows are correct, it may be necessary to replace the capillary column. The baseline between 1 and 2 minutes retention time is elevated slightly due to water vapor (fig. 1B). Note the difference in scale between figures 1A and 1B. If the water vapor peak is greater than 0.04 volts (V), then it may be necessary to replace the trap. The most common contaminant is methylene chloride (CH2Cl2), which does not interfere with the compounds of interest because it has a retention time of 1.4 minutes (fig. 1B). The most common source of gross contamination of CH2Cl2 is storage of methanol, primary standard solution, or surrogate standard used for THM analysis in a solvent cabinet or freezer that contains CH2Cl2. Small CH2Cl2 peaks, such as the one in figure 1B, occur when the adjacent laboratory is using large volumes of CH2Cl2 for extractions.
Calibration
An external standard calibration curve is prepared using a series of 14 aqueous calibration standards ranging in concentration from 0.2 to 160 µg/L for CHCl3 and from 0.04 to
40 µg/L for CHCl2Br, CHClBr2, and CHBr3. A new calibration curve is analyzed when gas flows on the GC are adjusted, or if the results from check standards are out of acceptable range (see “Quality Control” section of this report). The calibration curves for the four THM species are nonlinear and fit with quadratic equations. The coefficient of determination, R2, is used to assess the fit between each quadratic equation and the data for each species from the 14 standard solutions. If the R2 value is less than 0.9980, a new set of calibration standards is prepared and analyzed.
Sample Analysis
Samples are analyzed as soon after quenching as possible, but are sometimes stored at 4°C for as many as 5 days prior to analysis. The order of analysis begins with two instrument blanks to verify no contamination in the instrument. Next, the standard curve is run from the lowest to the highest concentration, followed by an instrument blank. Then a set of as many as 10 samples is run followed by two calibration verification standards and instrument blanks between sets of samples (see “Quality Control” section of this report). Two full, procedural, duplicate samples are analyzed for every 10 samples (see “Quality Control” section of this report). In addition, multiple vials of individual samples are run if aliquots of the sample were prepared using different dilution factors. The final data for a sample may be combined from two or more different analyses where data for each THM species are taken from the dilution that fits within the standard curve (table 3). The data for an individual compound are chosen from the undiluted or least diluted sample.
Data Processing and Storage Procedures
The data are processed using EZChrom software and LIMS.
EZChrom Software
This software identifies the peaks of the four THM species and the surrogate by their retention times and then converts measured peak areas to concentrations using the standard curves. The analyst examines the chromatograms to verify that the peak identifications are correct. The measured concentrations are exported directly into the LIMS. The EZChrom software automatically flags samples if the surrogate concentrations, reproducibility of duplicate samples, or concentrations in the calibration verification standards are out of acceptable range (see “Quality Control” section of this report). The analyst also examines these data. The individual chromatograms, calibration curve information, and quality-control data are archived and the archive site is linked to the LIMS.

8
Method of Analysis—Determination of Trihalomethane Formation Potential, Method Validation, and Quality-Control PracticesVOLT
S7
6
5
4
3
2
1
0
0.45
0.40
0.35
0.30
0.25
0.20
0.15
0.10
0.05
00
0.5 1.0 1.5 2.0 2.5 3.0 3.5 4.0 4.5 5.0 5.5 6.0 6.5 7.0
CHCI3
CHCI3
CH2CI2
CHCI2Br
CHCIBr2
CHCI2Br
CHBr2CI CHBr3
CHBr3
surrogate
surrogate
A
B
watervapor
MINUTES
Figure 1. Chromatograms of (A) a typical mid-range standard, and (B) an instrument blank run after a high standard containing the four trihalomethane species and methylene chloride (files 120502011 and 010203004).Note the difference in y-axis scales in panels A and B.

Method Validation 9
Table 3. Example to show combination of different gas chromatograph files for aliquots with different dose and instrument dilutions to make final choices from data
[CHCl3, chloroform; CHCl2Br, bromodichloromethane; CHClBr2, dibromochloromethane; CHBr3, bromoform; µg/L, microgram per liter]
SampleDosing dilution
Injection dilution
Measured on GC Corrected for dilutions
CHCl3(µg/L)
CHCl2Br(µg/L)
CHClBr2(µg/L)
CHBr3(µg/L)
CHCl3(µg/L)
CHCl2Br(µg/L)
CHClBr2(µg/L)
CHBr3(µg/L)
GR00199 1 1 1100 2250 2200 120 100 250 200 20
GR00199 diluted .1 1 19 27.5 22 11.8 90 275 220 18
GR00199 combined 100 275 220 20
GR00200 1 1 2300 2200 130 115 300 200 30 15
GR00200 diluted 1 .2 57 50 16.6 13.8 285 250 33 19
GR00200 combined 285 250 30 15
1If both concentrations are within the range of the calibration standards, then the concentration from the least diluted sample is chosen.2Concentration exceeds value in highest calibration standard; therefore, the concentration from the diluted sample is chosen.
Laboratory Information Management System
Sample concentrations for each vial are calculated from the measured concentrations and the dose- and instrument-dilution factors. For samples analyzed at several different dose- and (or) instrument-dilution factors, the analyst must choose the appropriate vial from which to take the final concentration for each THM species, based on the value that fits within the standard curve. If more than one value fits within the standard curve, then the value produced from the least amount of dilution is chosen. The data are accessible to users of the LIMS after the analyst verifies the final concentrations. Procedures are being developed to export THMFP data from the LIMS to the U.S. Geological Survey National Water Information System (NWIS).
THMFP determined by this method refers to the result of incubation in the dark at 25ºC and pH of 8.3 for 7 days with sufficient chlorine dose to leave a residual of 2 to 4 mg/L. THMFP is calculated as the sum of the mass concentrations of individual THMs, in µg/L. Non-detects are treated as zero in the sum. Both the sum and the individual THMs are reported. Alternative calculations of THMFP in µM are provided if required by a particular project.
STHMFP determined by this method is the ratio of THMFP, in millmoles per liter, to DOC, in moles per liter. It is equivalent to parts per thousand of organic carbon atmos that form THM.
Samples that contain little bromide generally produce THM concentrations ordered as CHC13 >> CHC12Br >> CHC1Br2 > CHBr3, and non-detects are rare for the first two species. Samples with more bromide generally produce THM concentrations ordered as CHC13 ~ CHC12Br ~ CHC1Br2 > CHBr3, and non-detects are rare for all four species. In any
case, the precision of reported THMFP is dominated by the precision of the largest-concentration species, which is about 1 percent, rather than by the value assigned to non-detects.
THMFP data include variability due to the precise chlorine residual and the effects of bromide concentration and possible dilution. The effective precision of the full procedure is estimated to be about 4 percent.
Method Validation
A number of experiments were performed on three different natural water samples to validate the THMFP method. The first sample, AR, was collected from the American River at California State University, Sacramento, and had a DOC concentration of 1.6 mg/L. The second sample, SE, was a soil water extract and had a DOC concentration of 43 mg/L. The sample was produced by mixing Twitchell Island peat soil with organic-free water in a ratio of 15 grams (dry weight) of soil to 230 mL of water, followed by centrifugation and filtration to extract the water. The third sample, TW1, was collected from an agricultural drain on Twitchell Island and had a DOC concentration of 17 mg/L. The three water samples differ not only in their DOC concentration but also in the chemical composition of the DOC. Aliquots of AR were spiked with sodium bromide (NaBr) to create samples with different bromide (Br-) concentrations (ARBr1, ARBr2, and ARBr3). The initial Br- concentration of the samples were not measured, but can be estimated from the Br content of the THMs produced in the experiments. Assuming 50 percent of the Br- was incorporated in the THMs, the initial Br- concentration in the AR sample was estimated to be 0.006 mg/L.

10 Method of Analysis—Determination of Trihalomethane Formation Potential, Method Validation, and Quality-Control Practices
The composition and use of samples for the THMFP method validation experiments are summarized in table 4. The following five experiments were performed on the water samples:
1. Method precision: Ten replicate analyses of THMFP were performed to determine method precision.
2. Sample aging: The samples were analyzed weekly for 6 weeks to determine the effect of delay between sample collection and analysis of THMFP.
3. Residual Cl2: The samples were dosed to yield residual-free Cl2 concentrations ranging from 0.03 to 16 mg/L to determine the effect of residual-free Cl2 concentration on THMFP.
4. Dilution: The samples were diluted prior to dosing and (or) after quenching to determine the effect of dilution method and amount on THMFP.
5. Br- concentration: The samples were spiked with different concentrations of NaBr to determine the effect of Br- concentration on THMFP and THM speciation.
Method detection limits (MDLs) for the individual THMs were not formally determined, because low concentrations are not the primary interest of data users. The lowest calibration standard for each of the four analytes provides a signal from the ECD at least 5 times backgrouond, so we estimate MDLs as less than these lowest standards.
Method Precision
Method precision was estimated by analyzing 10 replicate aliquots of the AR and SE samples. Each aliquot was dosed individually. Precision is expressed as the percent relative standard deviation (RSD), which is calculated from the mean and the standard deviation of the replicate analyses:
(5)
where
(6)
and
(7)
and where
Most of the RSD values are less than 1 percent (table 5); therefore, analytical precision is estimated to be 1 percent. Based on application of the American Society for Testing and Material rounding standard (American Society for Testing and Material, 1993), the last significant digit in the concentration data for the THM species is hundredths for values less than 10 µg/L, tenths for values between 10 and 200 µg/L, ones for values between 200 and 1,500 µg/L, and tens for values greater than 1,500 µg/L.
Table 4. Samples used and tests performed for validation of the trihalomethane formation potential analytical method
[DOC, dissolved organic carbon; Br-, bromide ion. Experiments: 1, method precision; 2, sample aging; 3, residual chlorine; 4, dilution; 5, bromide concentration. mg/L, milligram per liter]
SampleDOC
(mg/L)Br-
(mg/L)Experiments
AR 1.6 0.006 1, 2, 3, 4, 5
ARBr1 1.6 .11 5
ARBr2 1.6 .18 5
ARBr3 1.6 .27 3, 4, 5
SE 43 .12 1, 2
TW1 17 .23 4
RSD is the percent relative standard deviation for the replicate analyses;
sx is the standard deviation of the replicate analyses;
x is the mean of the replicate analyses;
x is the value for an analysis; and
n is the number of replicate analyses.
RSDsx
x---- 100×=
sx
x x–( )2∑n 1–
--------------------------=
xx∑
n----------=

Method Validation 11
Effect of Sample Aging on Trihalomethane Formation Potential
Water samples AR and SE were analyzed weekly for 6 weeks following sample collection to assess the effect of sample aging on the total THMFP. The samples were stored in baked amber glass bottles at 4°C between analyses. No preservative was added to the samples. Ten replicate aliquots of
each sample were analyzed at the time of collection and five replicate aliquots were analyzed at the remaining five time points. The aliquots always were dosed with the same concentration of Cl2.
The THMFP of the AR sample changed from values ranging from 129 to 133 µg/L to 143 to 147 µg/L (fig. 2). This is an increase of about 10 percent during a 5-week period. Likewise, the THMFP of the SE sample changed from a range of values from 3,200 to 3,300 µg/L to a range of 3,300 to 3,450 µg/L. This is an increase of about 7 percent during a 6-week period. For both samples, the aliquot analyzed after 3 weeks of aging did not follow the general trend of increasing THMFP with increasing aging. The THMFP of the AR sample remained the same during weeks 2 and 3 then decreased in week 4 before increasing in week 5. The THMFP of the AR sample always remained higher in the subsequent weeks compared with the THMFP level at the initial collection. In contrast, the THMFP of the SE sample increased in week 1 and decreased to the level of the initial sample in week 3, followed by a decrease in week 4 and increases in weeks 5 and 6. The reason for the change in THMFP with sample aging was not investigated in this study. Because DOC concentration was measured only at the time of collection, it is not known whether the changes in THMFP were due to changes in DOC concentration or changes in the chemical structure of the DOC with aging. The amount of Cl2 consumed did not correlate with sample aging time.
Table 5. Precision values calculated from 10 replicates each of American River and soil-extracted water
[CHCl3, chloroform; CHCl2Br, bromodichloromethane; CHClBr2, dibromochloromethane; CHBr3, bromoform. µg/L, microgram per liter; nd, not detected; RSD, relative standard deviation]
Statistical parameter
CHCl3(µg/L)
CHCl2Br(µg/L)
CHClBr2(µg/L)
CHBr3(µg/L)
Sample AR
Mean 125.5 6.35 0.25 nd
Standard deviation 1.0 .03 .003
RSD .83 .52 1.27
Sample SE
Mean 3,100 123.6 3.51 nd
Standard deviation 28 .7 .14
RSD .92 .59 3.93
TRIH
ALOM
ETHA
NE
FORM
ATIO
NPO
TEN
TIAL
INSA
MPL
EAR
,IN
MIC
ROGR
AMS
PER
LITE
R
TRIH
ALOM
ETHA
NE
FORM
ATIO
NPO
TEN
TIAL
INSA
MPL
ESE
,IN
MIC
ROGR
AMS
PER
LITE
R
TIME SINCE SAMPLE COLLECTION, IN WEEKS
125
130
135
140
145
150
3,000
3,100
3,200
3,300
3,400
3,500
0 1 2 3 4 5 6
ARSE
Figure 2. Trihalomethane formation potential of aliquots of samples AR and SE analyzed 0–6 weeks after sample collection.THMFP, trihalomethane formation potential.

12 Method of Analysis—Determination of Trihalomethane Formation Potential, Method Validation, and Quality-Control Practices
A parametric statistical test is not the best test for the small sample size of five; therefore, the Wilcoxon-Mann-Whitney Rank Sum Test, a nonparametric statistical test, was used to determine if there was a significant difference in THMFP concentration (Helsel and Hirsch, 1995). The AR aliquots were significantly different at the 95-percent confidence level from weeks 0 to 1. In contrast, the SE aliquots were different only at the 95-percent confidence interval from weeks 0 to 4 and 0 to 6.
Samples are analyzed as soon after collection as possible to minimize the effects of aging. In the USGS Sacramento Laboratory, samples are dosed as soon as the DOC has been measured, usually within 2 days of arrival.
Effect of Residual Chlorine Concentration on Trihalomethane Formation Potential
The method specifies that the residual-free Cl2 concentrations at the end of the 7-day incubation period must be 2 to 4 mg/L. This range was selected primarily because it is close to the residual Cl2 concentrations utilized in the drinking-water-treatment process (Krasner and Sclimenti, 1994).
To test the dependence of THMFP on residual Cl2 concentration aliquots of the AR and ARBr3, samples were dosed to yield residual-free Cl2 concentrations ranging from 0.03 to 16 mg/L. The molar THMFP of AR and ARBr3 increased from 0.93 to 1.33 µmol/L and from 1.05 to 1.42 µmol/L, respectively, as the residual-free Cl2 concentration increased (fig. 3). THMFP was plotted in molar units rather
than mass units to unambiguously show the increase in THM formation. The atomic mass of Br is about twice that of Cl, so increases in the relative proportion of brominated species will result in increasing THMFP when expressed in mass units, even if the amount of THM formation remains constant. The rate of increase in THMFP was greatest at low residual Cl2 concentrations, but the THMFP value still had not leveled out to a constant value at the highest residual Cl2 concentrations investigated.
The increase in THMFP of sample AR entirely was due to an increase in CHCl3; concentrations of the brominated THM species remained essentially constant as residual Cl2 concentration increased (fig. 4A). This supports previous studies showing that oxidation of Br- to HOBr (reaction #3) occurs very rapidly and that HOBr reacts much faster than HOCl to form THMs (Morris, 1978; Symons and others, 1993; Krasner and Sclimenti, 1994).
Approximately 45 percent of Br- added to sample ARBr3 was incorporated into the THMs; the remaining Br- probably was incorporated into other DBPs. Samples AR and ARBr3 showed a similar rate of increase of THMFP with increasing Cl2 dose, but the THMFP of ARBr3 was 10 to 15 percent higher than the THMFP of AR (fig. 3). This difference is discussed in more detail in the section “Effect of Bromide Concentration on Trihalomethane Formation Potential.” The increase in THMFP as residual Cl2 concentration was observed as an increase in CHCl3 (fig. 4B). However, CHCl2Br also increased, and was matched by a decrease in CHBr3.
RESIDUAL FREE CHLORINE, IN MILLIGRAMS PER LITER
0 2 4 6 8 10 12 14 16 180.9
1.0
1.1
1.2
1.3
1.4
1.5
ARARBr3
TRIH
ALOM
ETHA
NE
FORM
ATIO
NPO
TEN
TIAL
,IN
MIC
ROM
OLES
PER
LITE
R
Figure 3. Trihalomethane formation potential of aliquots of samples AR and ARBr3 dosed to yield a range of residual-free chlorine concentrations at the end of the incubation period.THMFP, trihalomethane formation potential.

Method Validation 13
FORM
ATIO
NPO
TEN
TIAL
SOF
TRIH
ALOM
ETHA
NE
SPEC
IES,
INM
ICRO
MOL
ESPE
RLI
TER
FORM
ATIO
NPO
TEN
TIAL
SOF
CHCI
2BR,
CHCI
BR2,
AND
CHBR
3,IN
MIC
ROM
OLES
PER
LITE
R
RESIDUAL FREE CHLORINE, IN MILLIGRAMS PER LITER
0 2 4 6 8 10 12 14 16 180
0.1
0.2
0.3
0.4
0.5
0.6
B
0.8
0.9
1.0
1.1
1.2
1.3
FORM
ATIO
NPO
TEN
TIAL
SOF
CHCI
3,IN
MIC
ROM
OLES
PER
LITE
RA
0
0.01
0.02
0.03
0.04
0.05
CHCl3CHCl2BrCHClBr2
CHBr3
CHCl3CHCl2BrCHClBr2
CHBr3
Figure 4. Formation potentials of chloroform, bromodichloromethane, dibromochloromethane, and bromoform in aliquots of samples (A) AR and (B) ARBr3 dosed to yield a range of residual-free chlorine concentrations at the end of the incubation period.CHCl3, chloroform; CHCl2Br, bromodichloromethane; CHClBr2, dibromochloromethane; CHBr3, bromoform.
14 Method of Analysis—Determination of Trihalomethane Formation Potential, Method Validation, and Quality-Control Practices
It is unfortunate that all of the the methods of analyses used for THMFP specify residual-free Cl2 concentrations of <5 mg/L because that is the range where the THMFP is strongly dependant on residual-Cl2 concentration (USEPA 510.1, 0.5 to 1.5 mg/L; Standard method, 3 to 5 mg/L; this method, 2 to 4 mg/L). For the AR sample, the error in THMFP introduced by this range is ± 0.037 µmol/L (± 4.5 µg/L).
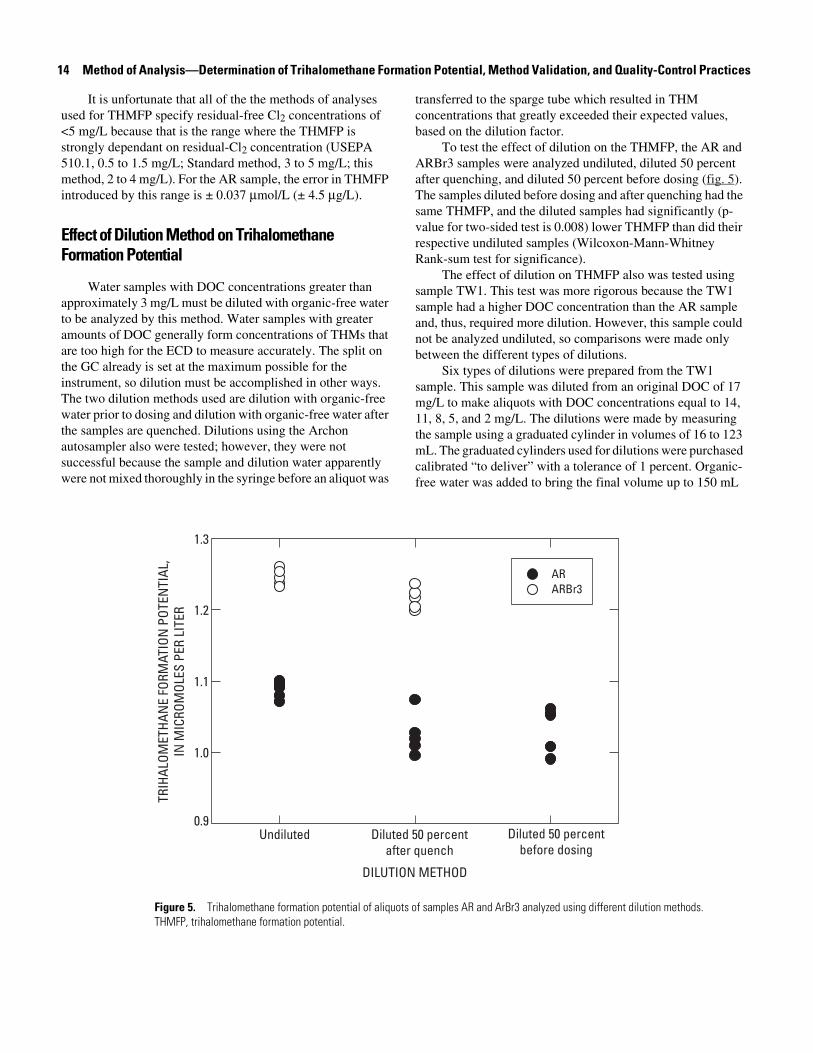
Effect of Dilution Method on Trihalomethane Formation Potential
Water samples with DOC concentrations greater than approximately 3 mg/L must be diluted with organic-free water to be analyzed by this method. Water samples with greater amounts of DOC generally form concentrations of THMs that are too high for the ECD to measure accurately. The split on the GC already is set at the maximum possible for the instrument, so dilution must be accomplished in other ways. The two dilution methods used are dilution with organic-free water prior to dosing and dilution with organic-free water after the samples are quenched. Dilutions using the Archon autosampler also were tested; however, they were not successful because the sample and dilution water apparently were not mixed thoroughly in the syringe before an aliquot was
transferred to the sparge tube which resulted in THM concentrations that greatly exceeded their expected values, based on the dilution factor.
To test the effect of dilution on the THMFP, the AR and ARBr3 samples were analyzed undiluted, diluted 50 percent after quenching, and diluted 50 percent before dosing (fig. 5). The samples diluted before dosing and after quenching had the same THMFP, and the diluted samples had significantly (p-value for two-sided test is 0.008) lower THMFP than did their respective undiluted samples (Wilcoxon-Mann-Whitney Rank-sum test for significance).
The effect of dilution on THMFP also was tested using sample TW1. This test was more rigorous because the TW1 sample had a higher DOC concentration than the AR sample and, thus, required more dilution. However, this sample could not be analyzed undiluted, so comparisons were made only between the different types of dilutions.
Six types of dilutions were prepared from the TW1 sample. This sample was diluted from an original DOC of 17 mg/L to make aliquots with DOC concentrations equal to 14, 11, 8, 5, and 2 mg/L. The dilutions were made by measuring the sample using a graduated cylinder in volumes of 16 to 123 mL. The graduated cylinders used for dilutions were purchased calibrated “to deliver” with a tolerance of 1 percent. Organic-free water was added to bring the final volume up to 150 mL
0.9
1.0
1.1
1.2
1.3
ARARBr3
Undiluted Diluted 50 percentafter quench
Diluted 50 percentbefore dosing
TRIH
ALOM
ETHA
NE
FORM
ATIO
NPO
TEN
TIAL
,IN
MIC
ROM
OLES
PER
LITE
R
DILUTION METHOD
Figure 5. Trihalomethane formation potential of aliquots of samples AR and ArBr3 analyzed using different dilution methods.THMFP, trihalomethane formation potential.

Method Validation 15
(or 140 mL for the 2 mg/L dilution) using a Wheaton bottle-top dispenser. The samples were dosed and incubated for 7 days. The samples were diluted again after the 7 days to a final DOC of about 1.5 mg/L to be certain that concentrations of all four THM species would be within the standard curve. The final dilutions were made using a pipettor to measure sample volumes from 4 to 20 mL into either a 50 or 100-mL volumetric flask. The 17- and 8-mg/L dilution samples were dosed with two concentrations of Cl2 (fig. 6) so that the effect of residual Cl2 concentration could be observed. The residual Cl2 for the 8-mg/L samples were 2.7 and 4.4 mg/L, and the residual Cl2 for the 17-mg/L samples were 1.4 and 7.6 mg/L.
The molar THMFP of sample TW1 increased with the DOC concentration at the time of dosing with Cl2 (fig. 6). The residual-free Cl2 values for each sample dilution have been included in the graph for comparison because increasing residual Cl2 also increases the THMFP (fig. 3). The THMFP of the aliquot dosed at a DOC concentration of 17 mg/L (undiluted) and with a residual-free Cl2 concentration of 1.4 mg/L was greater than the THMFP of all the aliquots dosed at a DOC concentration of 2, 5, and 8 mg/L, even though the latter aliquots had higher residual-free Cl2 concentrations.
The data show that making dilutions after quenching the samples lowers the measured THM concentration in the sample aliquot. THMFP of the undiluted AR and ARBr3 samples were approximately 5 percent higher than the THMFP of the AR and
ARBr3 samples diluted after quenching and the THMFP of the AR diluted before dosing (fig. 5). Similarly, the CHClBr2 concentrations in aliquots of the TW1 sample analyzed with no dilution after quenching were approximately 5 percent higher than the CHClBr2 concentrations in aliquots that had the same DOC concentration at the time of dosing, but that were diluted after quenching (not shown). This effect probably occurred with the other three THM species, but only the CHClBr2 concentrations were within the range of the standards for the undiluted and diluted aliquots. Making dilutions after quenching requires opening the sample vial and drawing the sample into a pipettor. The volatile THMs begin to escape from the sample during this process.
The observation that molar THMFP increases with the DOC concentration at the time of dosing with Cl2 has implications for the comparability of THMFP and STHMFP data from samples having different DOC concentrations. STHMFP was intended to be a measure of the intrinsic reactivity of the DOC in the sample and, therefore, to reflect chemical features of the DOC. The data in figure 6 suggest that the THMFP of sample TW1 decreases by approximately 0.8 mmol/L as the DOC concentration at the time of dosing decreases from 17 to 2 mg/L for a constant residual Cl2 concentration. At a residual Cl2 concentration of 4 mg/L, this decrease in THMFP corresponds to a decrease in STHMFP from 10.4 to 9.82 millimoles per mole (mmol/mol).
0 2 4 6 8 10 12 14 16 1813.5
14.0
14.5
15.0
15.5
16.0
7.6
1.4
5.66.0
4.4
2.73.6
3.4
3.3
6.0
6.3
TRIH
ALOM
ETHA
NE
FORM
ATIO
NPO
TEN
TIAL
,IN
MIC
ROM
OLES
PER
LITE
R
DISSOLVED ORGANIC CARBON, IN MILLIGRAMS PER LITER
Figure 6. Trihalomethane formation potential of aliquots of sample TW1 that were diluted to different dissolved organic carbon concentrations before dosing with chlorine.Numbers next to points indicate residual-free chlorine concentrations, in milligrams per liter. THMFP, trihalomethane formation potential; DOC, dissolved organic carbon.
16 Method of Analysis—Determination of Trihalomethane Formation Potential, Method Validation, and Quality-Control Practices
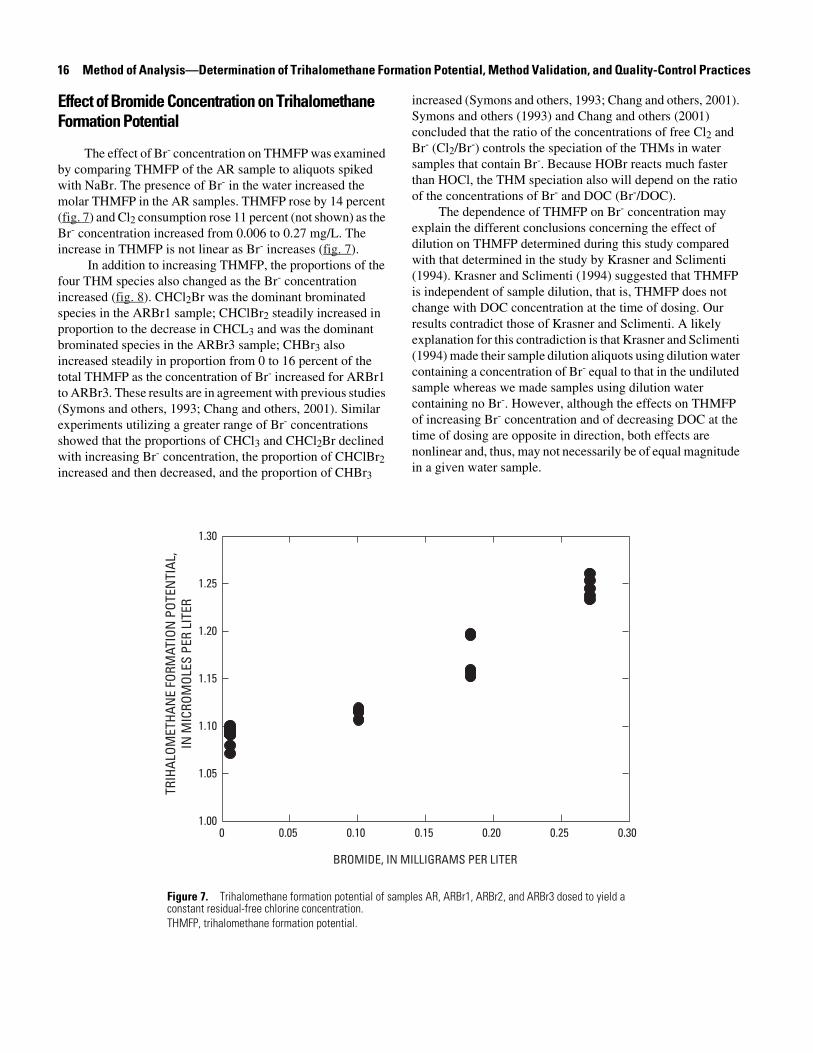
Effect of Bromide Concentration on Trihalomethane Formation Potential
The effect of Br- concentration on THMFP was examined by comparing THMFP of the AR sample to aliquots spiked with NaBr. The presence of Br- in the water increased the molar THMFP in the AR samples. THMFP rose by 14 percent (fig. 7) and Cl2 consumption rose 11 percent (not shown) as the Br- concentration increased from 0.006 to 0.27 mg/L. The increase in THMFP is not linear as Br- increases (fig. 7).
In addition to increasing THMFP, the proportions of the four THM species also changed as the Br- concentration increased (fig. 8). CHCl2Br was the dominant brominated species in the ARBr1 sample; CHClBr2 steadily increased in proportion to the decrease in CHCL3 and was the dominant brominated species in the ARBr3 sample; CHBr3 also increased steadily in proportion from 0 to 16 percent of the total THMFP as the concentration of Br- increased for ARBr1 to ARBr3. These results are in agreement with previous studies (Symons and others, 1993; Chang and others, 2001). Similar experiments utilizing a greater range of Br- concentrations showed that the proportions of CHCl3 and CHCl2Br declined with increasing Br- concentration, the proportion of CHClBr2 increased and then decreased, and the proportion of CHBr3
increased (Symons and others, 1993; Chang and others, 2001). Symons and others (1993) and Chang and others (2001) concluded that the ratio of the concentrations of free Cl2 and Br- (Cl2/Br-) controls the speciation of the THMs in water samples that contain Br-. Because HOBr reacts much faster than HOCl, the THM speciation also will depend on the ratio of the concentrations of Br- and DOC (Br-/DOC).
The dependence of THMFP on Br- concentration may explain the different conclusions concerning the effect of dilution on THMFP determined during this study compared with that determined in the study by Krasner and Sclimenti (1994). Krasner and Sclimenti (1994) suggested that THMFP is independent of sample dilution, that is, THMFP does not change with DOC concentration at the time of dosing. Our results contradict those of Krasner and Sclimenti. A likely explanation for this contradiction is that Krasner and Sclimenti (1994) made their sample dilution aliquots using dilution water containing a concentration of Br- equal to that in the undiluted sample whereas we made samples using dilution water containing no Br-. However, although the effects on THMFP of increasing Br- concentration and of decreasing DOC at the time of dosing are opposite in direction, both effects are nonlinear and, thus, may not necessarily be of equal magnitude in a given water sample.
TRIH
ALOM
ETHA
NE
FORM
ATIO
NPO
TEN
TIAL
,IN
MIC
ROM
OLES
PER
LITE
R
1.00
1.05
1.10
1.15
1.20
1.25
1.30
0 0.05 0.10 0.15 0.20 0.25 0.30
BROMIDE, IN MILLIGRAMS PER LITER
Figure 7. Trihalomethane formation potential of samples AR, ARBr1, ARBr2, and ARBr3 dosed to yield a constant residual-free chlorine concentration.THMFP, trihalomethane formation potential.

Method Validation 17
Sample ARBr2
Sample ARBr1
Sample AR
Sample ARBr3
[Br-] = 0.006 mg/L
[Br-] = 0.11 mg/L
[Br-] = 0.18 mg/L
[Br-] = 0.27 mg/L
CHCI3
CHCI3
CHCI2Br
CHCIBr2
CHBr3
CHCI3CHCI2Br
CHBr3
CHCIBr2
CHCI3
CHBr3CHCIBr2
CHCI2Br
CHCI2Br
Figure 8. Proportions of chloroform, bromodichloromethane, dibromochloromethane, and bromoform formation potentials in samples AR, ARBr1, ARBr2, and ARBr3 dosed to yield a constant residual-free chlorine concentration.
18 Method of Analysis—Determination of Trihalomethane Formation Potential, Method Validation, and Quality-Control Practices
Quality-Control Practices
Analytical Sequence
The analytical sequence follows the same general pattern for each run. One or two instrument blanks are analyzed first, followed by the calibration standards. An instrument blank is run next in order to monitor carry-over from the highest standard. Then a set of as many as 10 samples is run. After each set of samples is run, two calibration verification standards are analyzed to verify the calibration. Another instrument blank is run after these calibration verification standards. Sets composed of samples, full procedural blanks, duplicates, calibration verification standards, and instrument blanks are run until all the samples have been analyzed. The initial calibration curve may be used for as much as 1 week, providing that gas flows have not been changed.
Blanks
Two types of blanks are analyzed for the THMFP method, instrument blanks and full procedural blanks. Instrument blanks consist of organic-free water analyzed without dosing or quenching and are used to test for THM contamination in the organic-free water, the surrogate solution, and the purge and trap and GC instruments. Instrument blanks are analyzed at the start of a run and between sets of samples within a run. The measured THM concentration in the instrument blank must be less than half the concentration in the lowest calibration standard. This corresponds to maximum permissible concentrations in the instrument blanks of 0.08-µg/L CHCl3 and 0.02-µg/L CHCl2Br, CHClBr2, or CHBr3. Instrument blanks also may be analyzed after the analysis for samples suspected of having concentrations of some THM species that are greater than the concentrations in the highest standard. In this case, the instrument blank serves to prevent contamination of the next sample by removing the compounds that may still be present in the purge and trap or GC column.
If the instrument blanks analyzed at the start of a run or between sets of samples within a run have higher than permitted concentrations of THMs, corrective actions must be taken. To determine the source of the problem, first, an instrument blank is analyzed without the surrogate injection and compared with those analyzed with the surrogate injection. If the surrogate injection seems to be the source of the contamination, it is prepared again. Second, determine if there is carry-over of THMs from one sample to the next; carry-over indicates that either the trap has deteriorated, and thus the THMs are not desorbed efficiently from it, or a cold spot exists in the Tekmar concentrator unit or in the transfer line from the
unit to the GC injection port. The trap may be replaced, and the operation of the heating units is checked. Third, if the source of the contamination is not found in the surrogate solution, the trap, or the instruments, then the resin tanks in the organic-free water Picotech system may be the source and should be replaced.
Full procedural blanks consist of organic-free water that is dosed, incubated, and quenched like a sample. It is dosed to achieve a free-Cl2 concentration of 3 mg/L. The full procedural blank is used to test for DOC contamination of the organic-free water and the overall cleanliness of sample handling during the dosing and quenching process. If the concentration of CHCl3 in the full procedural blank is greater than 1.2 µg/L, then corrective actions must be taken. The organic-free water system may require maintenance and the laboratory glassware cleaning procedures may need to be reviewed.
The THMFP of a full procedural blank is a more sensitive method for measuring contamination of the organic-free water with natural DOC than is direct measurement of DOC concentration. Assuming that natural DOC forms between 1 and 20 mmols of CHCl3 per mole of DOC (Oliver and Thurman, 1983; Reckhow and others, 1990; and Fram and others, 1999), a CHCl3 concentration of 1.2 µg/L corresponds to a DOC concentration of 0.12 to 0.006 mg/L. For comparison, the method detection limit for analysis of DOC in the USGS Sacramento Laboratory is 0.12 mg/L (Bird and others, 2003). However, contamination with organic solvents that do not react with Cl2 to form THMs, such as methanol, is not detected by measuring the THMFP of the organic-free water, therefore, the organic-free water DOC also is monitored by direct analysis of DOC concentration.
Calibration Verification Standards
Calibration verification standards are used to verify that the calibration is accurate through the entire run. They are prepared by the same method as the calibration standards. A mid-level (63 µg/L of CHCl3) and a low-level (24 µg/L of CHCl3) calibration verification standard are run after every set of 10 sample injections. The measured concentrations are compared with the calculated concentrations (eq. 8).
(8)
where
Acceptable difference values are 5 percent for all four THM species in the mid-level calibration verification standard,
Cmeas is the measured concentration, and
Ccalc is the calculated concentration.
differenceCmeas Ccalc–
Ccalc----------------------------------- 100×=

Quality-Control Practices 19
5 percent for CHCl2Br and CHClBr2 in the low-level calibration verification standard, and 10 percent for CHCl3 and CHBr3 in the low-level calibration verification standard. These criteria are rarely exceeded, and the most common reason for unacceptable values is operator error (for example, incorrect labeling of vials). If difference values are consistently unacceptable within a run, a new standard curve must be analyzed.
Peak area counts for the five analytes (the four THM species and the surrogate) were tabulated and compared with peak area counts from previous analyses of the same calibration verification standard to monitor the inter-run, long-term performance of the trap. If the peak area for any of the analytes is more than 20 percent different than the peak area of the analyte when the trap was first installed, then the trap has degraded and must be replaced. Since degradation of the trap will affect results for all samples and standards, peak areas, rather than calculated concentrations, are monitored.
Surrogate Standard
The surrogate, CH2ClCHBrCH3, is added to every sample automatically by the Archon auto-sampler to monitor the instrument stability during a run. The measured peak area for the surrogate from each injection of a run is tabulated. The percent RSD (eq. 5) must be less than 2 percent or the instrument is tested to find leaks. If there are no leaks, then matrix effects in individual samples must be considered the cause.
Retention Time and Peak Shape for Analytes
The retention times for the analytes in all standards, samples, and blanks are monitored. The EZChrom software is configured with a retention time window of ± 0.2 minutes. Because the column flow rate is set manually at the start of each run, the retention times for the analytes shift slightly between runs.
The chromatograms are monitored for appearance of additional peaks. THMs are the only halogenated volatile organic compounds (VOCs) produced in large quantities during chlorination of natural DOC. Thus, it is extremely rare that additional peaks that could interfere with the analyte peaks are present in the chromatograms. However, additional peaks may occur in samples that have been contaminated with anthropogenic halogenated VOCs. In this case, samples are analyzed for THM concentrations in addition to THMFP. The
chromatograms for the chlorinated and unchlorinated aliquots are compared with each other and with published chromatograms of halogenated VOCs analyzed under similar conditions to estimate the identities of the unknown peaks.
The shapes of the peaks also are monitored. If the peaks become broader, asymmetric, or acquire tails, then the GC requires maintenance. The most common cause of peak shape problems is obstruction of the ECD make-up gas flow. If maintenance of the ECD detector does not improve the peak shapes, then the GC column may need replacement.
Duplicate Samples
Two full THMFP procedure duplicates are prepared for every 10 samples. The THMFP of the duplicates are compared (eq. 9). The reproducibility of the THMFP procedure duplicates (Ccalc) is reported as the percent difference between the two duplicates and is calculated as follows:
(9)
where
If the difference value is greater than 5 percent, then the accuracy of the dilution procedure is examined.
Instrument Maintenance
Instrument maintenance is performed, as needed, on the Archon autosampler, Tekmar concentrator, and the GC. The syringe barrel and plunger that draws up the sample from the vial must be cleaned or replaced approximately every 6 months, depending on the sample matrix and sample load. Otherwise, the Archon has been very reliable and needs minimal care. The sparge tube on the Tekmar concentrator is changed more frequently, approximately every 2 months. The trap is replaced approximately yearly, depending on how much the instrument has been used. The GC column lasts several years providing that column flow is maintained continuously. The ECD is baked out whenever column flow is interrupted or when the ECD baseline is greater than 150 Hz.
CA and CB are the concentrations in the two duplicates.
Ccalc
CA CB–
CA CB+( ) 2⁄-------------------------------- 100×=
20 Method of Analysis—Determination of Trihalomethane Formation Potential, Method Validation, and Quality-Control Practices
Summary
This report provides a description of the analytical method and quality-control practices for the determination of trihalomethane formation potential (THMFP) used by the U.S. Geological Survey California District, Sacramento Laboratory. The THMFP of the dissolved organic carbon (DOC) in a water sample is measured by dosing filtered water samples with chlorine (Cl2) from sodium hypochlorite (NaOCl) under specified conditions of pH, temperature, incubation time, and darkness, and then analyzing the resulting trihalomethanes (THM) by purge and trap/gas chromatography (GC). The appropriate dose of Cl2 is calculated from the DOC and ammonia-nitrogen (NH3-N) concentrations in the sample and is sufficient to leave a residual-free Cl2 concentration at the end of the incubation period of 2 to 4 mg/L. Samples are buffered to pH 8.3 and incubated in the dark at 25ºC for 7 days. At the end of the 7 days, the pH and residual-free Cl2 are measured and the samples are quenched with sodium sulfite solution to neutralize any remaining free Cl2. The THMs are purged from the sample matrix by bubbling nitrogen through an aliquot of the sample. The THMs are collected on an adsorbent trap and then desorbed thermally into the inlet of a GC. The four THM species chloroform (CHCl3), bromodichloromethane (CHCl2Br), dibromochloromethane (CHClBr2), and bromoform (CHBr3) are separated by capillary GC and detected by an electron capture detector.
A number of tests were performed on three different natural water samples to validate the method. The analytical precision is estimated to be 1 percent. The THMFP increases with the ages of the samples; therefore, samples should be analyzed immediately after collection to minimize this effect. The THMFP increased as the residual Cl2 concentration increased over the range of concentrations tested. It is unfortunate that all of the THMFP analyses methods specify residual-free Cl2 concentrations of <5mg/L because that is the range where the THMFP is strongly dependant on residual-Cl2 concentration (USEPA 510.1, 0.5 to 1.5 mg/L; Standard method, 3 to 5 mg/L; this method, 2 to 4 mg/L). Samples with DOC concentrations greater than 3 mg/L must be diluted to keep the concentrations of the resulting THM species within the range of the standard curves. However, THMFP decreased with the DOC concentration in samples that were diluted at the time of dosing. THM concentrations also decreased when sample vials were opened to make dilutions after quenching. THMFP increased with the concentration of Br- in the sample and the proportions of the four THM species changed systematically.
Quality-control practices are used to assure that a high level of precision and accuracy of the THMFP analyses is
maintained. Quality-control practices include regular analysis of calibration verification standards, duplicate samples and analysis of a surrogate compound, and two types of blanks. Stringent criteria for acceptable results for the quality-control samples and for instrument calibration curves are maintained. Instrument maintenance and corrective actions are undertaken promptly, as needed.
References Cited
American Public Health Association, American Water Works Association, and Water Pollution Control Federation, 1995, Standard methods for the examination of water and wastewater (19th ed.): Washington, D.C., variously paged.
American Society for Testing and Materials, 1993, Standard practice for using significant digits in test data to determine conformance with specifications, Designation: E29-93a.
Bird, S.M., Fram, M.S., and Crepeau, K.L., 2003, Method of analysis by the U.S. Geological Survey California District Sacramento Laboratory – Determination of dissolved organic carbon in water by high temperature catalytic oxidation, method validations, and quality-control practices: U.S. Geological Survey Open-File Report 03-366, 14 p.
Bove, F., Shim, Y., and Zeitz, P., 2002, Drinking water contaminants and adverse pregnancy outcomes: A review: Environmental Health Perspectives, v. 110, supplement 1, p. 61–74.
California Department of Water Resources, 1994, California Department of Water Resources Bryte Laboratory’s quality assurance and quality control manual: California Department of Water Resources, 63 p.
Chang, E.E., Lin, Y.P., and Chiang, P.C., 2001, Effects of bromine on the formation of THMs and HAAs: Chemosphere, v. 43, p. 1029–1034.
Connor, B.F., Rose, D.L., Noriega, M.C., Murtagh, L.K., and Abney, S.R., 1998, Method of analysis by the U.S. Geological Survey National Water Quality Laboratory—Determination of 86 volatile organic compounds in water by gas chromatography/mass spectrometry, including detections less than reporting limits: U.S. Geological Survey Open-File Report 97-829, 78 p.
Fram, M.S. , Fujii, Roger, Weishaar, J.L., Bergamaschi, B.A., and Aiken, G.R., 1999, How DOC composition may explain the poor correlation between specific trihalomethane formation potential and specific UV absorbance: U.S. Geological Survey Water-Resources Investigations Report 99-4018B, p. 423–430.
Hach, 1997, Hach water analysis handbook (3rd ed.): Loveland, Colo., Hach Co., 1309 p.
References Cited 21
Helsel, D.R., and Hirsch. R.M., 1995, Statistical methods in water resources: Amsterdam, The Netherlands, Elsevier Science Publishers, Studies in Environmental Science Series, v. 49, 529 p., software in pocket (3 ½ in. diskette).
Krasner, S.W., and Sclimenti, M.J., 1994, Characterization of natural organic matter, disinfection by-product analysis, in Natural Organic Matter in Drinking Water: Origin, Characterization, and Removal: Workshop Proceedings, September 19-22, 1993: [Denver, Colo.], American Water Works Association Research Foundation, p. 9.
Morris, J.C., 1978, The chemistry of aqueous chlorine in relation to water chlorination, Water Chlorination Environmental Impact and Health Effects, v. 1, Jolley, R.L. ed.: Ann Arbor, Michigan, Ann Arbor Science Publishers Inc., p. 21–33.
Oliver, B.G., and Thurman, E.M., 1983, Influence of aquatic humic substance properties on trihalomethane potential, chap. 16 in R.L. Holley, W.A., Brungs, J.A. Cotrubo, R.B. Cumming, J.S. Mattice, and V.A. Jacobs (eds.), Water Chlorination—Environmental Impact and Health Effects: Ann Arbor, Mich., Ann Arbor Science Publisher, v. 4, book 1, p. 231–241.
Radtke, D.B., Horowitz, A.J., Sandstrom, M.W., 2002, Procedures for processing samples for carbon analysis, Provisional section 5.2.2.C in Wilde, F.D., Radtke, W.B., Gibs, J., Iwatsubo, R.T., Processing of water samples: U.S. Geological Survey Techniques of Water-Resources Investigations, book 9, chap. A5.
Reckhow, D.A., Singer, P.C., Malcolm, R.L., 1990, Chlorination of humic materials – Byproduct formation and chemical interpretations: Environmental Science and Technology, v.24, p. 1655-1664.
Summers, R.S., Hooper, S.M., Shukairy, H.M., Solarik, G., and Owen, D., 1996, Assessing DBP yield: uniform formation conditions: Journal of the American Water Resources Association, v. 88, no. 6, and p. 80–93.
Symons, J.M., Krasner, S.W., Simms, L.A., and Sclimenti, M., 1993, Measurement of THM and precursor concentrations revisited: The effect of bromine ion: Journal of the American Water Works Association, v. 85, no. 1, p. 51–62.
U.S. Environmental Protection Agency, 1983, Method 510.1: The determination of the maximum total trihalomethane formation potential, in Methods for Chemical Analysis of Water and Wastes: Office of Research and Development, National Exposure Research Laboratory, EPA/600/4-79-020, variously paged.
U.S. Environmental Protection Agency, 1995, Method 502.2: Volatile organic compounds in water by purge and trap capillary column gas chromatography with photo ionization and electrolytic conductivity detectors in series, in Methods for the Determination of Organic Compounds in Drinking Water: Supplement III: Office of Research and Development, National Exposure Research Laboratory, EPA/600/R-95/131, variously paged.
U.S. Environmental Protection Agency, 1998, Environmental Protection Agency: 40 CFR parts 9, 141, and 142: National Primary Drinking Water Regulations: Disinfectants and disinfection byproducts, final rule: Federal Register, v. 63, no. 241, p. 69390–69476.
Waller, K., Swan, S.H., DeLorenze, G., and Hopkins, B., 1998, Trihalomethanes in drinking water and spontaneous abortion: Epidemiology, v. 9 no. 2, p. 134–140.

22 Method of Analysis—Determination of Trihalomethane Formation Potential, Method Validation, and Quality-Control Practices

Manuscript approved for publication, January 12, 2004Prepared by the Communications Group, U.S. Geological Survey,
California District, Sacramento, CaliforniaUSGS Publishing staff
Dale A. Cox Carol Sanchez Miguel Roque Debra Grillo
For more information concerning the research in this report, contact the California District, U.S. Geological Survey, 6000 J Street, Placer Hall Sacramento, California 95819 http://ca.water.usgs.gov