Method for evaluating the wettability of polyethylene...
34
Method for evaluating the wettability of polyethylene against different surfaces at processing temperatures by MINYI PAN Diploma work No. 30/2010 at Department of Materials and Manufacturing Technology CHALMERS UNIVERSITY OF TECHNOLOGY Gothenburg, Sweden Diploma work in the Master program Advanced Engineering Materials Performed at: Chalmers University of Technology Department of Materials and Manufacturing Technology SE-412 96 Gothenburg, Sweden Supervisor: Henrik Persson Department of Materials and Manufacturing Technology Chalmers University of Technology SE-412 96 Gothenburg, Sweden Examiner: Mikael Rigdahl Department of Materials and Manufacturing Technology Chalmers University of Technology SE-412 96 Gothenburg, Sweden
Transcript of Method for evaluating the wettability of polyethylene...
Method for evaluating the wettability of
polyethylene against different surfaces at
processing temperatures
by
MINYI PAN
Diploma work No. 30/2010 at Department of Materials and Manufacturing Technology
CHALMERS UNIVERSITY OF TECHNOLOGY Gothenburg, Sweden
Diploma work in the Master program Advanced Engineering Materials Performed at: Chalmers University of Technology Department of Materials and Manufacturing Technology SE-412 96 Gothenburg, Sweden Supervisor: Henrik Persson Department of Materials and Manufacturing Technology Chalmers University of Technology SE-412 96 Gothenburg, Sweden Examiner: Mikael Rigdahl Department of Materials and Manufacturing Technology
Chalmers University of Technology SE-412 96 Gothenburg, Sweden
Method for evaluating the wettability of polyethylene against different surfaces at processing temperatures Minyi Pan © Minyi Pan, 2010. Diploma work no 30/2010 Department of Materials and Manufacturing Technology Chalmers University of Technology SE-412 96 Gothenburg Sweden Telephone + 46 (0)31-772 1000
Chalmers Reproservice Gothenburg, Sweden 2010

Acknowledgement
I would like to give my gratitude to Prof. Mikael Rigdahl as well as my supervisor Dr. Henrik Persson who gave me this opportunity to do this project and gave me a lot of suggestions and help. Henrik Persson especially provided me a lot of idea on the experimental part and Mikael Rigdahl gave me great help on the theory part. I would also like to thank Kenth Johansson and Marie Ernstsson at Institute for Surface Chemistry, Sweden; Thorbjörn Andersson and Francesco Pisciotti at Tetra Pak Packaging Solution AB, Sweden; Auli Nummila-Pakarinen at Borealis Polymers OY, Finland; Tobias Söderholm at Korsnås AB, Sweden. They had regular telephone meeting with us where we had discussion and generated new ideas, as well as provided us with the important raw materials. Many thanks also due to my classmates and colleagues at the Department of Materials and Manufacture, Chalmers University of Technology, who gave me great support and help.
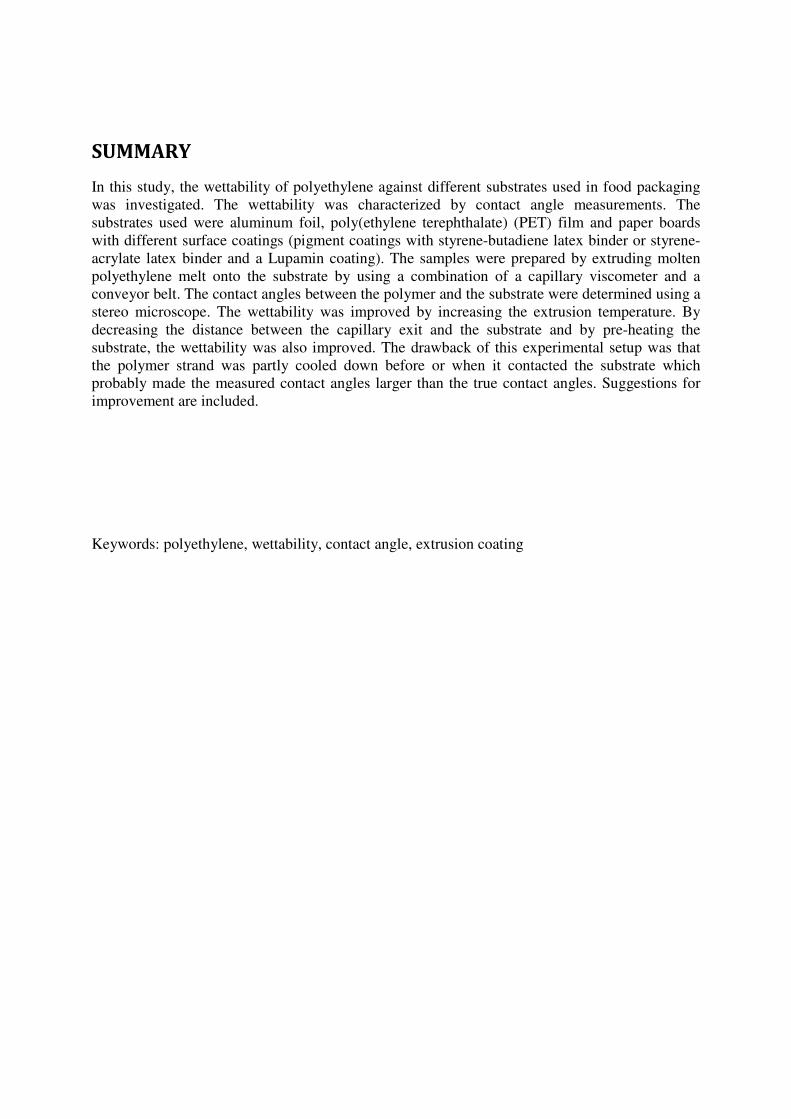
SUMMARY
In this study, the wettability of polyethylene against different substrates used in food packaging was investigated. The wettability was characterized by contact angle measurements. The substrates used were aluminum foil, poly(ethylene terephthalate) (PET) film and paper boards with different surface coatings (pigment coatings with styrene-butadiene latex binder or styrene-acrylate latex binder and a Lupamin coating). The samples were prepared by extruding molten polyethylene melt onto the substrate by using a combination of a capillary viscometer and a conveyor belt. The contact angles between the polymer and the substrate were determined using a stereo microscope. The wettability was improved by increasing the extrusion temperature. By decreasing the distance between the capillary exit and the substrate and by pre-heating the substrate, the wettability was also improved. The drawback of this experimental setup was that the polymer strand was partly cooled down before or when it contacted the substrate which probably made the measured contact angles larger than the true contact angles. Suggestions for improvement are included. Keywords: polyethylene, wettability, contact angle, extrusion coating
Table of Contents 1. Introduction ............................................................................................................................... 1
1.1 Extrusion coating ................................................................................................................ 1
1.2 Materials used for extrusion coating .................................................................................. 2
1.3 Contact angle and surface energy ....................................................................................... 3
1.3.1 Definition ................................................................................................................ 3
1.3.2 Contact angle measurements ................................................................................... 4
2. Methodology ............................................................................................................................. 6
2.1 Experimental setup ............................................................................................................. 6
2.2 Contact angle measurements .............................................................................................. 8
2.3 Viscosity measurements ..................................................................................................... 9
2.4 Determination of the surface energy from contact angles ................................................ 10
3. Experimental part .................................................................................................................... 11
3.1 Polymers ........................................................................................................................... 11
3.2 Substrates ......................................................................................................................... 11
3.3 Extrusion temperatures ..................................................................................................... 12
3.4 Distance between die orifice and substrates ..................................................................... 12
3.5 Substrate temperatures ..................................................................................................... 12
4. Results ..................................................................................................................................... 13
4.1 Al and PET ....................................................................................................................... 13
4.2 Air gap distance and pre-heating the Al substrate ............................................................ 13
4.3 Paper substrates ................................................................................................................ 15
4.4 Second angle .................................................................................................................... 16
4.5 Viscosity measurements ................................................................................................... 17
4.6 Contact angles with HDPE ............................................................................................... 18
4.7 The relationship between the contact angle and the surface energy ................................ 18
4.8 The temperature distribution during the cooling .............................................................. 20
5. Conclusions ............................................................................................................................. 22
6. References ............................................................................................................................... 23
7. Appendix ................................................................................................................................. 24
1
1. Introduction In the food packaging industry several different materials are used. One large category consists of laminates between polymer and paper or board. When manufacturing these laminates, one common technique is to extrusion-coat polyolefins onto the substrates (paper or board). For securing good mechanical properties of the laminate, the adhesion between polymer and paper or board is of high importance. The adhesion is related to a number of different factors such as wetting, chemical bonding as well as mechanical interlocking. In this work, especially the wetting of the polymer melt against the substrate materials was studied
1.1 Extrusion coating
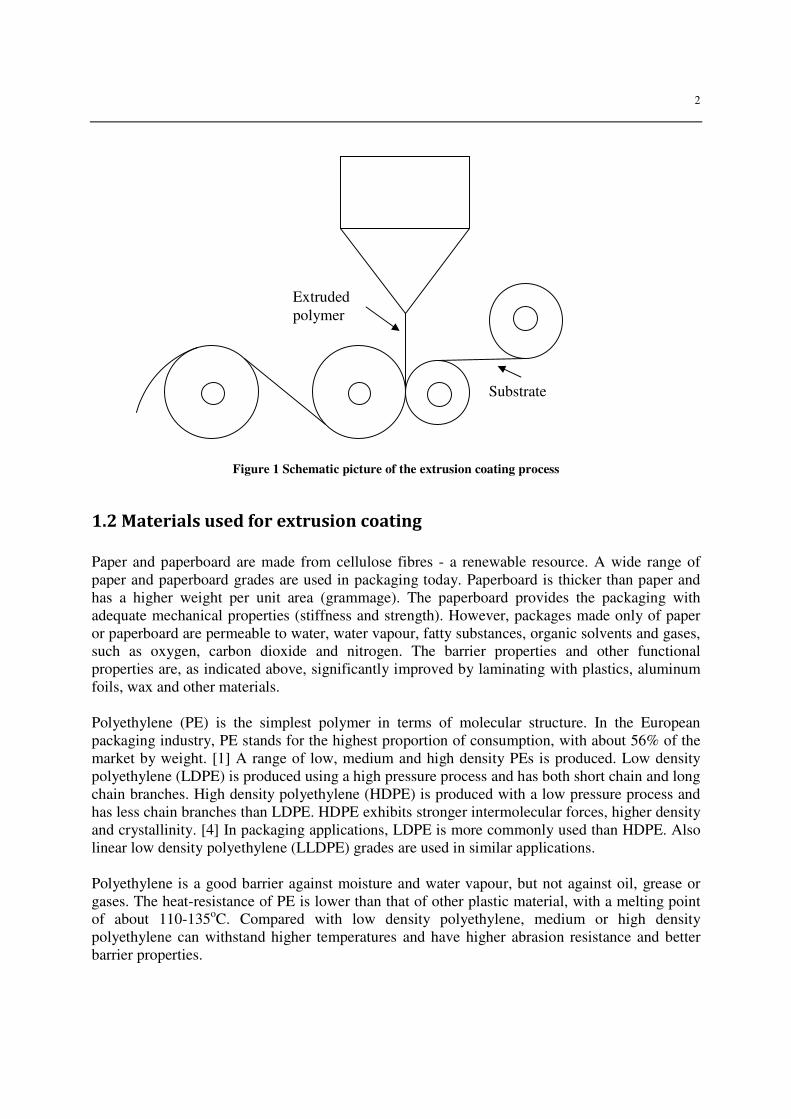
Extrusion coating is widely used in packaging industry. It involves extruding molten polymer, notably polyethylene, onto a substrate material like paperboard, aluminum foil or plastic film. The polymer is extruded from a slot die at temperatures up to more than 300 oC onto a moving substrate (Figure 1) which is then passed though a system of pressure rolls and cooling rolls. [1] The latter cools the polymer to the solid state. The high temperatures oxidize the polyethylene surface which improves the wetting. Studies employing electron spectroscopy for chemical analysis (ESCA) have shown that hydroxyl, carbonyl, carboxyl and amide groups are introduced in the polyethylene surface. [2] In the paper industry, extrusion coating is used in order to improve a number of important properties of the paper/board including humidity and grease barrier properties, surface gloss, light and heat resistance. The extruded hot polymer is also be used as a bonding medium to a second layer of material. [3]
2
Figure 1 Schematic picture of the extrusion coating process
1.2 Materials used for extrusion coating
Paper and paperboard are made from cellulose fibres - a renewable resource. A wide range of paper and paperboard grades are used in packaging today. Paperboard is thicker than paper and has a higher weight per unit area (grammage). The paperboard provides the packaging with adequate mechanical properties (stiffness and strength). However, packages made only of paper or paperboard are permeable to water, water vapour, fatty substances, organic solvents and gases, such as oxygen, carbon dioxide and nitrogen. The barrier properties and other functional properties are, as indicated above, significantly improved by laminating with plastics, aluminum foils, wax and other materials. Polyethylene (PE) is the simplest polymer in terms of molecular structure. In the European packaging industry, PE stands for the highest proportion of consumption, with about 56% of the market by weight. [1] A range of low, medium and high density PEs is produced. Low density polyethylene (LDPE) is produced using a high pressure process and has both short chain and long chain branches. High density polyethylene (HDPE) is produced with a low pressure process and has less chain branches than LDPE. HDPE exhibits stronger intermolecular forces, higher density and crystallinity. [4] In packaging applications, LDPE is more commonly used than HDPE. Also linear low density polyethylene (LLDPE) grades are used in similar applications. Polyethylene is a good barrier against moisture and water vapour, but not against oil, grease or gases. The heat-resistance of PE is lower than that of other plastic material, with a melting point of about 110-135oC. Compared with low density polyethylene, medium or high density polyethylene can withstand higher temperatures and have higher abrasion resistance and better barrier properties.
Extruded polymer
Substrate
3
Among other polymers used for laminating with paper or board, polypropylene (PP) is used for moisture and fat resistance. It can withstand temperatures up to 140°C and is used for packing foods to be reheated in ovens up to this temperature. [1] Poly(ethylene terephthalate) (PET) is also used for moisture and fat resistance. It can withstand temperatures up to 200°C and is dually ovenable (microwave and conventional ovens). Aluminum foil is used as a moisture, flavour, oxygen and UV-light barrier. Aluminum foil laminates with paperboard are also used for food which will be cooked or reheated in microwave or convection ovens. Aluminum foil is sometimes used for providing a decorative metallic finish to, for example, chocolate packaging for confectionery.
1.3 Contact angle and surface energy
1.3.1 Definition
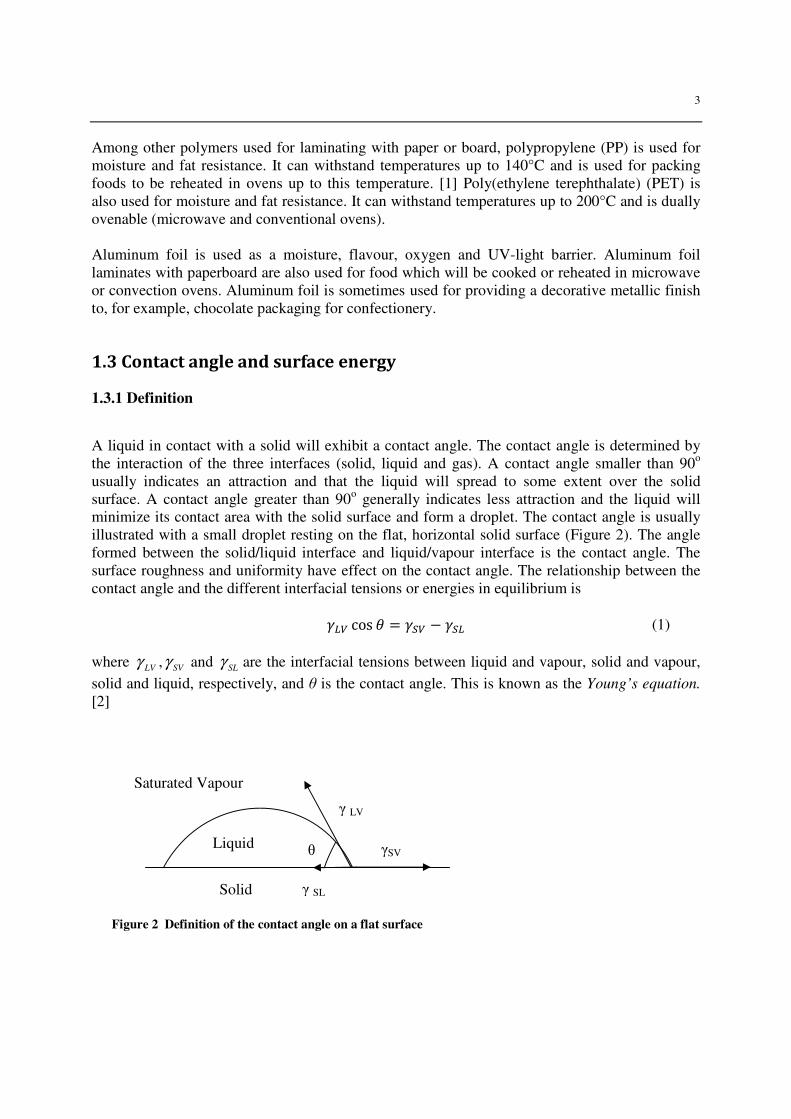
A liquid in contact with a solid will exhibit a contact angle. The contact angle is determined by the interaction of the three interfaces (solid, liquid and gas). A contact angle smaller than 90o usually indicates an attraction and that the liquid will spread to some extent over the solid surface. A contact angle greater than 90o generally indicates less attraction and the liquid will minimize its contact area with the solid surface and form a droplet. The contact angle is usually illustrated with a small droplet resting on the flat, horizontal solid surface (Figure 2). The angle formed between the solid/liquid interface and liquid/vapour interface is the contact angle. The surface roughness and uniformity have effect on the contact angle. The relationship between the contact angle and the different interfacial tensions or energies in equilibrium is
��� cos � � �� �� where SVLV γγ , and SLγ are the interfacial tensions between liquid and vapour, solid and vapour,
solid and liquid, respectively, and θ is the contact angle. This is known as the Young’s equation.
[2]
Liquid
Solid
Saturated Vapour
γ LV
γSV
γ SL
θ
Figure 2 Definition of the contact angle on a flat surface
(1)
4
The surface energy quantifies the disruption of intermolecular bonds that occurs when a surface is formed. There are various intermolecular forces including dispersion forces (non-polar), dipole (dipole-dipole) forces, induction (dipole-induced-dipole) forces and hydrogen bonds. Dispersion forces contribute to the dispersion part of surface energy. Dipole forces, induction forces and hydrogen bonds, all those three forces contribute to the polar part of surface energy. Schematically, the total surface energy ( ) can be written as the sum of a dispersive component ( ) and a polar component ), i.e,
Polyethylene is normally considered to be essentially non-polar. However, a high temperature processing oxidizes the material and introduces polar group like hydroxyl, carbonyl, carboxyl and amide groups. Thus, due to the high temperatures used in extrusion coating, the PE-surface can become polar to some extent. This is considered to improve the wetting of the molten polymer against the paper surface which has a polar character. 1.3.2 Contact angle measurements
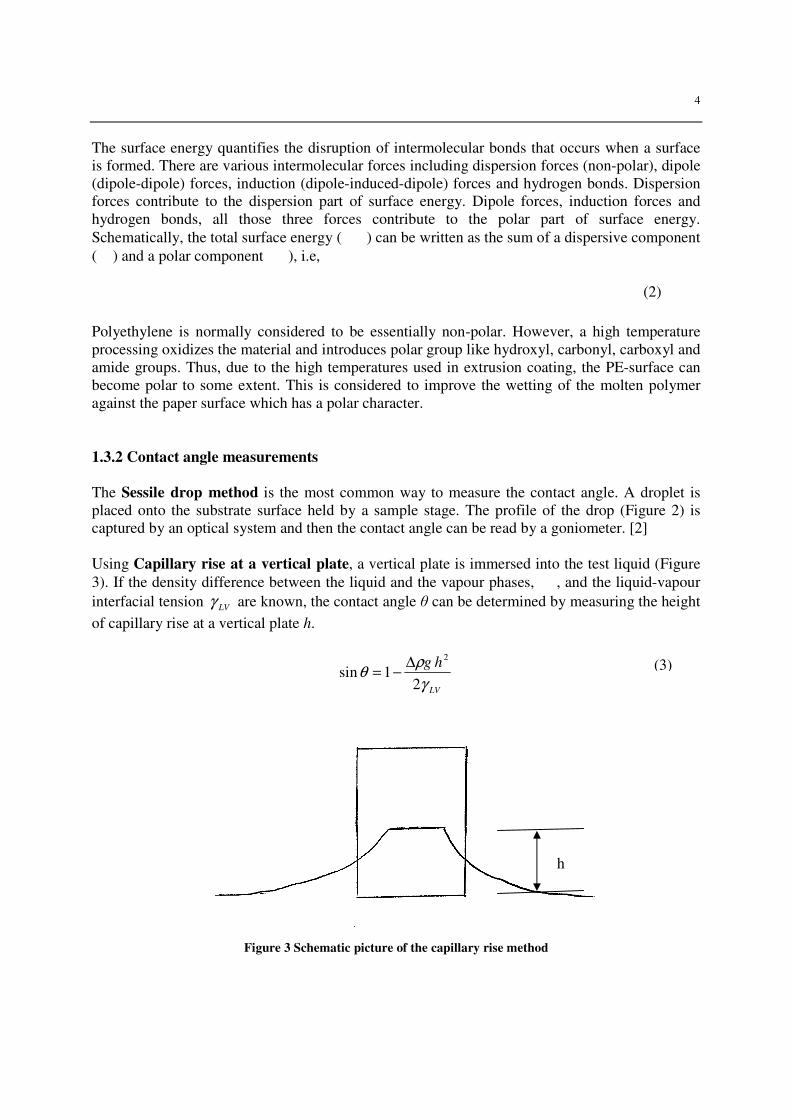
The Sessile drop method is the most common way to measure the contact angle. A droplet is placed onto the substrate surface held by a sample stage. The profile of the drop (Figure 2) is captured by an optical system and then the contact angle can be read by a goniometer. [2] Using Capillary rise at a vertical plate, a vertical plate is immersed into the test liquid (Figure 3). If the density difference between the liquid and the vapour phases, , and the liquid-vapour interfacial tension LVγ are known, the contact angle θ can be determined by measuring the height
of capillary rise at a vertical plate h.
LV
hg
γ
ρθ
21sin
2∆−=
Figure 3 Schematic picture of the capillary rise method
(3)
(2)
h
5
With the Wilhelmy plate method, the substrate is immersed vertically into a test liquid and the corresponding required force exerted on the substrate is measured by a force transducer. The contact angle is related to the force and the surface energy of liquid-vapour interface as:
θγ cosLVpf =
where p is the perimeter of the Wilhelmy plate and f the exerted force. The advantage of the Wilhelmy method is that the exerted force on the substrate is measured instead of the contact angles directly. These force measurement could be carried more accurately. [5] In the present study, a contact angle measurement which is similar to sessile drop method was adopted. The principle of this measurement is thus based on the profile of the drop. In the literature, these are few data on the contact angle and the surface energy reported for polymer melts at higher temperatures. All the methods developed for low viscosity fluids are in principal applicable to polymer melts. However, the equilibrium rate is a limiting factor since polymer melts are usually of high viscosity. Moreover, polymers tend to oxidize or degrade at high temperatures, and this should be avoided. Therefore, only a few experimental methods could be used. [2] Some results are however reported, cf [2]. Indirect methods can be used for determining the surface energy of polymer melts, among them are the Harmonic-Mean Methods and the Geometric-Mean Methods. These methods require contact angle data and contact materials with known surface energies. [2] This will be discussed in more detail later in this report.
(4)
6
2. Methodology
2.1 Experimental setup
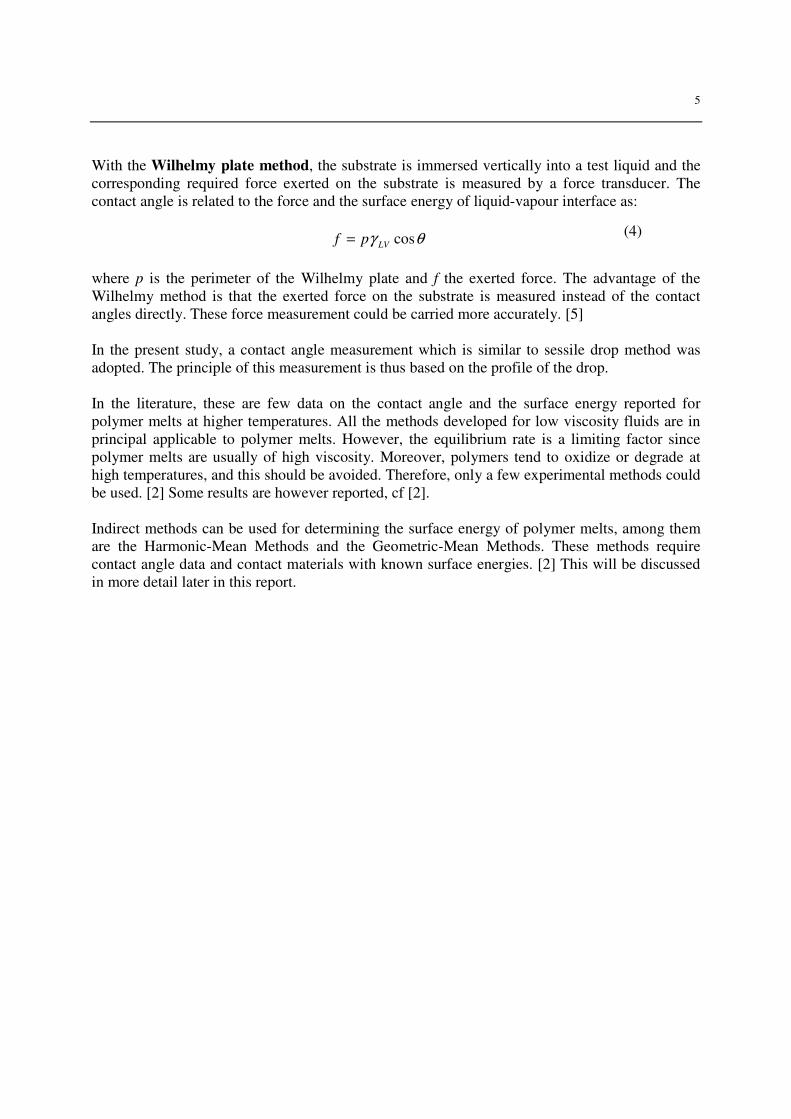
A combination of a capillary viscometer (GÖTTFERT RHEOGRAPH 2002) and a conveyor belt (HITACHI SJ200 Series Inverter) was used to simulate the extrusion coating process of polyethylene (Figure 4 and Figure 5). The capillary viscometer was used to extrude polymer melt and the die diameter chosen was in most cases 0.5 mm. The conveyor belt was used to move the substrate materials. The sample format was an A4 size substrate coated by a very thin strand of polymer. The polymer pellets were melted in the barrel of capillary viscometer and then extruded onto the moving substrate which had the same speed as the extrudate. The die diameter of capillary viscometer should be small enough in order for the influence of gravity on the tests to be neglected. Die diameters of 0.5mm and 1mm were used for a pre-test, where low density polyethylene (LDPE) was extruded on aluminum substrate at an extrusion temperature of 325°C. Contact angle measurements showed that both dies worked well with no significant difference in contact angle (average value and standard deviation; see Chapter 2.2 for contact angle measurements). The 0.5 mm diameter die was chosen since lower amounts of polymer were used and the thinner polymer strand was easier to cut.
Capillary rheometer
Polymer strand
Moving belt
Substrate
Figure 4 Illustration of experimental setup
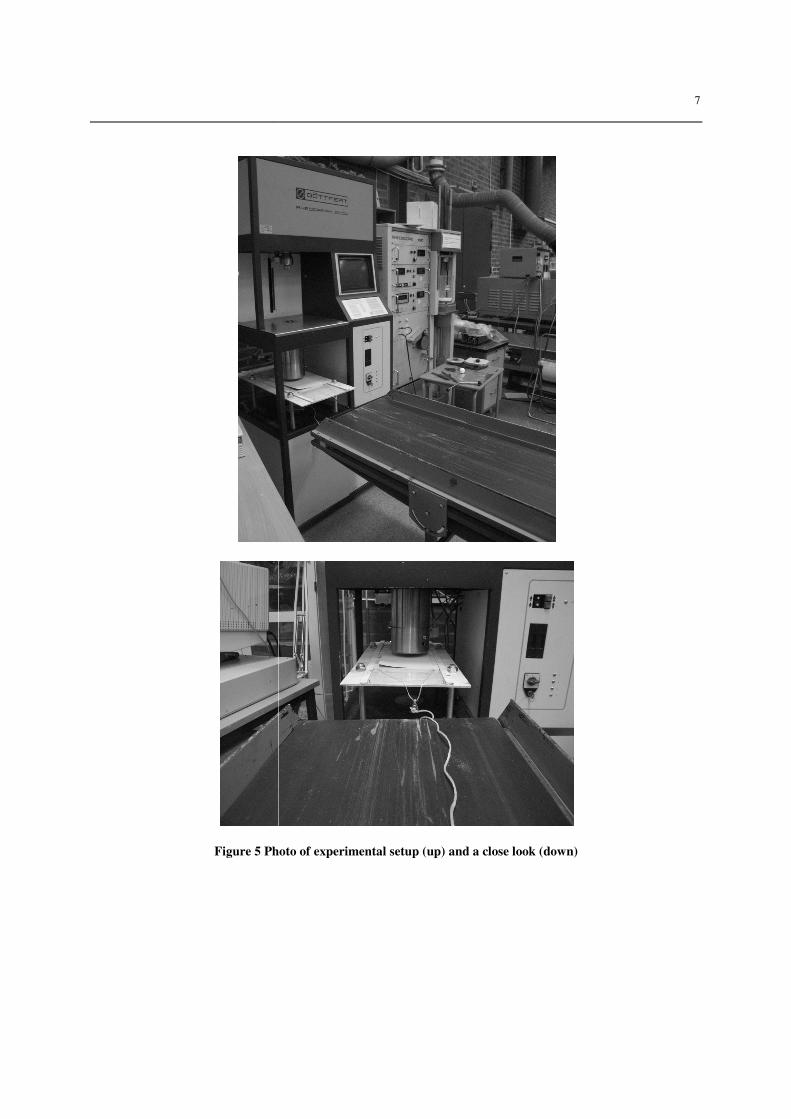
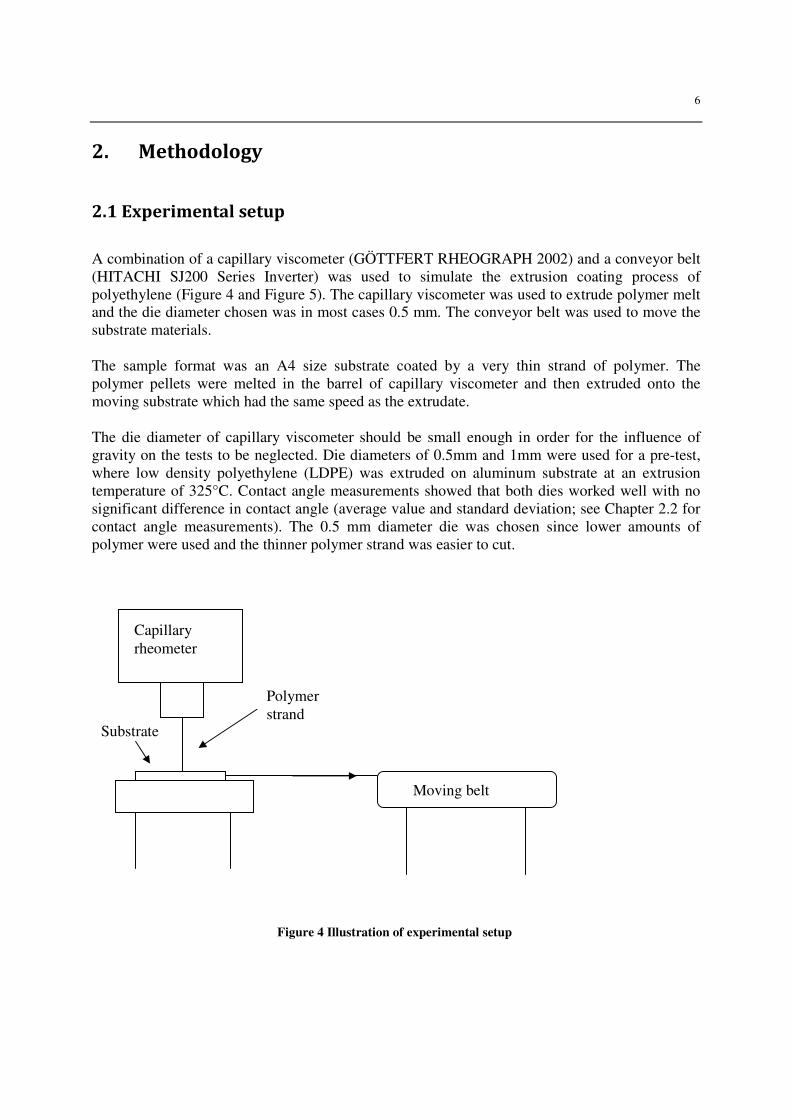
Figure 5 Photo of experimental setup (up) and a close look (down)
Photo of experimental setup (up) and a close look (down)
7
Photo of experimental setup (up) and a close look (down)
8
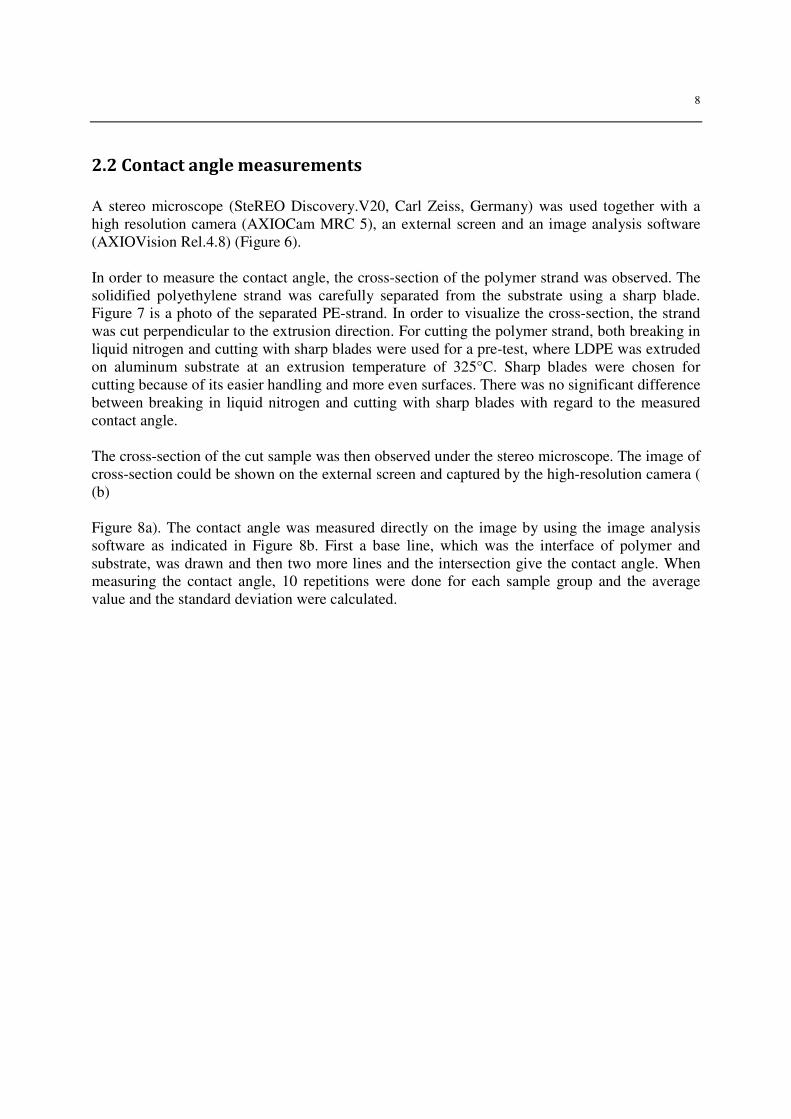
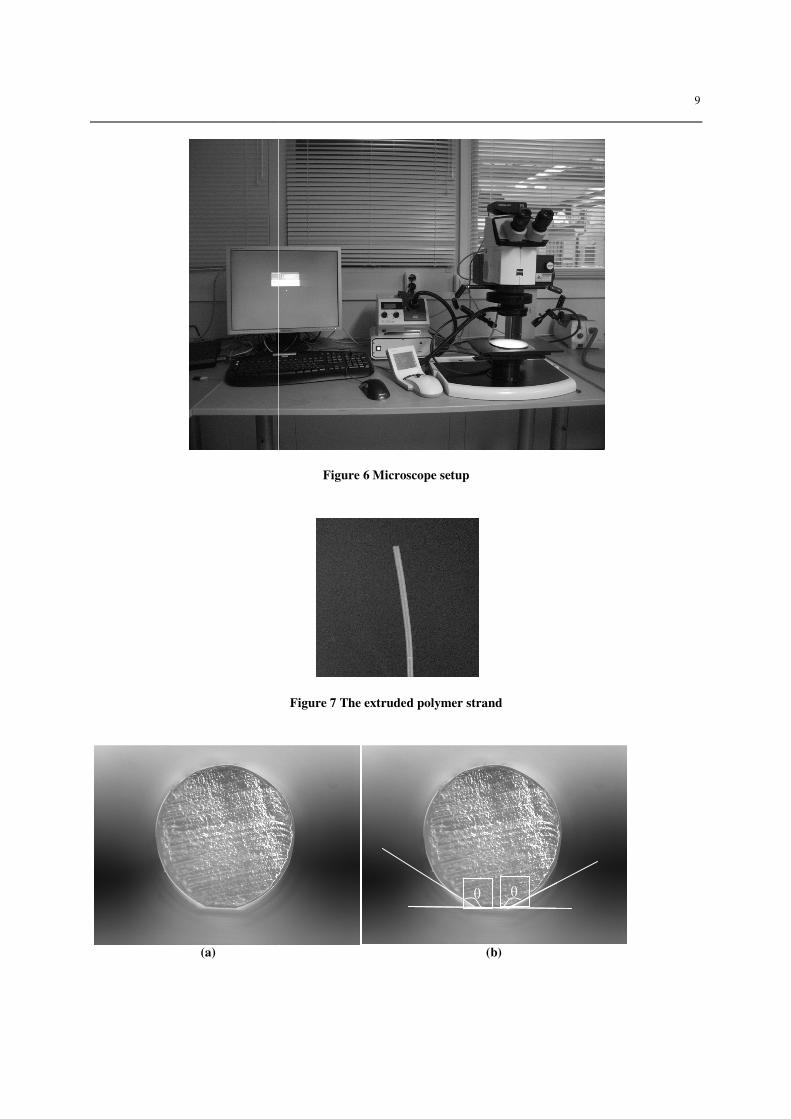
2.2 Contact angle measurements
A stereo microscope (SteREO Discovery.V20, Carl Zeiss, Germany) was used together with a high resolution camera (AXIOCam MRC 5), an external screen and an image analysis software (AXIOVision Rel.4.8) (Figure 6). In order to measure the contact angle, the cross-section of the polymer strand was observed. The solidified polyethylene strand was carefully separated from the substrate using a sharp blade. Figure 7 is a photo of the separated PE-strand. In order to visualize the cross-section, the strand was cut perpendicular to the extrusion direction. For cutting the polymer strand, both breaking in liquid nitrogen and cutting with sharp blades were used for a pre-test, where LDPE was extruded on aluminum substrate at an extrusion temperature of 325°C. Sharp blades were chosen for cutting because of its easier handling and more even surfaces. There was no significant difference between breaking in liquid nitrogen and cutting with sharp blades with regard to the measured contact angle. The cross-section of the cut sample was then observed under the stereo microscope. The image of cross-section could be shown on the external screen and captured by the high-resolution camera ( (b) Figure 8a). The contact angle was measured directly on the image by using the image analysis software as indicated in Figure 8b. First a base line, which was the interface of polymer and substrate, was drawn and then two more lines and the intersection give the contact angle. When measuring the contact angle, 10 repetitions were done for each sample group and the average value and the standard deviation were calculated.
(a)
Figure 6 Microscope setup
Figure 7 The extruded polymer strand
(b)
θ θ
9
10
Figure 8 ( a) Illustration of the cross-section of the polymer strand cross section under the microscope (b)
Illustration of a contact angle measurement
2.3 Viscosity measurements
The viscosities of LDPE and HDPE were measured by the capillary viscometer. The capillary viscometer consists of a heated barrel, a piston (connected to a load cell) that can move at different velocities and a capillary at the exit of the barrel. Polyethylene pellets are loaded in the barrel and compacted during melting to a homogenous melt. During the measurement, the piston is pushing the melt through the capillary at a number of different velocities corresponding to different shear rates. The load that corresponds to the pressure loss over the capillary is recorded for the different velocities. For each velocity it is important to reach steady state before recording the load, at lower velocities this can take longer time than at higher velocities. From the piston velocities (corresponding to a volume flow rate Q) and given the geometry of the capillary, the shear rate at the wall of the capillary can be calculated as
3
4
R
Qw
πγ =& (5)
where wγ& is the apparent shear rate at the wall and R the radius of the capillary. From the
recorded pressure loss over the capillary, the shear stress wτ at the wall can be obtained as
L
Rpw
2
∆=τ (6)
where p∆ is the pressure loss over the capillary and L is the length of the capillary. The ratio
between wτ and wγ& then gives the apparent viscosity η as a function of the shear rate. All the
calculations in this study were automatically performed by the computer. The viscosities of both LDPE and HDPE were measured at 250 oC and 325 oC. The capillary diameter chosen was 1 mm.
2.4 Determination of the surface energy from contact angles
After the contact angle data were obtained from the microscope, the surface energy of the polymer melt could be determined using the Harmonic-Mean Method or the Geometric-Mean Method. [2] Harmonic-Mean Method:
�1 cos ������� ���� � 4� ������������� ������
��������
(7)
(8)
11
�1 cos ������� ���� � 4� ������
��� ��� ������
��� ����
where the subscript 1 and 2 refer to the substrates 1 and 2 and the superscripts d and p refer to the dispersive and polar components of surface energy, respectively. If �� �and �� �of the substrates (j=1 and 2) are known, the dispersive and polar components of the polymer melt (��� and ���) could be obtained by solving the two equations (7) and (8) simultaneously. Geometric-Mean Method:
�1 cos ������� ���� � 2 ����������� ���������
��
�1 cos ������� ���� � 2 ���������! ���������
!"
The ��� and ��� could be obtained by solving the two equations (9) and (10) simultaneously.
(9)
(10)
12
3. Experimental part
3.1 Polymers
Low density polyethylene (LDPE) CA 8200, Borealis, 920 kg/cm3, melt flow rate (MFR) 7.5g/10min, ISO 1183 High density polyethylene (HDPE) 9600, Borealis, 960 kg/cm3, MFR 9.0g/10min, ISO 1183 Since the LDPE- and HDPE- grades had different viscosities, they were used to indicate if viscosity had any influence on the wettability. Due to the time limit, HDPE was only used for one test which involved aluminum substrates and an extrusion temperature of 325 oC.
3.2 Substrates
a. Aluminum (Al) foil, AA 1200, thickness 9 µm b. Poly(ethylene terephthalate) film (PET), biaxially oriented c. Paperboard coated with pigments and SA- or SB- latex. The paperboards were pigment-coated in two layers using a blend of calcium carbonate and clay as pigments. This kind of coating is made in order to improve the optical and the printing properties of the board. The precoat had a coat weight of approximately 13 g/m2 and was based on mainly CaCO3 with some addition of clay. The binders used were styrene-butadiene (SB) or styrene-acrylate (SA) based latices. The choice of binder was expected to affect the surface energy of the coating. A synthetic thickening agent was also added to the precoat formulation. The topcoat, with a coat weight of 10 g/m2, was based on a blend of CaCO3 and clay. As for the precoat, the binder system contained the SB- or SA-latices together with the synthetic thickener. The coatings were applied on paper substrates using jet/blade coating. The coated materials were dried using infrared heaters and air-drying hoods. The above description is based on information provided by Ytkemiska Institutet (Institute for Surface Chemistry, YKI) in Stockholm, Sweden. d. Lupamin-coated paperboard Pigment-coated paperboard was coated by Lupamin 9095, manufactured by BASF AG, a copolymer of vinyl formamide/vinylamine of high-molar mass and considered a strong base. A 20-22 weight-% solution of Lupamin in water was applied on the pigment-coated paperboard in YKI’s bench coater, resulting in a wet film of thickness of 12 µm. The coating was allowed to dry at 95°C for 1 min before use. The surface energies including the dispersive and the polar component of all the five substrates are listed in Table 1. These data were supplied by YKI.
13
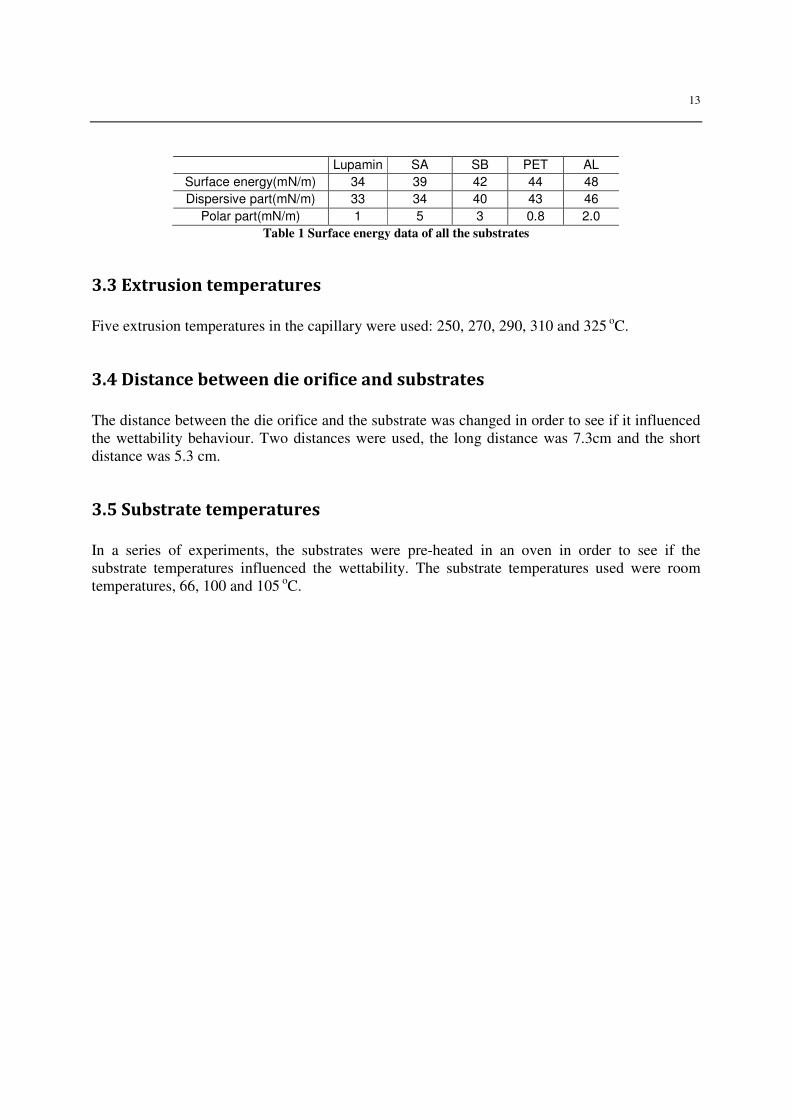
Lupamin SA SB PET AL
Surface energy(mN/m) 34 39 42 44 48
Dispersive part(mN/m) 33 34 40 43 46
Polar part(mN/m) 1 5 3 0.8 2.0
Table 1 Surface energy data of all the substrates
3.3 Extrusion temperatures
Five extrusion temperatures in the capillary were used: 250, 270, 290, 310 and 325 oC.
3.4 Distance between die orifice and substrates
The distance between the die orifice and the substrate was changed in order to see if it influenced the wettability behaviour. Two distances were used, the long distance was 7.3cm and the short distance was 5.3 cm.
3.5 Substrate temperatures
In a series of experiments, the substrates were pre-heated in an oven in order to see if the substrate temperatures influenced the wettability. The substrate temperatures used were room temperatures, 66, 100 and 105 oC.
14
4. Results All the average values of the contact angles and the corresponding standard deviation are listed in the appendix.
4.1 Al and PET
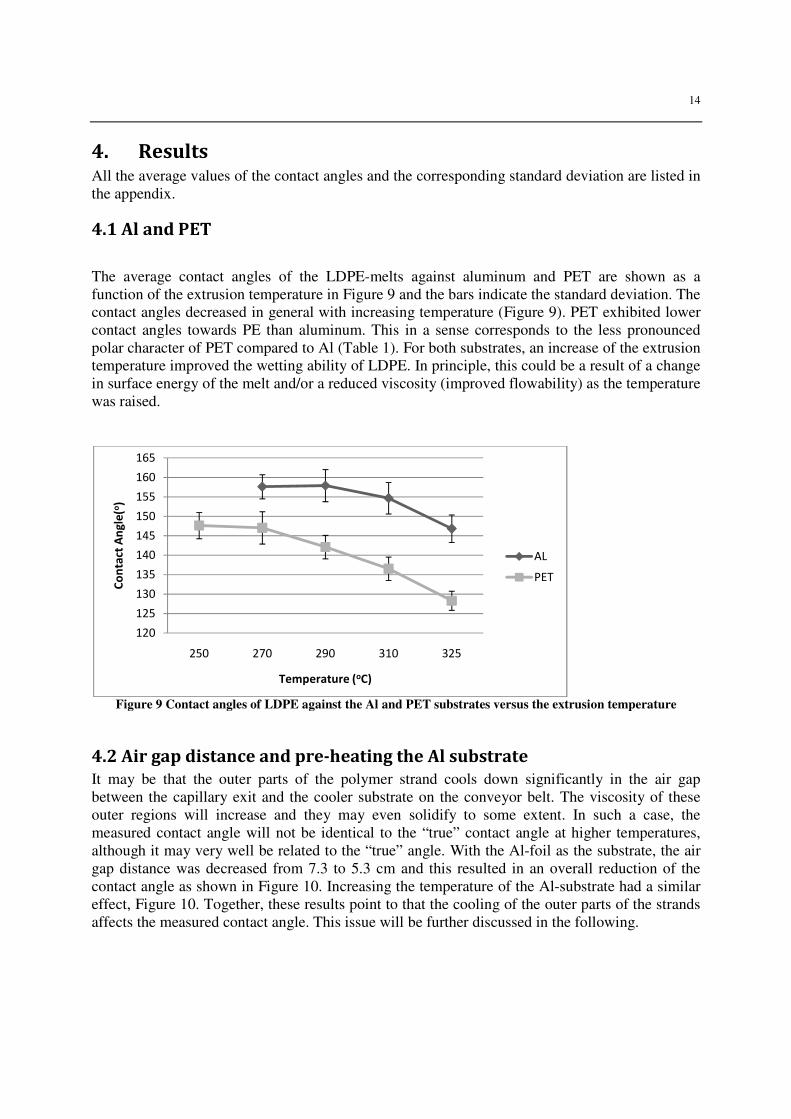
The average contact angles of the LDPE-melts against aluminum and PET are shown as a function of the extrusion temperature in Figure 9 and the bars indicate the standard deviation. The contact angles decreased in general with increasing temperature (Figure 9). PET exhibited lower contact angles towards PE than aluminum. This in a sense corresponds to the less pronounced polar character of PET compared to Al (Table 1). For both substrates, an increase of the extrusion temperature improved the wetting ability of LDPE. In principle, this could be a result of a change in surface energy of the melt and/or a reduced viscosity (improved flowability) as the temperature was raised.
Figure 9 Contact angles of LDPE against the Al and PET substrates versus the extrusion temperature
4.2 Air gap distance and pre-heating the Al substrate
It may be that the outer parts of the polymer strand cools down significantly in the air gap between the capillary exit and the cooler substrate on the conveyor belt. The viscosity of these outer regions will increase and they may even solidify to some extent. In such a case, the measured contact angle will not be identical to the “true” contact angle at higher temperatures, although it may very well be related to the “true” angle. With the Al-foil as the substrate, the air gap distance was decreased from 7.3 to 5.3 cm and this resulted in an overall reduction of the contact angle as shown in Figure 10. Increasing the temperature of the Al-substrate had a similar effect, Figure 10. Together, these results point to that the cooling of the outer parts of the strands affects the measured contact angle. This issue will be further discussed in the following.
120
125
130
135
140
145
150
155
160
165
250 270 290 310 325
Co
nta
ct A
ng
le(o
)
Temperature (oC)
AL
PET
15
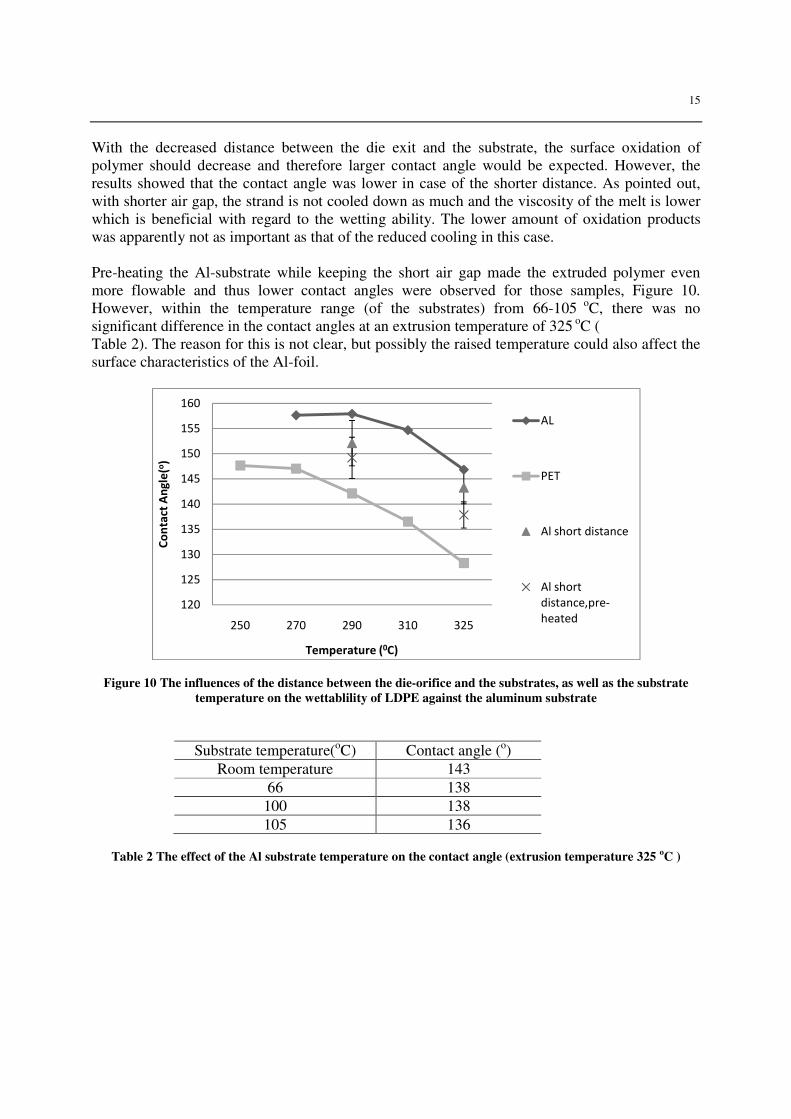
With the decreased distance between the die exit and the substrate, the surface oxidation of polymer should decrease and therefore larger contact angle would be expected. However, the results showed that the contact angle was lower in case of the shorter distance. As pointed out, with shorter air gap, the strand is not cooled down as much and the viscosity of the melt is lower which is beneficial with regard to the wetting ability. The lower amount of oxidation products was apparently not as important as that of the reduced cooling in this case. Pre-heating the Al-substrate while keeping the short air gap made the extruded polymer even more flowable and thus lower contact angles were observed for those samples, Figure 10. However, within the temperature range (of the substrates) from 66-105 oC, there was no significant difference in the contact angles at an extrusion temperature of 325 oC ( Table 2). The reason for this is not clear, but possibly the raised temperature could also affect the surface characteristics of the Al-foil.
Figure 10 The influences of the distance between the die-orifice and the substrates, as well as the substrate
temperature on the wettablility of LDPE against the aluminum substrate
Substrate temperature(oC) Contact angle (o) Room temperature 143
66 138 100 138 105 136
Table 2 The effect of the Al substrate temperature on the contact angle (extrusion temperature 325 oC )
120
125
130
135
140
145
150
155
160
250 270 290 310 325
Co
nta
ct A
ng
le(o
)
Temperature (0C)
AL
PET
Al short distance
Al short
distance,pre-
heated
16
4.3 Paper substrates
(a)
(b)
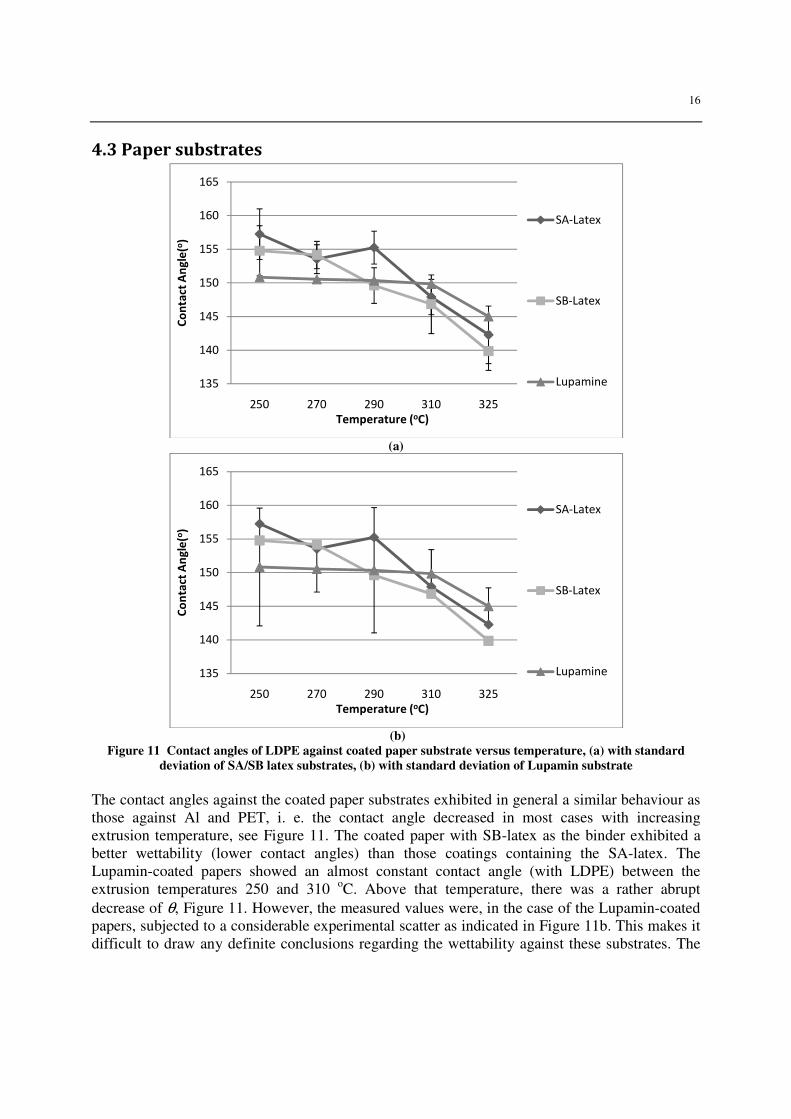
Figure 11 Contact angles of LDPE against coated paper substrate versus temperature, (a) with standard
deviation of SA/SB latex substrates, (b) with standard deviation of Lupamin substrate
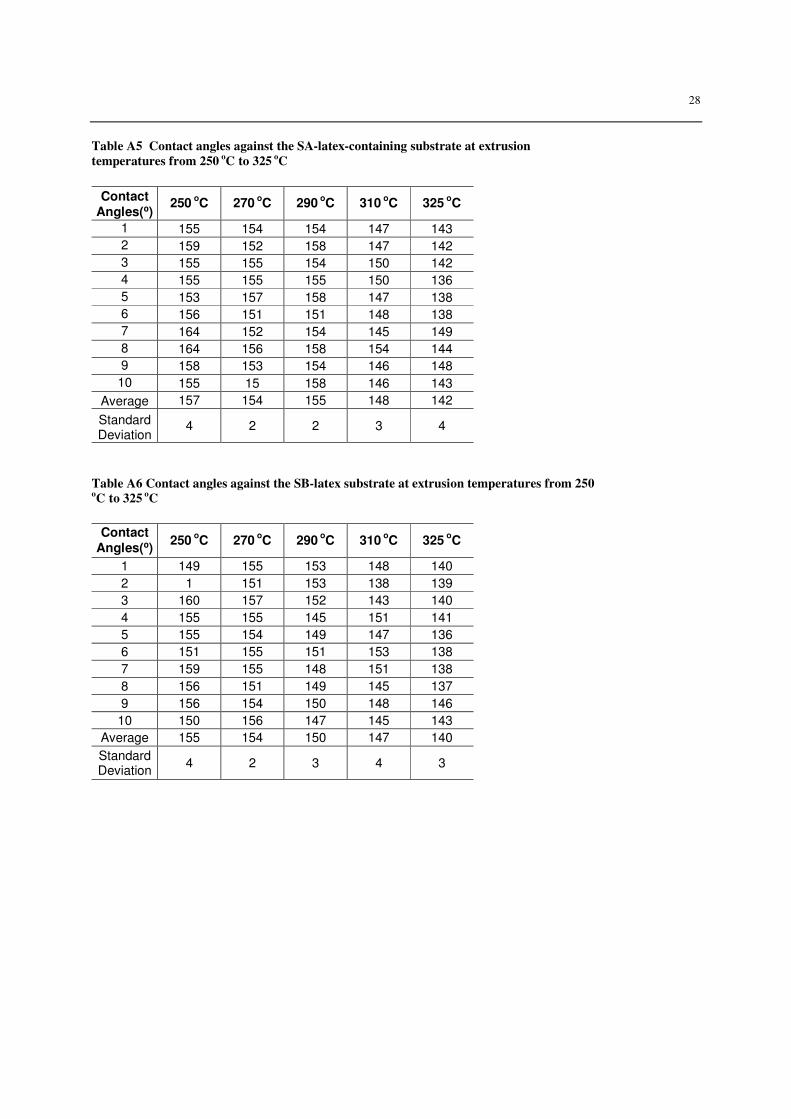
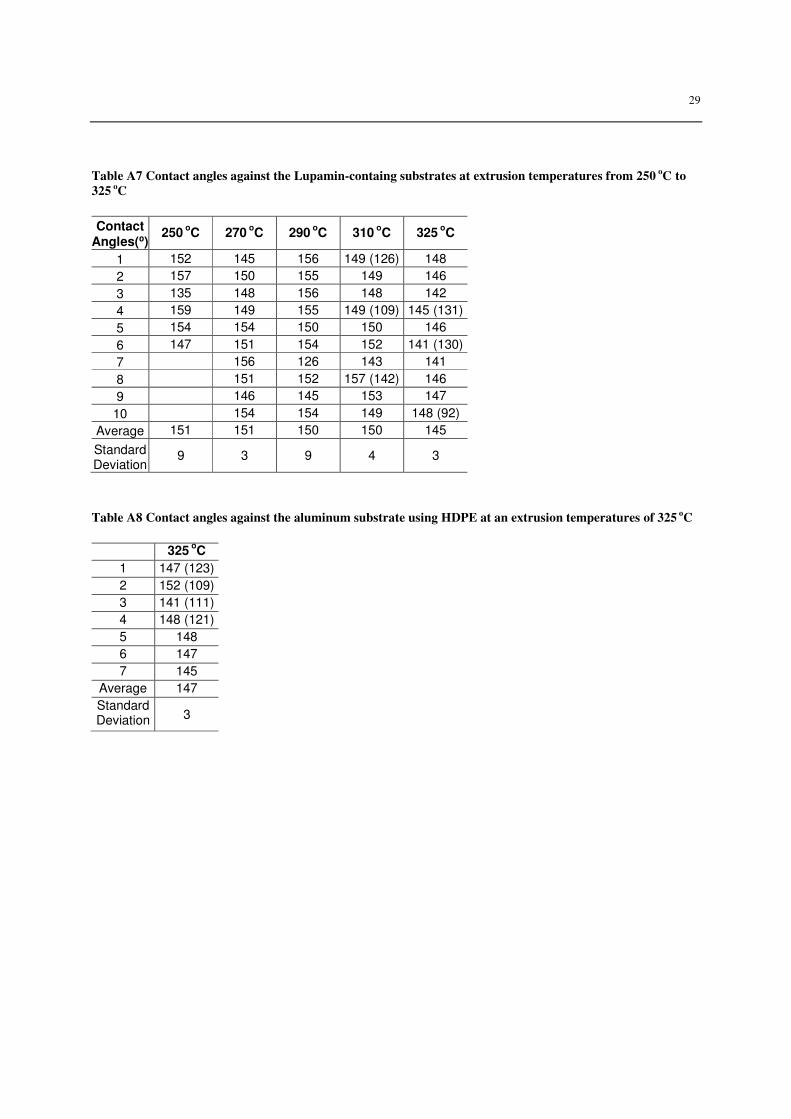
The contact angles against the coated paper substrates exhibited in general a similar behaviour as those against Al and PET, i. e. the contact angle decreased in most cases with increasing extrusion temperature, see Figure 11. The coated paper with SB-latex as the binder exhibited a better wettability (lower contact angles) than those coatings containing the SA-latex. The Lupamin-coated papers showed an almost constant contact angle (with LDPE) between the extrusion temperatures 250 and 310 oC. Above that temperature, there was a rather abrupt decrease of θ, Figure 11. However, the measured values were, in the case of the Lupamin-coated papers, subjected to a considerable experimental scatter as indicated in Figure 11b. This makes it difficult to draw any definite conclusions regarding the wettability against these substrates. The
135
140
145
150
155
160
165
250 270 290 310 325
Co
nta
ct A
ng
le(o
)
Temperature (oC)
SA-Latex
SB-Latex
Lupamine
135
140
145
150
155
160
165
250 270 290 310 325
Co
nta
ct A
ng
le(o
)
Temperature (oC)
SA-Latex
SB-Latex
Lupamine
17
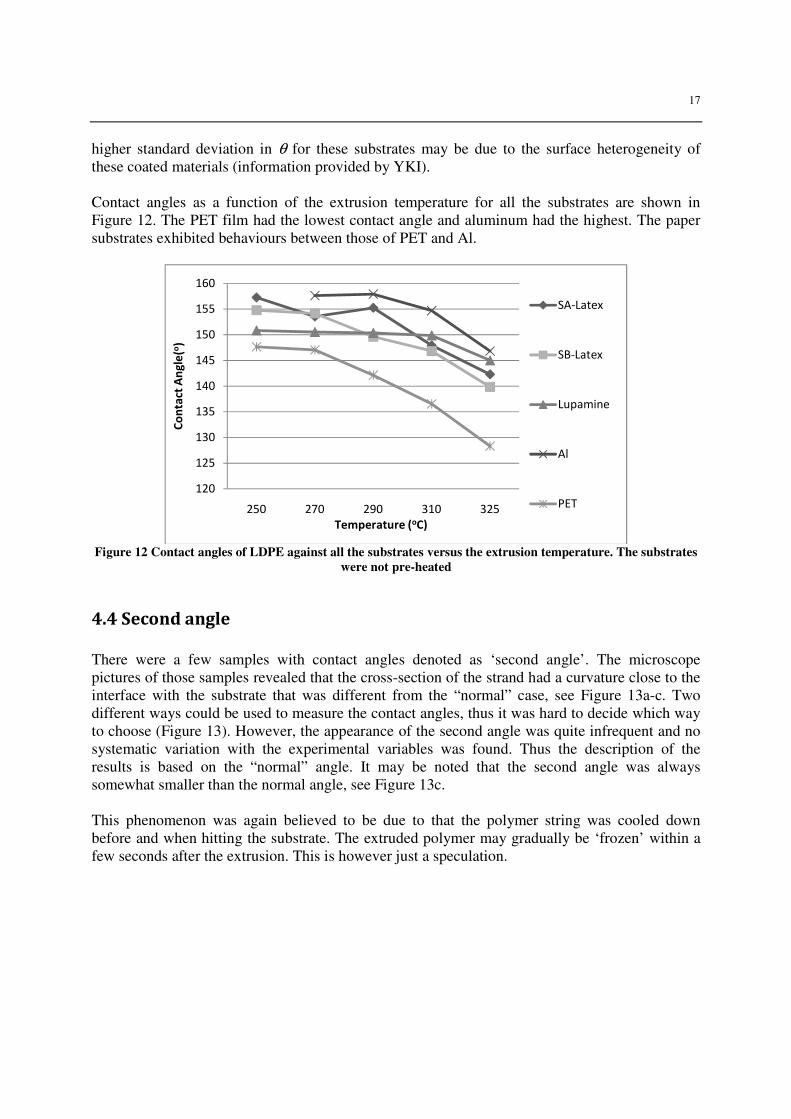
higher standard deviation in θ for these substrates may be due to the surface heterogeneity of these coated materials (information provided by YKI). Contact angles as a function of the extrusion temperature for all the substrates are shown in Figure 12. The PET film had the lowest contact angle and aluminum had the highest. The paper substrates exhibited behaviours between those of PET and Al.
Figure 12 Contact angles of LDPE against all the substrates versus the extrusion temperature. The substrates
were not pre-heated
4.4 Second angle
There were a few samples with contact angles denoted as ‘second angle’. The microscope pictures of those samples revealed that the cross-section of the strand had a curvature close to the interface with the substrate that was different from the “normal” case, see Figure 13a-c. Two different ways could be used to measure the contact angles, thus it was hard to decide which way to choose (Figure 13). However, the appearance of the second angle was quite infrequent and no systematic variation with the experimental variables was found. Thus the description of the results is based on the “normal” angle. It may be noted that the second angle was always somewhat smaller than the normal angle, see Figure 13c. This phenomenon was again believed to be due to that the polymer string was cooled down before and when hitting the substrate. The extruded polymer may gradually be ‘frozen’ within a few seconds after the extrusion. This is however just a speculation.
120
125
130
135
140
145
150
155
160
250 270 290 310 325
Co
nta
ct A
ng
le(o
)
Temperature (oC)
SA-Latex
SB-Latex
Lupamine
Al
PET
Figure 13 (a) Microscope picture of a sample (
contact angle, (b) A close look of the
ways
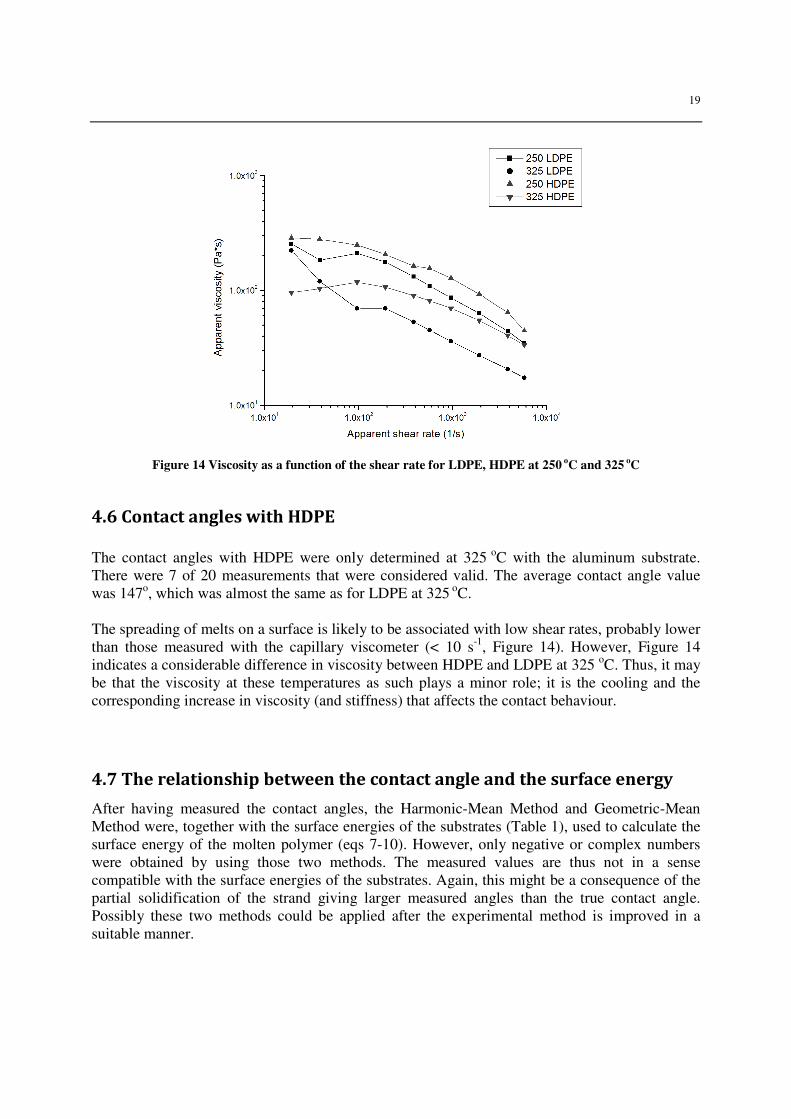
4.5 Viscosity measurements
As shown in Figure 14, for both the LDPE and the HDPEshear rate. An increase in temperature had, as expected, apronounced flow which in this case could promote a lower contact angle.
(a)
(b)
Microscope picture of a sample (extruded at 310 oC, Lupamin substrate
of the interesting part , (c) Contact angle values measured
measurements
, for both the LDPE and the HDPE, the viscosity decreased with increasing shear rate. An increase in temperature had, as expected, a similar effect indicating a more pronounced flow which in this case could promote a lower contact angle.
18
(c)
, Lupamin substrate) exhibiting a second
ontact angle values measured in two different
the viscosity decreased with increasing similar effect indicating a more
19
Figure 14 Viscosity as a function of the shear rate for LDPE, HDPE at 250
oC and 325
oC
4.6 Contact angles with HDPE
The contact angles with HDPE were only determined at 325 oC with the aluminum substrate. There were 7 of 20 measurements that were considered valid. The average contact angle value was 147o, which was almost the same as for LDPE at 325 oC. The spreading of melts on a surface is likely to be associated with low shear rates, probably lower than those measured with the capillary viscometer (< 10 s-1, Figure 14). However, Figure 14 indicates a considerable difference in viscosity between HDPE and LDPE at 325 oC. Thus, it may be that the viscosity at these temperatures as such plays a minor role; it is the cooling and the corresponding increase in viscosity (and stiffness) that affects the contact behaviour.
4.7 The relationship between the contact angle and the surface energy
After having measured the contact angles, the Harmonic-Mean Method and Geometric-Mean Method were, together with the surface energies of the substrates (Table 1), used to calculate the surface energy of the molten polymer (eqs 7-10). However, only negative or complex numbers were obtained by using those two methods. The measured values are thus not in a sense compatible with the surface energies of the substrates. Again, this might be a consequence of the partial solidification of the strand giving larger measured angles than the true contact angle. Possibly these two methods could be applied after the experimental method is improved in a suitable manner.
20
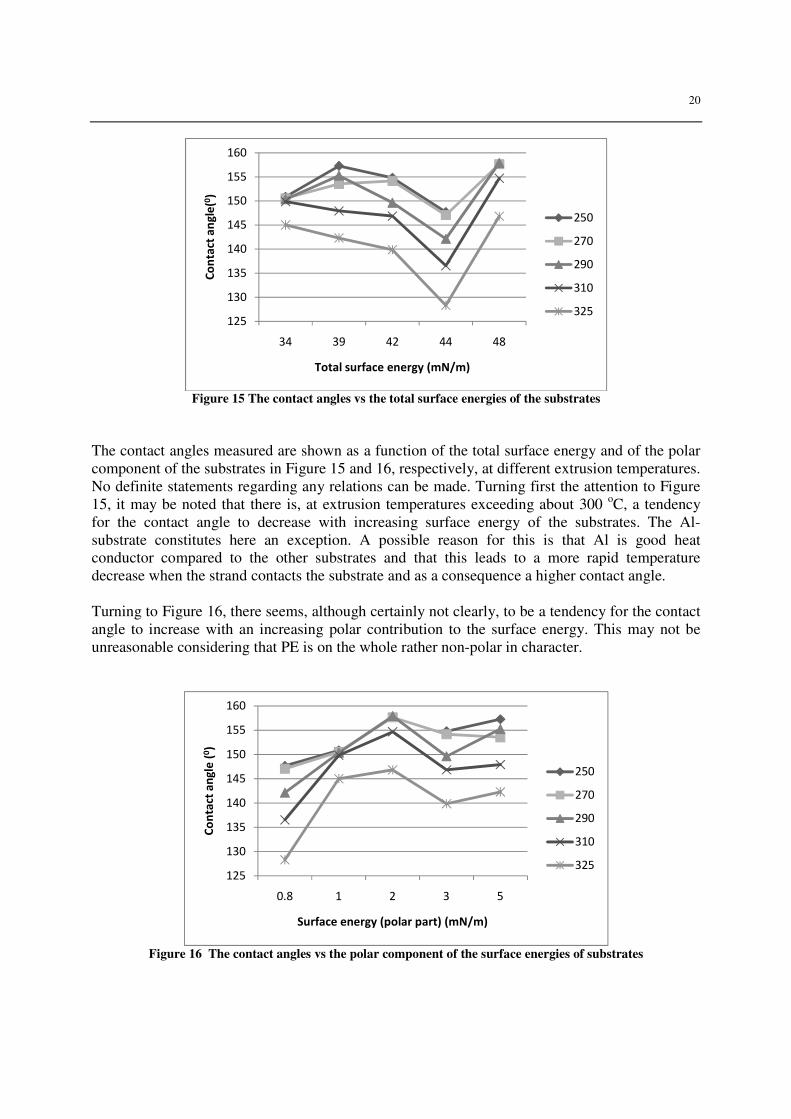
Figure 15 The contact angles vs the total surface energies of the substrates
The contact angles measured are shown as a function of the total surface energy and of the polar component of the substrates in Figure 15 and 16, respectively, at different extrusion temperatures. No definite statements regarding any relations can be made. Turning first the attention to Figure 15, it may be noted that there is, at extrusion temperatures exceeding about 300 oC, a tendency for the contact angle to decrease with increasing surface energy of the substrates. The Al-substrate constitutes here an exception. A possible reason for this is that Al is good heat conductor compared to the other substrates and that this leads to a more rapid temperature decrease when the strand contacts the substrate and as a consequence a higher contact angle. Turning to Figure 16, there seems, although certainly not clearly, to be a tendency for the contact angle to increase with an increasing polar contribution to the surface energy. This may not be unreasonable considering that PE is on the whole rather non-polar in character.
Figure 16 The contact angles vs the polar component of the surface energies of substrates
125
130
135
140
145
150
155
160
34 39 42 44 48
Co
nta
ct a
ng
le(0
)
Total surface energy (mN/m)
250
270
290
310
325
125
130
135
140
145
150
155
160
0.8 1 2 3 5
Co
nta
ct a
ng
le (
0)
Surface energy (polar part) (mN/m)
250
270
290
310
325
21
4.8 The temperature distribution during the cooling
It has been pointed out that the polymer strand is cooled down in the air gap between the die exit and the moving substrate and that this can affect the measured contact angles. Below a simplified analysis to quantify the degree of cooling is briefly described.
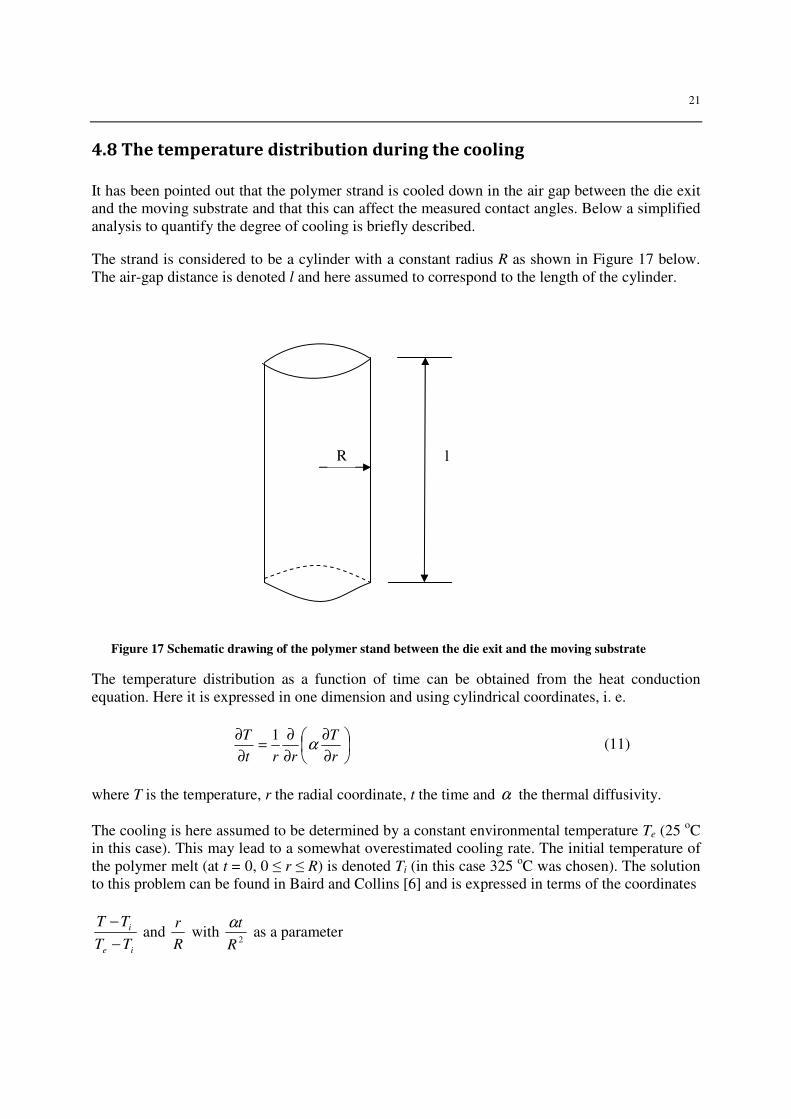
The strand is considered to be a cylinder with a constant radius R as shown in Figure 17 below. The air-gap distance is denoted l and here assumed to correspond to the length of the cylinder.
The temperature distribution as a function of time can be obtained from the heat conduction equation. Here it is expressed in one dimension and using cylindrical coordinates, i. e.
∂
∂
∂
∂=
∂
∂
r
T
rrt
Tα
1 (11)
where T is the temperature, r the radial coordinate, t the time and α the thermal diffusivity. The cooling is here assumed to be determined by a constant environmental temperature Te (25 oC in this case). This may lead to a somewhat overestimated cooling rate. The initial temperature of the polymer melt (at t = 0, 0 ≤ r ≤ R) is denoted Ti (in this case 325 oC was chosen). The solution to this problem can be found in Baird and Collins [6] and is expressed in terms of the coordinates
ie
i
TT
TT
−
− and
R
r with
2R
tα as a parameter
R l
Figure 17 Schematic drawing of the polymer stand between the die exit and the moving substrate
22
If we assume that T = 100 oC, giving (T – Ti)/(Te – Ti) = 0.75, corresponds to a stiffening of the polyethylene sufficient to affect the contact angle, the fraction of stiff skin layer given by
R
r−1
can be calculated from eq. (11). The time t is given by the air gap (5.3 and 7.3 cm) and the velocity of the strand exiting the capillary die (0.16 m/s).The two times give two values of the parameter
13.021 =
R
tα (air gap 5.3 cm) (12)
and
18.022 =
R
tα (air gap 7.3 cm) (13)
where it has been assumed that R = 0.5 mm (accounting for the observed die swell) and α = 10-7 m2/s, which is rather typical for polymers [8]. Using these parameter values, eqs (12) and (13) and the solution given in ref. [7], the solidified fractions are
−
R
r1 at an air gap of 5.3 cm = 0.25 (14)
−
R
r1 at an air gap of 7.3 cm = 0.35 (15)
This simplified analysis indicates that a substantial part of the surface layer of the polymer strand has solidified in the air gap before it contacts the substrates. This is also in agreement with observations made when measuring the contact angle with the adopted technique.
23
5. Conclusions The wettability of low density polyethylene (LDPE) against the used substrates was improved with increasing extrusion temperatures. This could be due to an improved flowability of the melt or introduction of polar groups in the LDPE via oxidation. Among the five substrates used, LDPE exhibited the best wetting on the PET film and worst on aluminum. The wettability of LDPE against the coated paperboard substrates was between that against aluminum and PET. Among the coated paperboard, the coatings containing the SB-binder were better wetted than those with SA-latex, whereas it was hard to quantify the wetting of Lupamin. When the distance between the die exit and the substrate was decreased, the observed contact angles became smaller. By pre-heating the substrates, the contact angles were also smaller. Those two phenomena, together with the ‘second contact angle’ discovered, indicated that the polymer strand was partly solidified before or when it contacted the substrates. Therefore, the contact angle values obtained in this study were probably not the “true” contact angles which the molten polymer would exhibit. The measured values could however be related to the realistic ones. High density polyethylene (HDPE) was only used in one test and the same contact angle was observed as with LDPE tested under identical condition. The surface energies of molten polyethylene could not be calculated from the Geometric-Mean Method or the Harmonic-Mean Method probably because the outer regions of the polymer strand were too stiff when contacting the surface of the substrates giving erroneous values of the contact angle. This is also supported by the simplified analysis of the cooling process performed here. The true contact angles could not be obtained by the experimental setup used in this study since the polymer strand was cooled down too much before resting on the substrate. The experimental setup could possibly be improved by elevating the ambient temperature while extruding in order to avoid the solidification of polymer.
24
6. References (1) Coles, R., McDowell, D. and Kirwan M. J. (2003), Food Packaging Technology, Blackwell
Publishing, Oxford, UK. (2) Wu,S. (1982), Polymer Interfaces and Adhesion, Marcel Dekker, Inc, New York, USA (3) Borealis(2009), Extrusion coating, available 2010-06-01
http://www.borealisgroup.com/industry-solutions/advanced-packaging/flexible-packaging/extrusion-coatings/
(4) Andersson,T. (2004), Oxidative Degradation of Polyethylene-A Cause of Off-flavour, Ph. D. thesis, Lund University of Technology, Lund, Sweden
(5) Holmberg, K. (2001), Handbook of Applied Surface and Colloid Chemistry, Volumes 1-2, Part V, Chapter 14, John Wiley & Sons
(6) Baird, D. G and Collias, D. I. (1998), Polymer Processing, John Willy& Sons Inc.,New York, USA, p. 108-109
(7) McCrum, N. G., Buckley, C. P. and Bucknall, C. B. (1997), Principles of Polymer
Engineering, 2nd ed., Oxford Sci. Publ., Oxford, UK, p. 318
25
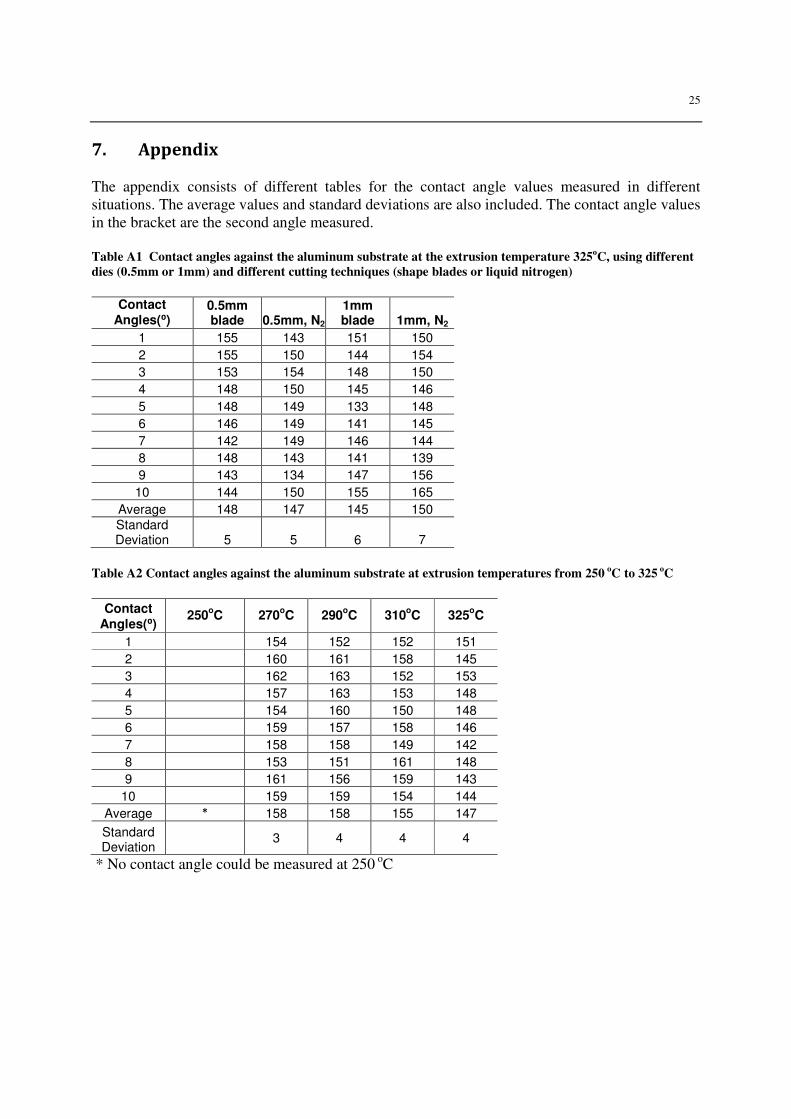
7. Appendix The appendix consists of different tables for the contact angle values measured in different situations. The average values and standard deviations are also included. The contact angle values in the bracket are the second angle measured. Table A1 Contact angles against the aluminum substrate at the extrusion temperature 325
oC, using different
dies (0.5mm or 1mm) and different cutting techniques (shape blades or liquid nitrogen)
Contact
Angles(⁰) 0.5mm blade 0.5mm, N2
1mm blade 1mm, N2
1 155 143 151 150
2 155 150 144 154
3 153 154 148 150
4 148 150 145 146
5 148 149 133 148
6 146 149 141 145
7 142 149 146 144
8 148 143 141 139
9 143 134 147 156
10 144 150 155 165
Average 148 147 145 150
Standard Deviation 5 5 6 7
Table A2 Contact angles against the aluminum substrate at extrusion temperatures from 250
oC to 325
oC
Contact
Angles(⁰) 250
oC 270
oC 290
oC 310
oC 325
oC
1 154 152 152 151
2 160 161 158 145
3 162 163 152 153
4 157 163 153 148
5 154 160 150 148
6 159 157 158 146
7 158 158 149 142
8 153 151 161 148
9 161 156 159 143
10 159 159 154 144
Average * 158 158 155 147
Standard Deviation
3 4 4 4
* No contact angle could be measured at 250 oC
26
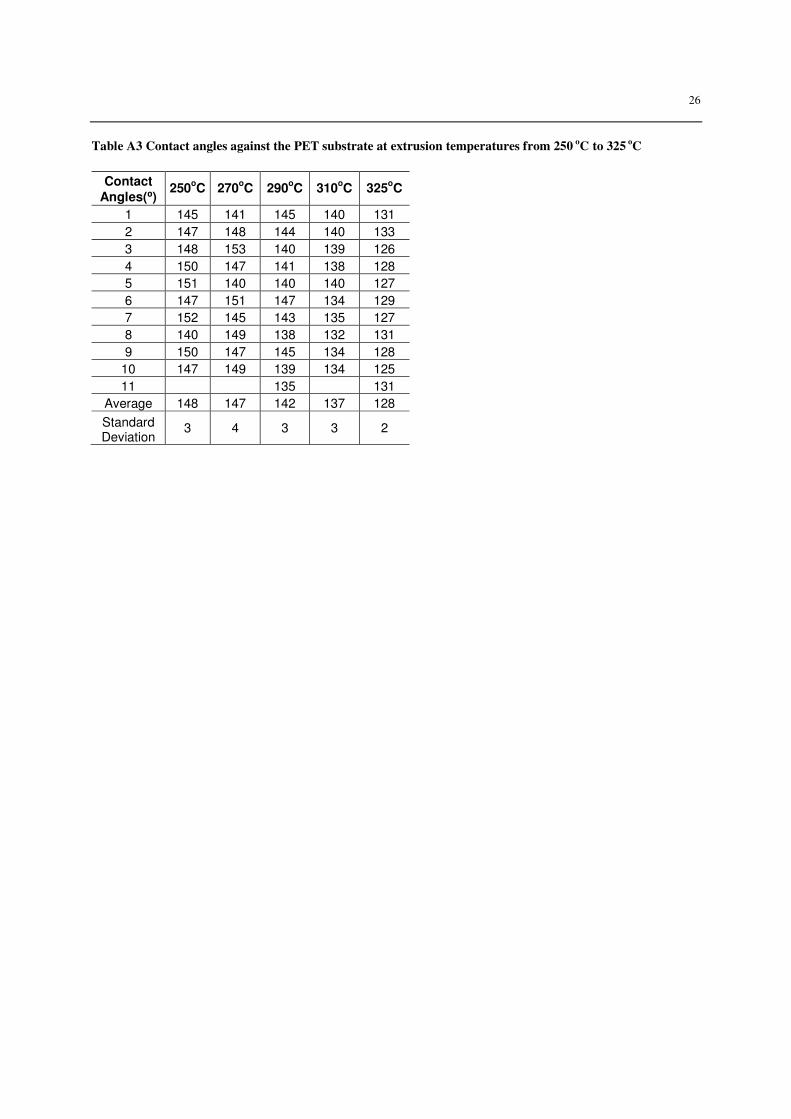
Table A3 Contact angles against the PET substrate at extrusion temperatures from 250 o
C to 325 oC
Contact
Angles(⁰) 250
oC 270
oC 290
oC 310
oC 325
oC
1 145 141 145 140 131
2 147 148 144 140 133
3 148 153 140 139 126
4 150 147 141 138 128
5 151 140 140 140 127
6 147 151 147 134 129
7 152 145 143 135 127
8 140 149 138 132 131
9 150 147 145 134 128
10 147 149 139 134 125
11 135 131
Average 148 147 142 137 128
Standard Deviation
3 4 3 3 2
27
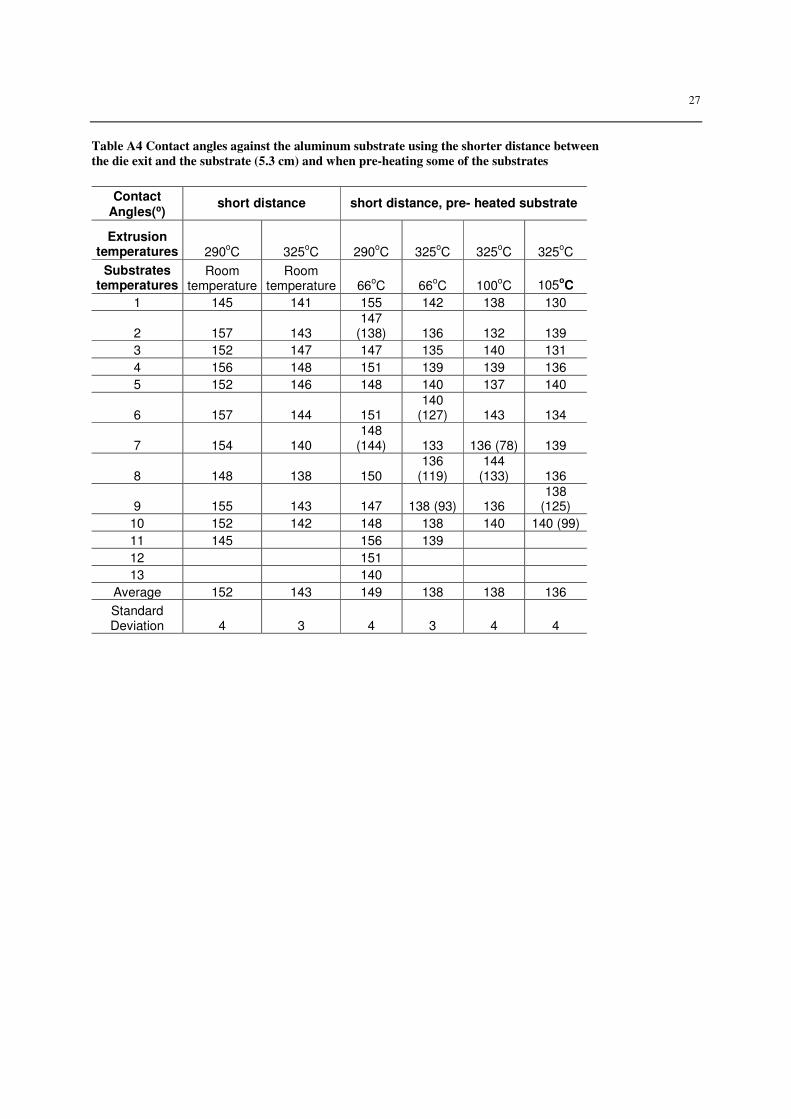
Table A4 Contact angles against the aluminum substrate using the shorter distance between
the die exit and the substrate (5.3 cm) and when pre-heating some of the substrates
Contact
Angles(⁰) short distance short distance, pre- heated substrate
Extrusion temperatures 290
oC 325
oC 290
oC 325
oC 325
oC 325
oC
Substrates temperatures
Room temperature
Room temperature 66
oC 66
oC 100
oC 105
oC
1 145 141 155 142 138 130
2 157 143 147
(138) 136 132 139
3 152 147 147 135 140 131
4 156 148 151 139 139 136
5 152 146 148 140 137 140
6 157 144 151 140
(127) 143 134
7 154 140 148
(144) 133 136 (78) 139
8 148 138 150 136
(119) 144
(133) 136
9 155 143 147 138 (93) 136 138
(125)
10 152 142 148 138 140 140 (99)
11 145 156 139
12 151
13 140
Average 152 143 149 138 138 136
Standard Deviation 4 3 4 3 4 4
28
Table A5 Contact angles against the SA-latex-containing substrate at extrusion
temperatures from 250 o
C to 325 oC
Contact
Angles(⁰) 250
oC 270
oC 290
oC 310
oC 325
oC
1 155 154 154 147 143
2 159 152 158 147 142
3 155 155 154 150 142
4 155 155 155 150 136
5 153 157 158 147 138
6 156 151 151 148 138
7 164 152 154 145 149
8 164 156 158 154 144
9 158 153 154 146 148
10 155 15 158 146 143
Average 157 154 155 148 142
Standard Deviation
4 2 2 3 4
Table A6 Contact angles against the SB-latex substrate at extrusion temperatures from 250
oC to 325
oC
Contact
Angles(⁰) 250
oC 270
oC 290
oC 310
oC 325
oC
1 149 155 153 148 140
2 1 151 153 138 139
3 160 157 152 143 140
4 155 155 145 151 141
5 155 154 149 147 136
6 151 155 151 153 138
7 159 155 148 151 138
8 156 151 149 145 137
9 156 154 150 148 146
10 150 156 147 145 143
Average 155 154 150 147 140
Standard Deviation
4 2 3 4 3
29
Table A7 Contact angles against the Lupamin-containg substrates at extrusion temperatures from 250 o
C to
325 oC
Contact
Angles(⁰)250
oC 270
oC 290
oC 310
oC 325
oC
1 152 145 156 149 (126) 148
2 157 150 155 149 146
3 135 148 156 148 142
4 159 149 155 149 (109) 145 (131)
5 154 154 150 150 146
6 147 151 154 152 141 (130)
7
156 126 143 141
8
151 152 157 (142) 146
9
146 145 153 147
10
154 154 149 148 (92)
Average 151 151 150 150 145
Standard Deviation
9 3 9 4 3
Table A8 Contact angles against the aluminum substrate using HDPE at an extrusion temperatures of 325
oC
325
oC
1 147 (123)
2 152 (109)
3 141 (111)
4 148 (121)
5 148
6 147
7 145
Average 147
Standard Deviation 3