METHOD DVELOPMENT AND VALIDATION FOR THE … · Method development is done for, new drug products...
89
METHOD DVELOPMENT AND VALIDATION FOR THE SIMULTANEOUS ESTIMATION OF ATAZANAVIR SULPHATE AND RITONAVIR IN BULK AND TABLET DOSAGE FORM BY RP-HPLC A Dissertation submitted to THE TAMILNADU Dr. M.G.R. MEDICAL UNIVERSITY Chennai-600032 In partial fulfillment of the requirements for the award of degree of MASTER OF PHARMACY IN PHARMACEUTICAL ANALYSIS Submitted by Register No. 261230553 Under the Guidance of Dr. S. ANANDA THANGADURAI, M.Pharm., Ph.D., DEPARTMENT OF PHARMACEUTICAL ANALYSIS SWAMY VIVEKANANDHA COLLEGE OF PHARMACY ELAYAMPALAYAM, TIRUCHENGODE - 637 205 TAMILNADU, INDIA. APRIL-2014
Transcript of METHOD DVELOPMENT AND VALIDATION FOR THE … · Method development is done for, new drug products...
METHOD DVELOPMENT AND VALIDATION FOR THE
SIMULTANEOUS ESTIMATION OF ATAZANAVIR SULPHATE AND
RITONAVIR IN BULK AND TABLET DOSAGE FORM BY RP-HPLC
A Dissertation submitted to
THE TAMILNADU Dr. M.G.R. MEDICAL UNIVERSITY Chennai-600032
In partial fulfillment of the requirements for the award of degree of
MASTER OF PHARMACY
IN
PHARMACEUTICAL ANALYSIS
Submitted by
Register No. 261230553
Under the Guidance of
Dr. S. ANANDA THANGADURAI, M.Pharm., Ph.D.,
DEPARTMENT OF PHARMACEUTICAL ANALYSIS
SWAMY VIVEKANANDHA COLLEGE OF PHARMACY
ELAYAMPALAYAM, TIRUCHENGODE - 637 205
TAMILNADU, INDIA.
APRIL-2014

Dr. N. N. Rajendran, M. Pharm., Ph. D.,
Principal,
SwamyVivekanandha College of Pharmacy,
Tiruchengode-637 205, Namakkal (DT), Tamil Nadu.
Ph.: +91-4288-234417
CERTIFICATE
This is to certify that the dissertation entitled “METHOD DVELOPMENT AND
VALIDATION FOR THE SIMULTANEOUS ESTIMATION OF ATAZANAVIR
SULPHATE AND RITONAVIR IN BULK AND TABLET DOSAGE FORM BY
RP-HPLC” submitted to The Tamil Nadu Dr. M.G.R. Medical University, Chennai, is a
bonafide project work of SARAVANA KUMAR.S (Reg. No: 261230553) in the Department
of Pharmaceutical Analysis, Swamy Vivekanandha College of Pharmacy, Tiruchengode, for the
partial fulfillment of award of the degree in Master of Pharmacy under the guidance of
Dr. S. ANANDA THANGADURAI, M.Pharm., Ph.D., Swamy Vivekanandha College of
Pharmacy, Tiruchengode.
Date:
Place: Elayampalayam [Dr. N. N. RAJENDRAN]
Dr. S. AnandaThangadurai, M. Pharm., Ph. D.,
Professor & Head,
Department of Pharmaceutical Analysis,
SwamyVivekanandha College of Pharmacy,
Tiruchengode-637 205, Namakkal (DT), Tamil Nadu.
Ph.: +91-4288-234417
CERTIFICATE
This is to certify that the dissertation entitled “METHOD DVELOPMENT AND
VALIDATION FOR THE SIMULTANEOUS ESTIMATION OF ATAZANAVIR
SULPHATE AND RITONAVIR IN BULK AND TABLET DOSAGE FORM BY
RP-HPLC” submitted to The Tamil Nadu Dr. M.G.R. Medical University, Chennai, is a
bonafide project work of SARAVANA KUMAR. S (Reg.No: 261230553), in the Department of
Pharmaceutical Analysis, Swamy Vivekanandha College of Pharmacy, Tiruchengode, for the
partial fulfillment of award of the degree in Master of Pharmacy under my supervision &
guidance. This work has not been submitted in part or full for the award of any degree or
diploma of this or any other university.
Date:
Place: Elayampalayam [Dr. S. ANANDA THANGADURAI]

SwamyVivekanandha College of Pharmacy
Tiruchengode-637 205, Namakkal (DT),
Tamil Nadu, India.
Ph.: +91-4288-234417
EVALUATION CERTIFICATE
This is to certify that the dissertation entitled “METHOD DVELOPMENT AND
VALIDATION FOR THE SIMULTANEOUS ESTIMATION OF ATAZANAVIR
SULPHATE AND RITONAVIR IN BULK AND TABLET DOSAGE FORM BY
RP-HPLC” submitted to The Tamil Nadu Dr. M.G.R. Medical University, Chennai, is a
bonafide project work of SARAVANAKUMAR. S (Reg.No: 261230553), in the Department of
Pharmaceutical Analysis, SwamyVivekanandha College of Pharmacy, Tiruchengode, for the
partial fulfillment of award of the degree in Master of Pharmacy under the guidance of
Dr. S. ANANDA THANGADURAI, M.Pharm., Ph.D., Swamy Vivekanandha College of
Pharmacy, Tiruchengode.
Internal Examiner External Examiner
Examination Center: Swamy Vivekanandha College of Pharmacy.
Date:

Affectionately dedicated
To
My beloved parents, staff &
friends

ACKNOWLEDGEMENT
ACKNOWLEDGEMENT
Behind every successful venture, it is always said that there is an invisible force, which
shapes the things in the right way and directions in which they should be. I found it moral duty to
bow to that divine power and thank him for imbibing in me the strength required for the
successful completion of the thesis work.
Ability and ambition are not enough for success many an able person fails to achieve
anything worth while because he has not been properly guided. Success of any project depends
solely on support, guidance and encouragement received from the guide and well-wishers.
It is with a sense of pride and pleasure that, I humbly look back to acknowledge, those
who have been a source of encouragement in my entire endeavor.
Many Thanks to God for it are he who began this work in me and carried it throughout
completion.
The completion of this dissertation is not only fulfillment of my dreams but also the
dreams of my Parents, who have taken lots of pain for me in completion of my higher studies.
I take this privilege and pleasure to acknowledge the contributions of many individuals
who have been inspirational and supportive throughout my work undertaken and endowed me
with the most precious knowledge to see success in my endeavor.
We submit our sincere thanks to our beloved chairman and secretary “VidyaRatna,
Rashtriya Rattan, Hind Ratna” Prof. Dr. M. Karunanithi, B.Pharm., M.S., Ph.D., D. Litt., for
providing all the facilities to carry out this thesis work.
It gives me great pleasure to record my deep sense of gratitude and indebtedness to
Dr. S. AnandaThangadurai, M.Pharm., Ph.D., Prof & Head., Department of Pharmaceutical
Analysis, whose guidance, support, critical evaluations and professional eminency have inspired
me a lot to put optimum efforts towards the completion of my thesis work.
It is a great pleasure to utilize this unique opportunity to express my deep sense of
gratitude to Dr. N.N.Rajendran, M.Pharm., Ph.D., Principal, Swamy Vivekanandha College of
Pharmacy, for his encouragement and advice in completion of the work.
I also take this opportunity to express my deep sense of gratitude and offer my most
sincere and humble regards to Mr. C. Jothimanivannan, M.Pharm., (Ph.D.,) Prof, & Head.,
Department of Pharmaceutical Chemistry, for his continuous encouragement and support in
completion of my course and dissertation successfully.
It would be unwise if I forget to express my sincere thanks and gratitude to
Mr. M. Jambulingam, M.Pharm., Asst.professor, Department of Pharmaceutical Analysis for
his valuable help, support and encouragement during the work.
I am elated to place on record my profound sense of gratitude Mr. D. Kamalakannan,
M.Pharm., Asst. professor, Department of Pharmaceutical Analysis, for his timely help during
the work.
Good friends are gift of God! I express my deep sense of gratitude and love towards,
K.Harini, K.Haribabu, SVS.Subramaniyan and all my batch mates
I would like to express my sincere thanks to Mrs. K. Rama, Analytical research and
Development Assistant General Manager, Sai Mirra Innopharm Pvt., Ltd., Chennai, for
providing constant source of inspiration and has always encouraged scientific thinking and instilled
me a sense of discipline in my work.
I express my deep sense of gratitude and love to my father Mr. S. Sengodan for timely
help throughout the study without his support I wouldn’t have reached this place, my love and
gratitude to my beloved Mother Mrs. Mariyammal, sister Miss. S. Sumathi, brother’s
Mr. S. Loganathan, Mr. S. Sakthivel, Mr. S. Gokul, Cousin Sathya, Aarthi from depth of my
heart for giving me more than what I deserved. It gives me an immense pleasure to dedicate my
research work at their feet without whose blessings and vision.
I would like to express my sincere thanks to Mr. C. Senthil, Mrs. S. Menaka for their
help and support in all my laboratory tests.
I would like to thank all those who have helped me directly or indirectly to complete this
work successfully.
S.SARAVANAKUMAR
261230553

CONTENTS
CHAPTER NO. DESCRIPTION PAGES
1 INTRODUCTION 1-3
2 LITERATURE REVIEW 4-8
3 AIM AND OBJECTIVES 9
4 DRUG PROFILE 10-13
5 EXPERIMENTAL WORK 14-25
6 RESULTS AND DISCUSSIONS 26-61
7 SUMMARY AND CONCLUSIONS 62-63
8
REFERENCE
64-65
9
APPENDIX
66-67

Chapter 1
INTRODUCTION
1. INTRODUCTION
Analytical chemistry may be defined as the science and art of determining the composition of
material in terms of elements or compounds contained in it1. Analytical chemistry is divided into two
branches quantitative and qualitative. A qualitative method is the information about the identity of
atomic or molecular species or functional groups in the sample. A quantitative method provides
numerical information as to the relative amount of one or more of these components.
For analysis of these drugs different analytical methods are routinely being used. These
analytical methods are classified as chemical and instrumental. The chemical methods include
Gravimetric and Titrimetric. These methods are simple but less precise and more time consuming so
now days these methods are not suggested for the routine analysis. The instrumental methods include
electrochemical methods - Electro gravimetric method, Potentiometry, Colorimetry, Conductometry,
Polarography and Optical methods - Absorption and Emission methods. The Absorption methods include
Visible Spectrophotometry, Ultraviolet Spectrophotometry, Atomic Absorption Spectrophotometry,
Infrared Spectrophotometry, and Emission methods include Emission Spectroscopy, Flame Photometry,
Fluorimetry, etc. The other outstanding methods include isotopes, radioactivity, X-ray fluorescence and
separation methods as various chromatographic principles viz. HPLC, GC, HPTLC, LC-MS2.
HIGH PERFORMANCE LIQUID CHROMATOGRAPHY (HPLC):
HPLC is a fast growing analytical technique for the analysis of drugs. Its simplicity, specificity and
wide range of sensitivity make it ideal for the analysis of many drugs in both dosage forms and biological
fluids3.
The rate of distribution of drugs between stationary and mobile phase is controlled by diffusion
process. If diffusion is minimized, a faster and effective separation can be achieved. The technique of
high performance liquid chromatography is so called because of its improved performance when
compared to conventional column chromatography. Advances in column technology, high pressure
pumping system and sensitive detectors have transformed liquid column chromatography into high
efficient, accurate and highly resolved method of separation4. For the present study, the drug Atazanavir
Sulphate and Ritonavir was selected for the estimation.
The HPLC method was considered the choice of estimation, since this method is the most
powerful of all chromatographic and other separative methods. The HPLC method has enabled
analytical chemist to attain great success in solving his analytical problems.
Method Development:
The development of a method of analysis of any compound is usually based on existing
literature, using same or quite similar instrumentation. But now days HPLC based method is not similar
as compare to existing literature based approaches. The development of new or any improved method
should be beneficial in any way than the existing method. Method development usually requires
selecting the method requirement and deciding the instrumentation to utilize for what purpose5.
Method development is done for, new drug products and already existing products. The various
parameters that include to be optimized during method development are
� Mode of separation.
� Selection of stationary phase.
� Selection of mobile phase.
� Selection of detector
Method validation:
Validation of an analytical method is the process by which it is established, by laboratory
studies, that the performance characteristics of the method meet the requirements for the intended
analytical applications.
Validation is defined by different agencies. According to Food and Drug administration (FDA),
validation is establishing documentation evidence, which provides a high degree of assurance that
specific process will consistently produce a product meeting its predetermined specification and quality
attributes.
According to World Health Organization (WHO), validation is an action of providing that any
procedure, process, equipment, material, activity, or system actually leads to the expected results6.
Validation parameter includes accuracy, precision, system suitability, linearity, ruggedness,
robustness, limit of detection and limit of quantitation.
The principal purpose of analytical method validation is to ensure that test methods, which are
used for assessing compliance of pharmaceutical products with established specifications, will give
accurate, reliable and reproducible results.
The number of drugs and drug formulations introduced into the market has an alarming rate.
These drugs or formulations may be either in the new entities in the market or partial structural
modification of the existing drugs or novel dosage forms or multi component dosage forms.
Applications:
a. Chemistry and biochemistry research analyzing complex mixtures
b. Developing processes for synthesizing chemical compounds
c. Purifying chemical compounds
d. Quality control to ensure the purity of raw materials, to control and improve process yields, to
quantify assays of final products or to evaluate product stability and monitor degradation.
e. Isolating natural products or predicting physical properties.
The HPLC method was considered the choice of estimation, since this method is the most
powerful of all chromatographic and other separative methods. The HPLC method has enabled
analytical chemist to attain great success in solving his analytical problems.
Atazanavir sulphate is an antiretroviral drug of the protease inhibitor class, it is used to treat
infection of human immunodeficiency virus Used in combination with other antiretroviral agents for the
treatment of HIV-1 infection, as well as post exposure prophylaxis of HIV infection in individuals who
have had occupational or no occupational exposure to potentially infectious body fluids of a person
known to be infected with HIV when that exposure represents a substantial risk for HIV transmission.
Ritonavir an HIV protease inhibitor that works by interfering with the reproductive cycle of HIV is an
antiretroviral drug of the protease inhibitor class, it is used to treat infection of human
immunodeficiency virus.

Chapter 2
LITERATURE REVIEW
2. LITERATURE REVIEW
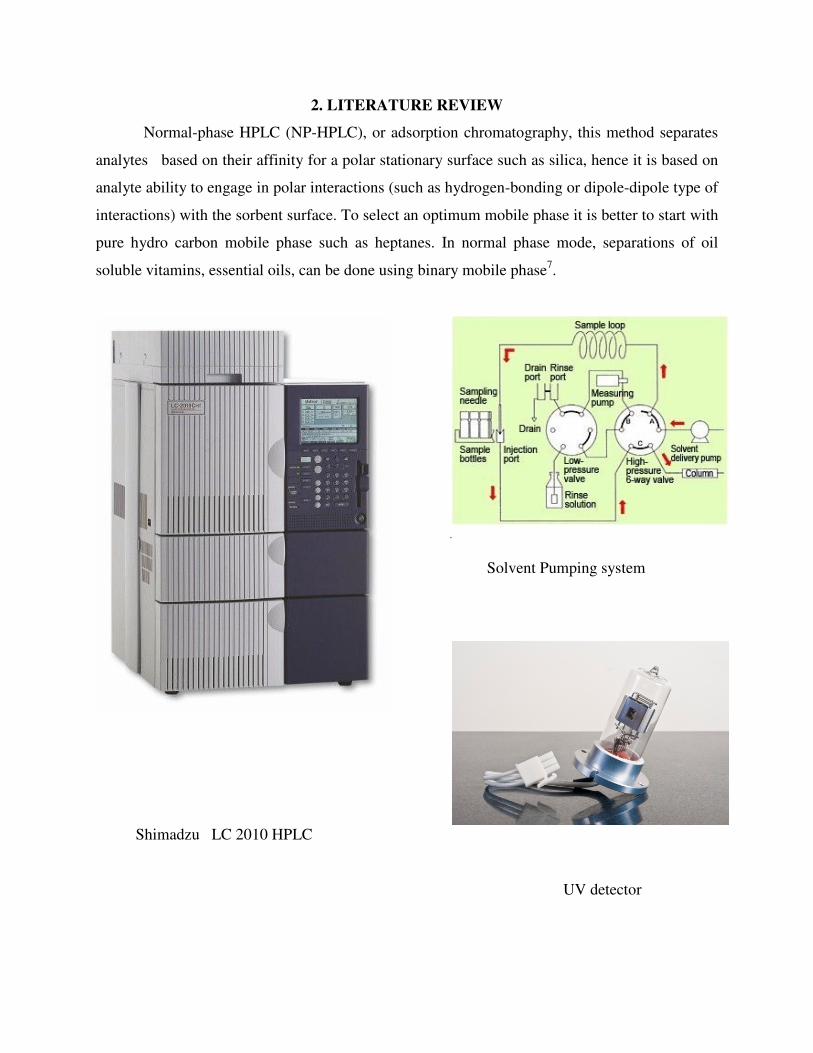
Normal-phase HPLC (NP-HPLC), or adsorption chromatography, this method separates
analytes based on their affinity for a polar stationary surface such as silica, hence it is based on
analyte ability to engage in polar interactions (such as hydrogen-bonding or dipole-dipole type of
interactions) with the sorbent surface. To select an optimum mobile phase it is better to start with
pure hydro carbon mobile phase such as heptanes. In normal phase mode, separations of oil
soluble vitamins, essential oils, can be done using binary mobile phase7.
.
Solvent Pumping system
Shimadzu LC 2010 HPLC
UV detector
Reverse phase HPLC (RP-HPLC) has a non-polar stationary phase and an aqueous,
moderately polar mobile phase. One common stationary phase is silica which has been surface-
modified with RMe2SiCl, where R is a straight chain alkyl group such as C18H37 or C8H17.With
such stationary phases, retention time is longer for molecules which are less polar, while polar
molecules elute more readily. Generally the lower the polarity of the mobile phase the higher is
its elution strength. Thus water is the weaker solvent. Methanol and acetonitrile are popular
solvents because of its low viscosity and are readily available with excellent purity. We have
selected Atazanavir sulphate and Ritonavir for the present work and literature cited on the above
drugs were listed below.
A sensitive method for the simultaneous estimation of Ritonavir in their dosage form was
developed and validated. The method was carried out on a Thermo Hypersil RP C-18 column
(150 mm x 4.6 mm, 5 µm) with a mobile phase consisting of Acetonitrile: Potassium dihydrogen
Phosphate & di potassium hydrogen Phosphate (45: 55 V/V) at a flow rate of 1 mL min-1
and the
detection was carried out at 239 nm. The limits of detection (LOD) and quantification (LOQ)
were 0.09 and 0.027 µg/ mL respectively. Precision % RSD values were found to be 0.38% and
0.41% respectively. Recovery of Ritonavir was found to be in the range of 99.90-100.50%. The
retention time of Ritonavir was 3.11 min respectively. Linearity for Ritonavir were found in the
range of 20-120 µg/ mL-1 8
.
A reverse phase high performance liquid chromatographic method was developed and
validated for the simultaneous estimation of Lopinavir and Ritonavir in Bulk and Tablet dosage
form. A Hypersil (ODS) C8 (250 × 4.6mm, 5 µm) id in isocratic mode with mobile phase
containing acetonitrile: methanol: 0.01 M potassium dihydrogen
orthophosphate buffer at pH 3.0 (30:20:50 V/V/V) was used. The flow rate was 1 mL min-1
and
effluents were monitored at 254 nm. The retention time of Atazanavir Sulphate and Ritonavir
was 4.66 min and 3.44 min respectively. The concentration curves were linear in the
concentration range of 80–120 µg/ mL-1
for both the drugs. The developed method was validated
for specificity, precision, linearity, accuracy, LOD, LOQ, robustness. Recovery of Lopinavir and
Ritonavir in formulations was found to be in the range of 98% -102% respectively confirms the
non-interferences of the excipients in the formulation9.

A high-performance liquid chromatographic method for the determination of atazanavir
(ATV) in human plasma is developed and validated. The method involves a rapid and simple
solid-phase extraction of ATV using Bond-elut C18 3 mL cartridge. The separation of ATV from
internal standard and endogenous components is achieved using an isocratic elution on an octyl
column and an UV detector set at 260 nm. The method is linear from 20 to 10,000 µg/ mL (mean
r2 = 0.9991, n = 10). The observed intra- and inter-day assay precision ranged from 2.2% to
14.7% at the lower limit of quantitation (LOQ), where as accuracy varies between 1.0% and 14%
(at LOQ). Mean drug recovery is 80.5% for ATV and 78.4% for IS10
.
A new, simple, sensitive, precise and accurate High-performance thin-layer
chromatographic method for simultaneous determination of Ritonavir and Atazanavir in their
combined tablet dosage form has been developed, validated and used for determination of the
compounds in commercial pharmaceutical products. Chromatographic separation was achieved
on aluminium plates precoated with silica gel 60 F254 as the stationary phase and chloroform:
ethyl acetate: acetone (5:2:3 V/V/V) as a mobile phase. Densitometric measurements of
their spots were achieved at 244 nm over the concentration ranges of 800-2800 µg spot-1 and
2400-8400 µg spot-1, with mean recoveries of 98.57 ± 0.35 and 99.16 ± 0.20 for ritonavir and
atazanavir respectively. Limit of detection for ritonavir and atazanavir were found to be 300 µg
spot-1
and 200 µg spot-1
respectively. Chromatogram of standard Ritonavir Rf = 0.28 and
Atazanavir Rf = 0.5811
.
Chemometrics-assisted spectrophotometry for the determination of two protease
inhibitors, lopinavir and ritonavir, in plasma was evaluated. A set of calibration mixtures was
designed according to central composite design. The UV spectra obtained from the calibration
set were subjected to partial least square regression to construct the prediction models for
lopinavir and ritonavir in unknown samples, which were then validated in a randomly selected
set of synthetic mixtures of the drugs. An optimum model was obtained in the wavelength ranges
of 215–249 nm and 240–279 nm with principal components 8 for both lopinavir and
ritonavir respectively. The prediction models were used to analyse the two drugs in plasma and
the results were compared with those obtained by high-performance liquid chromatography
(HPLC). The PLS-1
model and the HPLC method were found to be comparable12
.

A simple, precise, specific and accurate reverse phase HPLC method has been developed
for the determination of Atazanavir and Ritonavir in pharmaceutical dosage forms. The
chromatographic separation was achieved on Symmetry C8 (4.6 x 100mm, 5 µm)
column using a mixture of Buffer: Acetonitrile (45:55 V/V) as the mobile phase at a flow rate 0.9
mL/ min. The retention time of Atazanavir and Ritonavir was 2.9 min and 4.1 min. The analyte
was monitored using UV detector at 235 nm. Results of analysis were validated statistically and
by recovery studies. The method was validated according to the ICH guidelines with respect to
linearity, accuracy, precision and robustness. The proposed method can be successfully used to
determine the drug contents of marketed formulation13
.
A simple, precise, accurate, and rapid HPLC method has been developed, and validated
for the determination of Atazanavir and Ritonavir simultaneously in combined tablet dosage
form. The mobile phase used was a mixture of phosphate buffer pH 4.0 and Acetonitrile (43:57
V/V). The detection of Atazanavir and Ritonavir was carried out by UV detector at 240 nm. The
retention time of Atazanavir and Ritonavir were found to be 4.2 min and 5.2 min respectively.
Results of the analysis were validated statistically, and by recovery studies. The proposed
method can be successfully used to determine the drug contents of marketed formulation14
.
Simple, precise, rapid and accurate methods for simultaneous determination of
Atazanavir and Ritonavir in combined tablet dosage form have been developed. Method A is
based on ratio spectra derivative and method B uses integrated area under curve, methanol is
used as solvent for both the methods. The amplitudes at 280.01 nm and 286.12 nm of the first
derivative of ratio spectra were selected to determine ATV and RTV, respectively by ratio
derivative method and wavelength ranges of 246.97-252.03 nm and 240.78-244.16 nm were
selected to determine ATV and RTV by AUC method in combined formulation. Beer’s law is
obeyed in the concentration range of 15-75 µg/ mL and 5-25 µg/ mL for Atazanavir and
Ritonavir, respectively by both the methods. The % assay in commercial formulation was found
to be in the range 98.81-100.8% for ATV and 98.91-101.2% for RTV by the proposed methods.
The methods were validated with respect to linearity, precision and accuracy. Recovery was
found in the range of 99.20-99.96% for ATV and 99.12-99.97% for RTV by ratio
derivative method and 99.08-99.66% for ATV and 99.78-100.6% for RTV by AUC method. The

methods developed are simple, economical, precise and accurate and can be used for routine
quality control of analytes in combined tablets15
.
A validated RP HPLC method for the estimation of Atazanavir sulphate in capsule
dosage form on Agilent TC C18 (2) 250 x 4.6 mm, 5 µm column using mobile phase
composition of water: acetonitrile (20:80 V/V) pH adjusted to 3.0.Flow rate was maintained at 1
ml/ min at an ambient temperature. Quantification was achieved with ultraviolet detection at 255
nm. The retention time obtained for Atazanavir sulphate was at 3.7 min. The detector response
was linear in the concentration range of 10 – 80 µg/ mL. This method has been validated and
shown to be specific, sensitive, precise, linear, accurate, rugged, robust and fast. Hence, this
method can be applied for routine quality control of Atazanavir sulphate in capsule dosage forms
as well as in bulk drug16
.
A validated RP HPLC method for the estimation of atazanavir in capsule dosage form on
YMC ODS 150 × 4.6 mm, 5 µm column using mobile phase composition of ammonium
dihydrogen phosphate buffer (pH 2.5) with acetonitrile (55:45 V/V). Flow rate was maintained at
1.5 mL/ min with 288 nm UV detection. The retention time obtained for atazanavir was at 4.7
min. The detector response was linear in the concentration range of 30 - 600 µg/ mL. This
method has been validated and shown to be specific, sensitive, precise, linear, accurate, rugged,
robust and fast. Hence, this method can be applied for routine quality control of atazanavir in
capsule dosage forms as well as in bulk drug17
.
To simple, sensitive, rapid spectrophotometric methods have been developed for
simultaneous estimation of Atazanavir Sulfate (ATV) and Ritonavir (RTV) in tablets. First
method involves solving simultaneous equations based on measurement of absorbance at two
wavelengths 249.5 nm and 238.5 nm λ max of ATV and RTV, respectively. Second method is
based on area under curve (AUC) and the wavelength ranges selected for analysis were 254.5-
244.5 nm for Atazanavir Sulfate and 243.5-233.5 nm for Ritonavir. Beer’s law was obeyed in the
concentration range of 10-50 µg/ mL and 10-50 µg/ mL for ATV and RTV, respectively.
The methods were validated as per ICH guidelines. Statistical analysis proved that the methods
were accurate, precise, and reproducible for analysis of ATV and RTV in tablets. The wide
linearity range, sensitivity, accuracy and simple procedure imply that the proposed technique
demonstrated to be appropriate for routine analysis and quality control assay of tablets18
.

Chapter 3
AIM & OBJECTIVES

3. AIM AND OBJECTIVES
The drug analysis plays an important role in the development of drugs, their manufacture
and the therapeutic use. Pharmaceutical industries rely upon quantitative chemical analysis to
ensure that the raw materials used and the final product obtained meets the required
specification. These drugs or formulation may be either in the new entities in the market or
partial structural modification of the existing drugs or novel dosage forms or multi component
dosage forms. The multi component dosage form proves to be effective due to the combined
mode of action on the body. The complexity of dosage forms including the presence of multiple
drug entities possesses considerable challenge to the analytical chemist during the development
of assay procedure.
The extensive literature survey carried out and revealed that very few methods are
reported for the simultaneous estimation of these drugs in other combinations. Hence an attempt
was made to develop a specific, precise, accurate, linear, simple, rapid, validated and cost
effective HPLC method for the simultaneous estimation of Atazanavir sulphate and Ritonavir in
combined dosage forms.
The specific aim of the research was
� To develop a method for the simultaneous estimation of Atazanavir sulphate and Ritonavir in
bulk and Pharmaceutical dosage form and validate the proposed methods in accordance with
ICH guidelines for the intended analytical application.
� To validate the developed RP-HPLC method by using various validation parameters such as
linearity, accuracy, system suitability, precision, robustness, ruggedness, limit of detection and
limit of quantization.
Chapter 4
DRUG PROFILE
4. DRUG PROFILE
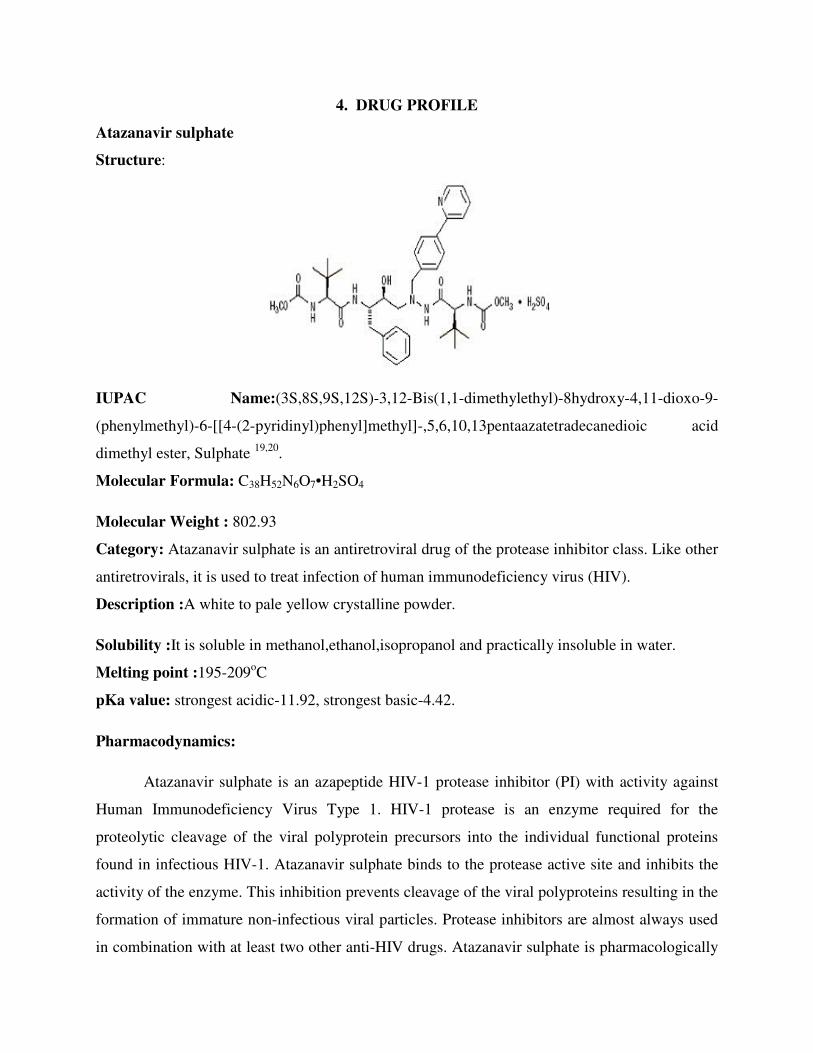
Atazanavir sulphate
Structure:
IUPAC Name:(3S,8S,9S,12S)-3,12-Bis(1,1-dimethylethyl)-8hydroxy-4,11-dioxo-9-
(phenylmethyl)-6-[[4-(2-pyridinyl)phenyl]methyl]-,5,6,10,13pentaazatetradecanedioic acid
dimethyl ester, Sulphate 19,20
.
Molecular Formula: C38H52N6O7•H2SO4
Molecular Weight : 802.93
Category: Atazanavir sulphate is an antiretroviral drug of the protease inhibitor class. Like other
antiretrovirals, it is used to treat infection of human immunodeficiency virus (HIV).
Description :A white to pale yellow crystalline powder.
Solubility :It is soluble in methanol,ethanol,isopropanol and practically insoluble in water.
Melting point :195-209oC
pKa value: strongest acidic-11.92, strongest basic-4.42.
Pharmacodynamics:
Atazanavir sulphate is an azapeptide HIV-1 protease inhibitor (PI) with activity against
Human Immunodeficiency Virus Type 1. HIV-1 protease is an enzyme required for the
proteolytic cleavage of the viral polyprotein precursors into the individual functional proteins
found in infectious HIV-1. Atazanavir sulphate binds to the protease active site and inhibits the
activity of the enzyme. This inhibition prevents cleavage of the viral polyproteins resulting in the
formation of immature non-infectious viral particles. Protease inhibitors are almost always used
in combination with at least two other anti-HIV drugs. Atazanavir sulphate is pharmacologically

related but structurally different from other protease inhibitors and other currently available
antiretrovirals.
Mechanism of Action:
Atazanavir sulphate selectively inhibits the virus-specific processing of viral Gag and
Gag-Pol polyproteins in HIV-1 infected cells by binding to the active site of HIV-1 protease,
thus preventing the formation of mature virions. Atazanavir sulphate is not active against HIV-2.
Pharmacokinetics:
Absorption-Atazanavir is rapidly absorbed with a tmax of approximately 2.5 hours.
Administration of Atazanavir sulphate with food enhances bioavailability and reduces
pharmacokinetic variability. Oral bioavailability is 60-68%.
Protein binding- 86%
Route of elimination- Atazanavir sulphate dose was excreted urine.
Metabolism- Metabolisedto Atazanavir sulphate by liver.
Half life- 6.5 hours
Adverse Reaction:
Protease inhibitors commonly cause paresthesias, nausea, vomiting, and diarrhea
disturbances in glucose and lipid metabolism also occur, including diabetes,
hypertriglyceridemia, and hypercholesterolemia.
Dose : Reyataz, latazanavir,zrivada 400 mg tablets.
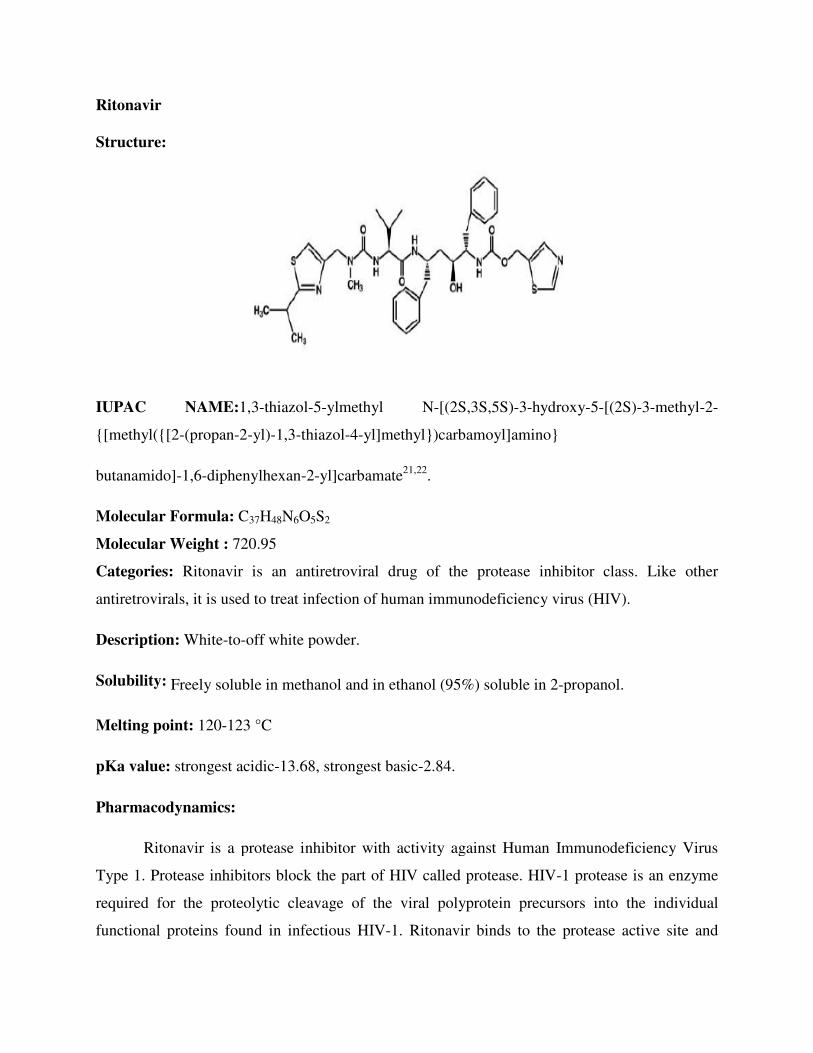
Ritonavir
Structure:
IUPAC NAME:1,3-thiazol
{[methyl({[2-(propan-2-yl)-1,3-thiazol
butanamido]-1,6-diphenylhexan-
Molecular Formula: C37H48N6O
Molecular Weight : 720.95
Categories: Ritonavir is an antiretroviral drug of the protease inhibitor class. Like other
antiretrovirals, it is used to treat infection of human immunodeficiency virus (HIV).
Description: White-to-off white powder.
Solubility: Freely soluble in methanol and in ethanol (95%) soluble in 2
Melting point: 120-123 °C
pKa value: strongest acidic-13.68, strongest basic
Pharmacodynamics:
Ritonavir is a protease inhibitor with activity against Human Immunodeficiency Virus
Type 1. Protease inhibitors block the part of HIV called protease. HIV
required for the proteolytic cleavage of the viral polyprotein precursors in
functional proteins found in infectious HIV
thiazol-5-ylmethyl N-[(2S,3S,5S)-3-hydroxy-5-[(2S)
thiazol-4-yl]methyl})carbamoyl]amino}
-2-yl]carbamate21,22
.
O5S2
Ritonavir is an antiretroviral drug of the protease inhibitor class. Like other
antiretrovirals, it is used to treat infection of human immunodeficiency virus (HIV).
off white powder.
methanol and in ethanol (95%) soluble in 2-propanol.
13.68, strongest basic-2.84.
Ritonavir is a protease inhibitor with activity against Human Immunodeficiency Virus
Type 1. Protease inhibitors block the part of HIV called protease. HIV-1 protease is an enzyme
required for the proteolytic cleavage of the viral polyprotein precursors into the individual
functional proteins found in infectious HIV-1. Ritonavir binds to the protease active site and
[(2S)-3-methyl-2-
Ritonavir is an antiretroviral drug of the protease inhibitor class. Like other
antiretrovirals, it is used to treat infection of human immunodeficiency virus (HIV).
propanol.
Ritonavir is a protease inhibitor with activity against Human Immunodeficiency Virus
1 protease is an enzyme
to the individual
1. Ritonavir binds to the protease active site and
inhibits the activity of the enzyme. This inhibition prevents cleavage of the viral polyproteins
resulting in the formation of immature non-infectious viral particles. Protease inhibitors are
almost always used in combination with at least two other anti-HIV drugs.
Mechanism of action:
Ritonavir inhibits the HIV viral proteinase enzyme which prevents cleavage of the gag-
pol polyprotein, resulting in noninfectious, immature viral particles.
Pharmacokinetics:
Absorption-The absolute bioavailability of ritonavir has not been determined.
Metabolism- Hepatic.
Protein binding- 98-99%
Route of elimination-Ritonavir dose was excreted urine.
Metabolism- Metabolised to Ritonavir by liver.
Half-life- 3 to 5 hours.
Adverse Reactions /Side Effects:
Protease inhibitors commonly cause paresthesias, nausea, vomiting, and diarrhea
disturbances in glucose and lipid metabolism also occur, including diabetes,
hypertriglyceridemia, and hypercholesterolemia.
Dose: Norvir sofgel, Norvir100 mg tablets.
Chapter 5
EXPERIMENTAL WORK

5. EXPERIMENTAL WORK
5.1 MATERIALS AND METHODS
Equipments used:
S.No Name Make
1 Weighing Balance SHIMADZU
2 pH meter ELCHEM
3 Sonicator SAISONIC
4 HPLC SHIMADZU LC-2010 with UV DETECTOR
5 UV-Visible Spectroscopy PERKIN ELMER with LAMDA25
Chemicals used:
S.No Name Make
1 Phosphate buffer HPLC grade (MERCK)
2 Acetonitrile HPLC grade (MERCK)
3 Methanol HPLC grade (MERCK)
4 Orthophosphoric acid HPLC grade (RANCHEM)
5 Purified water HPLC grade (MILLI-Q)
Active pharmaceutical Ingredient (pure drug)
S.No Name Specification
1 Atazanavir sulphate and Ritonavir Reference Standard

Marketed Formulation
S.No Name Manufacturer
1 Atazotec Tablets Sai Mirra Innopharm
SOLUBILITY
Solubility of drug was observed by dissolving it in different solvents and it was found
that drug having good solubility in followings.
Solubility of drugs in different solvents
5.2 METHOD DEVELOPMENT
Determination of LAMBDA Max of Atazanavir sulphate by UV-Visible spectrophotometry
Selection of wavelength:
Accurately Weighed and transferred Atazanavir sulphate equivalent to 25 mg into 50 mL
clean, dry, volumetric flask, 50 mL of methanol was added, sonicated for 5 minutes, and filtered
through 0.45 µm nylon membrane filter. Pipetted out 5 mL of the above solution, and diluted
with 50 mL of methanol in 50 mL volumetric flask, and scanned between 200 to 400 by UV
spectroscopy23
. Shown in Figure-1.
SOLVENT SOLUBILITY
Atazanavir sulphate and Ritonavir
Water -
Acetonitrile +
Methanol +
0.1N NaoH -
Determination of LAMBDA Max of Ritonavir by UV-Visible spectrophotometry
Sample Preparation
Accurately Weighed and transferred Ritonavir equivalent to 25 mg into 50 mL clean, dry,
volumetric flask, 50 mL of methanol was added, sonicated for 5 minutes, and filtered through
0.45 µm nylon membrane filter. Pipetted out 5 mL of the above solution, and diluted with 50 mL
of methanol in 50 mL volumetric flask, and scanned between 200 to 400 by UV spectroscopy.
Shown in Figure-2.
Determination of ISOBESTIC point of Atazanavir sulphate and Ritonavir by UV-Visible
spectrophotometry
Sample Preparation
Accurately Weighed and transferred Atazanavir sulphate and Ritonavir equivalent to 25
mg and 25 mg into 50 mL clean dry volumetric flask, 50 mL of methanol was added, sonicated
for 5 minutes, and filtered through 0.45 µm nylon membrane filter. Pipette out both 5 mL of each
solutions transferred into 50 mL volumetric flask, and diluted to 50 mL with methanol in 50 mL
volumetric flask, and scanned between 200 to 400 by UV spectroscopy. Shown in Figure-3.
Selection of mobile phase:
The method development and validation of Atazanavir sulphate and Ritonavir requires
greater resolution. Hence different solvent systems were tried.
The trails are using SHIMADZU LC 2010 equipment with UV detector and isocratic
pump. The system controlled by LC solution software.
Selection of flow rate:
The flow rate of Atazanavir sulphate and Ritonavir were tried from 0.8 mL to 1.5 mL.

Trial-1
Buffer preparation:
About 6.8 g of potassium dihydrogen orthophosphate was dissolved in 1000 mL of
HPLC grade water and pH 3.0 was adjusted with orthophosphoric acid. It was filtered through
0.45 µm nylon membrane filter and degassed with sonicator. It was used as a diluent for the
preparation of sample and standard solution.
Preparation of mobile phase:
Mobile phase consist of acetonitrile: methanol: buffer of pH 3.0 (65:5:30) was taken
sonicated degas for 10 min and filtered through 0.45 µm nylon membrane filter.
Standard Preparation:
Weigh accurately 68 mg of Standard Atazanavir sulphate and 20 mg of Standard
Ritonavir into a 100 mL volumetric flask, dissolve and make up the volume with methanol.
Transfer 5 mL of the solution into a 50 mL volumetric flask and make up the volume with the
mobile phase. The solution contains 68 µg/ mL and 20 µg/ mL concentration of Atazanavir
sulphate and Ritonavir respectively. The chromatogram was shown in Figure-4.
Chromatographic conditions:
Column : Nucleodur C8 column(100 mm x 1.8 mm x5µm)
Mobile phase : Acetonitrile: Methanol: buffer pH 3.0 (65:5:30)
Diluent : HPLC grade methanol
Flow rate : 0.8 mL/ min
Detector wavelength : 210 nm
Injection mode : Auto injector (vial)
Injection volume : 20 µl
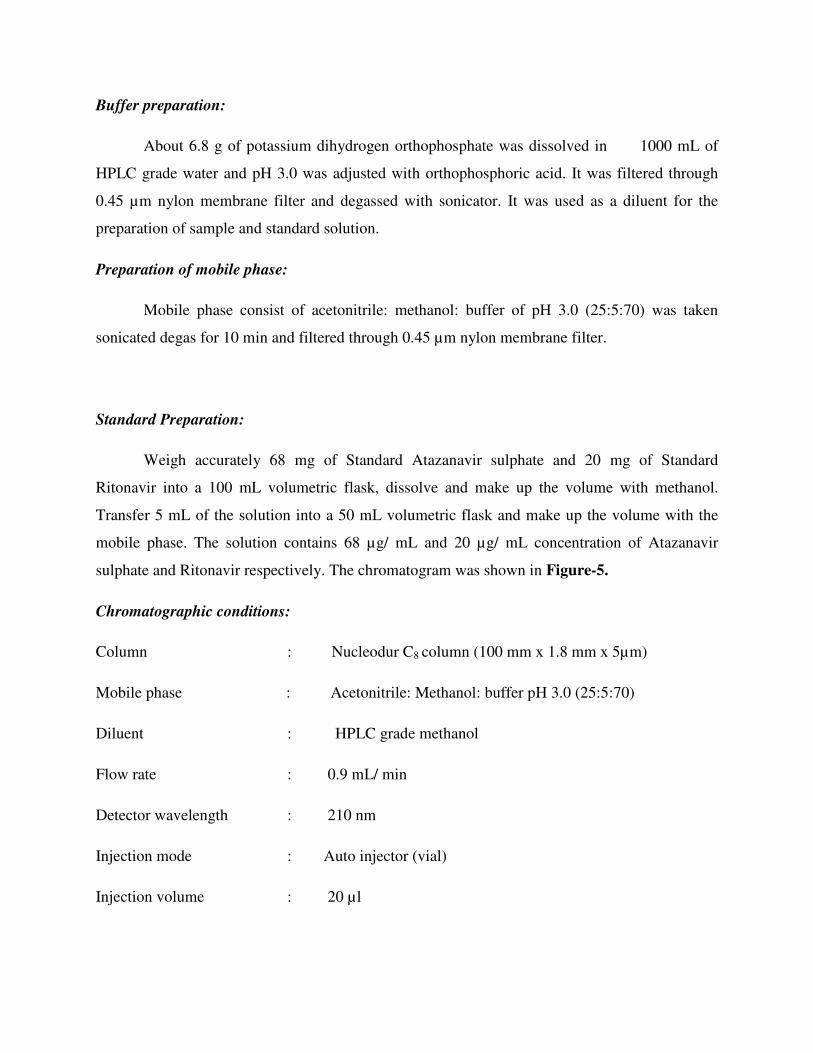
Trial-2
Buffer preparation:
About 6.8 g of potassium dihydrogen orthophosphate was dissolved in 1000 mL of
HPLC grade water and pH 3.0 was adjusted with orthophosphoric acid. It was filtered through
0.45 µm nylon membrane filter and degassed with sonicator. It was used as a diluent for the
preparation of sample and standard solution.
Preparation of mobile phase:
Mobile phase consist of acetonitrile: methanol: buffer of pH 3.0 (25:5:70) was taken
sonicated degas for 10 min and filtered through 0.45 µm nylon membrane filter.
Standard Preparation:
Weigh accurately 68 mg of Standard Atazanavir sulphate and 20 mg of Standard
Ritonavir into a 100 mL volumetric flask, dissolve and make up the volume with methanol.
Transfer 5 mL of the solution into a 50 mL volumetric flask and make up the volume with the
mobile phase. The solution contains 68 µg/ mL and 20 µg/ mL concentration of Atazanavir
sulphate and Ritonavir respectively. The chromatogram was shown in Figure-5.
Chromatographic conditions:
Column : Nucleodur C8 column (100 mm x 1.8 mm x 5µm)
Mobile phase : Acetonitrile: Methanol: buffer pH 3.0 (25:5:70)
Diluent : HPLC grade methanol
Flow rate : 0.9 mL/ min
Detector wavelength : 210 nm
Injection mode : Auto injector (vial)
Injection volume : 20 µl
Trial-3
Buffer preparation:
About 6.8 g of potassium dihydrogen orthophosphate was dissolved in 1000 mL of
HPLC grade water and pH 3.0 was adjusted with orthophosphoric acid. It was filtered through
0.45 µm nylon membrane filter and degassed with sonicator. It was used as a diluent for the
preparation of sample and standard solution.
Preparation of mobile phase:
Mobile phase consist of acetonitrile: methanol: buffer of pH 3.0 (60:10:30) was taken
sonicated degas for 10 min and filtered through 0.45 µm nylon membrane filter.
Standard Preparation:
Weigh accurately 68 mg of Standard Atazanavir sulphate and 20 mg of Standard
Ritonavir into a 100 mL volumetric flask, dissolve and make up the volume with methanol.
Transfer 5 mL of the solution into a 50 mL volumetric flask and make up the volume with the
mobile phase. The solution contains 68 µg/ mL and 20 µg/ mL concentration of Atazanavir
sulphate and Ritonavir respectively. The chromatogram was shown in Figure-6.
Chromatographic conditions:
Column : Nucleodur C18 column(150 mm x 4.6 mm x5µm)
Mobile phase : Acetonitrile: Methanol: buffer pH 3.0 (60:10:30)
Diluent : HPLC grade methanol
Flow rate : 1.0 mL/ min
Detector wavelength : 210 nm
Injection mode : Auto injector (vial)
Injection volume : 20 µl

Trial-4
Buffer preparation:
About 6.8 g of potassium dihydrogen orthophosphate was dissolved in 1000 mL of
HPLC grade water and pH 3.0 was adjusted with orthophosphoric acid. It was filtered through
0.45 µm nylon membrane filter and degassed with sonicator. It was used as a diluent for the
preparation of sample and standard solution.
Preparation of mobile phase:
Mobile phase consist of acetonitrile: methanol: buffer of pH 3.0 (50:10:40) was taken
sonicated degas for 10 min and filtered through 0.45 µm nylon membrane filter.
Standard Preparation:
Weigh accurately 68 mg of Standard Atazanavir sulphate and 20 mg of Standard
Ritonavir into a 100 mL volumetric flask, dissolve and make up the volume with methanol.
Transfer 5 mL of the solution into a 50 mL volumetric flask and make up the volume with the
mobile phase. The solution contains 68 µg/ mL and 20 µg/ mL concentration of Atazanavir
sulphate and Ritonavir respectively. The chromatogram was shown in Figure-7.
Chromatographic conditions:
Column : Nucleodur C18 column(150 mm x 4.6 mm x5µm)
Mobile phase : Acetonitrile: Methanol: buffer pH 3.0 (50:10:40)
Diluent : HPLC grade methanol
Flow rate : 1.2 mL/ min
Detector wavelength : 210 nm
Injection mode : Auto injector (vial)
Injection volume : 20 µl
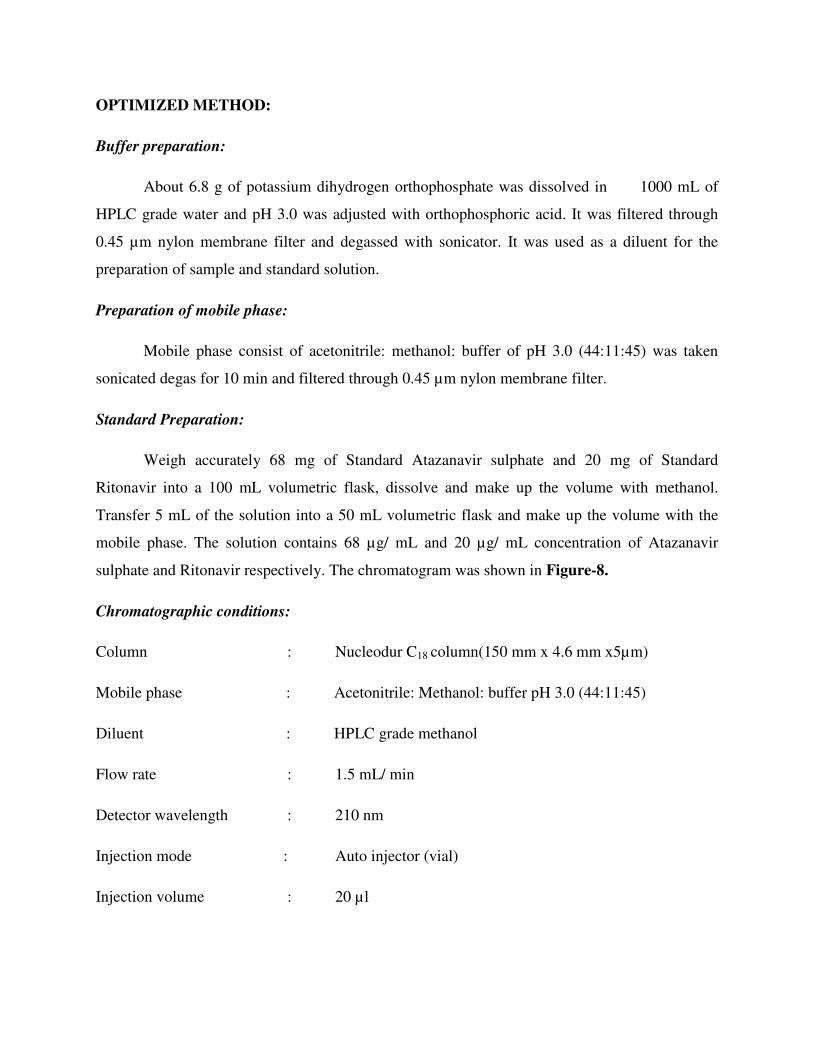
OPTIMIZED METHOD:
Buffer preparation:
About 6.8 g of potassium dihydrogen orthophosphate was dissolved in 1000 mL of
HPLC grade water and pH 3.0 was adjusted with orthophosphoric acid. It was filtered through
0.45 µm nylon membrane filter and degassed with sonicator. It was used as a diluent for the
preparation of sample and standard solution.
Preparation of mobile phase:
Mobile phase consist of acetonitrile: methanol: buffer of pH 3.0 (44:11:45) was taken
sonicated degas for 10 min and filtered through 0.45 µm nylon membrane filter.
Standard Preparation:
Weigh accurately 68 mg of Standard Atazanavir sulphate and 20 mg of Standard
Ritonavir into a 100 mL volumetric flask, dissolve and make up the volume with methanol.
Transfer 5 mL of the solution into a 50 mL volumetric flask and make up the volume with the
mobile phase. The solution contains 68 µg/ mL and 20 µg/ mL concentration of Atazanavir
sulphate and Ritonavir respectively. The chromatogram was shown in Figure-8.
Chromatographic conditions:
Column : Nucleodur C18 column(150 mm x 4.6 mm x5µm)
Mobile phase : Acetonitrile: Methanol: buffer pH 3.0 (44:11:45)
Diluent : HPLC grade methanol
Flow rate : 1.5 mL/ min
Detector wavelength : 210 nm
Injection mode : Auto injector (vial)
Injection volume : 20 µl
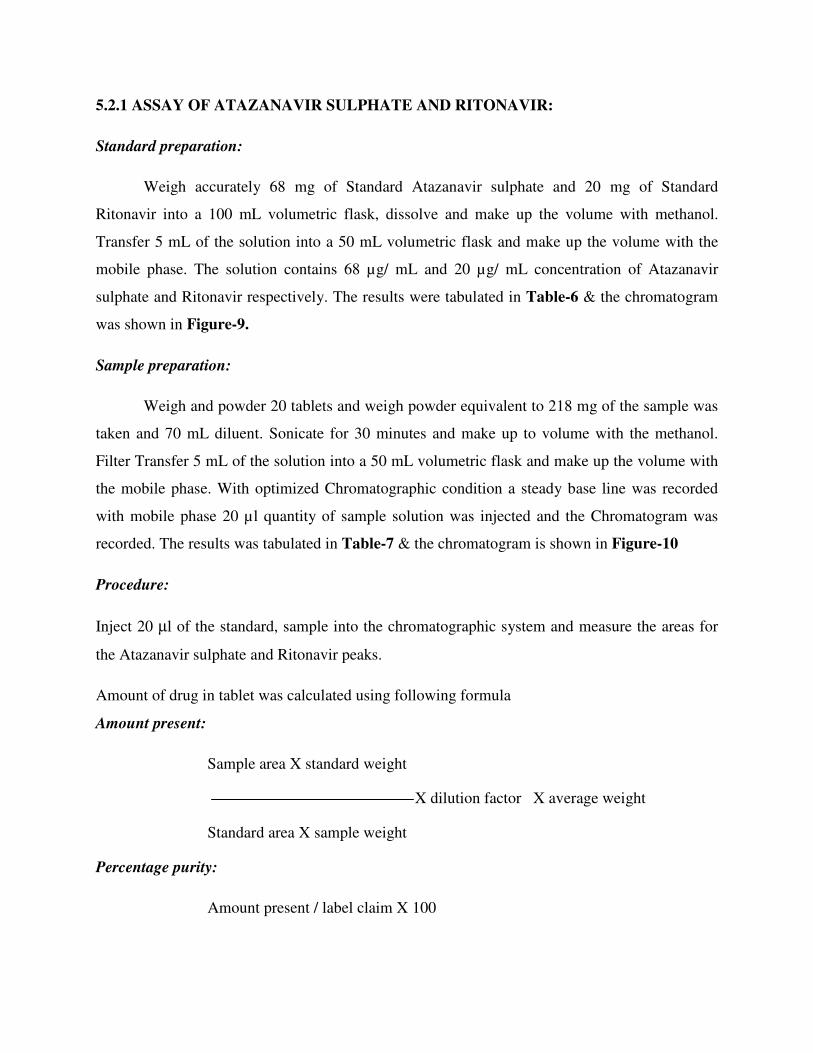
5.2.1 ASSAY OF ATAZANAVIR SULPHATE AND RITONAVIR:
Standard preparation:
Weigh accurately 68 mg of Standard Atazanavir sulphate and 20 mg of Standard
Ritonavir into a 100 mL volumetric flask, dissolve and make up the volume with methanol.
Transfer 5 mL of the solution into a 50 mL volumetric flask and make up the volume with the
mobile phase. The solution contains 68 µg/ mL and 20 µg/ mL concentration of Atazanavir
sulphate and Ritonavir respectively. The results were tabulated in Table-6 & the chromatogram
was shown in Figure-9.
Sample preparation:
Weigh and powder 20 tablets and weigh powder equivalent to 218 mg of the sample was
taken and 70 mL diluent. Sonicate for 30 minutes and make up to volume with the methanol.
Filter Transfer 5 mL of the solution into a 50 mL volumetric flask and make up the volume with
the mobile phase. With optimized Chromatographic condition a steady base line was recorded
with mobile phase 20 µl quantity of sample solution was injected and the Chromatogram was
recorded. The results was tabulated in Table-7 & the chromatogram is shown in Figure-10
Procedure:
Inject 20 µl of the standard, sample into the chromatographic system and measure the areas for
the Atazanavir sulphate and Ritonavir peaks.
Amount of drug in tablet was calculated using following formula
Amount present:
Sample area X standard weight
X dilution factor X average weight
Standard area X sample weight
Percentage purity:
Amount present / label claim X 100

5.3 METHOD VALIDATION
The chromatographic conditions were validated by evaluating linearity, accuracy, method
precision, limit of detection (LOD), limit of quantitation (LOQ), ruggedness and robustness in
accordance with ICH guidelines24
.
5.3.1 SPECIFICITY:
Specificity is the ability to measure accurately and specifically the analyte of interest in the
presence of other components that may be expected to be present in the sample matrix. It is a
measure of the degree of interference from such things as other active ingredients, excipients,
impurities, and degradation products, ensuring that a peak response is due to only to a single
component; that is, that no co-elution exists. Specificity is measured and documented in a
separation by the resolution, plate count, and tailing factor.
Preparation of solutions:
a) Placebo interference:
Sample was prepared by taking the placebo equivalent to about the weight in portion of
test preparation as per the test method and injected into the HPLC system. The chromatogram
was shown in Figure-11.
Acceptance criteria:
Chromatogram of placebo should not show any peak at the retention time of analyte
peak.
b) Blank Interference
Mobile phase was prepared as per the test method and injected and into the HPLC
system. The chromatogram was shown in Figure-12.
Acceptance criteria:
Chromatogram of blank should not show any peak at the retention time of analyte peak.

Standard preparation:
Weigh accurately 68 mg of Standard Atazanavir sulphate and 20 mg of Standard
Ritonavir into a 100 mL volumetric flask, dissolve and make up the volume with methanol.
Transfer 5 mL of the solution into a 50 mL volumetric flask and make up the volume with the
mobile phase. The solution contains 68 µg/ mL and 20 µg/ mL concentration of Atazanavir
sulphate and Ritonavir respectively. The chromatogram was shown in Figure-13-14.
5.3.2 SYSTEM SUITABILITY:
System Suitability was the checking of a system to ensure system performance before or
during the analysis of unknowns. Parameters such as plate count, tailing factor, resolution, and
reproducibility are determined and compared against the specification set for the method. These
parameters are measured during the analysis of a system suitability sample that is a mixture of
main components and expected by-product. The results was tabulated in Table-8
5.3.3 LINEARITY AND RANGE:
Preparation of stock solution:
Weigh accurately 68 mg of Atazanavir sulphate Standard and 20 mg of Ritonavir Standard
into a 100 mL volumetric flask, dissolve and make up the volume with methanol. The solution
contains 680 µg/ mL and 200 µg/ mL concentration of Atazanavir sulphate and Ritonavir
respectively.
Preparation of linearity solution (50%):
2.5 mL of stock solution was taken in 50 mL of volumetric flask dilute up to the mark with
diluent. The solution contains 34 µg/ mL and 10 µg/ mL concentration of Atazanavir sulphate
and Ritonavir respectively.
Preparation of linearity solution (80%):
4.0 mL of stock solution was taken in 50 mL of volumetric flask dilute up to the mark with
diluent.The solution contains 54 µg/ mL and 16 µg/ mL concentration of Atazanavir sulphate
and Ritonavir respectively.
Preparation of linearity solution (100%):
5.0 mL of stock solution was taken in 50 mL of volumetric flask dilute up to the mark with
diluent. The solution contains 68 µg/ mL and 20 µg/ mL concentration of Atazanavir sulphate
and Ritonavir respectively.
Preparation of linearity solution (120%):
6.0 mL of stock solution was taken in 50 mL of volumetric flask dilute up to the mark with
diluent. The solution contains 82 µg/ mL and 24 µg/ mL concentration of Atazanavir sulphate
and Ritonavir respectively.
Preparation of linearity solution (150%):
7.5 mL of stock solution was taken in 50 mL of volumetric flask dilute up to the mark with
diluent. The solution contains 102 µg/ mL and 30 µg/ mL concentration of Atazanavir sulphate
and Ritonavir respectively.
Procedure:
Each level of the above solutions was injected into the chromatographic system for five
replicate and the peak area was measured. A graph was plotted (peak area versus concentration)
and the correlation coefficient (r2) was calculated. The results were tabulated in Table 9 & the
chromatograms were shown in Figure 15-21.
5.3.4 PRECISION:
Precision was the measure of the degree of repeatability of an analytical method under
normal operation and it was normally expressed as the relative standard deviation for a
statistically number of samples. Precision should be performed at three different levels:
repeatability, intermediate precision and reproducibility.
Standard preparation:
Weigh accurately 68 mg of Standard Atazanavir sulphate and 20 mg of Standard
Ritonavir into a 100 mL volumetric flask, dissolve and make up the volume with methanol.
Transfer 5 mL of the solution into a 50 mL volumetric flask and make up the volume with the

mobile phase. The solution contains 68 µg/ mL and 20 µg/ mL concentration of Atazanavir
sulphate and Ritonavir respectively.
Sample preparation:
Weigh and powder 20 tablets and weigh powder equivalent to 218 mg of the sample was
taken and 70 mL diluent. Sonicate for 30 minutes and make up to volume with the methanol.
Filter Transfer 5 mL of the solution into a 50 mL volumetric flask and make up the volume with
the mobile phase. The results were tabulated in Table 9 & the chromatograms were shown in
Figure 22-27.
Procedure:
Six replicate Sample solutions were prepared as per the test method and injected as per the
test procedure.
5.3.5 ACCURACY:
Accuracy is the measure of exactness of an analytical method, or closeness of agreement
between the measured value and the value that is accepted either as a conventional, true value or
an accepted reference value. Accuracy is measured as the percentage of analyte recovered by
assay, spiking samples in a blind study.
Preparation of stock solution:
Weigh accurately 68 mg of Standard Atazanavir sulphate and 20 mg of Standard
Ritonavir into a 100 mL volumetric flask, dissolve and make up the volume with methanol. The
solution contains 680 µg/ mL and 200 µg/ mL concentration of Atazanavir sulphate and
Ritonavir respectively.
80% Sample preparation:
From the above stock solution 4 mL containing of Atazanavir sulphate and Ritonavir was
taken into a 50 mL volumetric flask and diluted up to the mark with diluent. The solution was
sonicated for 15 min and filtered through 0.45 µm nylon membrane filter. The above solution
were inject into the HPLC column same procedure was repeated for three replicate. The results
are tabulated in Table 11-12 & the chromatograms were shown in Figure 28-30.
100% Sample preparation:
From the above stock solution 5 mL containing of Atazanavir sulphate and Ritonavir was
taken into a 50 mL volumetric flask and diluted up to the mark with diluent. The solution was
sonicated for 15 min and filtered through 0.45 µm nylon membrane filter. The above solution
were inject into the HPLC column same procedure was repeated for three replicate. The results
are tabulated in Table 11-12 & the chromatograms were shown in Figure 31-33.
120% Sample preparation:
From the above stock solution 6 mL containing of Atazanavir sulphate and Ritonavir was
taken into a 50 mL volumetric flask and diluted up to the mark with diluent. The solution was
sonicated for 15 min and filtered through 0.45 µm nylon membrane filter. The above solution
were inject into the HPLC column same procedure was repeated for three replicate. The results
are tabulated in Table 11-12 & the chromatograms were shown in Figure 34-36.
Procedure:
The standard solution was injected in triplicate for Accuracy -80%, Accuracy -100% and
Accuracy -120% solutions.
Calculate the Amount found and Amount added for Atazanavir sulphate & Ritonavir and
calculate the individual recovery and mean recovery values.
Sample peak area x weight of standard
% Recovery = X 100
Standard peak area x weight of sample
5.3.6 INTERMEDIATE PRECISION (RUGGEDNESS):
Ruggedness is the degree of reproducibility of results obtained by the analysis of the same
sample under a variety of normal test conditions i.e. different analysts, laboratories, instruments,
reagents, assay temperatures, small variations in mobile phase, different days etc. (i.e. from
laboratory to laboratory, from analyst to analyst). Acceptance criteria for ruggedness, the % RSD
for the area of five standard injections should not be more than 2%.
Standard preparation:
Weigh accurately 68 mg of Standard Atazanavir sulphate and 20 mg of Standard
Ritonavir into a 100 mL volumetric flask, dissolve and make up the volume with methanol.
Transfer 5 mL of the solution into a 50 mL volumetric flask and make up the volume with the
mobile phase. The solution contains 68 µg/ mL and 20 µg/ mL concentration of Atazanavir
sulphate and Ritonavir respectively.
Sample preparation:
Weigh and powder 20 tablets and weigh powder equivalent to 218 mg of the sample was
taken and 70 mL diluent. Sonicate for 30 minutes and make up to volume with the methanol.
Filter Transfer 5 mL of the solution into a 50 mL volumetric flask and make up the volume with
the mobile phase. The results are tabulated in Table 13-14 & the chromatograms were
shown in Figure 37-48.
5.3.7 ROBUSTNESS:
As part of the robustness, deliberate change in the flow rate and mobile phase
composition was made to evaluate the impact on the method. The mixed standard solution is
injected in two replicate and % RSD was calculated.
Standard preparation:
Weigh accurately 68 mg of Standard Atazanavir sulphate and 20 mg of Standard
Ritonavir into a 100 mL volumetric flask, dissolve and make up the volume with methanol.
Transfer 5 mL of the solution into a 50 mL volumetric flask and make up the volume with the
mobile phase. The solution contains 68 µg/ mL and 20 µg/ mL concentration of Atazanavir

sulphate and Ritonavir respectively. The results are tabulated in Table 15-18 & the
chromatograms were shown in Figure 49-60.
5.3.8 LIMIT OF DETECTION:
The limit of detection (LOD) is defined as the lowest concentration of the analyte in a
sample that can be detected, though not necessarily quantitated. It was a limit test that specifies
whether or not an analyte is above or below a certain value. It was expressed in a concentration
at a specified signal-to-noise ratio, usually a 2- or 3-to-1 ratio. The results were tabulated
in Table 19 & the chromatogram was shown in Figure-61.
LOD= 3.3 * σ / slope
5.3.9 LIMIT OF QUANTITATION
The limit of Quantification (LOD) defined as the lowest concentration of an analyte in a
sample that can be determined with acceptable precision and accuracy under the stated
operational conditions of the method. The chromatogram was shown in Figure-62.
LOD= 10 * σ / slope

Chapter 6
RESULTS & DISCUSSIONS
6. RESULTS AND DISCUSSION
6.1 METHOD DEVELOPMENT:
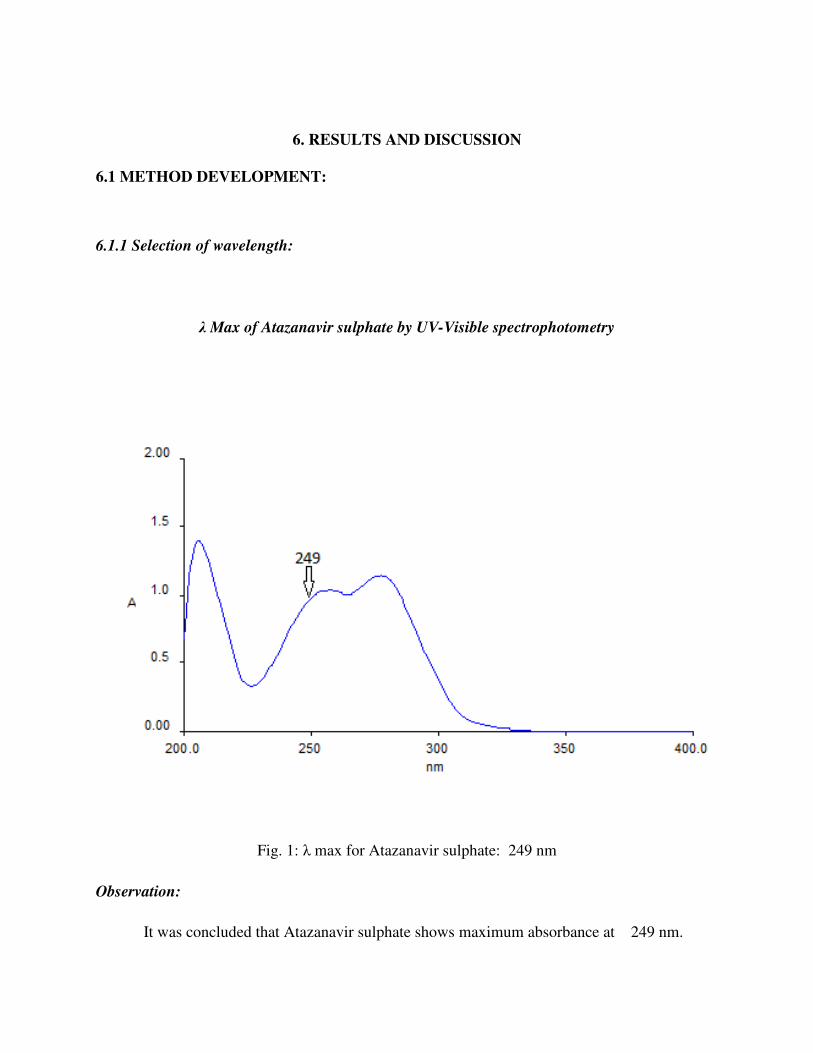
6.1.1 Selection of wavelength:
λ Max of Atazanavir sulphate by UV-Visible spectrophotometry
Fig. 1: λ max for Atazanavir sulphate: 249 nm
Observation:
It was concluded that Atazanavir sulphate shows maximum absorbance at 249 nm.
λ Max of Ritonavir by UV-Visible spectrophotometry
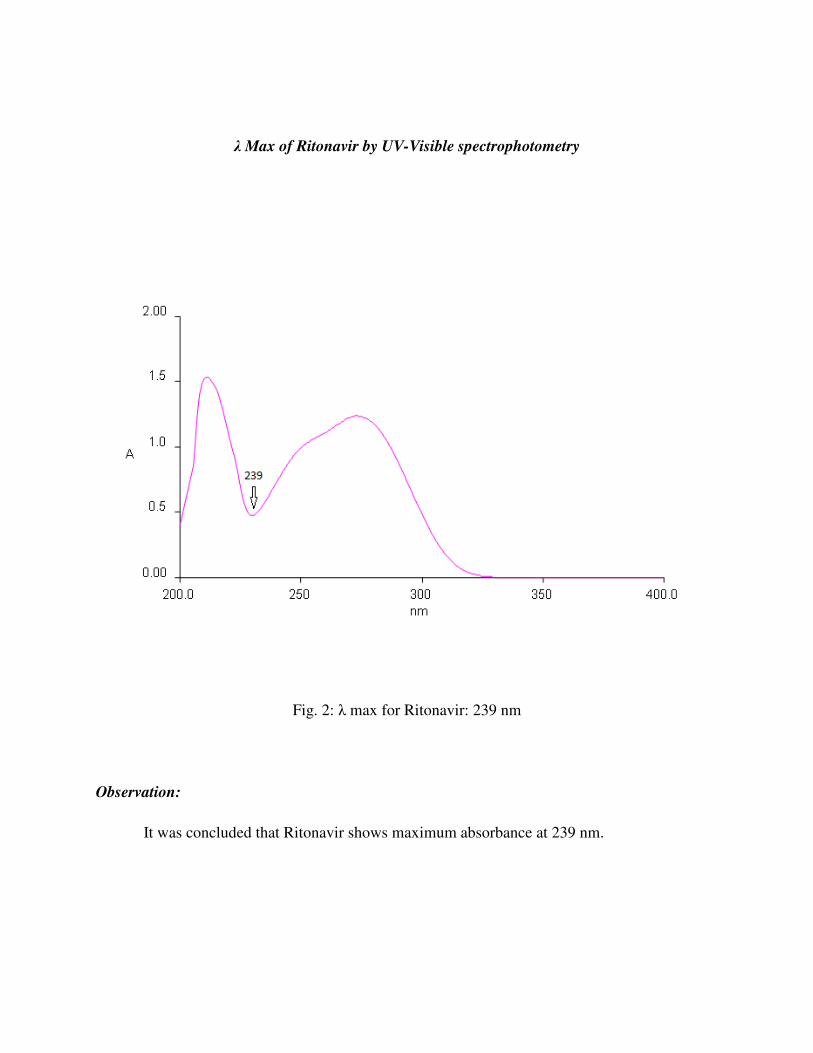
Fig. 2: λ max for Ritonavir: 239 nm
Observation:
It was concluded that Ritonavir shows maximum absorbance at 239 nm.
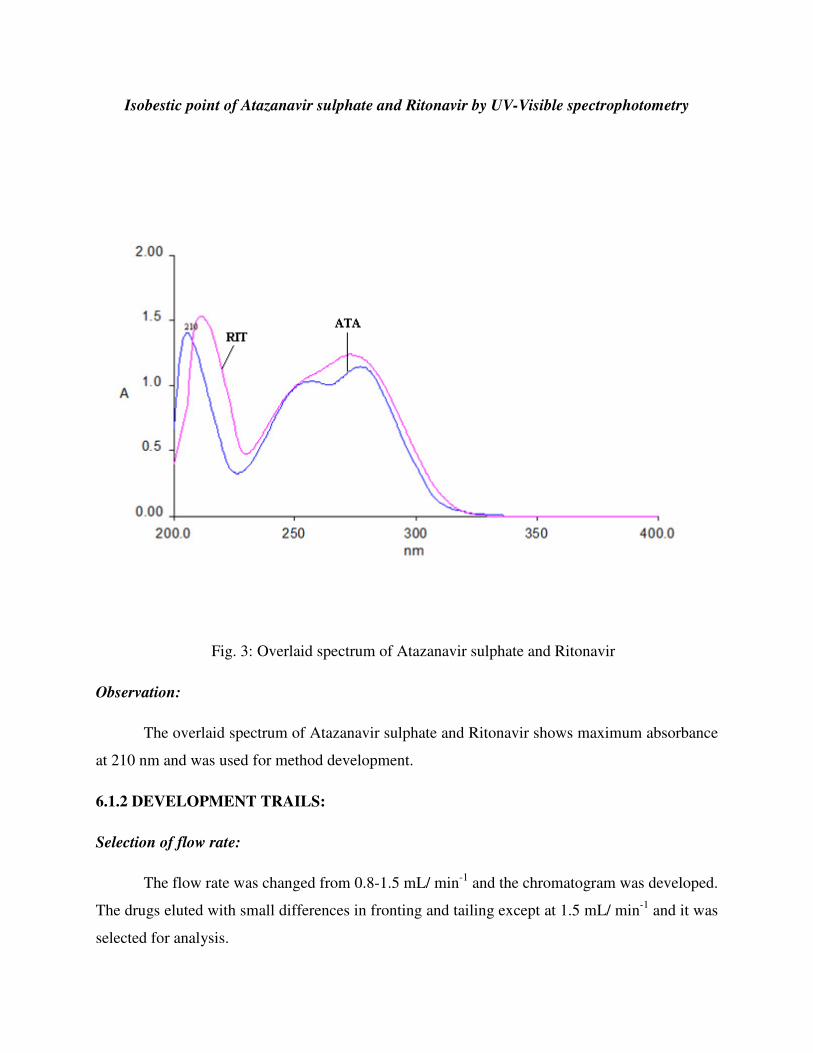
Isobestic point of Atazanavir sulphate and Ritonavir by UV-Visible spectrophotometry
Fig. 3: Overlaid spectrum of Atazanavir sulphate and Ritonavir
Observation:
The overlaid spectrum of Atazanavir sulphate and Ritonavir shows maximum absorbance
at 210 nm and was used for method development.
6.1.2 DEVELOPMENT TRAILS:
Selection of flow rate:
The flow rate was changed from 0.8-1.5 mL/ min-1
and the chromatogram was developed.
The drugs eluted with small differences in fronting and tailing except at 1.5 mL/ min-1
and it was
selected for analysis.

Trial-1
Table 1: Chromatographic condition
Parameters Description
Column Nucleodur C8 column (100 mm x 1.8 mm x 5 µm)
Mobile Phase Acetonitrile : Methanol: Phosphate buffer pH 3.0 (65:5:30)
Diluent HPLC grade methanol
Flow rate 0.8 mL min-1
Wavelength 210 nm
Injection mode Auto injector (vial)
Injection volume 20 µL
Fig. 4: Chromatogram of Atazanavir sulphate and Ritonavir
Observation:
Both Atazanavir sulphate and Ritonavir was eluted but resolution was not properly. So the
flow rate and mobile phase ratio has been changed for next trial.
0.0 5.0 10.0 15.0 20.0 25.0 min
0
250
500
mV
3.4
33
4.7
79
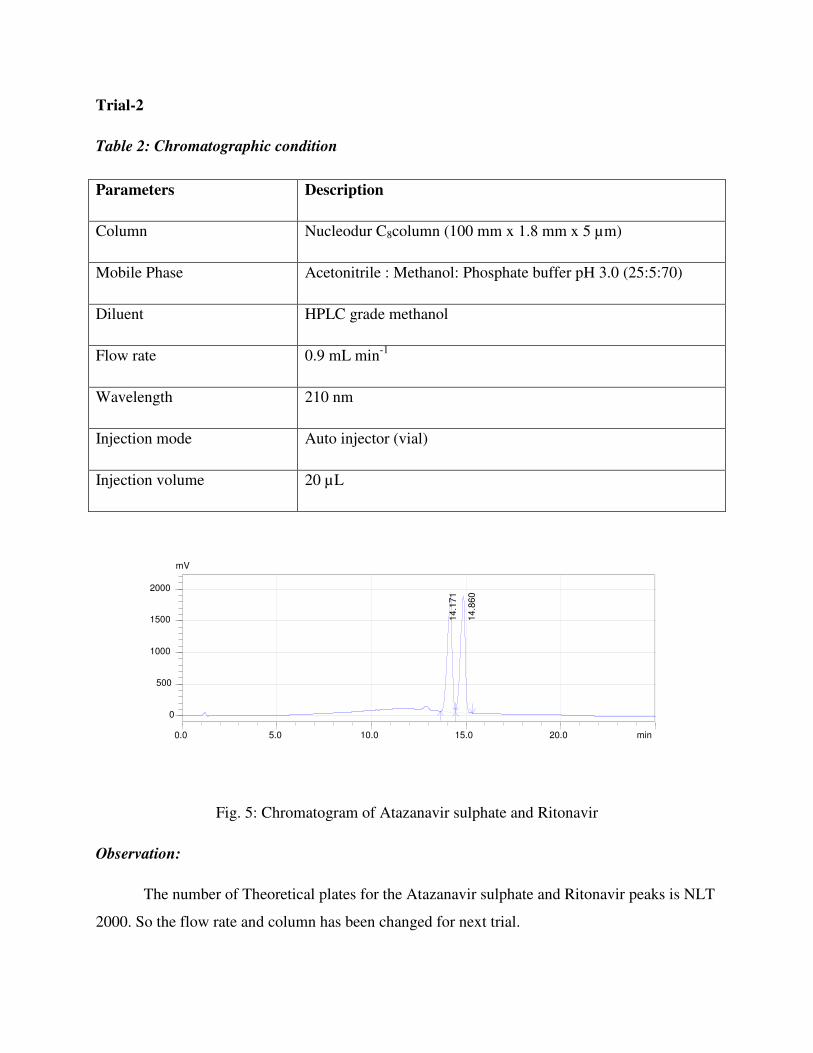
Trial-2
Table 2: Chromatographic condition
Fig. 5: Chromatogram of Atazanavir sulphate and Ritonavir
Observation:
The number of Theoretical plates for the Atazanavir sulphate and Ritonavir peaks is NLT
2000. So the flow rate and column has been changed for next trial.
Parameters Description
Column Nucleodur C8column (100 mm x 1.8 mm x 5 µm)
Mobile Phase Acetonitrile : Methanol: Phosphate buffer pH 3.0 (25:5:70)
Diluent HPLC grade methanol
Flow rate 0.9 mL min-1
Wavelength 210 nm
Injection mode Auto injector (vial)
Injection volume 20 µL
0.0 5.0 10.0 15.0 20.0 min
0
500
1000
1500
2000
mV
14.1
71
14.8
60

Trial-3
Table 3: Chromatographic condition
Parameters Description
Column Nucleodur C18column (150 mm x 4.6 mm x 5 µm)
Mobile Phase Acetonitrile : Methanol: Phosphate buffer pH 3.0 (60:10:30)
Diluent HPLC grade methanol
Flow rate 1.0 mL min-1
Wavelength 210 nm
Injection mode Auto injector (vial)
Injection volume 20 µL
Fig. 6: Chromatogram of Atazanavir sulphate and Ritonavir
Observation:
Peak broading obtain at Ritonavir. So the mobile phase ratio and flow rate has been
changed for next trial.
0.0 2.5 5.0 7.5 10.0 12.5 min
0
50
100
150
200
250
mV
2.0
20
7.0
18
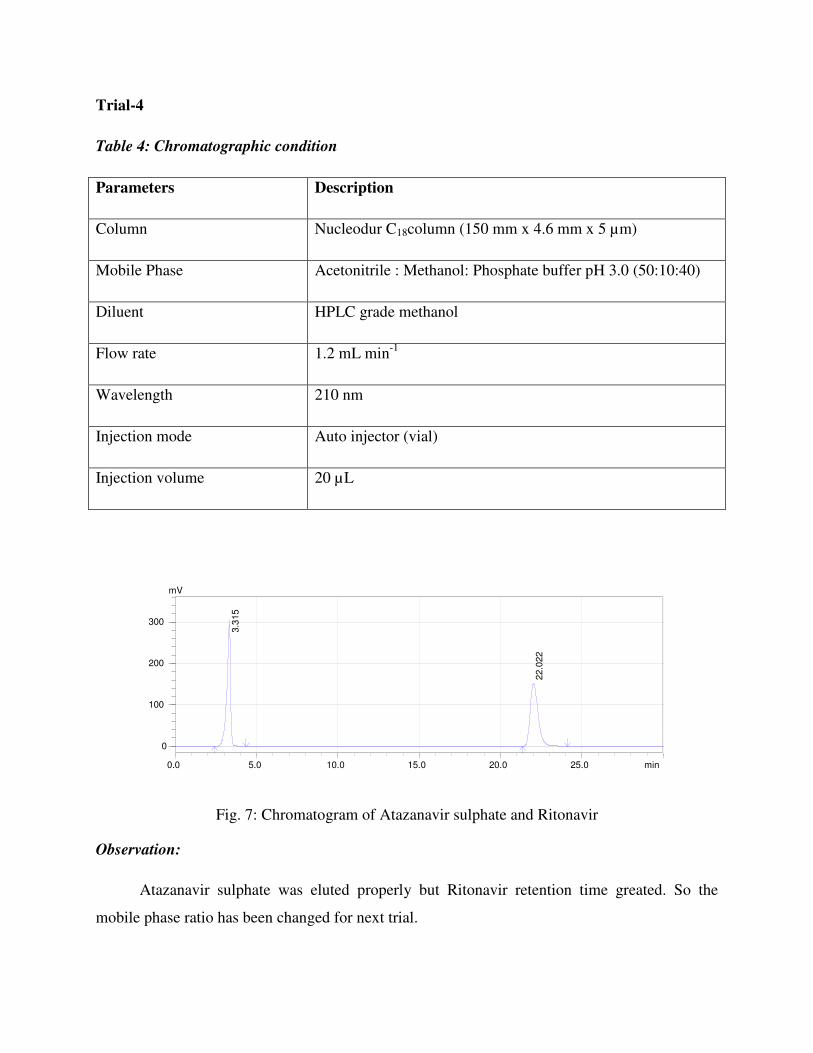
Trial-4
Table 4: Chromatographic condition
Parameters Description
Column Nucleodur C18column (150 mm x 4.6 mm x 5 µm)
Mobile Phase Acetonitrile : Methanol: Phosphate buffer pH 3.0 (50:10:40)
Diluent HPLC grade methanol
Flow rate 1.2 mL min-1
Wavelength 210 nm
Injection mode Auto injector (vial)
Injection volume 20 µL
Fig. 7: Chromatogram of Atazanavir sulphate and Ritonavir
Observation:
Atazanavir sulphate was eluted properly but Ritonavir retention time greated. So the
mobile phase ratio has been changed for next trial.
0.0 5.0 10.0 15.0 20.0 25.0 min
0
100
200
300
mV
3.3
15
22.0
22

OPTIMIZED METHOD
Table 5: Chromatographic condition
Parameters Description
Column Nucleodur C18column (150 mm x 4.6 mm x 5 µm)
Mobile Phase Acetonitrile : Methanol: Phosphate buffer pH 3.0 (44:11:45)
Diluent HPLC grade methanol
Flow rate 1.5 mL min-1
Wavelength 210 nm
Injection mode Auto injector (vial)
Injection volume 20 µL
Fig. 8: Chromatogram of Atazanavir sulphate and Ritonavir
Observation:
Resolution, theoretical plates and symmetric factor were found to be within the limit. So
this method is finalized as the optimized method.
0.0 2.5 5.0 7.5 min
0
25
50
75 mV
3.1
13
6.1
40

ASSAY:
Table 6: Assay data for standard Atazanavir sulphate and Ritonavir
Table 7: Assay data for tablets of Atazanavir sulphate and Ritonavir
Fig. 9: Standard chromatogram of Atazanavir sulphate and Ritonavir.
S.No.
Standard
Atazanavir sulphate Ritonavir
1 1970033 568671
2 1974636 560152
3 1945756 560190
Avg 1963475 560181
S.No.
Standard
Atazanavir sulphate Ritonavir
1 1972526 555272
2 1976472 555303
3 1977694 553068
Avg 1975564 554547
0.0 2.5 5.0 7.5 min
0
25
50
75 mV
3.1
13
6.1
33
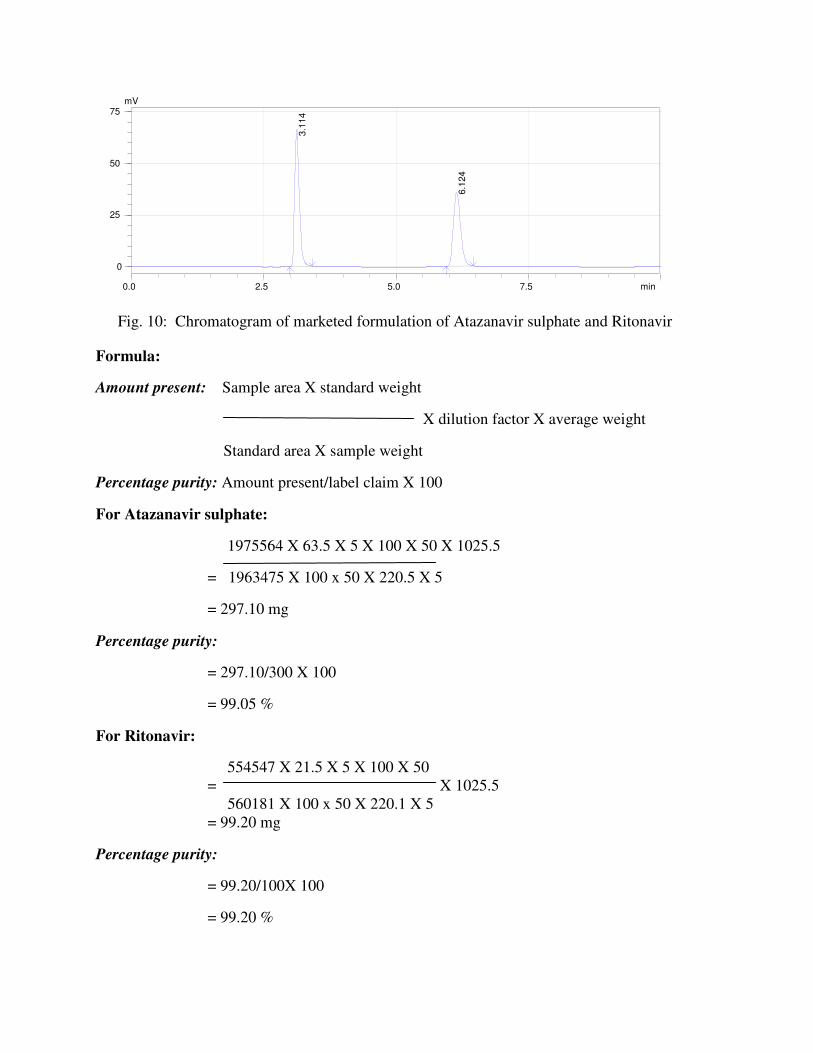
Fig. 10: Chromatogram of marketed formulation of Atazanavir sulphate and Ritonavir
Formula:
Amount present: Sample area X standard weight
X dilution factor X average weight
Standard area X sample weight
Percentage purity: Amount present/label claim X 100
For Atazanavir sulphate:
1975564 X 63.5 X 5 X 100 X 50 X 1025.5
= 1963475 X 100 x 50 X 220.5 X 5
= 297.10 mg
Percentage purity:
= 297.10/300 X 100
= 99.05 %
For Ritonavir:
554547 X 21.5 X 5 X 100 X 50
= X 1025.5
560181 X 100 x 50 X 220.1 X 5
= 99.20 mg
Percentage purity:
= 99.20/100X 100
= 99.20 %
0.0 2.5 5.0 7.5 min
0
25
50
75 mV
3.1
14
6.1
24

6.2. METHOD VALIDATION
6.2.1 SPECIFICITY:
Specificity is the ability to assess unequivalently the analyte in the presence of components,
which may be expected to be present. Typically these might include impurities, matrix, degradants
etc. It is evaluated by injecting the blank and the control sample solution prepared as per the
proposed method to check for the interference if any peak at the retention time of Atazanavir
sulphate and Ritonavir.
The specificity of the HPLC method was complete separation of Atazanavir sulphate and
Ritonavir was noticed in presence of tablet excipients. In addition there was no interference at the
retention time of Atazanavir sulphate and Ritonavir in the chromatogram of placebo solution.
Name of the solution Retention time in min
Blank No peak
Placebo No peak
Standard 3.06 and 6.18
Sample 3.13 and 6.10
Fig. 11: Chromatogram of placebo solution
0.0 2.5 5.0 7.5 min
0
25
50
75 mV
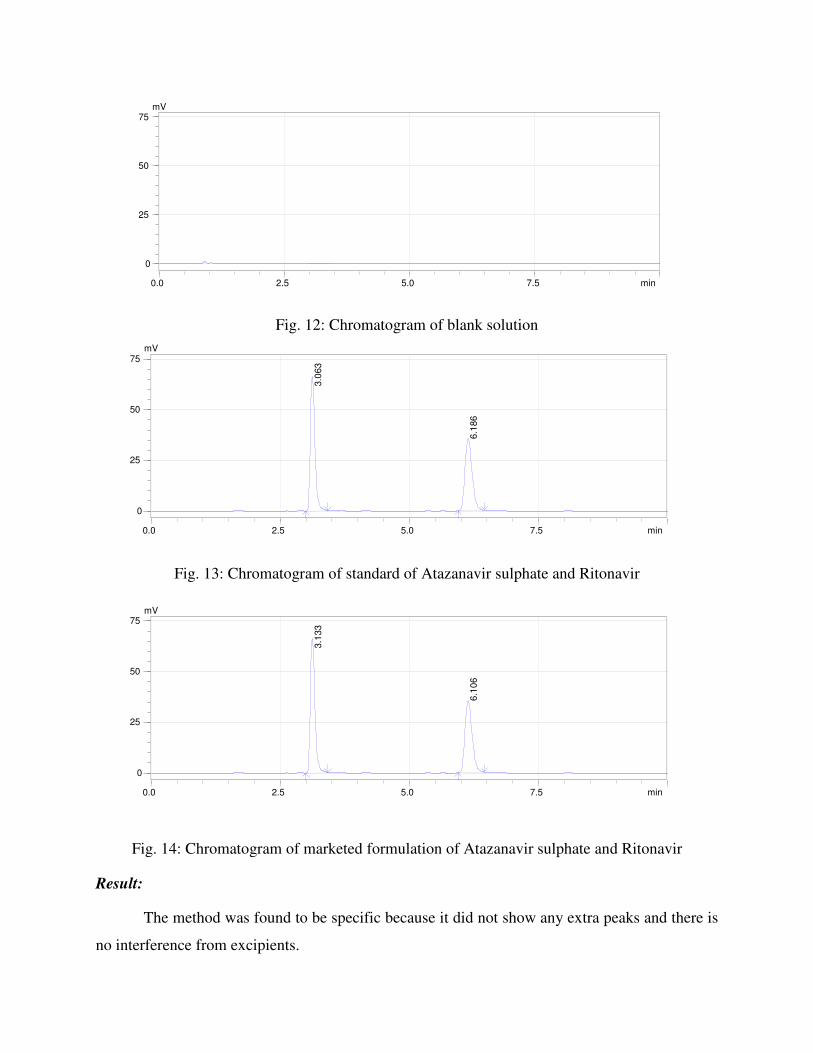
Fig. 12: Chromatogram of blank solution
Fig. 13: Chromatogram of standard of Atazanavir sulphate and Ritonavir
Fig. 14: Chromatogram of marketed formulation of Atazanavir sulphate and Ritonavir
Result:
The method was found to be specific because it did not show any extra peaks and there is
no interference from excipients.
0.0 2.5 5.0 7.5 min
0
25
50
75 mV
3.1
33
6.1
06
0.0 2.5 5.0 7.5 min
0
25
50
75 mV
3.0
63
6.1
86
0.0 2.5 5.0 7.5 min
0
25
50
75 mV
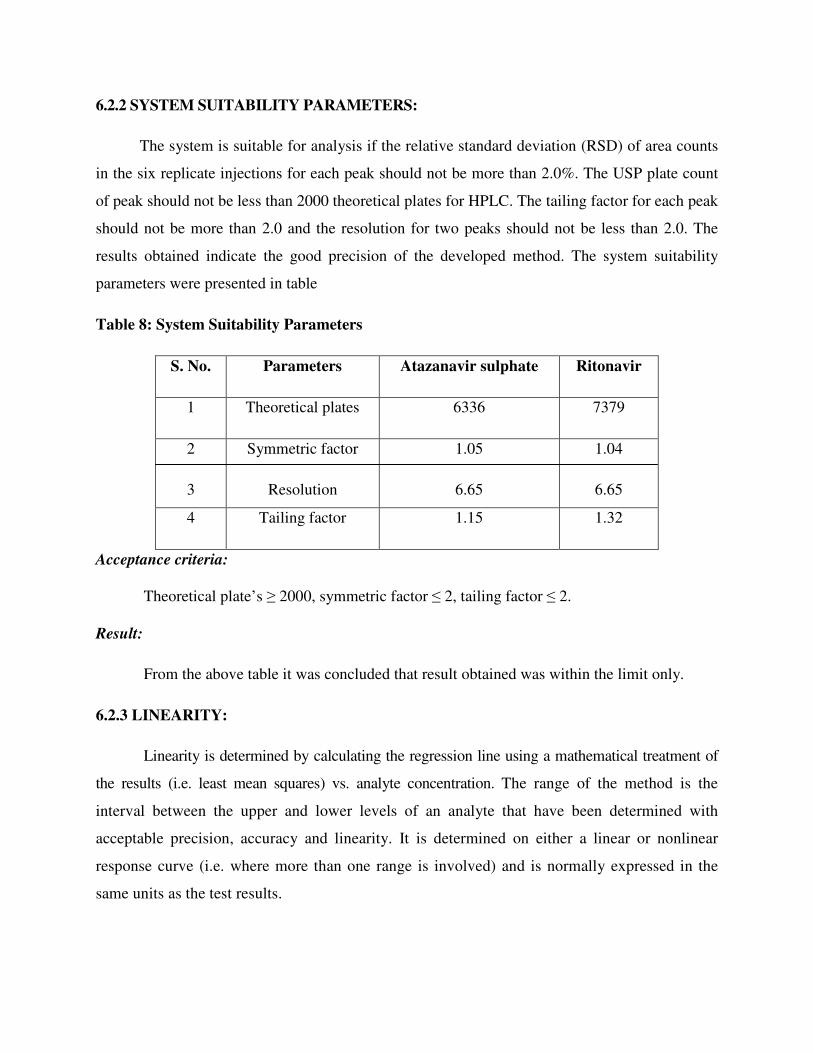
6.2.2 SYSTEM SUITABILITY PARAMETERS:
The system is suitable for analysis if the relative standard deviation (RSD) of area counts
in the six replicate injections for each peak should not be more than 2.0%. The USP plate count
of peak should not be less than 2000 theoretical plates for HPLC. The tailing factor for each peak
should not be more than 2.0 and the resolution for two peaks should not be less than 2.0. The
results obtained indicate the good precision of the developed method. The system suitability
parameters were presented in table
Table 8: System Suitability Parameters
S. No. Parameters Atazanavir sulphate Ritonavir
1 Theoretical plates 6336 7379
2
3
Symmetric factor
Resolution
1.05
6.65
1.04
6.65
4 Tailing factor 1.15 1.32
Acceptance criteria:
Theoretical plate’s ≥ 2000, symmetric factor ≤ 2, tailing factor ≤ 2.
Result:
From the above table it was concluded that result obtained was within the limit only.
6.2.3 LINEARITY:
Linearity is determined by calculating the regression line using a mathematical treatment of
the results (i.e. least mean squares) vs. analyte concentration. The range of the method is the
interval between the upper and lower levels of an analyte that have been determined with
acceptable precision, accuracy and linearity. It is determined on either a linear or nonlinear
response curve (i.e. where more than one range is involved) and is normally expressed in the
same units as the test results.

Table 9: Linearity of Atazanavir sulphate and Ritonavir
S.No. Atazanavir
Conc. (µg mL
1 34
2 54
3 68
4 82
5 102
Slope
Y-Intercept
Correlation
coefficient
Fig. 15: Calibration plot of
Atazanavir sulphate and Ritonavir
Atazanavir Ritonavir
Conc. (µg mL-1
) Peak Area Conc. (µg mL-1
)
842922 10
1310821 16
1658694 20
1996529 24
2468854 30
8221
24201
0.999
Fig. 15: Calibration plot of Atazanavir sulphate
Ritonavir
Peak Area
292661
455824
577054
691459
861146
1471
28693
0.999
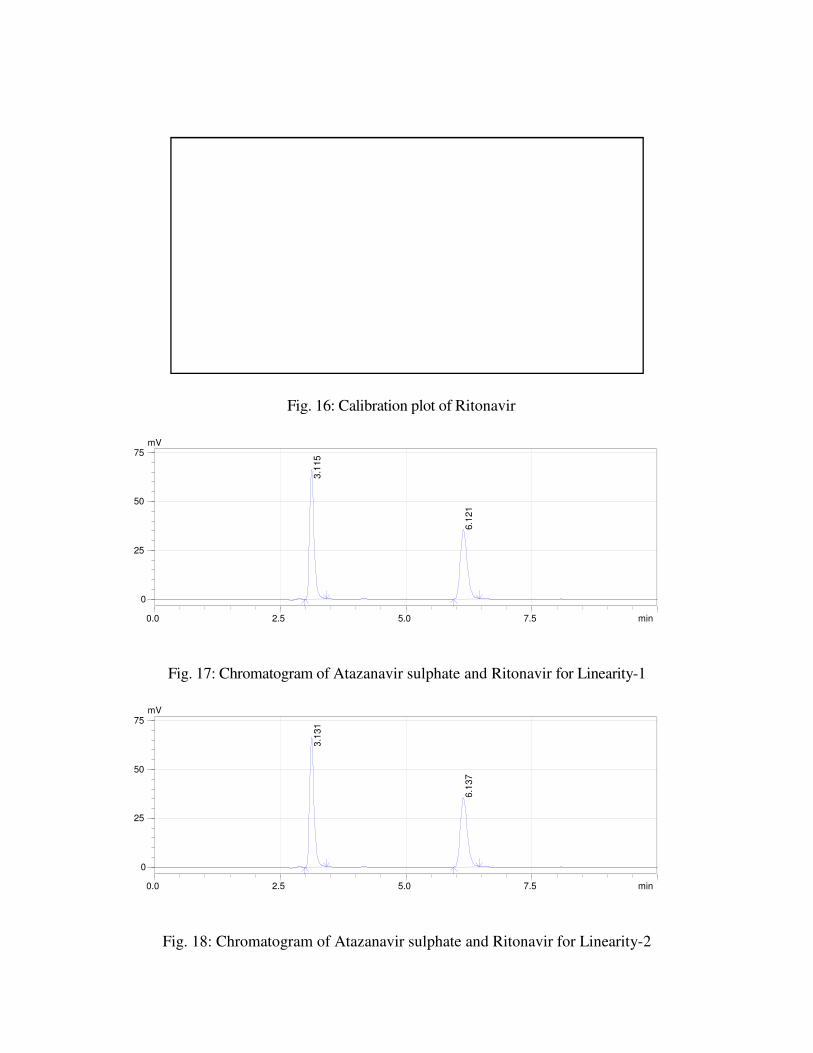
Fig. 16: Calibration plot of
Fig. 17: Chromatogram of
Fig. 18: Chromatogram of
0.0 2.5
0
25
50
75 mV
0.0 2.5
0
25
50
75 mV
Fig. 16: Calibration plot of Ritonavir
Fig. 17: Chromatogram of Atazanavir sulphate and Ritonavir for Linearity
Fig. 18: Chromatogram of Atazanavir sulphate and Ritonavir for Linearity
5.0 7.5
3.1
31
6.1
37
5.0 7.5
3.1
15
6.1
21
for Linearity-1
for Linearity-2
min
min
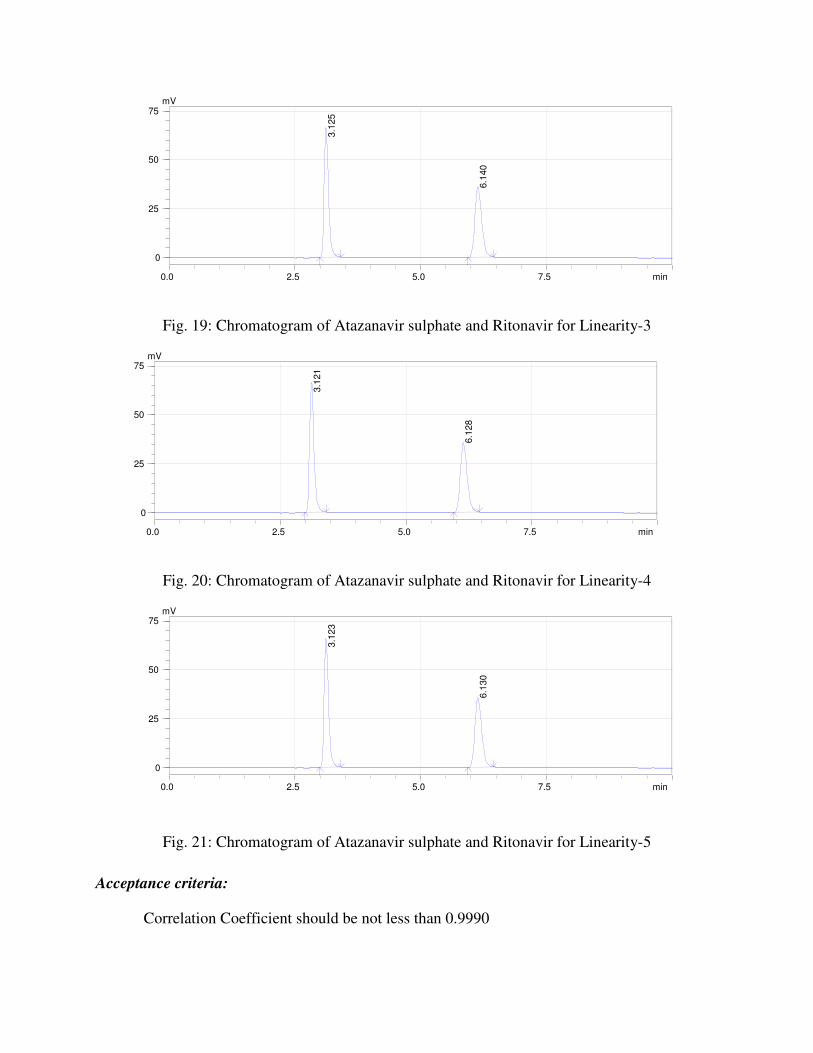
Fig. 19: Chromatogram of Atazanavir sulphate and Ritonavir for Linearity-3
Fig. 20: Chromatogram of Atazanavir sulphate and Ritonavir for Linearity-4
Fig. 21: Chromatogram of Atazanavir sulphate and Ritonavir for Linearity-5
Acceptance criteria:
Correlation Coefficient should be not less than 0.9990
0.0 2.5 5.0 7.5 min
0
25
50
75 mV
3.1
23
6.1
30
0.0 2.5 5.0 7.5 min
0
25
50
75 mV
3.1
21
6.1
28
0.0 2.5 5.0 7.5 min
0
25
50
75 mV
3.1
25
6.1
40
Result:
The relationship between the concentration of Atazanavir sulphate and Ritonavir was
linear in the specific range and the correlation coefficient was found to be within limit only. The
correlation coefficient of Atazanavir sulphate and Ritonavir was found to be 0.999 and 0.999.
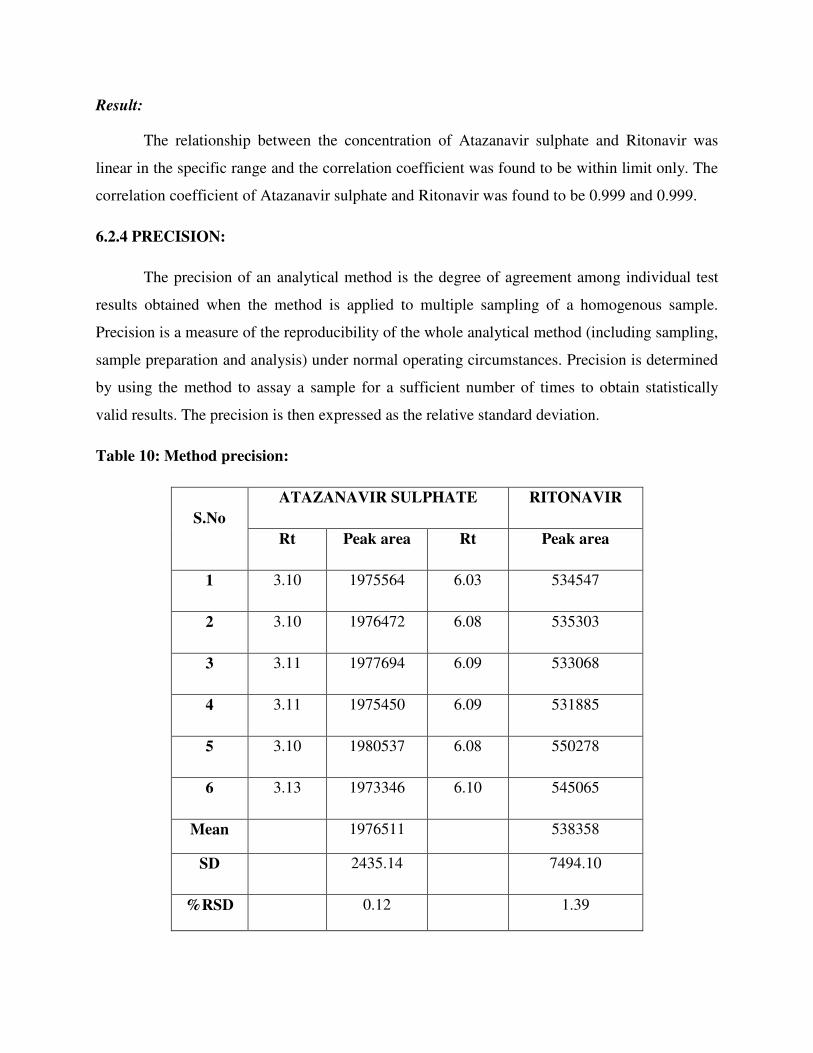
6.2.4 PRECISION:
The precision of an analytical method is the degree of agreement among individual test
results obtained when the method is applied to multiple sampling of a homogenous sample.
Precision is a measure of the reproducibility of the whole analytical method (including sampling,
sample preparation and analysis) under normal operating circumstances. Precision is determined
by using the method to assay a sample for a sufficient number of times to obtain statistically
valid results. The precision is then expressed as the relative standard deviation.
Table 10: Method precision:
S.No
ATAZANAVIR SULPHATE RITONAVIR
Rt Peak area Rt Peak area
1 3.10 1975564 6.03 534547
2 3.10 1976472 6.08 535303
3 3.11 1977694 6.09 533068
4 3.11 1975450 6.09 531885
5 3.10 1980537 6.08 550278
6 3.13 1973346 6.10 545065
Mean 1976511 538358
SD 2435.14 7494.10
%RSD 0.12 1.39
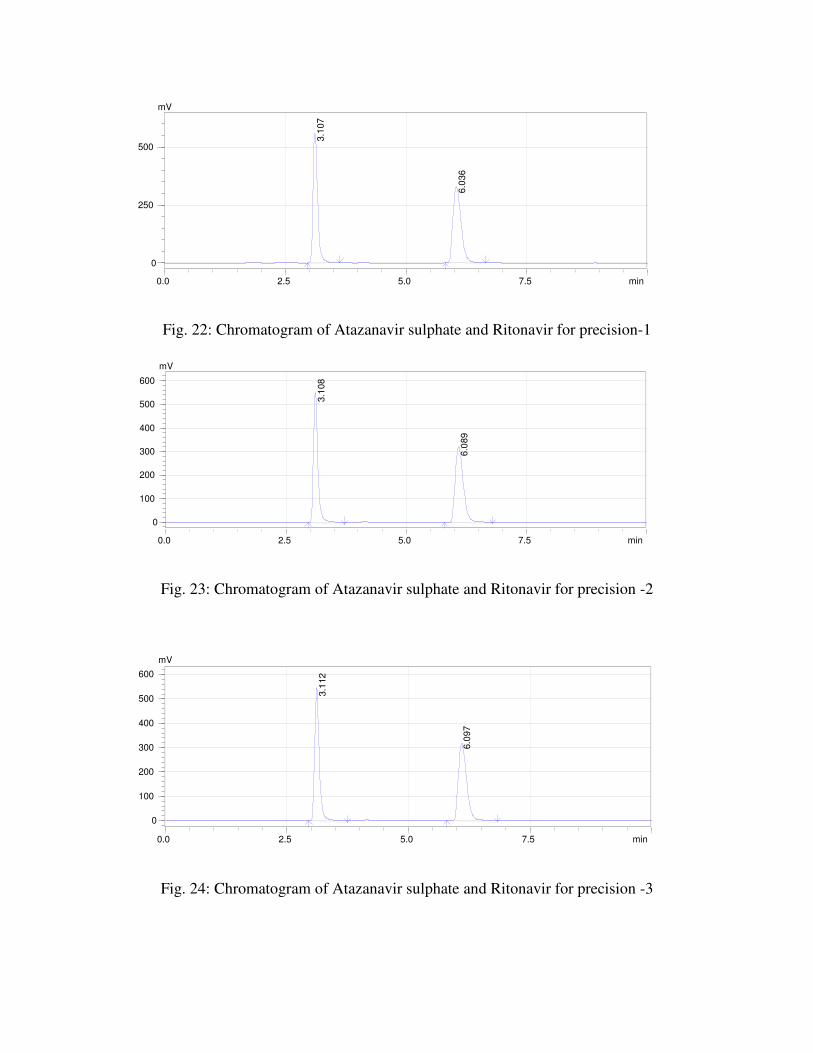
Fig. 22: Chromatogram of Atazanavir sulphate and Ritonavir for precision-1
Fig. 23: Chromatogram of Atazanavir sulphate and Ritonavir for precision -2
Fig. 24: Chromatogram of Atazanavir sulphate and Ritonavir for precision -3
0.0 2.5 5.0 7.5 min
0
100
200
300
400
500
600 mV
3.1
12
6.0
97
0.0 2.5 5.0 7.5 min
0
100
200
300
400
500
600 mV
3.1
08
6.0
89
0.0 2.5 5.0 7.5 min
0
250
500
mV
3.1
07
6.0
36

Fig. 25: Chromatogram of Atazanavir sulphate and Ritonavir for precision -4
Fig. 26: Chromatogram of Atazanavir sulphate and Ritonavir for precision -5
Fig. 27: Chromatogram of Atazanavir sulphate and Ritonavir for precision -6
Acceptance Criteria:
% RSD of the sample replicate should not be more than 2.
0.0 2.5 5.0 7.5 min
0
100
200
300
400
500
600 mV
3.1
38
6.1
04
0.0 2.5 5.0 7.5 min
0
100
200
300
400
500
600 mV
3.1
08
6.0
84
0.0 2.5 5.0 7.5 min
0
100
200
300
400
500
600 mV
3.1
10
6.0
91

Result:
The % RSD for Atazanavir sulphate and Ritonavir it was found to be 0.12 and 1.39 in
AUC, respectively. The % RSD value indicates a good degree of precision within the specified
range.
6.2.5 ACCURACY:
Accuracy is a measure of the closeness of test results obtained by a method to the true
value. Accuracy indicates the deviation between the mean value found and the true value. It is
determined by applying the method to samples to which known amounts of analyte have been
added. These should be analyzed against standard and blank solutions to ensure that no
interference exists. The accuracy is then calculated from the test results as a percentage of the
analyte recovered by the assay.
Table-11: Accuracy for Atazanavir Sulphate
AMOUNT
OF SPIKED Peak Area
Amount of
added
(mg)
Amount
recovered
(mg)
% Recovery Average
recovery
%
RSD
80%
1559712 240.59 240.31 99.88
100.01
0.17
1566912 239.49 239.80 100.13
1563075 239.69 240.48 100.33
100%
1986505 299.88 301.13 100.42
100.40
0.31
1979715 299.29 299.53 100.08
1986012 299.98 302.06 100.69
120%
2316272 361.70 360.71 99.73
99.91
0.24
2317572 358.92 359.51 100.16
2327359 362.01 361.38 99.83
Table-12: Accuracy for Ritonavir
AMOUNT OF
SPIKED
Peak
Area
Amount of
added
(mg)
Amount
recovered
(mg)
% Recovery Average
recovery
%
RSD
80%
422000 79.51 79.51 100.00
100.31
0.27
423557 78.88 79.27 100.49
423937 79.41 79.76 100.43
100%
541035 100.04 100.29 100.25
100.12
0.61
539736 100.23 99.86 99.63
542332 100.38 100.87 100.49
120%
629877 120.49 119.95 99.55
100.31
0.29
632736 119.46 120.03 100.48
635575 119.61 120.68 100.89
Fig. 28: Chromatogram of Atazanavir sulphate and Ritonavir for 80%spiking-1
0.0 2.5 5.0 7.5 min
0
25
50
75 mV
3.1
12
6.1
15

Fig. 29: Chromatogram of Atazanavir sulphate and Ritonavir for 80% spiking-2
Fig. 30: Chromatogram of Atazanavir sulphate and Ritonavir for 80%spiking-3
Fig. 31: Chromatogram of Atazanavir sulphate and Ritonavir for 100% spiking-1
0.0 2.5 5.0 7.5 min
0
25
50
75 mV
3.1
17
6.1
25
0.0 2.5 5.0 7.5 min
0
25
50
75 mV
3.1
14
6.1
16
0.0 2.5 5.0 7.5 min
0
25
50
75 mV
3.1
14
6.1
24

Fig. 32: Chromatogram of Atazanavir sulphate and Ritonavir for 100% spiking-2
Fig. 33: Chromatogram of Atazanavir sulphate and Ritonavir for 100% spiking-3
Fig. 34: Chromatogram of Atazanavir sulphate and Ritonavir for 120% spiking-1
0.0 2.5 5.0 7.5 min
0
25
50
75
mV
3.1
16
6.1
04
0.0 2.5 5.0 7.5 min
0
25
50
75 mV
3.1
15
6.1
16
0.0 2.5 5.0 7.5 min
0
25
50
75 mV
3.1
16
6.1
10

Fig. 35: Chromatogram of Atazanavir sulphate and Ritonavir for 120% spiking-2
Fig. 36: Chromatogram of Atazanavir sulphate and Ritonavir for 120% spiking-3
Acceptance criteria:
The mean percentage recovery of the Atazanavir sulphate and Ritonavir at each spike
level should be not less than 98.0% and not more than 102.0%.
Result:
From the Accuracy table it was found that % Recovery of the drug was found to be in the
range of 99.91-100.40 % and 100.12-100.31 % for Atazanavir sulphate and Ritonavir
respectively. This indicates that the method was accurate.
0.0 2.5 5.0 7.5 min
0
25
50
75
mV
3.1
16
6.1
05
0.0 2.5 5.0 7.5 min
0
25
50
75
mV
3.1
17
6.0
95
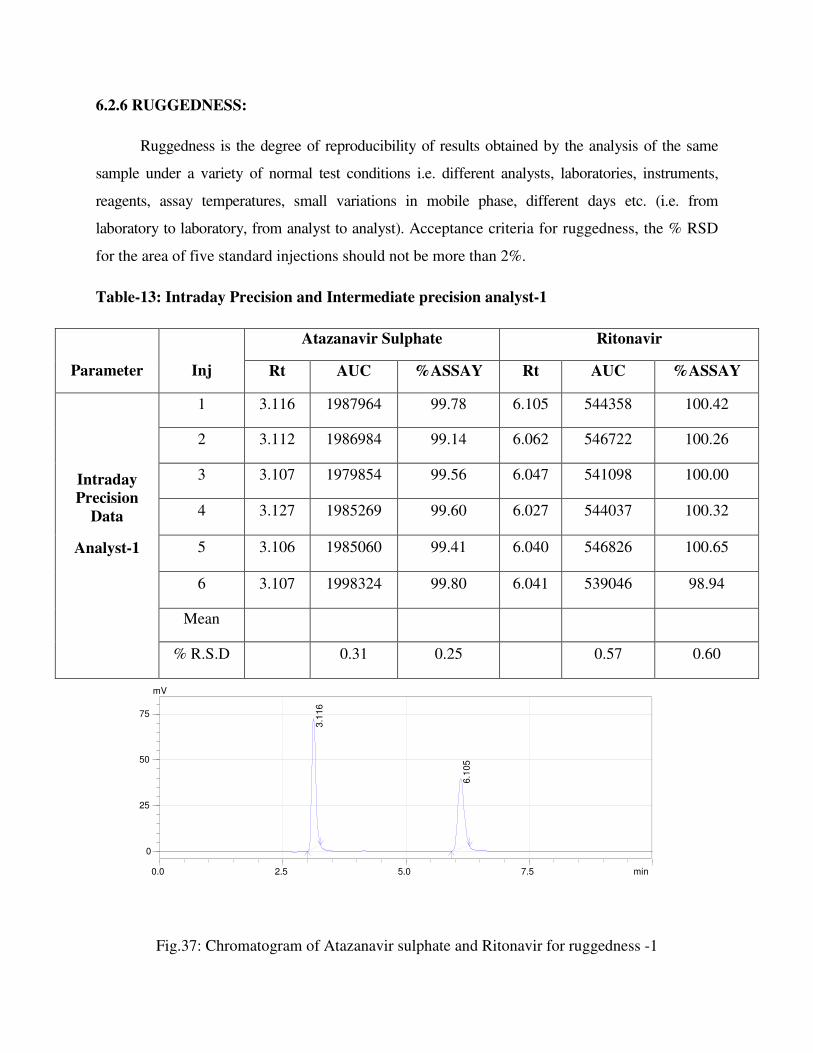
6.2.6 RUGGEDNESS:
Ruggedness is the degree of reproducibility of results obtained by the analysis of the same
sample under a variety of normal test conditions i.e. different analysts, laboratories, instruments,
reagents, assay temperatures, small variations in mobile phase, different days etc. (i.e. from
laboratory to laboratory, from analyst to analyst). Acceptance criteria for ruggedness, the % RSD
for the area of five standard injections should not be more than 2%.
Table-13: Intraday Precision and Intermediate precision analyst-1
Parameter
Inj
Atazanavir Sulphate Ritonavir
Rt AUC %ASSAY Rt AUC %ASSAY
Intraday
Precision
Data
Analyst-1
1 3.116 1987964 99.78 6.105 544358 100.42
2 3.112 1986984 99.14 6.062 546722 100.26
3 3.107 1979854 99.56 6.047 541098 100.00
4 3.127 1985269 99.60 6.027 544037 100.32
5 3.106 1985060 99.41 6.040 546826 100.65
6 3.107 1998324 99.80 6.041 539046 98.94
Mean
1987242
99.55
543681
100.10 % R.S.D 0.31 0.25 0.57 0.60
Fig.37: Chromatogram of Atazanavir sulphate and Ritonavir for ruggedness -1
0.0 2.5 5.0 7.5 min
0
25
50
75
mV
3.1
16
6.1
05
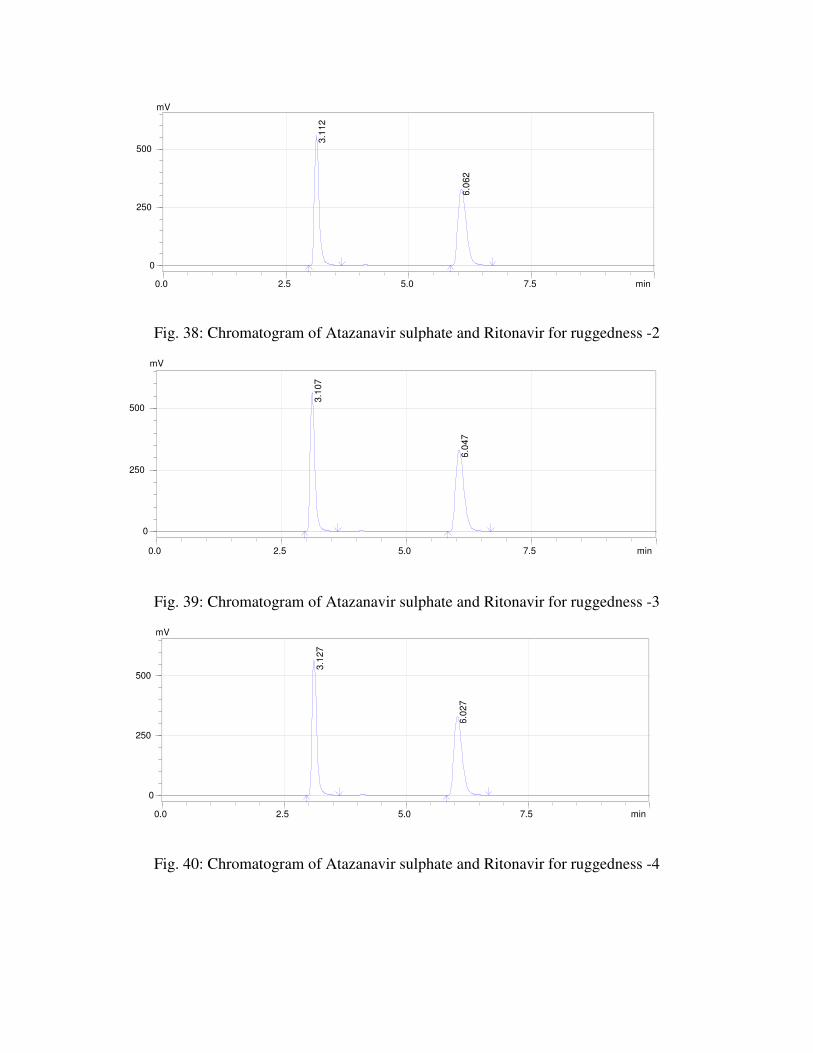
Fig. 38: Chromatogram of Atazanavir sulphate and Ritonavir for ruggedness -2
Fig. 39: Chromatogram of Atazanavir sulphate and Ritonavir for ruggedness -3
Fig. 40: Chromatogram of Atazanavir sulphate and Ritonavir for ruggedness -4
0.0 2.5 5.0 7.5 min
0
250
500
mV
3.1
27
6.0
27
0.0 2.5 5.0 7.5 min
0
250
500
mV
3.1
07
6.0
47
0.0 2.5 5.0 7.5 min
0
250
500
mV
3.1
12
6.0
62

Fig. 41: Chromatogram of Atazanavir sulphate and Ritonavir for ruggedness -5
Fig. 42: Chromatogram of Atazanavir sulphate and Ritonavir for ruggedness -6
Table-14: Intermediate precision analyst-2
Parameter
Inj
Atazanavir Sulphate Ritonavir
Rt AUC %ASSAY Rt AUC %ASSAY
Intraday
Precision
Data
Analyst-2
1 3.015 1993291 100.05 6.125 542741 100.12
2 3.012 1988365 99.21 6.121 543104 99.60
3 3.112 1986281 99.88 6.101 549121 101.49
4 3.001 1996202 100.15 6.031 547160 100.89
5 3.006 1974107 98.86 6.141 545397 100.38
6 3.017 1997980 99.78 6.121 547218 100.44
Mean
% R.S.D 0.44 0.51 0.46 0.64
0.0 2.5 5.0 7.5 min
0
250
500
mV
3.1
31
6.0
17
0.0 2.5 5.0 7.5 min
0
250
500
mV
3.1
37
6.1
27
Fig.43: Chromatogram of Atazanavir sulphate and Ritonavir for ruggedness -1
Fig. 44: Chromatogram of Atazanavir sulphate and Ritonavir for ruggedness -2
Fig. 45: Chromatogram of Atazanavir sulphate and Ritonavir for ruggedness -3
0.0 2.5 5.0 7.5 min
0
250
500
mV
3.1
12
6.1
01
0.0 2.5 5.0 7.5 min
0
250
500
mV
3.0
12
6.1
21
0.0 2.5 5.0 7.5 min
0
25
50
75
mV
3.0
15
6.1
25
Fig. 46: Chromatogram of Atazanavir sulphate and Ritonavir for ruggedness -4
Fig. 47: Chromatogram of Atazanavir sulphate and Ritonavir for ruggedness -5
Fig. 48: Chromatogram of Atazanavir sulphate and Ritonavir for ruggedness -6
0.0 2.5 5.0 7.5 min
0
250
500
mV
3.1
01
6.0
28
0.0 2.5 5.0 7.5 min
0
250
500
mV
3.0
11
6.0
21
0.0 2.5 5.0 7.5 min
0
250
500
mV
3.0
01
6.0
31
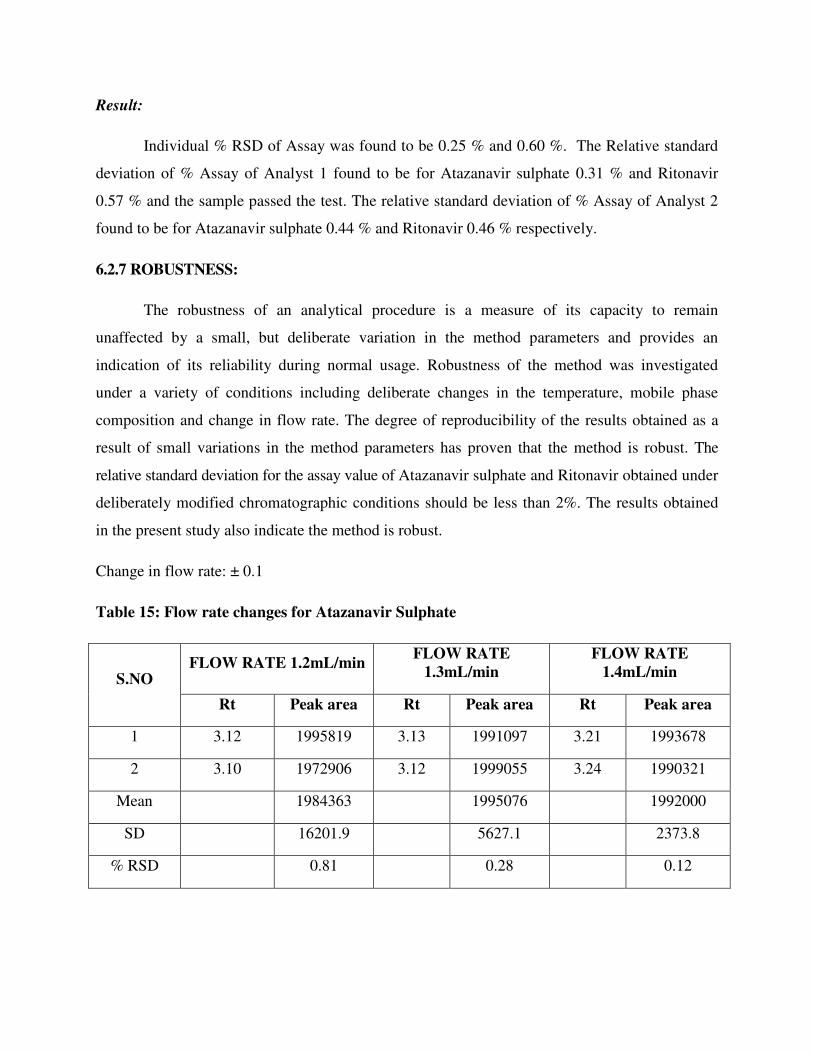
Result:
Individual % RSD of Assay was found to be 0.25 % and 0.60 %. The Relative standard
deviation of % Assay of Analyst 1 found to be for Atazanavir sulphate 0.31 % and Ritonavir
0.57 % and the sample passed the test. The relative standard deviation of % Assay of Analyst 2
found to be for Atazanavir sulphate 0.44 % and Ritonavir 0.46 % respectively.
6.2.7 ROBUSTNESS:
The robustness of an analytical procedure is a measure of its capacity to remain
unaffected by a small, but deliberate variation in the method parameters and provides an
indication of its reliability during normal usage. Robustness of the method was investigated
under a variety of conditions including deliberate changes in the temperature, mobile phase
composition and change in flow rate. The degree of reproducibility of the results obtained as a
result of small variations in the method parameters has proven that the method is robust. The
relative standard deviation for the assay value of Atazanavir sulphate and Ritonavir obtained under
deliberately modified chromatographic conditions should be less than 2%. The results obtained
in the present study also indicate the method is robust.
Change in flow rate: ± 0.1
Table 15: Flow rate changes for Atazanavir Sulphate
S.NO FLOW RATE 1.2mL/min
FLOW RATE
1.3mL/min
FLOW RATE
1.4mL/min
Rt Peak area Rt Peak area Rt Peak area
1 3.12 1995819 3.13 1991097 3.21 1993678
2 3.10 1972906 3.12 1999055 3.24 1990321
Mean 1984363 1995076 1992000
SD 16201.9 5627.1 2373.8
% RSD 0.81 0.28 0.12

Table 16: Flow rate changes for Ritonavir
S.NO FLOW RATE 1.2mL/min
FLOW RATE
1.3mL/min
FLOW RATE
1.4mL/min
Rt Peak area Rt Peak area Rt Peak area
1 6.13 542654 6.14 559592 6.23 551280
2 6.13 543459 6.13 556273 6.24 550695
Mean 543056 559432 550988
SD 569.2 225.5 413.7
% RSD 0.10 0.04 0.07
Fig. 49: Flow rate changes (Flow rate 1.2mL)
Fig. 50: Flow rate changes (Flow rate 1.2mL)
0.0 2.5 5.0 7.5 min
0
25
50
75 mV
3.1
03
6.1
31
0.0 2.5 5.0 7.5 min
0
25
50
75 mV
3.1
23
6.1
30
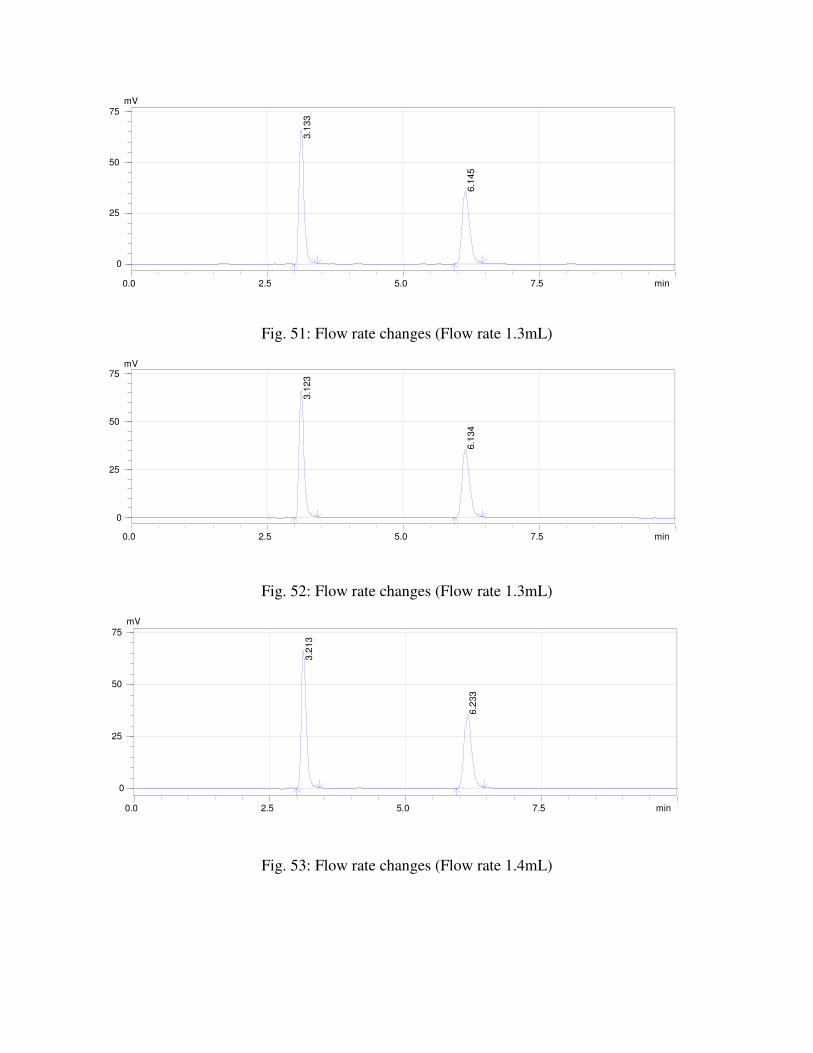
Fig. 51: Flow rate changes (Flow rate 1.3mL)
Fig. 52: Flow rate changes (Flow rate 1.3mL)
Fig. 53: Flow rate changes (Flow rate 1.4mL)
0.0 2.5 5.0 7.5 min
0
25
50
75 mV
3.2
13
6.2
33
0.0 2.5 5.0 7.5 min
0
25
50
75 mV
3.1
23
6.1
34
0.0 2.5 5.0 7.5 min
0
25
50
75 mV
3.1
33
6.1
45
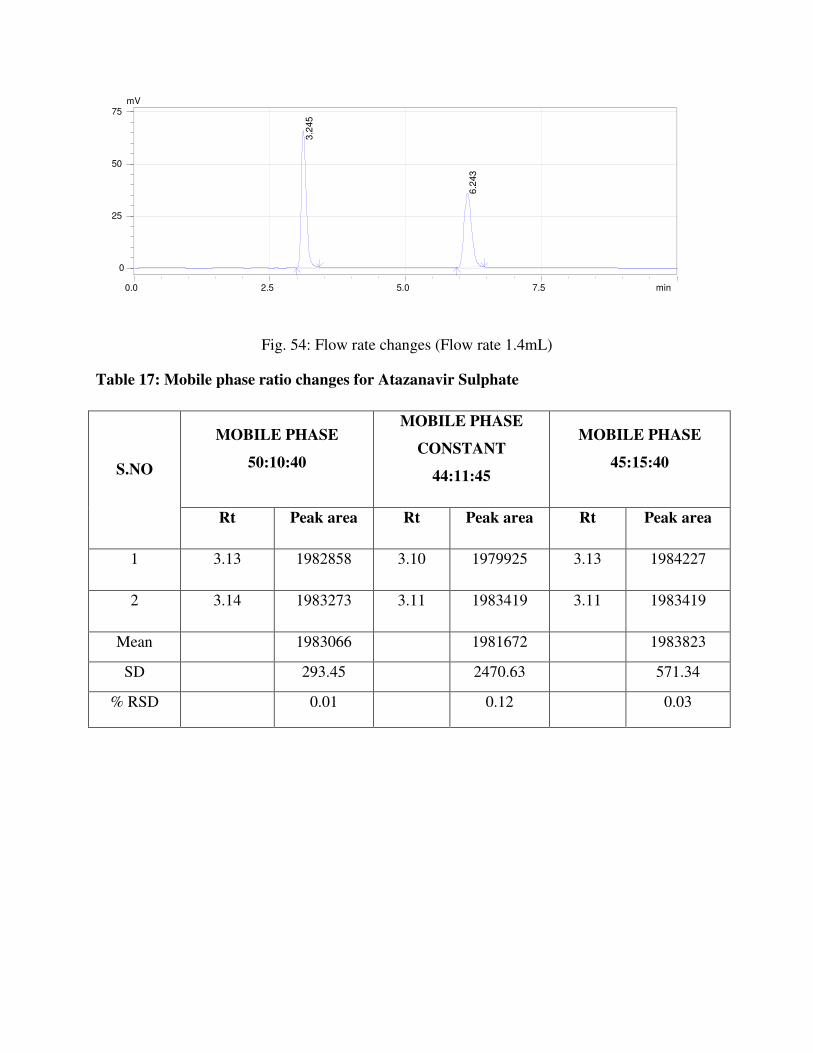
Fig. 54: Flow rate changes (Flow rate 1.4mL)
Table 17: Mobile phase ratio changes for Atazanavir Sulphate
S.NO
MOBILE PHASE
50:10:40
MOBILE PHASE
CONSTANT
44:11:45
MOBILE PHASE
45:15:40
Rt Peak area Rt Peak area Rt Peak area
1 3.13 1982858 3.10 1979925 3.13 1984227
2 3.14 1983273 3.11 1983419 3.11 1983419
Mean 1983066 1981672 1983823
SD 293.45 2470.63 571.34
% RSD 0.01 0.12 0.03
0.0 2.5 5.0 7.5 min
0
25
50
75 mV
3.2
45
6.2
43

Table 18: Mobile phase ratio changes for Ritonavir
S.NO
MOBILE PHASE
50:10:40
MOBILE PHASE
CONSTANT
44:11:45
MOBILE PHASE
45:15:40
Rt Peak area Rt Peak area Rt Peak area
1 6.15 549370 6.13 541350 6.14 543884
2 6.18 542393 6.13 543884 6.13 549614
Mean 545882 542617 546749
SD 4933.48 1791.81 4051.72
% RSD 0.90 0.33 0.74
Fig. 55: Mobile phase ratio changes (ACN 50: Methanol 10: Buffer 40)
0.0 2.5 5.0 7.5 min
0
25
50
75 mV
3.1
33
6.1
53

Fig. 56: Mobile phase ratio changes (ACN 50: Methanol 10: Buffer 40)
Fig. 57: Mobile phase ratio changes (ACN 44: Methanol 11: Buffer 45)
Fig. 58: Mobile phase ratio changes (ACN 44: Methanol 11: Buffer 45)
0.0 2.5 5.0 7.5 min
0
25
50
75 mV
3.1
17
6.1
38
0.0 2.5 5.0 7.5 min
0
25
50
75 mV
3.1
03
6.1
30
0.0 2.5 5.0 7.5 min
0
25
50
75 mV
3.1
43
6.1
83

Fig. 59: Mobile phase ratio changes (ACN 45: Methanol 15: Buffer 40)
Fig. 60: Mobile phase ratio changes (ACN 45: Methanol 15: Buffer 40)
Result:
When flow rate was altered RT has no changed significantly, when mobile phase was
altered there was no change in the RT significantly. The method was found to be robust as per
ICH Guidelines.
6.2.8 LIMIT OF DETECTION (LOD) AND LIMIT OF QUANTITATION (LOQ):
LOD and LOQ were calculated by using instrumental method.
� Limit of Detection for Atazanavir sulphate = 0.0023µg mL-1
� Limit of Quantitation for Atazanavir sulphate = 0.0161µg mL-1
� Limit of Detection for Ritonavir = 0.0006µg mL-1
� Limit of Quantitation for Ritonavir = 0.0047µg mL-1
0.0 2.5 5.0 7.5 min
0
25
50
75 mV
3.1
17
6.1
38
0.0 2.5 5.0 7.5 min
0
25
50
75 mV
3.1
32
6.1
48
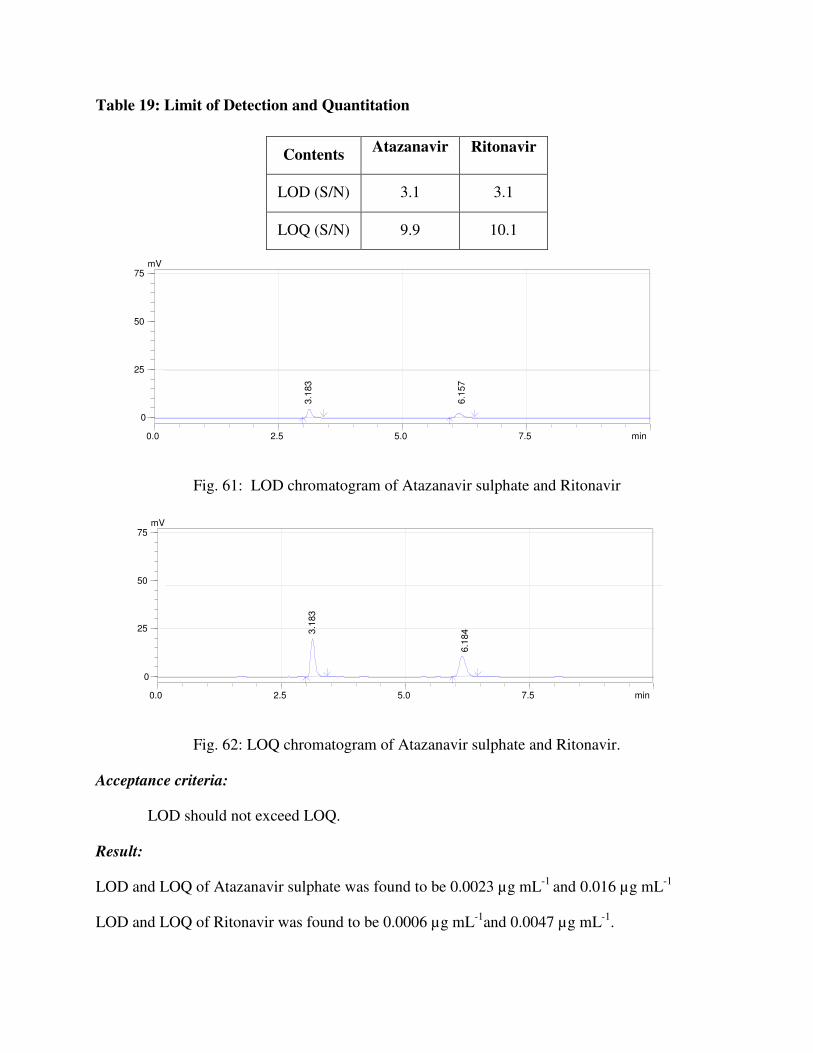
Table 19: Limit of Detection and Quantitation
Contents Atazanavir Ritonavir
LOD (S/N) 3.1 3.1
LOQ (S/N) 9.9 10.1
Fig. 61: LOD chromatogram of Atazanavir sulphate and Ritonavir
Fig. 62: LOQ chromatogram of Atazanavir sulphate and Ritonavir.
Acceptance criteria:
LOD should not exceed LOQ.
Result:
LOD and LOQ of Atazanavir sulphate was found to be 0.0023 µg mL-1
and 0.016 µg mL-1
LOD and LOQ of Ritonavir was found to be 0.0006 µg mL-1
and 0.0047 µg mL-1
.
0.0 2.5 5.0 7.5 min
0
25
50
75 mV
3.1
83
6.1
84
0.0 2.5 5.0 7.5 min
0
25
50
75 mV
3.1
83
6.1
57

Chapter 7
SUMMARY & CONCLUSIONS
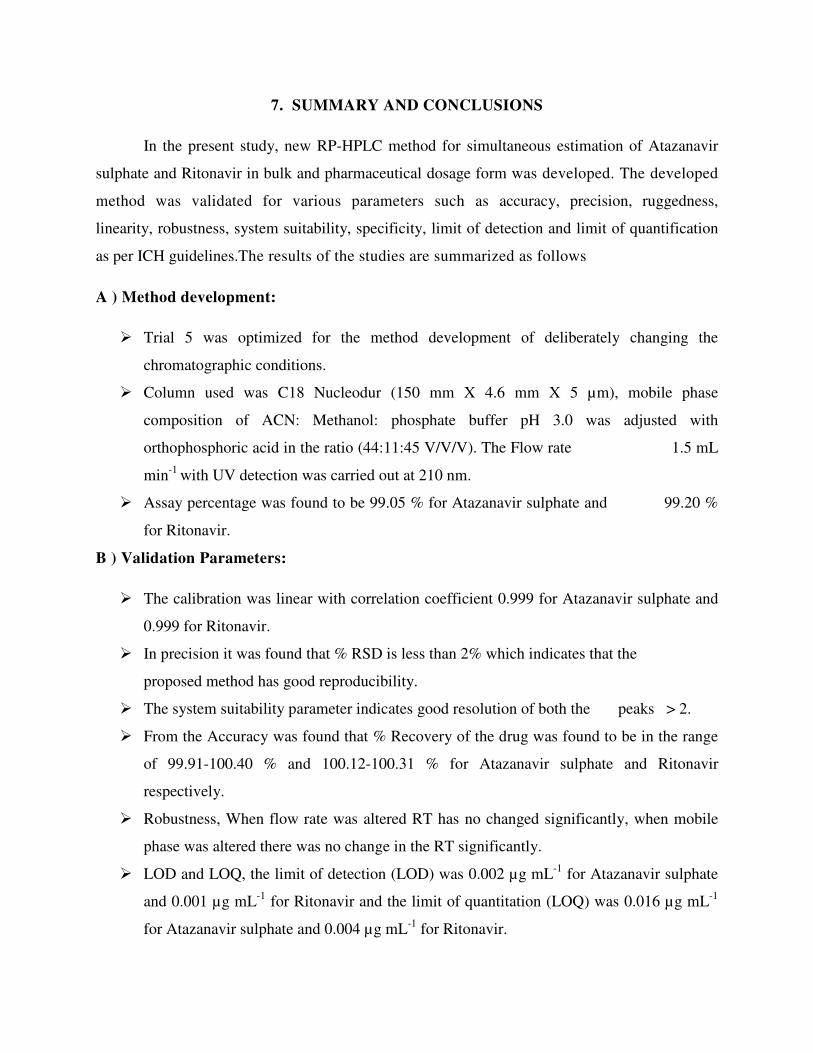
7. SUMMARY AND CONCLUSIONS
In the present study, new RP-HPLC method for simultaneous estimation of Atazanavir
sulphate and Ritonavir in bulk and pharmaceutical dosage form was developed. The developed
method was validated for various parameters such as accuracy, precision, ruggedness,
linearity, robustness, system suitability, specificity, limit of detection and limit of quantification
as per ICH guidelines.The results of the studies are summarized as follows
A ) Method development:
� Trial 5 was optimized for the method development of deliberately changing the
chromatographic conditions.
� Column used was C18 Nucleodur (150 mm X 4.6 mm X 5 µm), mobile phase
composition of ACN: Methanol: phosphate buffer pH 3.0 was adjusted with
orthophosphoric acid in the ratio (44:11:45 V/V/V). The Flow rate 1.5 mL
min-1
with UV detection was carried out at 210 nm.
� Assay percentage was found to be 99.05 % for Atazanavir sulphate and 99.20 %
for Ritonavir.
B ) Validation Parameters:
� The calibration was linear with correlation coefficient 0.999 for Atazanavir sulphate and
0.999 for Ritonavir.
� In precision it was found that % RSD is less than 2% which indicates that the
proposed method has good reproducibility.
� The system suitability parameter indicates good resolution of both the peaks > 2.
� From the Accuracy was found that % Recovery of the drug was found to be in the range
of 99.91-100.40 % and 100.12-100.31 % for Atazanavir sulphate and Ritonavir
respectively.
� Robustness, When flow rate was altered RT has no changed significantly, when mobile
phase was altered there was no change in the RT significantly.
� LOD and LOQ, the limit of detection (LOD) was 0.002 µg mL-1
for Atazanavir sulphate
and 0.001 µg mL-1
for Ritonavir and the limit of quantitation (LOQ) was 0.016 µg mL-1
for Atazanavir sulphate and 0.004 µg mL-1
for Ritonavir.

Conclusions:
The results of the present study indicated that the developed method is simple, precise
and cost effective for the simultaneous estimation of Atazanavir sulphate and Ritonavir for
routine quality control analysis of these either in bulk and pharmaceutical formulation.
The developed and validated RP-HPLC method outlined is very obvious, affordable,
dynamic, low cost, rapid easy to perform with small sample volume and good repeatability. It
can be adopted for the routine quality control analysis of simultaneous determination of
Atazanavir sulphate and Ritonavir because of good resolution of the chromatographic peaks.

Chapter 8
REFERENCES

8. REFERENCES
1. Skoog, W., Fundamental of analytical chemistry; Saunders College, 1992, 7th
Edn; pp 1-3.
2. Kasture, A. V.; Wadodkar, S. G.; Mahadik, K. R., Textbook of pharmaceutical analysis
II; Published by NiraliPrakashan, 2005, 13th
Edn; pp 1-2.
3. Seth, P. D., HPLC Quantitative analysis pharmaceutical formulations; CBS publishers
and distributors, New delhi: India, 2001, pp 3-137.
4. Beckett A. H., Stanlake J. B., Practical pharmaceutical chemistry; Part-II; CBS publishers
and distributors, 2002, 4th
Edn; pp 157-174.
5. Christine, F. R., Use of HPLC for in-process testing, separation science and technology,
2007, pp 407-423.
6. Berry, R. I.; Nash, A. R., Pharmaceutical process validation, analytical method
validation. Marcel Dekker Inc. New work. 1993, pp 411-428.
7. Williard, H. H.; Merritt, L. L.; Instrumental method of Analysis, CBS publishers,
7th
Edn, 1988, pp 580-608.
8. Nagaraju, P. T.; Sreekanthreddy, K. P.; Chinnaganganna, P.; Venugopal, N.;
Ravindranath, S.; BhanuPriya, B.; Satyanandam, S., RP-HPLC method for determination
of Ritonavir in pharmaceutical preparations. Int. J.Pharm. Sci. Rev. Res.
2012, 13(2), 55-57.
9. Arun, R.; Anton, A. S., Development and Validation of Analytical method for Lopinavir
and Ritonavir by HPLC. Int. J. Drug Dev. Res. 2013, 5(2), 1166-1171.
10. Dario, C.; Franco, M.; Diego, R.; Norberto, P., Determination of Atazanavir in Human
Plasma by High-Performance Liquid Chromatography with UV Detection. J. Chromgra.
Sci. 2008, 46, 485-488.
11. Manoj, G.; Anil, B.; Bhanubhai, S.; Ishwarsinh, R.; Urvish, D.; Arpit,P.; Ketan,V.,
Simultaneous Determination of Ritonavir and Atazanavir in combined tablet dosage form
by HPTLC. Asian. J. Biomed. Pharm. Sci. 2012, 2(15), 15-19.
12. Salinthip, J.; Kittisak, S.; Hutimamatayat, S. K.; Prapin, W., Simultaneous determination
of plasma Lopinavir and Ritonavir by chemometrics- assisted spectrophotometry and
comparisonwith HPLC method. Maejo Int. J. Sci. Tech. 2013, 7(02), 248-257.

13. Anusha, T.; Ashwini, G.; Annapurna, R. C.; Aravind, S.; Abbarajuprasana, L.;Avinash,
K., Method development and validation for the simultaneous estimation of Atazanavir
and Ritonavir in pharmaceutical dosage form by RP-HPLC. Int. J. Pharm. Chem. Bio.
Sci. 2012, 03 (01), 44-54.
14. Swetha M. A.; Ravindrareddy,Y., Method development and validation of Atazanavir and
Ritonavir in a combined dosage form By RP-HPLC Method. Int. J. Pharm. Tech. 2011,
3(03), 3316-3334.
15. Nilesh, A. B.; Shailendra, P. K.; Shailesh, N. S.; Saroj, V. S.; Vishnu, P. C.,
Spectrophotometric simultaneous determination of Atazanavir and Ritonavir in combined
tablet dosage form by ratio derivative and area under curve method. Der. Pharma.
Chemica. 2012, 4(01), 208-213.
16. Sathish, K, K.; Sujana, K.; Prameela, R. A., New validated RP-HPLC method for the
determination of Atazanavir Sulphate in bulk and dosage form. Der. Pharma. Chemica.
2012, 4(03), 1305-1310.
17. Srinivasu , K.; Venkateswara, R. J.; Appala, R.N.; Mukkanti, K. A.,Validated RP- HPLC
method for the determination of Atazanavir in pharmaceutical dosage form. J. Chem.
2011, 8(01), 453-456.
18. Nanda, R. K.; Kulkarni, A. A.; Yadav, P. B., Simultaneous spectrophotometric estimation
of Atazanavir sulfate and Ritonavir in tablet. Der. Pharma. Chemica. 2011, 3(03), 84-88.
19. http://www.drugbank.ca/drugs/DB01072.
20. http://en.wikipedia.org/wiki/Atazanavir_sulfate.
21. http://www.drugbank.ca/drugs/DB00503
22. http://en.wikipedia.org/wiki/Ritonavir.
23. ICH Q8 (R2), Pharmaceutical Development, 2009.
24. ICH Q2 (R1), Validation of analytical procedures: Text and methodology, 2005, Geneva,
Switzerland.

Chapter 9
APPENDIX

9. APPENDIX
% - Percentage.
µg - Microgram
µl - Microlitre
µm - Micrometer
ACN - Acetonitrile
AUC - Area under curve
cm - Centimeter
HPLC - High performance liquid chromatography
HPTLC - High performance thin layer chromatography
LOD - Limit of detection
LOQ - Limit of Quantitation
Mg - Milligram
RP-HPLC - Reverse phase high performance liquid
chromatography
ICH - International conference of harmonization
min - Minute
FDA - Food and drug administration
WHO - World health organization
USFDA - United state food and drug administration
NP-HPLC - Normal phase high performance liquid
chromatography
mL - Millilitre
mm - Millimetre
nm - Nanometer
Avg wt - Average weight
RSD - Relative standard deviation
r2 - Regression coefficient
ATA - Atazanavir Sulphate
RIT - Ritonavir
C18 - Carbon 18
V/V - Volume by volume