Method Development and validation for Related substances...
73
Page 212 of 305 CHAPTER 5 Method Development and validation for Related substances of Montelukast & Levocetirizine in combination by HPLC Introduction Montelukast Formula : C 35 H 35 ClNO 3 S·Na CAS Number : 151767-02-1 Molecular Weight : 608.17 Synonyms : Cyclopropaneacetic acid,1-[[[(1R)-1-[3-[(1E)-2-(7-chloro-2- quinolinyl)ethenyl]phenyl]-3-[2-(1-hydroxy- 1- methylethyl)phenyl]propyl]thio]methyl]-,monosodium salt;Singulair (TN);Singulair;sodium 2-[1-[[(1R)-1-[3-[2-(7- chloroquinolin-2-yl)ethenyl]phenyl]-3-[2-(2-hydroxypropan-2- yl)phenyl]propyl]sulfanylmethyl]cyclopropyl]acetate; Melting point : 135.5°C Montelukast is chemically belongs to leukotriene receptor antagonist (LTRA) used for the maintenance treatment of asthma and to relieve symptoms of seasonal allergies .1,2 It is usually administered orally in the form of tablets and oral granules etc. Montelukast is a CysLT1 antagonist; it blocks the action of leukotriene D4 (and secondary ligands LTC4 and LTE4) on the cysteinyl leukotriene receptor CysLT1 in the lungs and bronchial tubes by binding to it. Montelukast is a once-daily leukotriene receptor antagonist, in asthma and allergic rhinitis in both adults and children 3
Transcript of Method Development and validation for Related substances...

Page 212 of 305
CHAPTER 5
Method Development and validation for Related substances
of Montelukast & Levocetirizine in combination by HPLC
Introduction
Montelukast
Formula : C35H35ClNO3S·Na
CAS Number : 151767-02-1
Molecular Weight : 608.17
Synonyms : Cyclopropaneacetic acid,1-[[[(1R)-1-[3-[(1E)-2-(7-chloro-2-
quinolinyl)ethenyl]phenyl]-3-[2-(1-hydroxy- 1-
methylethyl)phenyl]propyl]thio]methyl]-,monosodium
salt;Singulair (TN);Singulair;sodium 2-[1-[[(1R)-1-[3-[2-(7-
chloroquinolin-2-yl)ethenyl]phenyl]-3-[2-(2-hydroxypropan-2-
yl)phenyl]propyl]sulfanylmethyl]cyclopropyl]acetate;
Melting point : 135.5°C
Montelukast is chemically belongs to leukotriene receptor antagonist (LTRA) used
for the maintenance treatment of asthma and to relieve symptoms of seasonal
allergies.1,2
It is usually administered orally in the form of tablets and oral granules
etc. Montelukast is a CysLT1 antagonist; it blocks the action of leukotriene D4 (and
secondary ligands LTC4 and LTE4) on the cysteinyl leukotriene receptor CysLT1 in
the lungs and bronchial tubes by binding to it. Montelukast is a once-daily leukotriene
receptor antagonist, in asthma and allergic rhinitis in both adults and children3

Page 213 of 305
Cetrizine Dihydrochloride
Molecular Formula : C21H25ClN2O3·2HCl
CAS No. : 83881-51-0 (Base)
83881-52-1 (Dihydrochloride)
130018-87-0 (Levocetrizine)
Molecular Weight : 461.81
Synonyms :(1S.2S)-2-Methylamino-1-phenyl-1-propanol dichloride;
(2-(4-((4-Chlorophenyl)phenylmethyl)-1-
piperazinyl)ethoxy)acetic acid dichloride;
Melting point : 110 to 115°C
215-220 ºC (Levocetrizine)
Cetrizine is chemically (±)-[2-[4-[(4-chlorophenyl)phenylmethyl]-1-
piperazinyl]ethoxy] acetic acid. It is a second-generation4 antihistamine, is a major
metabolite of hydroxyzine, and a racemic selective H1 receptor inverse agonist used
in the treatment of allergies, hay fever, angioedema, and urticaria. The most
commonly it is used in reducing the severity of common cold. Levocetirizine (as
levocetirizine dihydrochloride) is a third-generation non-sedative antihistamine,
developed from Cetirizine. Chemically, levocetirizine is the active enantiomer of
cetirizine5. It is the R-enantiomer of the Cetirizine which is a racemate. Levocetirizine
works by blocking histamine receptors. It does not prevent the actual release of
histamine from mast cells, but prevents it binding to its receptors. This in turn
prevents the release of other allergy chemicals and increased blood supply to the area,
and provides relief from the typical symptoms of hay fever
Levo isomer (levocetrizine)

Page 214 of 305
Montelukast and Cetirizine/levocetirizine combination therapy
Allergic rhinitis is the most common allergic disease worldwide and affects about
18% to 40% of the general population. Combination therapy (Montelukast plus
levocetirizine) is a more effective strategy than monotherapy in the treatment of
persistent allergic rhinitis6. Montelukast sodium is a selective and orally active
leukotriene receptor antagonist that inhibits the cysteinyl leukotriene (CysLT 1),
receptor. Levocetirizine is the R-enantiomer of Cetirizine. Levocetirizine is an orally
active, potent, selective and long acting H 1 -histamine receptor antagonist with no
anticholinergic activity.
Montelukast sodium is alkaline, stable and levocetirizine Dihydrochloride is acid
stable, when we prepare a matrix tablet, both the drugs would be in contact and make
it unstable during the shelf life of the formulation thus it becomes very important to
develop a method to determine the impurities in a combination product and check for
its stability during the shelf life.
Literature study shows many methods estimation methods for Cetirizine- A.M.Y.
Jaber et al described ―Determination of Cetirizine Dihydrochloride, related impurities
and preservatives in oral solution and tablet dosage forms using HPLC‖7. Paw B et al
published Development and validation of a HPLC method for the determination of
Cetirizine in pharmaceutical dosage forms8.
Estimation methods are also available for Montelukast- Ibrahim A. Alsarra,
“development of a stability-indicating hplc method for the determination of
Montelukast in tablets and human plasma and its applications to pharmacokinetic and
stability studies‖9. R. M. Singh et al ―Development and Validation of a RP-HPLC
Method for Estimation of Montelukast Sodium in Bulk and in Tablet Dosage Form‖10
.
Many articles are available for simultaneous assay determinations of both these drugs
Atul S. Rathore et al Development of Validated HPLC and HPTLC Methods for
Simultaneous ―Determination of Levocetirizine Dihydrochloride and Montelukast
Sodium in Bulk Drug and Pharmaceutical Dosage Form‖11
, Arindam Basu et al,
―Simultaneous RP-HPLC Estimation of Levocetirizine Hydrochloride and
Montelukast
Sodium in Tablet Dosage Form‖12
, Laskhmana Rao et al ―development and validation
of a reversed phase hplc method for simultaneous determination of levocetirizine and

Page 215 of 305
montelukast sodium in tablet dosage form‖13
. A few more articles are published for
simultaneous determination of Levocetirizine and Montelukast by HPLC14-17
No article could be traced containing simultaneous determination method for
determination of all the impurities of both the drugs.
In this chapter a related substances method for determining the impurities in such
combination products was developed. For this purpose, the drug substances, standard
and impurities were gifted by Dr Reddy‘s laboratories ltd. The drug product used for
this exercise was obtained commercially from the market. The brand called Alerfix
from Eris.
Alerfix tablets contain levocetirizine hydrochloride 5 mg and Montelukast 10 mg.

Page 216 of 305
Montelukast Structure confirmation:
The following physicochemical techniques were used to confirm the structure of
Montelukast Sodium. These are given below
Thermal study
UV study
FTIR
NMR spectrophotometry
Mass spectrophotometry
1. Thermal Analysis
1.86 mg of the sample was weighed into an aluminum crucible of 25µL and placed
into DSC. The thermogram was recorded from 30ºC to 200ºC which is carried out
under nitrogen atmosphere at 50mL/min, at 5ºC /min. The thermogram exhibited two
endotherms. The 1st endotherm was at 54.7 ºC, which may be due to the loss of
solvent or water. The second endotherm at 135.5 ºC
2. UV Study
The Ultraviolet spectrum was recorded from 200 nm to 400 nm, with API
concentration of 0.0007% in methanol. The spectrum showed five λ maxima at 212,
283, 327, 344 and 358 nm.
3. FTIR Study
The FTIR of spectrum of Montelukast Sodium was recorded by preparation of pellet
with KBr. The assignments are given in the below table.

Page 217 of 305
Table 5.1 FTIR assignments for Montelukast Sodium
Wave number (cm-1
) Assignment Mode of vibration
3392 O-H Stretching
3058 Aromatic -C-H Stretching
2975, 2928 Aliphatic -C-H Stretching
1637, 1607, 1594, 1497 -C=C Stretching
1563, 1408 -C=O Stretching
1440, 1341 Aliphatic -C-H Bending
1144 -C=O Stretching
1068 -C-Cl Stretching
963, 837, 761 -C-H Bending
4. NMR Study
The 1H and
13C NMR (Fig 6&7) data of Montelukast Sodium were recorded In
DMSO-d6 at 400 MHz and 100MHz respectively on 400MHz spectrometer. The
chemical shift values are reported on 3 scale in ppm with respect to TMS (δ 0.00ppm)
and DMSO-d6 (δ 39.5ppm) as internal standard respectively. The exchangeable
proton was observed from M exchange spectrum The NMR assignment are given in
the Table below.
NMR assignments of Montelukast Sodium.

Page 218 of 305
Table 5.2 NMR assignments for Montelukast Sodium
Position1 1
H δ (ppm) J (Hz)2 13
C
2 - - - 156.8
3 1H 7.95 d,8.2 120.3
4 1H 8.40 d,8.2 136.5
5 1H 8.00 d,8.8 129.7
6 1H 7.58 dd,1.8,8.8 125.7
7 - - - 125.6
8 1H 8.03 d,1.8 127.2
9 - - - 148.0
10 1H - - 134.3
11 1H 7.89 d,16.8 135.1
12 1H 7.50 d,16.8 128.3
13 - - - 136.0
14 1H 7.73 s 126.6
15 - - - 144.1
16 1H 7.04 -7.63 - 128.9
17 1H 7.04 -7.63 - 131.0
18 1H 7.04 -7.63 - 126.3
19 1H 4.02 D,7.2 49.4
20 Ha 2.12 m 39.0
Hb 2.21 m -
21 Ha 2.75 dd,4.0,12.6 32
Hb 3.06 m -
22 - - - 146.8
23 1H 7.04 -7.63 - 126.6
24 1H 7.04 -7.63 - 125.1
25 1H 7.04 -7.63 - 128.4
26 1H 7.04 -7.63 - 125.3
27 - - - 139.9
28 - - - 71.6
28 OH* 5.15 br -
29 3H 1.44 s 31.7
29 3H 1.44 s 31.6
30 Ha 2.00 d,14.6 43.7
Hb 2.13 d,14.6 -
31 - - - 18.0
32 Ha 0.16- 0.28 m 12.4
Hb 0.34- 0.45 m -
33 Ha 0.16- 0.28 m 12.0
Hb 2.54 m -
34 Ha 2.69 d,12.6 39.9
Hb d,12.6 -
35 - - - 176.0

Page 219 of 305
5. Mass spectral study
The ESI mass spectrum of Montelukast sodium was studied on 400Q trap LCMSMS
system. The sample is introduced through HPLC system by bypassing the column.
The ESI +ve mass spectrum of Montelukast sodium displayed the protonated
molecular ion at m/z =586 which corresponds to the molecular formula
C35H36ClNO3S. The possible fragmentation pattern is shown below.
Figure 5.1- Mass fragmentation pattern for Montelukast Sodium
m/z=568 m/z=440
m/z=442

Page 220 of 305
Impurity Details of Montelukast
Impurity 1
Chemical Name : 1-[[[(1R)-1-[3-[2-(7-Chloro-quinolinyl) ethenyl] phenyl-3-
[2- (1- hydroxyl-1-methylethyl) phenyl] propyl]thio]
methyl] cyclopropane acetic acid
Molecular Formula : C35H38ClNO3S
Molecular Weight : 588.20
Molecular Structure :
Impurity-2
Chemical Name : 1-[[[(1R)-1-[3-[(1E)-2-(7-Chloro-quinolinyl) Ethenyl] phenyl-
3- [2- (1- (1-methyl) ethenyl)] phenyl] propyl]thio]
methyl] cyclopropane acetic acid
[Or]
1-[[[(1R)-1-[3-[(1E)-2-(7-Chloro-quinolin-2-yl) Ethenyl]
phenyl-3- [2- (1-methylenyl)phenyl] propyl]sulfanyl]
methyl] cycloprpyl]acetic acid
Molecular Formula : C35H34 ClNO2S
Molecular Weight : 568.17
Molecular Structure :

Page 221 of 305
Impurity 3
Chemical Name : 1-[[[(1R)-3-(2-acetylphenyl)-1-[3-[(E)-2-(7-Chloroquin-2-yl)
Ethenyl] phenyl]propyl]sulfanyl] methyl] cyclopropyl]
acetic acid
[Or]
2-[1-(3-(2- acetylphenyl)-1-{3-[(E)-2-(7-Chloro-2-quinolyl)-1-
Ethyl] phenyl] propyl]sulfanyl] methyl]
cycloprpyl]acetic acid
Molecular Formula : C34H32 ClNO3S
Molecular Weight : 570.14
Molecular Structure :
Impurity 5:
Chemical Name : 2-[2-[3-(S)-[3-[2-[7-Chloro-2-quinolinyl] Ethyl] phenyl]-3-
hydroxy propyl]phenyl]-2-propanol
Molecular Formula : C29H28 ClNO2
Molecular Weight : 457.99
Molecular Structure :

Page 222 of 305
Impurity-6
Chemical Name :2-(1-{(1r)-1-{3- [(E)-2-(7-chloro-quinolyl)1-1ethrnyl]phrnyl}-
3- [2-(1-hydroxy-1-methyl ethyl ) phenyl]prpyl sufinyl
methyl}cycloprpyl] acetic acid.
[OR]
1-[[[(1-3-[(E)-2-(7-Chloroquinolin-2-yl)Ethenyl] phenyl]-3-[2-
(1- hydroxy-1-methylethyl)phenyl]propyl]sulfanyl] methyl]
cyclopropyl] acetic acid
Molecular Formula : C35H36 ClNO4S
Molecular Weight : 602.18
Molecular Structure :

Page 223 of 305
Cetirizine Structure confirmation:
The following physicochemical techniques were used to confirm the structure of
Cetirizine Dihydrochloride. These are given below
Thermal study
UV study
FTIR
NMR spectrophotometry
Mass spectrophotometry
1. Thermal Analysis
3.12 mg of the sample was weighed into an aluminum crucible of 25µL and placed
into the DSC. The thermogram was recorded from 30ºC to 300ºC which is carried out
under nitrogen atmosphere at 50mL/min, at 10ºC /min. The thermogram exhibited
endotherm at 205 and 214 ºC followed by decomposition. This was confirmed by
melting point apparatus which showed melting between 200 and 210 ºC.
2. UV Study
The Ultraviolet spectrum was recorded from 200 nm to 400 nm, with API
concentration of 0.0007% in methanol. The spectrum showed two λmax at 204 and
231 nm.
3. FTIR Study
The FTIR of spectrum of Cetirizine Dihydrochloride was recorded by preparation of
pellet with KBr. The assignments are given in the below table.

Page 224 of 305
Table 5.3 FTIR assignments for Cetirizine Dihydrochloride
Wave number (cm-1
) Assignment Mode of vibration
3461 -N-H, O-H Stretching
2981,2949 Aliphatic -C-H Stretching
2629, 2358 N-H+
Stretching
1743 Acid C=O Aromatic -C=C Stretching
1601 Aromatic -C=C Stretching
1496, 1382, 1357 Aliphatic -C-H Bending
1319 -C-N Stretching
1135 Ether C-O Stretching
1092 Aromatic C-Cl Stretching
805, 757, 699 Aromatic C-H Stretching
4. NMR study
The 1H and
13C NMR (Fig 6&7) data of Cetirizine Dihydrochloride were recorded In
DMSO-d6 at 400 MHz and 100MHz respectively on 400MHz spectrometer. The
chemical shift values are reported on 3 scale in ppm with respect to TMS (δ 0.00ppm)
and CD3COOD (δ 39.5ppm) as internal standard respectively. The exchangeable
proton was observed from M exchange spectrum The NMR assignment are given in
the Table below.
NMR assignments of Cetirizine Dihydrochloride

Page 225 of 305
Table 5.4 NMR assignments for Cetirizine Dihydrochloride
Position1 1
H δ (ppm) J (Hz)2 13
C
2&6 Ha
Hb
2H
2H
4.20
4.06
m 50.02
2&6 Ha
Hb
2H
2H
3.96
3.69
m 50.02
7 1H 5.72 s 76.34
8 - - - 133.52
9 1H 7.48 m 130.77
10 1H 7.95 m 131.51
11 - - 136.65
12 1H 7.95 m 131.51
13 1H 7.48 m 130.77
14 - - 134.49
15 1H 7.48 m 130.77
16 1H 7.95 m 129.68
17 1H 7.42 m 130.77
18 1H 7.95 m 129.68
19 1H 7.48 m 130.77
20 2H 3.59 m 57.44
21 2H 4.06 m 65.90
22 2H 4.24 s 68.35
23 - - - 178.11
5. Mass spectral study
The ESI mass spectrum of Cetirizine Dihydrochloride was studied on 400Q trap
LCMSMS system. The sample is introduced through HPLC system by bypassing the
column. The chemical ionization was performed by using isobutene gas to enhance
ionization. The CI mass spectrum showed base peak at m/z =389. The possible mass
fragmentation is shown below.

Page 226 of 305
Figure 5.2- Mass Fragmentation pattern of Cetirizine dihydrochloride
C21H25ClN2O3 C19H22ClN2
Exact Mass 388 Exact Mass 313
C18H20ClN2 C13H10Cl+
Exact Mass 299 Exact Mass 201

Page 227 of 305
Impurities of Cetirizine
1. Impurity A
Chemical Name: 1-[(4-Chlorophenyl) phenylmethyl] pipeazine
Molecular Formula: C17H19ClN
Molecular Weight: 286.80
Chemical Structure:
1. Impurity B
Chemical Name: 2-[4-[(4-Chlorophenyl) phenyl methyl] pipeazin-1-yl] acetic
acid
Molecular Formula: C19H21N2O2Cl
Molecular Weight: 344.84
Chemical Structure:

Page 228 of 305
2. Impurity C
Chemical Name: 2-[2-[4-[(4-Chlorophenyl) phenylmethyl] pipeazin-1-yl]
ethoxy] acetic acid
Molecular Formula: C21H25ClN2O3
Molecular Weight: 388.89
Chemical Structure:
3. Impurity D
Chemical Name: Bis-[(4-Chlorophenyl) phenyl methyl] pipeazine
Molecular Formula: C30H28N2Cl2
Molecular Weight: 487.46
Chemical Structure:

Page 229 of 305
4. Impurity E
Chemical Name: 2-[2-[2-[4-[(4-Chlorophenyl) phenylmethyl] pipeazin-1-yl]
ethoxy] acetic acid
Molecular Formula: C23H23N2O4Cl
Molecular Weight: 432.94
Chemical Structure:
5. Impurity F
Chemical Name: 2-[2-[4-(diphenylmethyl) pipeazin-1-yl] ethoxy]acetic acid
Molecular Formula: C21H26N2O3
Molecular Weight: 354.44
Chemical Structure:

Page 230 of 305
Method Development By HPLC
Objective:
To develop an analytical method for determination of related substances in a
combination drug product i.e. tablets containing Montelukast and Cetirizine.
Scope:
This method can be used for routine analysis in Quality control laboratories. This
method will also be checked for its applicability during the Stability studies for
determination of related substance and also degradation products in a combination
product of Montelukast and Cetirizine.
Chemicals and reagents:
All the solvents used i.e. Acetonitrile, Methanol, Water were of HPLC grade. The
Selection of Mobile phase:
Mobile phase was selected on the basis of chemical properties of Cetirizine and
Montelukast. Cetirizine and its impurity showed different polarity as Imp A,B,C,E
were eluting faster and Imp D was eluting slower, whereas for Montelukast and its
impurities , elution is dependent on high ratio of organic modifiers, thus 0.1% of
OPA buffer was selected. The selection of buffers was made by taking into account,
the solubility of the buffers in the organic phase. In order to ensure that difference in
readings of different pH meters does not affect the method performance, buffers were
avoided initially. Organic modifiers used in the beginning was a combination
Acetonitrile and Water in ratio 95:5, but in this combination, Cetirizine and all its
impurity except Imp D eluted at around 2 minutes, hence instead of Water, Methanol
was used to provide optimum polarity so that the Cetirizine and its impurity retentions
time increase. This change however increased the retention of Montelukast also but it
turned out to be beneficial as it provided sufficient space for Cetirizine and its
impurity to elute.
Selection of Column: Column study was done initially using Inertsil ODS 3V,
250X4.6mm, 5µm, but as the organic modifier combination was changed from
Acetonitrile: Methanol: 90:10% v/v to 90:15:Acetonitrile: Methanol, Impurity 2 and
Impurity 5 of Montelukast resolution decreased significantly, hence column study was
done on 5 different column of almost same chemical property,

Page 231 of 305
1. Inertsil C8, 250X4.6 mm, 5µm
2. Waters symmetry shield RP18, 250X4.6mm, 5µm
3. Xterra RP-18, 250X4.6mm, 5µm
4. Unison US-C18, 250X4.6mm, 5µm
5. YMC pack ODS, 250X4.6mm, 5µm
Among these set of columns Waters symmetry shield RP-18, 250X4.6mm, 5µm
showed enhanced resolution and peak shape to its High carbon load of 17%, whereas
for Inertsil ODS 3V is 15%, Xterra RP-18 is 15%, Unison US-C18 is 15% and YMC
ODS-AQ is 14%.
Selection of Diluent: On the basis of solubility of both the compounds diluents was
selected to be 70:30 :: Methanol : Water.
Selection of wavelength: Absorption maxima of Cetirizine is around 243 and 229
and that of Montelukast is 266 and 283 wavelength was selected to be 225nm since 10
nm below this the response of Montelukast and its impurities were significantly
reduced along with the irregular baseline due to proximity of cut off wavelength of
Acetonitrile, 10 nm above this response of Cetirizine Imp F was significantly
reduced and 15 nm above this wavelength, the peak responses of all the impurities
decreased drastically.
Experiment 1:
Buffer: Pipetted out 1mL of 85%v/v Orthophosphoric Acid in to a 1000mL
volumetric flask, 500mL water added, shaken for 10min, subjected to ultrasonication,
cooled to room temperature and made up to the volume with water
Mobile Phase A: Buffer
Mobile Phase B: Acetonitrile::Water :: 95:5% v/v
Diluent: Methanol: Water :: 70:30% v/v

Page 232 of 305
Chromatographic Conditions:
Flow rate 1.5 ml/min
Wavelength 225 nm
Sample temperature Ambient
Column temperature 25°C
Column Inertsil ODS 3V, 250X4.6 mm, 5µm
Gradient Program
Figure 5.3 Chromatogram for experiment No 1showing Montelukast and related
impurities
Time %A %B
0.01 40 60
10 30 70
15 10 90
20 0 100
30 0 100
32 40 60
40 40 60

Page 233 of 305
Figure 5.4 Chromatogram for experiment No 1showing Cetirizine and related
impurities
Observation:
Montelukast and all its Impurities eluted within 25 minutes. Cetirizine and all its
impurity were eluted within 2 minutes.
Way forward:
Introduction of methanol in mobile phase B with replacement of water with methanol
should help in retention Cetirizine and its impurity. It should also extend the retention
time of Montelukast and its impurities. This change would also ensure proper
separation of all impurities.
Experiment 2:
Buffer: Pipetted out 1mL of 85%v/v Orthophosphoric Acid in to a 1000mL
volumetric flask, 500mL water added, shaken for 10min, subjected to ultrasonication,
cooled to room temperature and made up to the volume with water
Mobile Phase A: Buffer
Mobile Phase B: Acetonitrile::Water :: 90:10% v/v
Diluent: Methanol: Water :: 70:30% v/v

Page 234 of 305
Chromatographic Condition:
Flow rate 1.5 ml/min
Wavelength 225 nm
Sample temperature Ambient
Column temperature 25°C
Column Inertsil ODS 3V, 250X4.6 mm, 5µm
Gradient Program
Time %A %B
0.01 70 30
10 70 30
15 65 35
20 50 50
30 30 40
40 10 90
50 0 100
60 0 100
62 70 30
70 70 30

Page 235 of 305
Figure 5.5 Chromatogram for experiment No 2 with all the peaks
Observation:
This change has achieved the required results up to a certain extent. Montelukast and
all its Impurities were well separated. The decrease in Acetonitrile content in mobile
phase B impacted on Montelukast and its impurities which seem to be relatively
nonpolar and the runtime was extended upto 45 min. Cetirizine and all its impurities
eluted within 20 minutes but with very less resolution.
Way forward:
Slight increment in the percentage of methanol and corresponding reduction in the
percentage of Acetonitrile should improve the resolution of Cetirizine and its
impurities.

Page 236 of 305
Experiment 3:
Buffer: Pipetted out 1mL of 85%v/v Orthophosphoric Acid in to a 1000mL
volumetric flask, 500mL water added, shaken for 10min, subjected to ultrasonication,
cooled to room temperature and made up to the volume with water
Mobile Phase A: Buffer
Mobile Phase B: Acetonitrile:: Methanol :: 85:15% v/v
Diluent: Methanol: Water :: 70:30% v/v
Chromatographic Conditions:
Flow rate 1.5 ml/min
Wavelength 225 nm
Sample temperature Ambient
Column temperature 25°C
Column Inertsil ODS 3V, 250X4.6 mm, 5µm
Gradient Program
Time %A %B
0.01 70 30
10 70 30
15 65 35
20 50 50
30 60 40
40 10 90
50 0 100
55 0 100
58 70 30
65 70 30

Page 237 of 305
Figure 5.6 Chromatogram for experiment No 3 showing all peaks
Observation:
Changing the percentage of Acetonitrile and Methanol in mobile phase B worked as
expected. The resolution was improved for Cetirizine and all its impurity whereas in
case of Montelukast resolution between Imp 2 and Imp 5 was reduced. This indicates
that it is necessary to keep the percentage of Acetonitrile to 90% for optimum
separation of Montelukast and its impurity and 15% of methanol for improved
separation of Cetirizine and its impurity.
Way forward:
Increasing the percentage of Acetonitrile to 90% and maintaining the same
percentage of Methanol should workout logically to separate all the impurities.

Page 238 of 305
Experiment 4:
Buffer: Pipetted out 1mL of 85%v/v Orthophosphoric Acid in to a 1000mL
volumetric flask, 500mL water added, shaken for 10min, subjected to ultrasonication,
cooled to room temperature and made up to the volume with water
Mobile Phase A: Buffer
Mobile Phase B: Acetonitrile:: Methanol :: 90:15% v/v
Diluent: Methanol: Water :: 70:30% v/v
Chromatographic Conditions:
Flow rate 1.5 ml/min
Wavelength 225 nm
Sample temperature Ambient
Column temperature 25°C
Column Inertsil ODS 3V, 250X4.6 mm, 5µm
Gradient Program
Time %A %B
0.01 70 30
10 70 30
15 65 35
20 50 50
30 60 40
40 10 90
50 0 100
55 0 100
58 70 30
65 70 30

Page 239 of 305
Figure 5.7 Chromatogram for experiment No 4 showing all peaks
Observation:
Changing the percentage of Acetonitrile and Methanol in mobile phase B didn‘t work
as expected, resolution was not improved between Imp 2 and Imp 5 of Montelukast.
This shows that the impurity 2 and impurity 5 peaks are not organic phase sensitive.
Way forward:
Need to study the impact of change in stationary phase parameters thus perform
column study on equivalent columns keeping all the other chromatographic conditions
same as that of previous Experiment.
Page 240 of 305
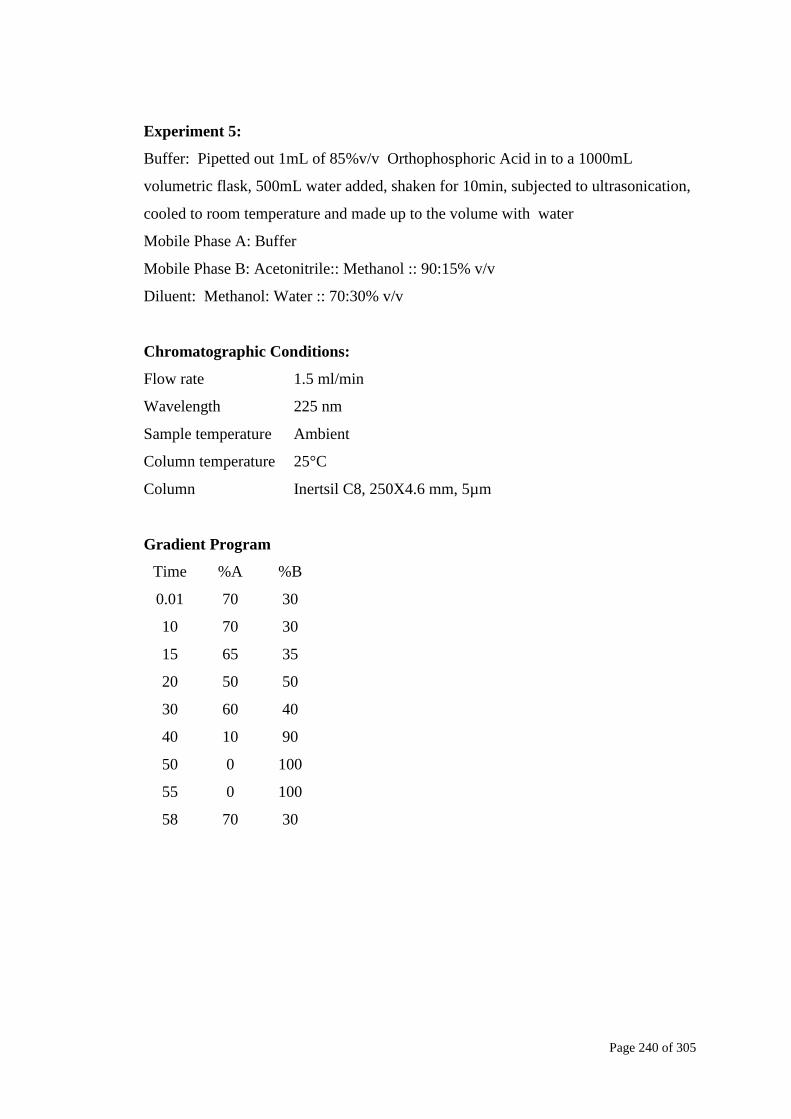
Experiment 5:
Buffer: Pipetted out 1mL of 85%v/v Orthophosphoric Acid in to a 1000mL
volumetric flask, 500mL water added, shaken for 10min, subjected to ultrasonication,
cooled to room temperature and made up to the volume with water
Mobile Phase A: Buffer
Mobile Phase B: Acetonitrile:: Methanol :: 90:15% v/v
Diluent: Methanol: Water :: 70:30% v/v
Chromatographic Conditions:
Flow rate 1.5 ml/min
Wavelength 225 nm
Sample temperature Ambient
Column temperature 25°C
Column Inertsil C8, 250X4.6 mm, 5µm
Gradient Program
Time %A %B
0.01 70 30
10 70 30
15 65 35
20 50 50
30 60 40
40 10 90
50 0 100
55 0 100
58 70 30

Page 241 of 305
Figure 5.8 Chromatogram for experiment No 5 showing all peaks
Observation:
The separation between the impurities did not improve significantly. Needs to
improve more in order to finalize the method
Way forward:
Need to check for similar columns for solutions
Experiment 6:
Buffer: Pipetted out 1mL of 85%v/v Orthophosphoric Acid in to a 1000mL
volumetric flask, 500mL water added, shaken for 10min, subjected to ultrasonication,
cooled to room temperature and made up to the volume with water
Mobile Phase A: Buffer
Mobile Phase B: Acetonitrile:: Methanol :: 90:15% v/v
Diluent: Methanol: Water :: 70:30% v/v

Page 242 of 305
Chromatographic Conditions:
Flow rate 1.5 ml/min
Wavelength 225 nm
Sample temperature Ambient
Column temperature 25°C
Column Unison US-C18, 250X4.6mm, 5µm
Gradient Program
Time %A %B
0.01 70 30
10 70 30
15 65 35
20 50 50
30 60 40
40 10 90
50 0 100
55 0 100
58 70 30
65 70 30

Page 243 of 305
Figure 5.9 Chromatogram for experiment No 6 showing all peaks
Observation:
The separation between the impurities did not improve significantly. Needs to
improve more in order to finalize the method
Way forward:
Need to check for similar columns for solutions
Experiment 7:
Buffer: Pipetted out 1mL of 85%v/v Orthophosphoric Acid in to a 1000mL
volumetric flask, 500mL water added, shaken for 10min, subjected to ultrasonication,
cooled to room temperature and made up to the volume with water
Mobile Phase A: Buffer
Mobile Phase B: Acetonitrile:: Methanol :: 90:15% v/v
Diluent: Methanol: Water :: 70:30% v/v

Page 244 of 305
Chromatographic Conditions:
Flow rate 1.5 ml/min
Wavelength 225 nm
Sample temperature Ambient
Column temperature 25°C
Column Xterra RP-18, 250X4.6mm, 5µm
Gradient Program
Time %A %B
0.01 70 30
10 70 30
15 65 35
20 50 50
30 60 40
40 10 90
50 0 100
55 0 100
58 70 30
65 70 30

Page 245 of 305
Figure 5.10 Chromatogram for experiment No 7 showing all peaks
Observation:
The separation between the impurities did not improve significantly. Needs to
improve more in order to finalize the method
Way forward:
Need to check for similar columns for solutions
Experiment 8:
Buffer: Pipetted out 1mL of 85%v/v Orthophosphoric Acid in to a 1000mL
volumetric flask, 500mL water added, shaken for 10min, subjected to ultrasonication,
cooled to room temperature and made up to the volume with water
Mobile Phase A: Buffer
Mobile Phase B: Acetonitrile:: Methanol :: 90:15% v/v
Diluent: Methanol: Water :: 70:30% v/v

Page 246 of 305
Chromatographic Conditions:
Flow rate 1.5 ml/min
Wavelength 225 nm
Sample temperature Ambient
Column temperature 25°C
Column YMC pack ODS, 250X4.6mm, 5µm
Gradient Program
Time %A %B
0.01 70 30
10 70 30
15 65 35
20 50 50
30 60 40
40 10 90
50 0 100
55 0 100
58 70 30
65 70 30

Page 247 of 305
Figure 5.11 Chromatogram for experiment No 8 showing all peaks
Observation:
The separation between the impurities did not improve significantly. Needs to
improve more in order to finalize the method
Way forward:
Need to check for similar columns for solutions
Experiment 9:
Buffer: Pipetted out 1mL of 85%v/v Orthophosphoric Acid in to a 1000mL
volumetric flask, 500mL water added, shaken for 10min, subjected to ultrasonication,
cooled to room temperature and made up to the volume with water
Mobile Phase A: Buffer
Mobile Phase B: Acetonitrile:: Methanol :: 90:15% v/v
Diluent: Methanol: Water :: 70:30% v/v

Page 248 of 305
Chromatographic Conditions:
Flow rate 1.5 ml/min
Wavelength 225 nm
Sample temperature Ambient
Column temperature 25°C
Column Waters symmetry shield RP18, 250X4.6mm, 5µm
Gradient Program
Time %A %B
0.01 70 30
10 70 30
15 65 35
20 50 50
30 60 40
40 10 90
50 0 100
55 0 100
58 70 30
65 70 30

Page 249 of 305
Figure 5.12 Chromatogram for experiment No 9 showing all peaks
Observation:
Significant improvement was observed in the resolution in waters symmetry shield
RP18, 250X4.6mm, 5µm

Page 250 of 305
Optimized final method:
Buffer: 0.1% of 85% Orthophosphoric Acid in water (1ml of 85% OPA in 1000ml
Milli-Q water)
Mobile Phase A: Buffer
Mobile Phase B: Acetonitrile::Methanol :: 90:15
Diluent: Methanol: Water :: 70:30
Sample preparation: Cetirizine 200 ppm, Montelukast: 1000 ppm.
Sample preparation was carried out by transferring 20mg of Cetirizine and 100mg of
Montelukast in amber colored 100ml volumetric flask, sonicated for 5minutes to
dissolve and diluted to volume with diluent.
Standard stock Preparations:
Standard stock preparation was carried out by adding weighed quantities of 50 mg of
Cetirizine and 100 mg Montelukast standards into separate volumetric flasks
respectively, 50mL of diluent added in each of the volumetric flasks, subjected to
ultra sonication for about 5 mins, cooled and made upto the volume with diluent.
Standard Preparation: Cetirizine: 1ppm, Montelukast: 2ppm
2 mL from each of the standard stock solutions were pipetted out into a 100mL
volumetric flask, 50mL of diluent added and shaken well and madeup to the volume
with the diluent.
Chromatographic Conditions:
Flow rate 1.5 ml/min
Column temperature 25°C
Inj Volume 30µL
Wavelength 225 nm
Sample temperature 10°C
Columns Waters symmetry shield RP18, 250X4.6mm, 5µm

Page 251 of 305
Gradient Program
Table 5.5-Individual limit of impurities considered for method validation
Cetirizine
Imp Name/No Limit
Imp A 0.10%
Imp B 0.10%
Imp C 0.10%
Imp D 0.10%
Imp E 0.10%
Imp F 0.10%
Montelukast
Imp 1 0.10%
Imp 2 0.15%
Imp 3 0.15%
Imp 4 0.10%
Imp 5 0.10%
Time %A %B
0.01 75 25
10 70 30
15 65 35
20 50 50
30 35 65
40 20 80
50 0 100
55 0 100
58 75 25
65 75 25

Page 252 of 305
Figure 5.13 Chromatogram showing all peaks in optimized method

Page 253 of 305
Analytical method validation
Analytical method validation is a process that demonstrates the suitability of the
proposed procedures for the intended purpose. More specifically, it is a matter of
establishing documented evidence providing a high degree of assurance with respect
to the consistency of the method and results. It evaluates the product against defined
specifications. The validation parameters viz., specificity, accuracy, precision,
linearity, limit of detection, limit of quantitation, robustness, system suitability have
to be evaluated as per the ICH guidelines for all analytical methods developed by
HPLC.
Validation Characteristics
The following validation characteristics were verified as per the ICH guidelines.
System suitability
Specificity
Linearity
Accuracy
Precision
LOD & LOQ
System suitability
This is an integral part of development of a chromatographic method to verify
that the resolution and reproducibility of the system are adequate enough for the
analysis to be performed. It is based on the concept that the equipment, electronics,
analytical operations and samples constituting an integral system could be evaluated
as a whole. Parameters such as plate number (N), asymmetry or tailing factors (As),
relative retention time (RRT), resolution (Rs) and reproducibility (% R.S.D), retention
time were determined. These parameters were determined during the analysis of a
"sample" containing the main components and related substances. System suitability
terms were determined and compared with the recommended limits (1≥As ≤2 and
Rs>1.5).

Page 254 of 305
Specificity
Specificity is the ability of the method to measure the analyte response in presence of
its process related impurities. The specificity of the developed HPLC method was
performed by injecting blank solution and standard solution spiked with process-
related impurities separately The chromatogram of drug with impurities was
compared with the blank chromatogram, to verify the blank interference. No peak was
observed at the retention time of Montelukast, Cetirizine and their impurities. Hence
the method is specific for the determination of Montelukast, Cetirizine and its
combination product.
Precision of Test method
System precision of the method was evaluated by injecting the standard solution six
times and percent relative standard deviation (% R.S.D) for area of Montelukast peak
was 2.1% and for Cetirizine peak it was 1.16%. This proves the system precision of
the test method. The precision of the method for the determination of impurities
related to Montelukast and Cetirizine peaks was studied for repeatability at 100 %
level. Repeatability was demonstrated by analyzing the standard solution spiked with
impurities for six times. The % R.S.D for peak area of each impurity was calculated.
Repeatability for Montelukast, Cetirizine and its impurities were found to be optimum
Thus proves that this method is precise. The results are given in Table 5.6.
Table 5.6- Precision results for Montelukast impurities
Impurity
name
(Montelukast)
RRF of
impurities
%Imp of
SPL-1
%Imp of
SPL-2
%Imp of
SPL-3
%Imp of
SPL-4
%Imp of
SPL-5
%Imp of
SPL-6
%RSD
Impurity 1 0.77 0.116 0.104 0.102 0.106 0.095 0.097 7.13
Impurity 2 1.10 0.166 0.159 0.158 0.150 0.135 0.132 9.14
Impurity 3 0.75 0.169 0.152 0.147 0.144 0.136 0.130 9.16
Impurity 5 1.17 0.099 0.097 0.097 0.095 0.092 0.090 3.45
Impurity 6 0.80 0.110 0.103 0.103 0.101 0.097 0.096 6.95

Page 255 of 305
Table 5.7- Precision results for Cetirizine impurities
Impurity
name
(Cetirizine)
RRF of
impurities
%Imp of
SPL-1
%Imp of
SPL-2
%Imp of
SPL-3
%Imp of
SPL-4
%Imp of
SPL-5
%Imp of
SPL-6
%RSD
Impurity A 1.70 0.109 0.113 0.114 0.114 0.113 0.112 1.72
Impurity B 1.26 0.118 0.119 0.116 0.115 0.115 0.117 1.22
Impurity C 0.55 0.088 0.083 0.088 0.087 0.092 0.093 4.01
Impurity D 2.50 0.110 0.115 0.115 0.114 0.111 0.113 1.70
Impurity E 1.20 0.100 0.092 0.090 0.093 0.092 0.092 3.65
Impurity F 0.45 0.094 0.093 0.093 0.094 0.095 0.093 0.91

Page 256 of 305
Linearity
Standard solutions at different concentration levels ranging from 50% of the spec
level to 300% of the specification limit were prepared and analyzed. In order to
demonstrate the linearity of detector response for Montelukast, Cetirizine and their
impurities, the linearity plot was drawn taking the concentration on X-axis and the
mean peak area on Y-axis. The data were subjected to statistical analysis using a
linear-regression model. The regression equations and correlation coefficients (r2) are
given in Tables below.
Linearity of Montelukast and its Impurities
Table 5.8 Linearity table for Montelukast
%Level
API
Conc
(ppm) area
50 1 44494
75 1.5 62215
100 2 81877
150 3 123580
200 4 161445
300 6 241958
intercept 3539
Bias at 100% 4.3223
Correlation coefficient 0.9999
Figure 5.14- Linearity graph for Montelukast
y = 39676x + 3539.R² = 0.999
0
50000
100000
150000
200000
250000
300000
0 1 2 3 4 5 6 7
Montelukast

Page 257 of 305
Table 5.9-Linearity table for Montelukast Impurity 1
IMP 1
% Level conc(ppm) area
50 0.5 15693
75 0.75 24388
100 1 33432
150 1.5 50316
200 2 66870
300 3 104907
intercept 397
Bias at 100% 1.1875
Correlation coefficient 0.9996
Figure 5.14- Linearity graph for Montelukast impurity 1
y = 35428x - 397.R² = 0.999
0
20000
40000
60000
80000
100000
120000
0 0.5 1 1.5 2 2.5 3 3.5
Impurity 1

Page 258 of 305
Table 5.10-Linearity table for Montelukast Impurity 2
IMP 2
% Level conc(ppm) area
50 0.75 30909
75 1.125 46554
100 1.5 62363
150 2.25 94701
200 3 127600
300 4.5 191949
intercept 1824
Bias at 100% 2.925
Correlation coefficient 1.0000
Figure 5.15- Linearity graph for Montelukast impurity 2
y = 43050x - 1824.R² = 1
0
50000
100000
150000
200000
250000
0 1 2 3 4 5
Impurity 2

Page 259 of 305
Table 5.11-Linearity table for Montelukast Impurity 3
IMP 3
% Level conc(ppm) area
50 0.75 36571
75 1.125 55638
100 1.5 74477
150 2.25 112545
200 3 149943
300 4.5 224523
intercept 696.3
Bias at 100% 0.9349
Correlation coefficient 1.0000
Figure 5.16- Linearity graph for Montelukast impurity 3
y = 50124x - 696.3R² = 1
0
50000
100000
150000
200000
250000
0 1 2 3 4 5
Impurity 3

Page 260 of 305
Table 5.12-Linearity table for Montelukast Impurity 5
IMP 5
% Level conc(ppm) area
50 0.5 23344
75 0.75 34977
100 1 46897
150 1.5 72874
200 2 99892
300 3 151532
intercept 651
Bias at 100% 3707
Correlation coefficient 0.9998
Figure 5.17- Linearity graph for Montelukast impurity 5
y = 51630x - 3707.R² = 0.999
0
20000
40000
60000
80000
100000
120000
140000
160000
0 0.5 1 1.5 2 2.5 3 3.5
Impurity 5
Page 261 of 305
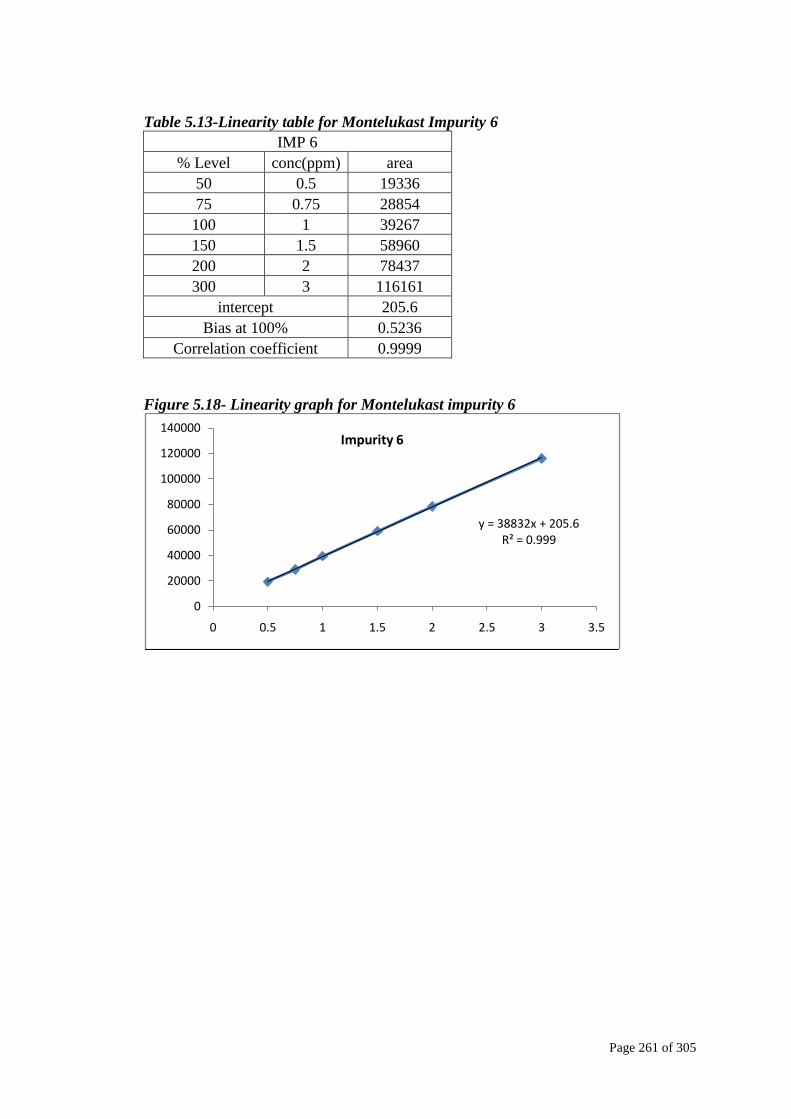
Table 5.13-Linearity table for Montelukast Impurity 6
IMP 6
% Level conc(ppm) area
50 0.5 19336
75 0.75 28854
100 1 39267
150 1.5 58960
200 2 78437
300 3 116161
intercept 205.6
Bias at 100% 0.5236
Correlation coefficient 0.9999
Figure 5.18- Linearity graph for Montelukast impurity 6
y = 38832x + 205.6R² = 0.999
0
20000
40000
60000
80000
100000
120000
140000
0 0.5 1 1.5 2 2.5 3 3.5
Impurity 6

Page 262 of 305
Linearity of Cetirizine and its Impurities
Table 5.14-Linearity table for Cetirizine
API
% Level conc(ppm) area
50 0.5 17649
75 0.75 27055
100 1 35915
150 1.5 54116
200 2 71444
300 3 107398
intercept 63.86
Bias at 100% 0.1778
Correlation coefficient 1.0000
Figure 5.19- Linearity graph for Cetirizine
y = 35794x + 63.86R² = 0.999
0
20000
40000
60000
80000
100000
120000
0 0.5 1 1.5 2 2.5 3 3.5
Cetrizine

Page 263 of 305
Table 5.15-Linearity table for Cetirizine Impurity A
IMP A
% Level conc(ppm) area
50 0.12 5808
75 0.18 8167
100 0.24 11410
150 0.36 15496
200 0.48 22647
300 0.72 33973
intercept 260.7
Bias at 100% 2.2848
Correlation coefficient 0.9982
Figure 5.20- Linearity graph for Cetirizine Impurity A
y = 47174x - 260.7R² = 0.996
0
5000
10000
15000
20000
25000
30000
35000
40000
0 0.1 0.2 0.3 0.4 0.5 0.6 0.7 0.8
Are
a
Impurity A
Page 264 of 305
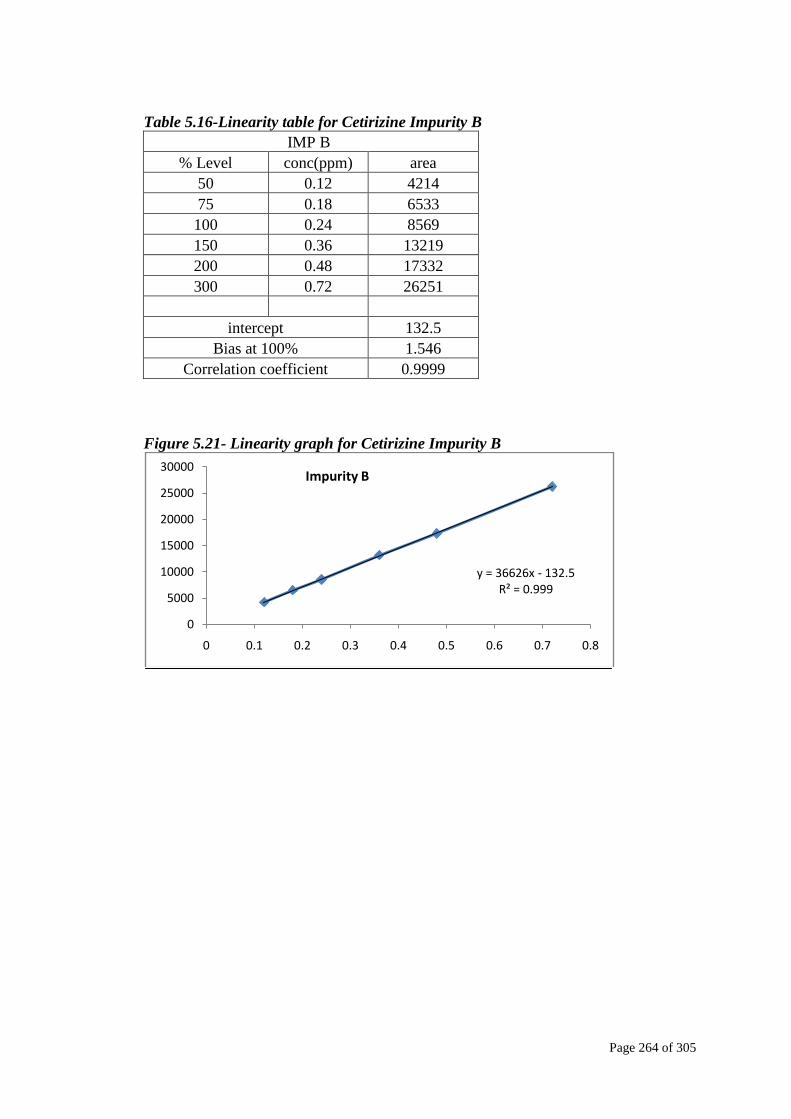
Table 5.16-Linearity table for Cetirizine Impurity B
IMP B
% Level conc(ppm) area
50 0.12 4214
75 0.18 6533
100 0.24 8569
150 0.36 13219
200 0.48 17332
300 0.72 26251
intercept 132.5
Bias at 100% 1.546
Correlation coefficient 0.9999
Figure 5.21- Linearity graph for Cetirizine Impurity B
y = 36626x - 132.5R² = 0.999
0
5000
10000
15000
20000
25000
30000
0 0.1 0.2 0.3 0.4 0.5 0.6 0.7 0.8
Impurity B

Page 265 of 305
Table 5.17-Linearity table for Cetirizine Impurity C
IMP C
% Level conc(ppm) area
50 0.12 1295
75 0.18 2038
100 0.24 2720
150 0.36 4294
200 0.48 5668
300 0.72 8700
intercept 196.1
Bias at 100% 7.2096
Correlation coefficient 0.9999
Table 5.22-Linearity table for Cetirizine Impurity C
y = 12330x - 196.1R² = 0.999
0
1000
2000
3000
4000
5000
6000
7000
8000
9000
10000
0 0.1 0.2 0.3 0.4 0.5 0.6 0.7 0.8
Are
a
Impurity C

Page 266 of 305
Table 5.18-Linearity table for Cetirizine Impurity D
IMP D
% Level conc(ppm) area
50 0.12 9910
75 0.18 13982
100 0.24 17843
150 0.36 26181
200 0.48 34026
300 0.72 49754
intercept 512
Bias at 100% 2.8695
Correlation coefficient 1.0000
Table 5.23-Linearity table for Cetirizine Impurity D
y = 66486x + 2012.R² = 0.999
0
10000
20000
30000
40000
50000
60000
0 0.1 0.2 0.3 0.4 0.5 0.6 0.7 0.8
Impurity D

Page 267 of 305
Table 5.19-Linearity table for Cetirizine Impurity E
IMP E
% Level conc(ppm) area
50 0.12 3202
75 0.18 4902
100 0.24 6546
150 0.36 9436
200 0.48 12232
300 0.72 18387
intercept 363.4
Bias at 100% 5.5515
Correlation coefficient 0.9997
Table 5.24-Linearity table for Cetirizine Impurity E
y = 25012x + 363.4R² = 0.999
0
2000
4000
6000
8000
10000
12000
14000
16000
18000
20000
0 0.1 0.2 0.3 0.4 0.5 0.6 0.7 0.8
Impurity E

Page 268 of 305
Table 5.20-Linearity table for Cetirizine Impurity F
IMP F
% Level conc(ppm) area
50 0.12 1199
75 0.18 1510
100 0.24 2083
150 0.36 3470
200 0.48 4220
300 0.72 6370
intercept 64.88
Bias at 100% 3.1147
Correlation coefficient 0.9975
Table 5.25-Linearity table for Cetirizine Impurity F
y = 8791.x + 64.88R² = 0.995
0
1000
2000
3000
4000
5000
6000
7000
0 0.2 0.4 0.6 0.8
Are
a
Impurity F

Page 269 of 305
Accuracy of test method
Accuracy of the test method was determined by analyzing Motelukast, Cetrizine drug
substance spiked with impurities at five different concentration levels of 50 %, 75%,
100 %,150%, 200% and 300 % of each at the specified limit. The mean recoveries of
all the impurities were calculated individually and are represented in the below tables
individually for Motelukast, Cetrizine and all the impurities
Table 5.21- Accuracy results for Montelukast
Level Amount Added Amount Found %Recovery
50% 0.9093 1.0090 110.97
75% 1.4397 1.4109 98.00
100% 1.8943 1.8568 98.02
150% 2.8793 2.8026 97.33
200% 3.7886 3.6613 96.64
300% 5.6829 5.4872 96.56
Table 5.22- Accuracy results for Montelukast Impurity 1
Level Amount Added Amount Found %Recovery
50% 0.4733 0.4636 97.95
75% 0.7573 0.7204 95.13
100% 0.9466 0.9876 104.33
150% 1.4200 1.4864 104.68
200% 1.8933 1.9754 104.34
300% 2.8399 3.0990 109.12

Page 270 of 305
Table 5.23- Accuracy results for Montelukast Impurity 2
Level Amount Added Amount Found %Recovery
50% 0.7601 0.7010 92.22
75% 1.2162 1.0558 86.81
100% 1.5202 1.4143 93.03
150% 2.2804 2.1476 94.18
200% 3.0405 2.8937 95.17
300% 4.5607 4.3531 95.45
Table 5.24- Accuracy results for Montelukast Impurity 3
Level Amount Added Amount Found %Recovery
50% 0.8116 0.8294 102.20
75% 1.2985 1.2618 97.17
100% 1.6232 1.6890 104.06
150% 2.4348 2.5523 104.83
200% 3.2463 3.4004 104.75
300% 4.8695 5.0918 104.57
Table 5.25- Accuracy results for Montelukast Impurity 5
Level Amount Added Amount Found %Recovery
50% 0.5163 0.5294 102.54
75% 0.8260 0.7932 96.03
100% 1.0325 1.0635 103.00
150% 1.5488 1.6526 106.70
200% 2.0651 2.2654 109.70
300% 3.0976 3.4365 110.94

Page 271 of 305
Table 5.26- Accuracy results for Montelukast Impurity 6
Level Amount Added Amount Found %Recovery
50% 0.4101 0.4385 106.93
75% 0.6562 0.6544 99.73
100% 0.8202 0.8905 108.57
150% 1.2303 1.3371 108.68
200% 1.6404 1.7788 108.44
300% 2.4606 2.6343 107.06
Table 5.27- Accuracy results for Cetirizine
Level Amount Added Amount Found %Recovery
50% 0.4786 0.4912 102.64
75% 0.7577 0.7529 99.36
100% 0.9970 0.9995 100.25
150% 1.5154 1.5060 99.38
200% 1.9940 1.9883 99.71
300% 2.9910 2.9889 99.93
Table 5.28- Accuracy results for Cetirizine Impurity A
Level Amount Added Amount Found %Recovery
50% 0.1014 0.0951 93.82
75% 0.1521 0.1664 109.44
100% 0.2027 0.1868 92.14
150% 0.3041 0.3355 110.32
200% 0.4055 0.3707 91.42
300% 0.6082 0.5562 91.45

Page 272 of 305
Table 5.29- Accuracy results for Cetirizine Impurity B
Level Amount Added Amount Found %Recovery
50% 0.1003 0.0931 92.86
75% 0.1504 0.1443 95.95
100% 0.2005 0.1893 94.40
150% 0.3008 0.2920 97.08
200% 0.4011 0.3828 95.45
300% 0.6016 0.5798 96.38
Table 5.30- Accuracy results for Cetirizine Impurity C
Level Amount Added Amount Found %Recovery
50% 0.0721 0.0655 90.87
75% 0.1081 0.1031 95.35
100% 0.1442 0.1376 95.44
150% 0.2163 0.2173 100.49
200% 0.2883 0.2868 99.47
300% 0.4325 0.4402 101.78
Table 5.31- Accuracy results for Cetirizine Impurity D
Level Amount Added Amount Found %Recovery
50% 0.0966 0.1103 114.18
75% 0.1449 0.1556 107.38
100% 0.1932 0.1986 102.79
150% 0.2898 0.2914 100.55
200% 0.3864 0.3788 98.03
300% 0.5796 0.5539 95.56

Page 273 of 305
Table 5.32- Accuracy results for Cetirizine Impurity E
Level Amount Added Amount Found %Recovery
50% 0.0824 0.0743 90.15
75% 0.1236 0.1137 91.97
100% 0.1648 0.1518 92.09
150% 0.2473 0.2188 88.49
200% 0.3297 0.2837 86.05
300% 0.4945 0.4264 86.23
Table 5.33- Accuracy results for Cetirizine Impurity F
Level Amount Added Amount Found %Recovery
50% 0.0711 0.0742 104.35
75% 0.1067 0.0934 87.56
100% 0.1422 0.1288 90.56
150% 0.2133 0.2146 100.60
200% 0.2844 0.2597 91.30
300% 0.4267 0.3939 92.32

Page 274 of 305
Limit of detection (LOD) and limit of quantitation (LOQ)
Limit of detection or LOD is the lowest level at which the impurity or API peak can
be observed or in other words can be distinguished from that of the system noise.
Limit of quantitation or LOQ is the lowest level at which the impurity or API can be
quantitatively estimated with an acceptable accuracy. This estimation was performed
by means of the slope method. The calculation was carried by means of the following
formula.
SLOD 3.3
Where = standard deviation of intercept
S = slope of the calibration curve
SLOQ 10
Where = standard deviation of intercept
S = slope of the calibration curve
The high level of sensitivity of the method can be observed by means of low levels of
the LOD and LOQ values.
Table 5.34- LOD and LOQ of Montelukast impurities
Impurity Name
LOQ
LOD
Impurity 1 0.006% 0.002%
Impurity 2 0.008% 0.003%
Impurity 3 0.008% 0.003%
Impurity 5 0.006% 0.002%
Impurity 6 0.005% 0.002%

Page 275 of 305
Table 5.35- LOD and LOQ of Cetirizine impurities
Impurity Name
LOQ
LOD
Impurity A 0.019% 0.005%
Impurity B 0.010% 0.003%
Impurity C 0.017% 0.006%
Impurity D 0.003% 0.001%
Impurity E 0.023%
0.008%
Impurity F
0.041% 0.015%
Figure 5.26- Chromatogram showing LOQ level peaks

Page 276 of 305
FORCED DEGRADATION STUDY
The forced degradation of a drug product is performed as a part of method
development or method validation in order to understand which are the degradation
product peaks that are appearing in the chromatogram when the drug product is
exposed to extreme conditions. This is essentially to test the capability of the test
method to check if the same is able to separate any peak thus formed in any of the
degradation conditions. Stability testing of an active substance or finished product
provide evidence on how the quality of a drug substance or drug product varies with
time influenced by a variety of environmental conditions like temperature, humidity
and light etc,. Knowledge from stability studies enables understanding of the long-
term effects of the environment on the drugs. Stability testing provides information
about degradation mechanisms, potential degradation products, possible degradation
path ways of drug as well as interaction between the drug and the excipients in drug
product.
Forced degradation study was carried out by treating the sample under the
following conditions
Acid degradation
A tablet powder sample containing approx 20 mg of Cetirizine and 100mg of
Montelukast was weighed and transferred into 100 ml volumetric flask and 5 ml of
1N HCl was added to it. The solution was warmed on a water bath at 80 °C for 2 hr
and then neutralized with 5 ml of 1N NaOH. The neutralized solution was made up to
the volume with diluent.
Alkali degradation
A tablet powder sample containing approx 20 mg of Cetirizine and 100mg of
Montelukast was weighed and transferred into 100 ml volumetric flask and 5 ml of
1N NaOH was added to it. The solution was warmed on a water bath at 80 °C for 2 hr
and then neutralized with 5 ml of 1N HCl. The neutralized solution was made up to
the volume with diluent.

Page 277 of 305
Oxidative degradation
A tablet powder sample containing approx 20 mg of Cetirizine and 100mg of
Montelukast was weighed and transferred into a 100 ml volumetric flask and 5 ml of
1 % Hydrogen peroxide solution was added to it. The solution was warmed on water
bath at 80 °C for 1 hr. Then the above mixture was kept aside for few minutes, and the
volume was made up with diluent.
The above stressed samples were analyzed as per the test procedure using Photodiode
Array detector. The results are summarized in below table
Table 5.36-Forced degradation Cetirizine
Degradation
Type
Degradation Condition Net
degradation
Purity
angle
Purity
threshold
Acid Exposed for 1hrs with 1N
HCl at 60°C 1.8% 0.073 0.269
Base Exposed for 1hr with 1N
NaoH at 60°C 0.05% 0.068 0.268
Peroxide Exposed for 1hr with 1%
H2O2 at 60°C
2.3%
0.072 0.269

Page 278 of 305
Table 5.37-Forced degradation Montelukast
Degradation
Type
Degradation
Condition
Net
degradation
Purity
angle
Purity
threshold
Acid Exposed for 1 hrs with
1N HCl at 60°C 1.9% 3.481 4.298
Base Exposed for 1hr with
1N NaoH at 60°C 0.51% 2.935 4.164
Peroxide Exposed for 1hr with
1% H2O2 at 60°C
18.0%
2.439 4.050
Chromatograms for forced degradation study.
Figure 5.27- Chromatogram for Sample in as such condition

Page 279 of 305
Figure 5.28- Chromatogram for Cetrizine degradation in IN HCl
Figure 5.29-Chromatogram for Montelukast degradation in IN HCl

Page 280 of 305
Figure 5.30-Chromatogram for Montelukast and Cetirizine In 1n HCl
Figure 5.31-Chromatogram for Cetirizine In 1N NaOH

Page 281 of 305
Figure 5.32-Chromatogram for Montelukast in 1N NaOH
Figure 5.33-Chromatogram for Montelukast and Cetirizine in 1N NaOH

Page 282 of 305
Figure 5.34-Chromatogram for Cetirizine in 1% H2O2
Figure 5.35-Chromatogram for Montelukast in 1% H2O2

Page 283 of 305
Figure 5.36-Chromatogram for Montelukast and Cetirizine in 1% H2O2
Conclusion:
A method for determination of Cetirizine, Montelukast, and their related substances
has been successfully developed by HPLC. This method has also been validated as
per ICH guidelines. The method has demonstrated the stability indicating capability as
it has complied the acceptance criteria of separating all the unknown degradation
products arising from various stress studies, namely acid, base and peroxide.
The method is found to be specific, precise, linear and accurate in the range of its
intended application. This method is suitable for use in routine analysis in any quality
control laboratory and if applied will prove to be extremely beneficial for the
organization and the end user i.e. the patient.

Page 284 of 305
References
1. Lipkowitz.;A Myron. and T Navarra The Encyclopedia of Allergies (2nd ed.) Facts
on File, New York, p. 178, (2001)
2. "Asthma / Allergy ". Mascothealth.com. Retrieved 9 April 2011.
3. Expert Review of Clinical Immunology November, 5, No. 6, pp 639-658 (2009)
4. WE Pierson.; C Ther. Jan-Feb;13(1):92-9. (1991)
5. Y-W Chou.; W-S Huang.; C-C Ko.; S-Hwei.; Journal of Separation Science, 31, 5,
pp 845–852, March 2008
6. M Ciebiada.; M Gorska Ciebiada.; T Kmiecik.; LM DuBuske.; P Gorski1., J
Investig Allergol Clin Immunol; 18(5): 343-349 (2008)
7. AMY. Jaber.; HA Al Sherifeb.; M.M. Al Omarib.; A.A. Badwan.; Journal of
Pharmaceutical and Biomedical Analysis, 36, 2, pp 341–350 (29 October 2004)
8. B Paw.; G Misztal.; H Hopkała.; J Drozd.; Die Pharmazie , 57(5):313-315 (2002)
9. I A. Alsarra.; Saudi Pharmaceutical Journal, . 12,. 4, (October 2004)
10. R M Singh.; P K Saini.; S C. Mathur.; G. N. Singh and B. Lal.; Indian J Pharm
Sci. 72(2): pp 235–237.(2010)
11. A S. Rathore.; L Sathiyanarayanan and K R Mahadik, Pharmaceutica analytica
acta September 30, (2010)
12. A Basu.; K Basak.; M Chakraborty.; IS Rawat, International Journal of
PharmTech Research, .3, .1, pp 405-410, (2011)
13.T Raja.; AL Rao, International Journal Of Research In Pharmacy And Chemistry,
2012, 2(4).
14. R Suresh.; R Manavalan. and K Valliappan., International Journal of Drug
Development & Research . 4, 3 (July-September 2012)
15. V. Choudhari .;A Kale.; S Abnawe .;B Kuchekar .;V.Gawli .;N Patil.,
International Journal of PharmTech Research, 2,1, pp 04-09 (2010)
16. S Somkuwar.; A K Pathak., Pharmacia, 1 , 3, (June 2012)
17. P Srividya.; M Tejaswini.; D Sravanthi & B N. Nalluri., Journal of Liquid
Chromatography & Related Technologies, (Jan 2013)