Method Application and Single Lab Validation Checklist For Acceptance of … · 2017-07-18 ·...
34
1 Method Application and Single Lab Validation Checklist For Acceptance of a Method for Use in the NSSP The purpose of single laboratory validation in the National Shellfish Sanitation Program (NSSP) is to ensure that the analytical method under consideration for adoption by the NSSP is fit for its intended use in the Program. A Checklist has been developed which explores and articulates the need for the method in the NSSP; provides an itemized list of method documentation requirements; and, sets forth the performance characteristics to be tested as part of the overall process of single laboratory validation. For ease in application, the performance characteristics listed under validation criteria on the Checklist have been defined and accompany the Checklist as part of the process of single laboratory validation. Further a generic protocol has been developed that provides the basic framework for integrating the requirements for the single laboratory validation of all analytical methods intended for adoption by the NSSP. Methods submitted to the ISSC LMR Committee for acceptance will require at a minimum 6 months for review from the date of submission. Name of the New Method Male-specific Coliphage for Wastewater Name of the Method Developer USFDA Gulf Coast Seafood Laboratory Developer Contact Information USFDA Gulf Coast Seafood Laboratory, 1 Iberville Drive, Dauphin Island, AL 36 [email protected] Checklist Y/N Submitter Comments A. Need for the New Method Clearly define the need for which the method has been developed. Y What is the intended purpose of the method? Y Is there an acknowledged need for this method in the NSSP? Y What type of method? i.e. chemical, molecular, culture, etc. Y Culture method for Male-specific Coliphage in Wastewater Influent, Mid- process Samples, and Effluent B. Method Documentation 1. Method documentation includes the following information: Method Title Y Method Scope Y References Y Principle Y Any proprietary aspects N Equipment required Y Reagents required Y Sample collection, preservation and storage requirements Y Proposal No. 15-114
Transcript of Method Application and Single Lab Validation Checklist For Acceptance of … · 2017-07-18 ·...

1
Method Application and Single Lab Validation Checklist For Acceptance of a Method for Use in the NSSP
The purpose of single laboratory validation in the National Shellfish Sanitation Program (NSSP) is to ensure that the analytical method under consideration for adoption by the NSSP is fit for its intended use in the Program. A Checklist has been developed which explores and articulates the need for the method in the NSSP; provides an itemized list of method documentation requirements; and, sets forth the performance characteristics to be tested as part of the overall process of single laboratory validation. For ease in application, the performance characteristics listed under validation criteria on the Checklist have been defined and accompany the Checklist as part of the process of single laboratory validation. Further a generic protocol has been developed that provides the basic framework for integrating the requirements for the single laboratory validation of all analytical methods intended for adoption by the NSSP. Methods submitted to the ISSC LMR Committee for acceptance will require at a minimum 6 months for review from the date of submission.
Name of the New Method Male-specific Coliphage for Wastewater
Name of the Method Developer
USFDA Gulf Coast Seafood Laboratory
Developer Contact Information USFDA Gulf Coast Seafood Laboratory, 1 Iberville Drive, Dauphin Island, AL 36 [email protected]
Checklist Y/N Submitter Comments A. Need for the New Method Clearly define the need for which the method has been developed.
Y
What is the intended purpose of the method?
Y
Is there an acknowledged need for this method in the NSSP?
Y
What type of method? i.e. chemical, molecular, culture, etc.
Y
Culture method for Male-specific Coliphage in Wastewater Influent, Mid-process Samples, and Effluent
B. Method Documentation 1. Method documentation includes the following information:
Method Title Y Method Scope Y References Y Principle Y Any proprietary aspects N Equipment required Y Reagents required Y Sample collection, preservation and storage requirements
Y
Proposal No. 15-114
2
Safety requirements Y Clear and easy to follow step-by-step procedure
Y
Quality control steps specific for this method
Y
C. Validation Criteria 1. Accuracy / Trueness Y 2. Measurement uncertainty Y 3. Precision characteristics (repeatability)
Y
4. Recovery Y 5. Specificity NA 6. Working and Linear ranges Y 7. Limit of detection Y 8. Limit of quantitation / Sensitivity Y 9. Ruggedness Y 10. Matrix effects N 11. Comparability (if intended as a substitute for an established method accepted by the NSSP)
NA
D. Other Information 1. Cost of the method Y 2. Special technical skills required to perform the method
Y
3. Special equipment required and associated cost
Y
4. Abbreviations and acronyms defined
Y
5. Details of turn around times (time involved to complete the method)
Y
6. Provide brief overview of the quality systems used in the lab
Y
Submitters Signature Date: Submission of validation data and draft method to committee
Date:
Reviewing members:
Accepted Date:
Recommendations for further work
Date:
Comments:
Proposal No. 15-114

3
Single Laboratory Validation (SLV) Protocol For Submission to the ISSC For Method Approval
Name of the New Method - A Culture Method/Double Agar Overlay Method for the Determination of Male-specific Coliphage (MSC) for Wastewater Name of Method Developer - Kevin Calci, USFDA-GCSL Developer Contact Information - USFDA Gulf Coast Seafood Laboratory, 1 Iberville Drive, Dauphin Island, AL 36 [email protected] Date of Interim Submission - May 15, 2017 Section A. Need for the New Method FDA has long been using Male-Specific Coliphage (MSC) to evaluate the potential viral contamination of shellfish growing water by wastewater treatement plant (WTP) outfalls. Methods using MSC as an indicator of viral contamination have been successful in evaluation of viral persistence in molluscan shellfish impacted by WTP outfalls (Daskin et al, 2008)(ISSC MSC Workshop). Studies continue to show a significant inverse relationship between decreasing MSC levels in shellfish and increasing wastewater dilution, which is in turn strongly associated with increasing distance from the WTP disharges (Goblic et al, 2011). The relationship between the level of viral contamination in shellfish and dilution of treated wastewater is really contingent on the viral reduction efficientcy of the WTP impacting the area.
The purpose of this method is to assess the log10 reduction of MSC, as a process indicator
for enteric viruses,namely Human Norovirus, in wastewater samples including raw influent, pre-disinfected effluent and final effluent. By comparing log10 values of these results, the viral reduction performance of a WTP can be assessed under different environmental and operational conditions (Amarasiri et al, 2017) (Pouillot et al, 2015). Understanding the viral reduction performance at different stages in a wastewater treatment process is a valuable assessment tool to determine growing area classsification and management options for shellfish growing areas adjacent to and downstream from the WTP outfall. This newly configured FDA method for the determination of MSC in wastewater samples has been adapted from previous methods so that it may be more readily implimented at NSSP Laboratories.
The recognized need for an alternative viral indicator is addressed in detail in the newly accepted 2015 Revision of the NSSP Guide for the Control of Molluscan Shellfish, Section IV Guidance Documents, Chapter II, @ .19, Determining Appropriately Sized Prohibited Areas Associated with Wastewater Treatment Plants, page 292. The need and utility for this method was likewise address at the MSC Informational Meeting of the Growing Area Committee (MSC Summit) in
Proposal No. 15-114

4
Charlotte, NC in August 2014. A pre-proposal was reveiwed at the 2015 ISSC Meeting and given the Proposal Number of 15-114. The LMRC agreed that the pre-proposal was sufficient and that there is a need for the method. The LMRC recommended to Task Force I that Proposal 15-114 be referred to an appropriate committee as determined by the Conference Chair and await the SLV data.
Proposal No. 15-114
5
Section B. Method Documentation
Modified Double Agar Overlay Method for Determination of Male-specific Coliphage in Wastewater
May 2017 Revision
This method for determining levels of male-specific coliphage in wastewater is based on the method described by Cabelli in work on the Narragansett Bay Project. (Cabelli, 1998) The development of an Escherichia coli host cell that consitutively expresses the F plasmid and is resistent to 95% of the somatic phage in wastewater was described in a subsequent paper. (DeBartolomeis and Cabelli,1991) FDA refined the method for oyster and hard clam meats as described in the workshop instructions, Male-specific Bacteriophage (MSB) Workshop, conducted in Gloucester, Massachusetts on March 9-12, 2004. (US Food and Drug Administration, 2004) This original FDA (2004) method was submitted as ISSC Proposal 05-114. Spinney Creek Shellfish, Inc. (SCS) further refined these procedures for soft-shelled clams and American Oysters in work funded by the Maine Technology Institute in 2006 with the assistance of Mercuria Cumbo of the Maine Department of Marine Resources. This method was approved for limited use by the 2009 ISSC in Manchester, NH. In work funded by UNH Sea Grant, SLV work continued for species extension to quahogs, which was approved for limited use by the 2013 ISSC in San Antonio, Texas. Method development and preliminary SLV trials were conducted in 2015 by Kevin Calci and Ashley Cooper at USFDA-GCSL. Additional SLV trials were conducted at the Spinney Creek Shellfish Laboratory in collaboration with Kevin Calci, the method developer in work supported by UNH Sea Grant. A. Apparatus and Materials. Equipment and Materials for Collection and Transport of Wastewater Samples: 250 or 500 ml Sterile Sample Containers Sealable Bio-hazard Bags (used when shipping) Labels Cooler Gel Packs Sampling Device 10% Sodium Thiosulfate Solution (for effluent samples) Laboratory Equipment: Water bath, 50-52°C Air Incubator, 35-37°C Balance Stir plate and magnetic stirring bars, sterile Mini vortexer Autoclave, 119°C - 121°C Refrigerator, 0–4° C Freezer, -20°C
Proposal No. 15-114
6
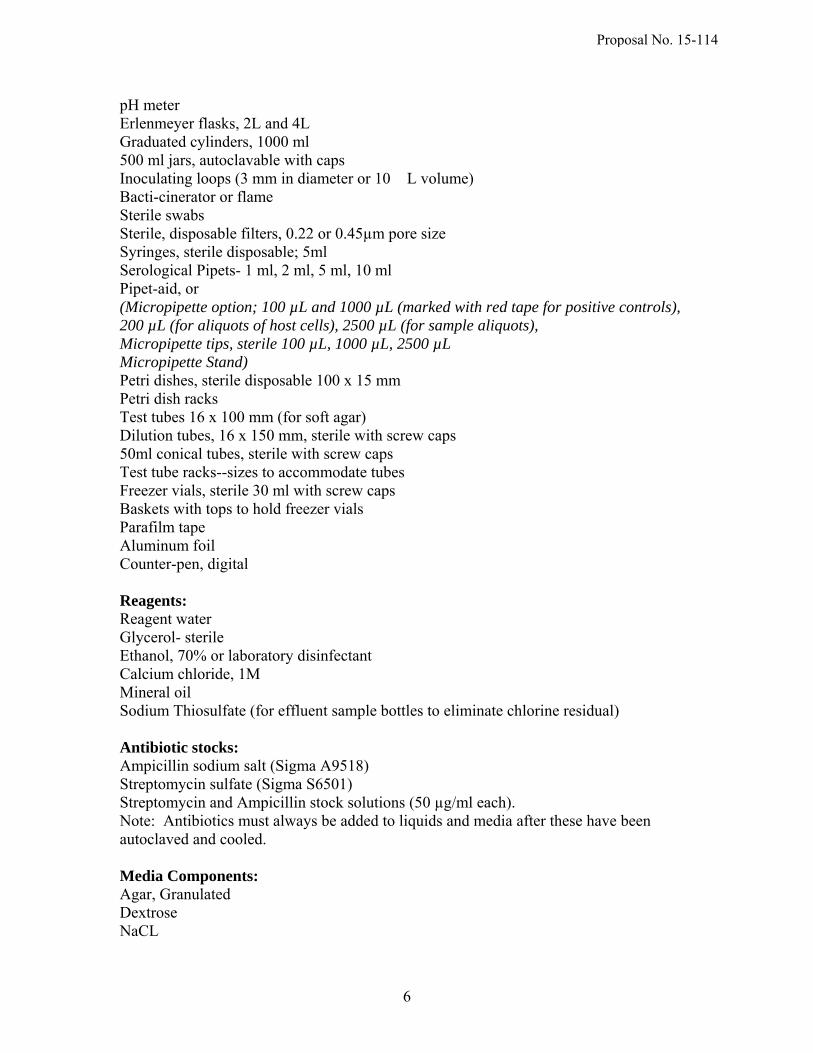
pH meter Erlenmeyer flasks, 2L and 4L Graduated cylinders, 1000 ml 500 ml jars, autoclavable with caps Inoculating loops (3 mm in diameter or 10 �L volume) Bacti-cinerator or flame Sterile swabs Sterile, disposable filters, 0.22 or 0.45µm pore size Syringes, sterile disposable; 5ml Serological Pipets- 1 ml, 2 ml, 5 ml, 10 ml Pipet-aid, or (Micropipette option; 100 µL and 1000 µL (marked with red tape for positive controls), 200 µL (for aliquots of host cells), 2500 µL (for sample aliquots), Micropipette tips, sterile 100 µL, 1000 µL, 2500 µL Micropipette Stand) Petri dishes, sterile disposable 100 x 15 mm Petri dish racks Test tubes 16 x 100 mm (for soft agar) Dilution tubes, 16 x 150 mm, sterile with screw caps 50ml conical tubes, sterile with screw caps Test tube racks--sizes to accommodate tubes Freezer vials, sterile 30 ml with screw caps Baskets with tops to hold freezer vials Parafilm tape Aluminum foil Counter-pen, digital Reagents: Reagent water Glycerol- sterile Ethanol, 70% or laboratory disinfectant Calcium chloride, 1M Mineral oil Sodium Thiosulfate (for effluent sample bottles to eliminate chlorine residual) Antibiotic stocks: Ampicillin sodium salt (Sigma A9518) Streptomycin sulfate (Sigma S6501) Streptomycin and Ampicillin stock solutions (50 µg/ml each). Note: Antibiotics must always be added to liquids and media after these have been autoclaved and cooled. Media Components: Agar, Granulated Dextrose NaCL
Proposal No. 15-114

7
CaCl2 DI water Media: Bottom Agar DS Soft Agar Growth Broth Bacterial Host Strain: E.coli Famp � E. coli HS(pFamp)RR (ATCC # 700891). MSC (Coliphage) Stock: Type Strain - MS2, ATCC # 15597 B. Media Composition. Bottom Agar: Tryptone 10.0 g Dextrose 1.0 g NaCl 5.0 g Agar 15.0 g DI water 990 ml Final pH 6.7 ± 0.2 at 25°C 1. With gentle mixing, add all the components, except antibiotics, to 990ml of dH2O in a 1000ml flask (increase flask size to make larger volumes). Dissolve, heat until clear, bringing to a boil. 2. Sterilize at 121°C ± 2°C for 15 minutes. 3. Temper to 50°C in the water bath. 4. Add 5 ml of Streptomycin sulfate/Ampicillin solution, aseptically to the flask (50 µg/ml each in final) and mix. Transfer to 2 – 500ml sterile jars (easier to pour plates from jars). 5. Pour 15-17 ml aliquots aseptically into sterile 100 x 15 mm Petri dishes and allow the agar to harden. Tip Petri dish lids off slightly to reduce condensation. 6. Store bottom agar plates inverted at 4°C and warm to room temperature for 1 hour before use. 7. Plates stored sealed at 4°C can be used up to 3 months.
Proposal No. 15-114
8
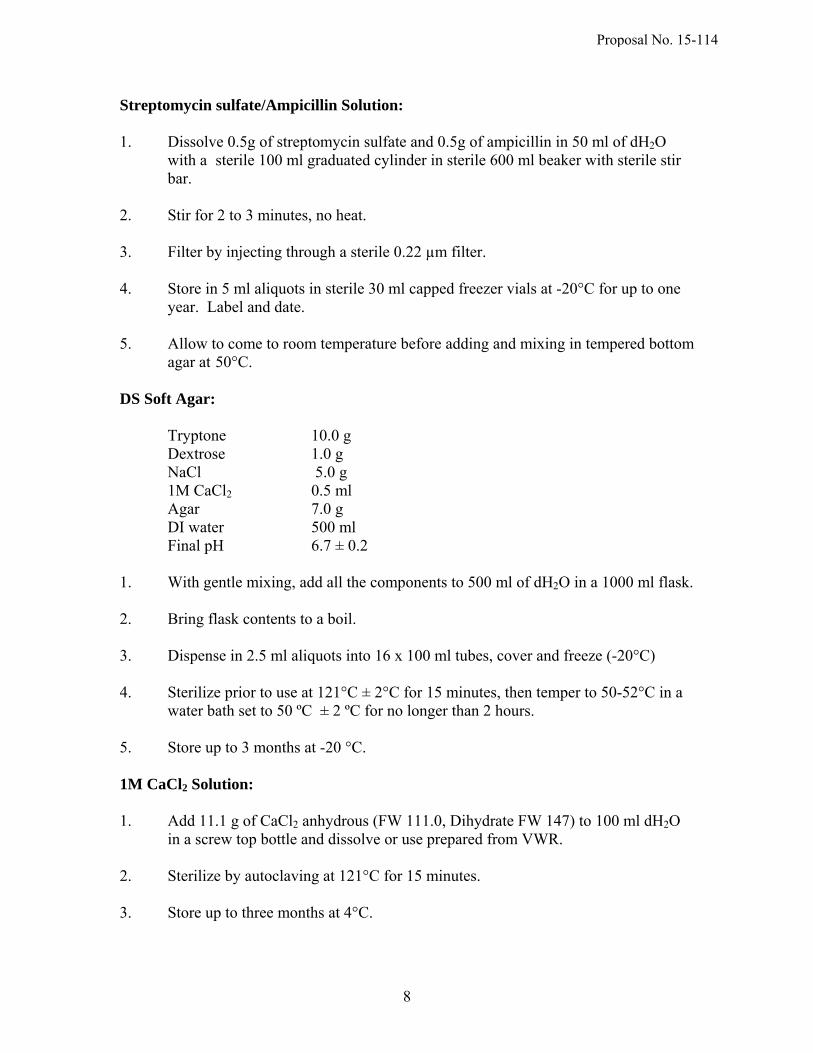
Streptomycin sulfate/Ampicillin Solution:
1. Dissolve 0.5g of streptomycin sulfate and 0.5g of ampicillin in 50 ml of dH2O with a sterile 100 ml graduated cylinder in sterile 600 ml beaker with sterile stir bar. 2. Stir for 2 to 3 minutes, no heat. 3. Filter by injecting through a sterile 0.22 µm filter. 4. Store in 5 ml aliquots in sterile 30 ml capped freezer vials at -20°C for up to one year. Label and date. 5. Allow to come to room temperature before adding and mixing in tempered bottom agar at 50°C. DS Soft Agar: Tryptone 10.0 g Dextrose 1.0 g NaCl 5.0 g 1M CaCl2 0.5 ml Agar 7.0 g DI water 500 ml Final pH 6.7 ± 0.2 1. With gentle mixing, add all the components to 500 ml of dH2O in a 1000 ml flask. 2. Bring flask contents to a boil. 3. Dispense in 2.5 ml aliquots into 16 x 100 ml tubes, cover and freeze (-20°C) 4. Sterilize prior to use at 121°C ± 2°C for 15 minutes, then temper to 50-52°C in a water bath set to 50 ºC ± 2 ºC for no longer than 2 hours. 5. Store up to 3 months at -20 °C. 1M CaCl2 Solution: 1. Add 11.1 g of CaCl2 anhydrous (FW 111.0, Dihydrate FW 147) to 100 ml dH2O in a screw top bottle and dissolve or use prepared from VWR. 2. Sterilize by autoclaving at 121°C for 15 minutes. 3. Store up to three months at 4°C.
Proposal No. 15-114

9
Growth Broth: Tryptone 10.0 g Dextrose 1.0 g NaCl 5.0 g DI water 1000 ml 1. With gentle mixing, add all the components to 1000 ml of dH2O water in a 2000 ml flask. 2. Dissolve and dispense into sterile screw top containers. 3. Sterilize at 121°C ± 2°C for 15 minutes. 4. Store for up to three months at 4°C. C. Storage and Propagation of Host Strain, E. coli Famp. Storage: 1. Lab stock culture – Frozen at – 80°C indefinitely (most desirable method) in broth culture containing 10% glycerol under no selective pressure. Selective pressure is reapplied when the culture is retrieved, by streaking onto Bottom Agar plates containing the two antibiotics. 2. Long-term working stock culture – Grown tryptic soy agar slant with sterile mineral oil overlay under no selective pressure and stored at room temperature in the dark for up to 2 years. 3 Long-term working stock – 6-hour grown tryptic soy agar slant and deep stab with sterile mineral oil overlay containing the two antibiotics, Ampicillin and Streptomycin (least desirable method). 4. Short-term working stock culture - Grown Bottom Agar streak plate stored at 4°C up to 3 weeks. Glycerol Solution, 10%: 1. Add 9 ml of distilled water to 1 ml of undiluted glycerol. 2. Autoclave resulting 10% glycerol solution at 121°C for 15 minutes and use at room temperature. 3. For storage, add 1/5th volume of 10% glycerol solution, let stand for 30 minutes, dispense 1 ml aliquots in 2 ml cryo-vials and store at -70 to –80°C (best) or at –20°C.
Proposal No. 15-114
10
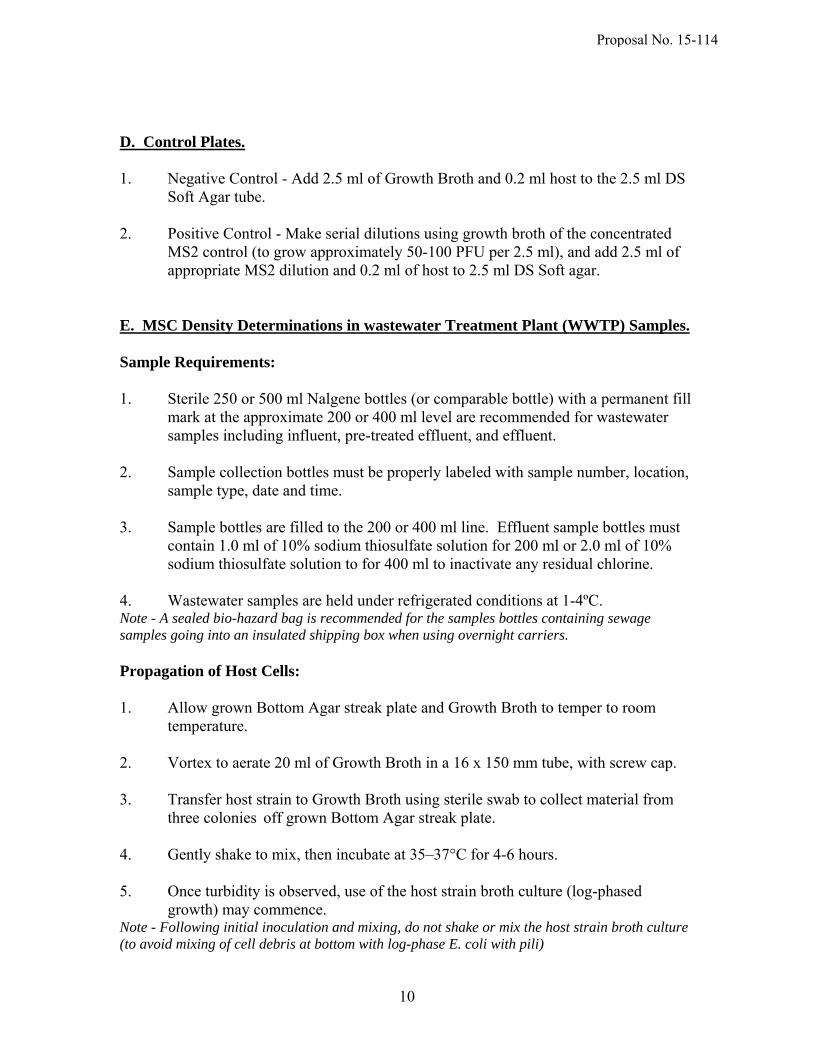
D. Control Plates. 1. Negative Control - Add 2.5 ml of Growth Broth and 0.2 ml host to the 2.5 ml DS Soft Agar tube. 2. Positive Control - Make serial dilutions using growth broth of the concentrated MS2 control (to grow approximately 50-100 PFU per 2.5 ml), and add 2.5 ml of appropriate MS2 dilution and 0.2 ml of host to 2.5 ml DS Soft agar.
E. MSC Density Determinations in wastewater Treatment Plant (WWTP) Samples. Sample Requirements: 1. Sterile 250 or 500 ml Nalgene bottles (or comparable bottle) with a permanent fill mark at the approximate 200 or 400 ml level are recommended for wastewater samples including influent, pre-treated effluent, and effluent. 2. Sample collection bottles must be properly labeled with sample number, location, sample type, date and time. 3. Sample bottles are filled to the 200 or 400 ml line. Effluent sample bottles must contain 1.0 ml of 10% sodium thiosulfate solution for 200 ml or 2.0 ml of 10% sodium thiosulfate solution to for 400 ml to inactivate any residual chlorine. 4. Wastewater samples are held under refrigerated conditions at 1-4ºC. Note - A sealed bio-hazard bag is recommended for the samples bottles containing sewage samples going into an insulated shipping box when using overnight carriers. Propagation of Host Cells: 1. Allow grown Bottom Agar streak plate and Growth Broth to temper to room temperature. 2. Vortex to aerate 20 ml of Growth Broth in a 16 x 150 mm tube, with screw cap. 3. Transfer host strain to Growth Broth using sterile swab to collect material from three colonies off grown Bottom Agar streak plate. 4. Gently shake to mix, then incubate at 35–37°C for 4-6 hours. 5. Once turbidity is observed, use of the host strain broth culture (log-phased growth) may commence. Note - Following initial inoculation and mixing, do not shake or mix the host strain broth culture (to avoid mixing of cell debris at bottom with log-phase E. coli with pili)
Proposal No. 15-114

11
Preparation of Wastewater samples for Analysis: 1. Analyst must wear gloves during handling of stir bars and sample bottle. 2. Water samples are removed from 1 - 4º C. 3. Sample bottle is shaken vigorously for 20 seconds (ensure cap is tightened), and a sterile magnetic stir bar is aseptically transferred to bottle. 4. Sample bottle is placed on stir plate set to medium for five minutes prior to analysis. 5. For the high range of this method a 10-2 decimal dilution is prepared by transferring 1ml of sample with a sterile 2 ml pipette (using a pipette aid) to a sterile 16x150mm screw cap tube containing 9 ml of growth broth. Sample tube is then vortexed for 10 seconds. For the second decimal dilution, 2ml are transferred from the first tube to a sterile 50ml conical tube with cap containing 18ml of growth broth using a second sterile 2ml pipette. The appropriately labeled 50 ml conical tube is then vortexed for 10 seconds. 6. For the low range of this method, 30ml of sample is transferred to a sterile 50 mm conical tube with cap using a sterile 10 ml pipette. The appropriately labeled 50 ml conical tube is vortexed for 10 seconds. 7. Prepped samples in labeled 50ml conical tube are stored in a test tube rack which can be stored short term at 0-4°C. 8. Return sample bottles to refrigeration and clean the work surface with disinfectant. Note: The samples bottles containing wastewater samples should be autoclaved prior to disposal. Sample bottles must be washed and sterilized for re-use. Direct Analytical Technique for WWTP samples: This MSC method for wastewater has both a high range and a low range routine. Combined, the working range is from 5 to 1,200,000 PFU/100ml. The high range routine is adequate for enumeration of MSC in WWTP influent and has a working range from 1,000 to 1,200,000 PFU/100ml. The low range routine is generally adequate for enumeration of MSC in final effluent and has a working range from 5 to 12,000 PFU/100ml. When testing for pre-treatment effluent (before disinfection) or at times when the effluent is questionable, both high and low ranges routines should be used together.
Proposal No. 15-114
12
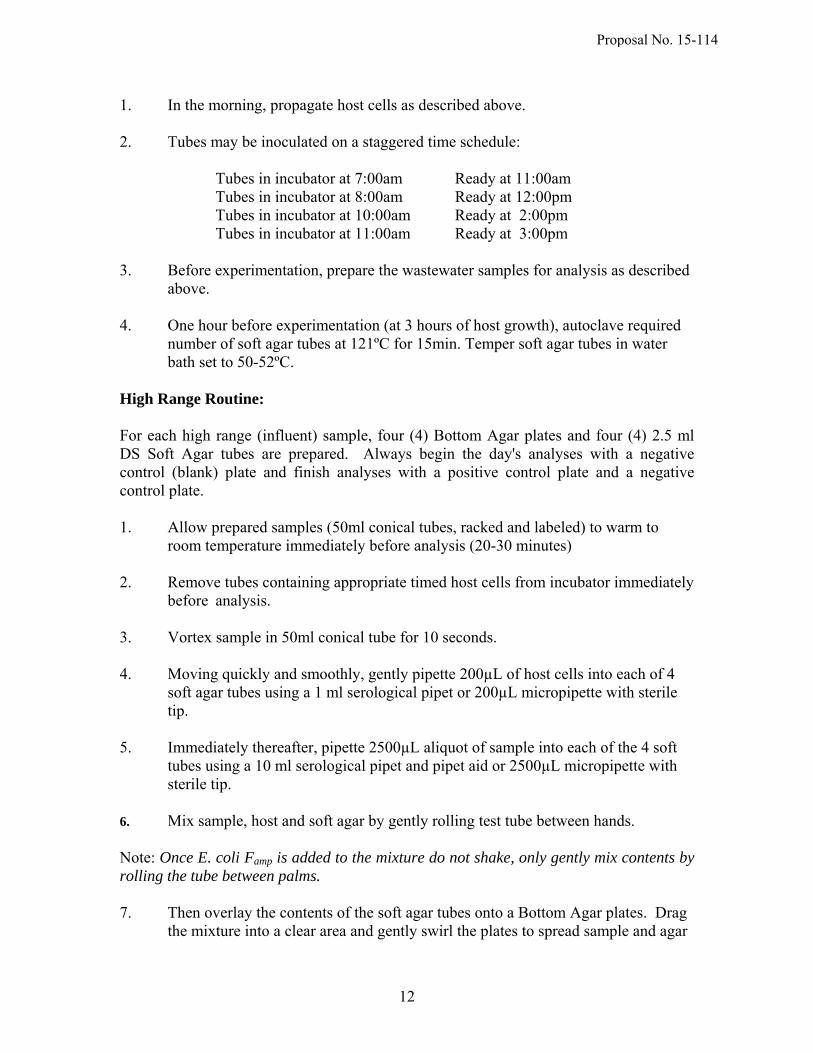
1. In the morning, propagate host cells as described above. 2. Tubes may be inoculated on a staggered time schedule: Tubes in incubator at 7:00am Ready at 11:00am Tubes in incubator at 8:00am Ready at 12:00pm Tubes in incubator at 10:00am Ready at 2:00pm Tubes in incubator at 11:00am Ready at 3:00pm 3. Before experimentation, prepare the wastewater samples for analysis as described above. 4. One hour before experimentation (at 3 hours of host growth), autoclave required number of soft agar tubes at 121ºC for 15min. Temper soft agar tubes in water bath set to 50-52ºC. High Range Routine: For each high range (influent) sample, four (4) Bottom Agar plates and four (4) 2.5 ml DS Soft Agar tubes are prepared. Always begin the day's analyses with a negative control (blank) plate and finish analyses with a positive control plate and a negative control plate. 1. Allow prepared samples (50ml conical tubes, racked and labeled) to warm to room temperature immediately before analysis (20-30 minutes) 2. Remove tubes containing appropriate timed host cells from incubator immediately before analysis. 3. Vortex sample in 50ml conical tube for 10 seconds. 4. Moving quickly and smoothly, gently pipette 200µL of host cells into each of 4 soft agar tubes using a 1 ml serological pipet or 200µL micropipette with sterile tip. 5. Immediately thereafter, pipette 2500µL aliquot of sample into each of the 4 soft tubes using a 10 ml serological pipet and pipet aid or 2500µL micropipette with sterile tip. 6. Mix sample, host and soft agar by gently rolling test tube between hands. Note: Once E. coli Famp is added to the mixture do not shake, only gently mix contents by rolling the tube between palms. 7. Then overlay the contents of the soft agar tubes onto a Bottom Agar plates. Drag the mixture into a clear area and gently swirl the plates to spread sample and agar
Proposal No. 15-114
13
mixture. 8. Allow plates to set then inverted and incubated for 16 - 20 hours at 35- 37°C. 9. Circular zones of clearing (typically 1 to 10 mm in diameter) in lawn of host bacteria after 16 – 20 hours of incubation are counted as plaques. PFUs on each plate are counted and totaled using a digital counter pen and adequate light 10. Calculations of High Range Routine Results; N = Total number of PFUs counted on 4 the plates, The maximum readable limit on PFUs count is 1000 on the four plate, PFU count exceeding 1,000/4 plate is considered TNTC or >1,000,000 PFU/100gm Result = (N PFUs) * 100 = N * 1,000 PFU/100ml .1 ml Example: High range version plate counts - 13, 23, 12, and 16 PFUs Result = (64)*(1000) = 64,000 PFU/100ml Low Range Routine: For each low range (effluent) sample, eight (8) Bottom Agar plates and eight (8) 2.5 ml DS Soft Agar tubes are prepared. Always begin the day's analyses with a negative control (blank) plate and finish analyses with a positive control plate and a negative control plate. 1. Allow prepared samples (50ml conical tubes, racked and labeled) to warm to room temperature immediately before analysis (20-30 minutes) 2. Remove tubes containing appropriate timed host cells from incubator immediately before analysis. 3. Vortex sample in 50ml conical tube for 10 seconds. 4. Moving quickly and smoothly, gently pipette 200µL of host cells into each of 8 soft agar tubes using a 1 ml serological pipet or 200µL micropipette with sterile tip. 5. Immediately thereafter, pipette 2500µL aliquot of sample into each of the 8 soft tubes using a 10 ml serological pipet and pipet aid or 2500µL micropipette with sterile tip.
Proposal No. 15-114

14
6. Mix sample, host and soft agar by gently rolling test tube between hands. Note: Once E. coli Famp is added to the mixture do not shake, only gently mix contents by rolling the tube between palms. 7. Then overlay the contents of the soft agar tubes onto a Bottom Agar plates. Drag the mixture into a clear area and gently swirl the plates to spread sample and agar mixture. 8. Allow plates to set then inverted and incubated for 16 - 20 hours at 35- 37°C. 9. Circular zones of clearing (typically 1 to 10 mm in diameter) in lawn of host bacteria after 16 – 20 hours of incubation are counted as plaques. PFUs on each plate are counted and totaled using a digital counter pen and adequate light 10. Calculations of Low Range Routine Results; N = Total number of Plaque forming units (PFUs) counted on 8 the plates, The maximum readable limit on PFUs count is 2000 on the eight plate, PFU count exceeding 2,000/8 plates is considered TNTC or >10,000 PFU/100gm Result = (N PFUs) * 100 = N * 5 PFU/100ml 20 ml Example: High range version plate counts - 21, 17, 20, 19, 13, 23, 12, and 16 PFUs Result = (141)*(5) = 702 PFU/100ml. Rounding off result to nearest 10s... Result = 700PFU/100gm
Proposal No. 15-114

15
MSC Method for Wastewater Schematic:
Proposal No. 15-114
16
Samples Bench Sheet:
Proposal No. 15-114

17
F. Sample Collection and Storage. 1. Record all pertinent information on the collection form. 2. During transportation store samples in a cooler at 0 to 10°C . 3. At laboratory, store samples in a refrigerator at 0 to 4 °C. 4. Maximum holding times for wastewater samples is up to 72 hours. G. Quality Assurance. 1. Positive and negative control plates are run with MSC analyses each day. 2. Media sterility checks are made per batch and records are maintained. 3. Media log book is maintained (pH, volume, weights of each components, lot numbers, etc.). 4. An intra- and inter-laboratory performance program is developed. 5. Circular zones of clearing (typically 1 to 10 mm in diameter) in lawn of host bacteria after 16- 20 hours of incubation are counted as plaques. (Count the number of plaques on each plate.) 6. MSC determinations are reported as plaque forming unit (PFU) per 100 grams. 7. The desired range for counting is 0 to 300 PFU per plate. If the count exceeds the upper range or if the plaques are not discrete, results should be recorded as “too numerous to count” (TNTC) or >12,000 PFU/100ml for Low Range Routine and >1,200,000 PFU/100ml for High Range Routine. 8. Temperatures incubators are checked twice daily (at least 4 hours apart) to ensure operation within the stated limits of the method, and results are recorded in a logbook. 9. Check thermometers at least annually against a NIST-certified thermometer. 10. Calibrate the balance monthly using ASTM-certified Class 1 or 2 or NIST Class S reference weights. 11. Laboratory analysts adhere to all applicable quality control requirements set forth in the most recent version of FDA's Shellfish Laboratory Evaluation Checklist.
Proposal No. 15-114
18
12. Calibration of micropipettes needs to be checked quarterly and records kept. Micropipettes used for handling MSC control and transferring host cells need to have a barrier tip or be dedicated to the specific use to prevent contamination H. Safety. Samples, reference materials, and equipment known or suspected to have sewage, coliphage and/or E.coli attached or contained must be sterilized prior to disposal.
I. Technical Terms. °C - degrees Celsius µL - microliter g - gram L - liter M - molar ml - milliliter Ave. - average MSC - Male-specific Coliphage, Male-specific Bacteriophage, F+ Bacteriophage NIST - National Institute of Standards and Technology PFU - plaque forming units RT - room temperature TNTC - too numerous to count Host Strain: E.coli Famp bacteria (E.coli HS(pFamp)RR) Male-specific Coliphage: Viruses that infect coliform bacteria only via the F-pili. Plaque : Clear circular zones (typically 1 to 10 mm in diameter) in lawn of host cells after incubation. References: Amarasiri, M., M. Kitajima, T.H. Nguyen, S. Okabe, and D. Sano. Bacteriophage removal efficiency as a validation and operational monitoring tool for virus reduction in wastewater raclamation: Review. Water Research 121 (2017) 258-269. Cabelli, V.J. 1988. Microbial indicator levels in shellfish, water, and sediments from the upper Narragansett Bay conditional shellfish-growing area. Report to the Narragansett Bay Project, Providence, RI. Daskin, J. H., K.R. Calci, W. Burkhardt III, and R.H. Carmichael. Use of N stable isotope and microbial analyses to define wastewater influence in Mobile Bay, AL. Marine Pollution Bullentin 56 (2008) 860-868.
Proposal No. 15-114
19
DeBartolomeis, J. and V.J. Cabelli. 1991. Evaluation of an Escherichia coli host strain for enumeration of F male-specific Coliphages. Appl. Environ. Microbiol. 57(4):1201-1205. Goblic, G.N., J.M. Anbarcian, J. Woods, W. Burkhardt III, and K.R. Calci. Evaluating the dilution of wastewater treatment plant effluent and viral impacts on shellfish growing areas in Mobile Bay, Alabama. Journal of Shellfish Research. 30:3, 1-9, 2011. Pouillot, R., J.M. van Doren, , J. Woods, , D. Plante, M. Smith, G. Goblick, C. Roberts, A. Locas, W. Hajen, J. Stobo, J. White, J. Holtzman, E. Buenaventura, W. Burkhardt III, A. Catford, R. Edwards, A. DePaola, and K.R. Calci, 2015. Meta-analysis of the reduction of norovirus and male-specific coliphage concentrations in wastewater treatment plants. Appl. Environ. Microbiol. 81, 4669-4681.
U.S. Food and Drug Administration. 2004. Male-specific Coliphage (MSC) Workshop, conducted in Gloucester, Massachusetts on March 9-12, 2004.
Proposal No. 15-114

20
Other Information: This method for the enumeration of male-specific coliphage in wastewater samples is inexpensive, easy to perform, and rapid, providing results within 24 hours. The cost of laboratory glassware, plastic-ware, agars, and reagents is approximately $18 per series of samples (an influent, a pre-disinfection effluent, and a final effluent sample). In a well set-up laboratory, the method requires 6 hours of time from initiating host to pouring plates. Hands on technician time to perform this test is significantly less on the order of 1-4 hours per test depending upon how many tests are done per day. There are no special skill sets required beyond those required to operate a state-approved shellfish laboratory under the NSSP. To standardize these assessments, an index of viral performance for use in the NSSP to determine classification options adjacent to WWTP outfall can be estimated. Subtracting the log value of final effluent score from the log value of the corresponding raw influent score will yield an index of viral performance ranging from 0 to 5. A viral index of 4 to 5 indicates 99.99% to 99.999% reduction of enteric viruses and would be consider high performance. A viral index of 1 to 2 indicates 90% to 95% reduction of enteric viruses through the treatment process and would be considered poor performance. A viral index <1 would be considered ineffective and should lead the SSCA to consider 10,000:1 rather than 1000:1 for the determination of the size of the prohibited zone adjacent to the outfall.
Proposal No. 15-114

21
C. Validation Criteria Determination of Optimal Optical Density of Famp Host (OD) Procedures for enumeration of double-agar overlay method for male-specific coliphage provide different ranges for OD of host growth. Effort was taken to determine the working range of the host E. coli at 520nm, which is the current EPA measurement. Graph 1 shows that at approximately 4 to 6 hours growth the OD520 of host is in the range of 0.35 to 0.6, during which time the MS2 plaquing efficiency of the host E. coli is optimal and consistent. Therefore, we conclude that a host OD520 of 0.35 to 0.7, or approximately 4 to 6 hours of growth, is ideal for MSC enumeration.
Graph 1. Optical Density (OD520) of E. coli HS(pFamp)RR in tryptone broth compared to plaque forming units (PFU) of MS2 coliphage. 10 ml of tryptone broth was inoculated with E. coli and incubated at 35ºC. OD was measured every hour starting at t = 2 hours. At these intervals 100 µL of host was serially diluted and 100 µL of pre-determined dilutions were plated to determine CFU/mL. 200 µL of the same host sample was used to determine PFU/ml of stock MS2 controls. The Determination of LOD, LOQ, and Linear Range using the NSSP SOP for the Single Laboratory Validation of Marine Biotoxin and Non-MPN Based Microbiological Methods.
1.0E+02
1.0E+03
1.0E+04
1.0E+05
1.0E+06
1.0E+07
1.0E+08
1.0E+09
0
0.1
0.2
0.3
0.4
0.5
0.6
0.7
0 2 4 6 8 10
CFU/m
lorPFU/m
l(Log 1
0)
OpticalDensity(OD520)
Time(hours)
OD520
PFU/ml
CFU/ml
Proposal No. 15-114
22
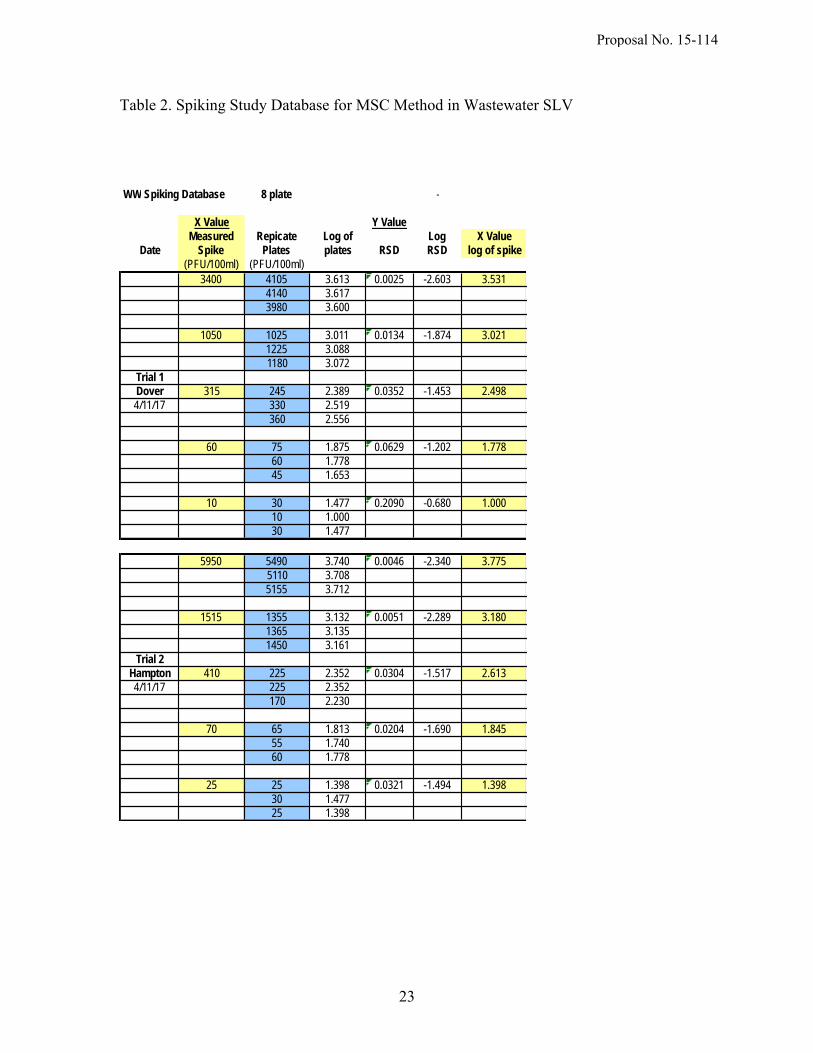
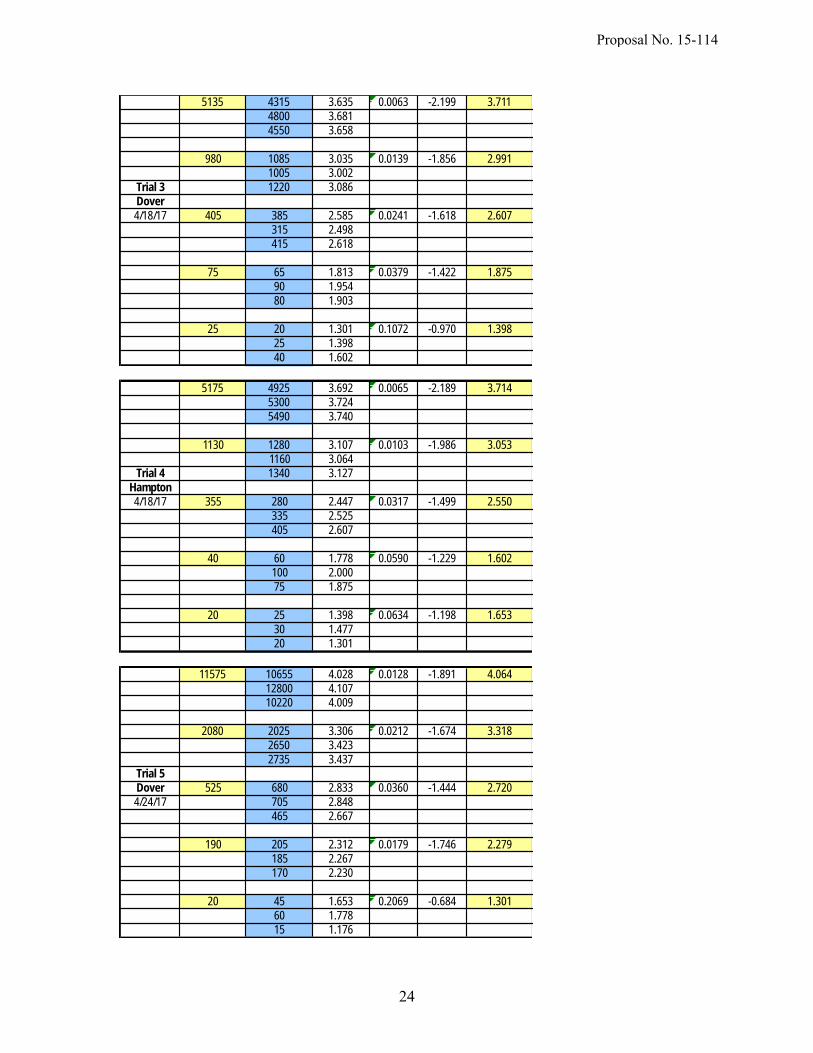
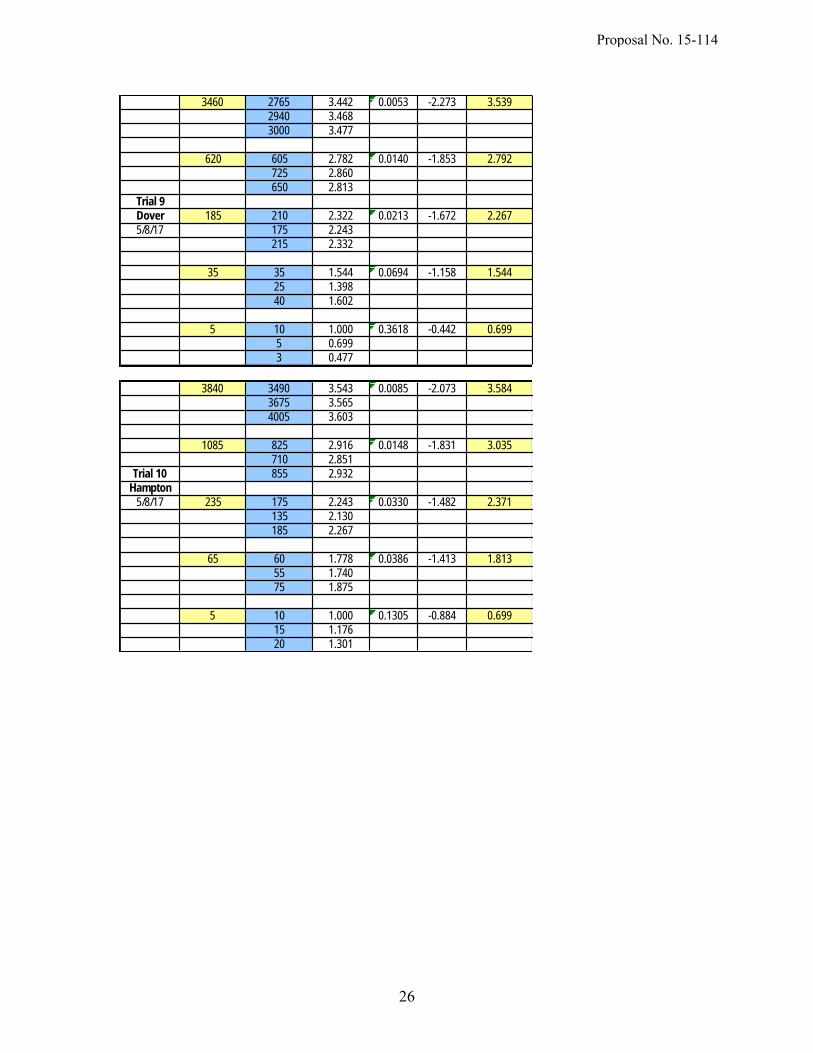
The SOP for the determination of LOQ, LOD, and the Linear Range is the most robust of the SOPs and yields a database from which subsets of data can be use to generate other validation criteria. For this database ten trials were run using clean effluent samples. Great effort was taken to find and verify clean effluent. The Dover, NH WWTP and the Hampton, NH WWTP were identified as high performing plants of different design capable of consistently producing clean effluent. Table 1 list the metadata for the effluent samples collected for these trials Table 1. Effluent Samples used for the Determination of LOD, LOQ, Linear Range Trial # Date Sampled WWTP Treatment Process 1 4/11/17 Dover Tertiary, UV Dis-infection 2 4/11/17 Hampton Secondary, Chlorine 3 4/18/17 Dover Tertiary, UV Dis-infection 4 4/18/17 Hampton Secondary, Chlorine 5 4/24/17 Dover Tertiary, UV Dis-infection 6 4/24/17 Hampton Secondary, Chlorine 7 5/1/17 Dover Tertiary, UV Dis-infection 8 5/1/17 Hampton Secondary, Chlorine 9 5/8/17 Dover Tertiary, UV Dis-infection 10 5/8/17 Hampton Secondary, Chlorine For each of the 10 validation trials, 150 ml of clean effluent sample was aseptically transferred into 5-200ml sterile dilution bottles. A master spike solution was prepared in growth broth and was varied in concentration during the trials. The master spike solution was on the order of 103 MSC/ml. Four subsequent serial dilutions were made for each trial from the master spike at a 3:1 dilutions. This represented different spike concentrations over the working range of the method. The 5 dilution bottles were asceptically spiked with 5 ml of spike concentration 1 through 5, shaken vigourously and then 4 aliquots of 30 ml were transferred into 4-50 ml sterile conical tubes for each spike concentration (3 conical tubes for the replicates and a 4th tube for spike determination). In this way, 3 true replicates were generated at each of the 5 spike concentrations. This methodology was consistently applied throughout the ten trials. The 5 sets of 3 aliquots were processed and plated according to the method description above. Clean effluent was used instead of growth broth for the spike determination. Spike determinations using growth broth were underestimating the sample results. This problem was solved by using the same clean effluent similiarly spiked. This strategy was employed as there is no standard method available for a truly independant spike determinations. Table 2 below shows the Spiking Study Database for MSC Method in Wastewater SLV. Spike Concentrations and MSC replicate plate count results are in units of PFU of MSC/100ml.
Proposal No. 15-114
23
Table 2. Spiking Study Database for MSC Method in Wastewater SLV
WW Spiking Database 8 plate -
X Value Y ValueMeasured Repicate Log of Log X Value
Date Spike Plates plates RSD RSD log of spike(PFU/100ml) (PFU/100ml)
3400 4105 3.613 0.0025 -2.603 3.5314140 3.6173980 3.600
1050 1025 3.011 0.0134 -1.874 3.0211225 3.0881180 3.072
Trial 1Dover 315 245 2.389 0.0352 -1.453 2.4984/11/17 330 2.519
360 2.556
60 75 1.875 0.0629 -1.202 1.77860 1.77845 1.653
10 30 1.477 0.2090 -0.680 1.00010 1.00030 1.477
5950 5490 3.740 0.0046 -2.340 3.7755110 3.7085155 3.712
1515 1355 3.132 0.0051 -2.289 3.1801365 3.1351450 3.161
Trial 2Hampton 410 225 2.352 0.0304 -1.517 2.6134/11/17 225 2.352
170 2.230
70 65 1.813 0.0204 -1.690 1.84555 1.74060 1.778
25 25 1.398 0.0321 -1.494 1.39830 1.47725 1.398
Proposal No. 15-114
24
5135 4315 3.635 0.0063 -2.199 3.7114800 3.6814550 3.658
980 1085 3.035 0.0139 -1.856 2.9911005 3.002
Trial 3 1220 3.086Dover4/18/17 405 385 2.585 0.0241 -1.618 2.607
315 2.498415 2.618
75 65 1.813 0.0379 -1.422 1.87590 1.95480 1.903
25 20 1.301 0.1072 -0.970 1.39825 1.39840 1.602
5175 4925 3.692 0.0065 -2.189 3.7145300 3.7245490 3.740
1130 1280 3.107 0.0103 -1.986 3.0531160 3.064
Trial 4 1340 3.127Hampton4/18/17 355 280 2.447 0.0317 -1.499 2.550
335 2.525405 2.607
40 60 1.778 0.0590 -1.229 1.602100 2.00075 1.875
20 25 1.398 0.0634 -1.198 1.65330 1.47720 1.301
11575 10655 4.028 0.0128 -1.891 4.06412800 4.10710220 4.009
2080 2025 3.306 0.0212 -1.674 3.3182650 3.4232735 3.437
Trial 5Dover 525 680 2.833 0.0360 -1.444 2.7204/24/17 705 2.848
465 2.667
190 205 2.312 0.0179 -1.746 2.279185 2.267170 2.230
20 45 1.653 0.2069 -0.684 1.30160 1.77815 1.176
Proposal No. 15-114

25
12210 11140 4.047 0.0076 -2.121 4.08712165 4.08510580 4.024
2555 2720 3.435 0.0058 -2.239 3.4072510 3.4002520 3.401
Trial 6Hampton 495 555 2.744 0.0395 -1.403 2.6954/24/17 350 2.544
395 2.597
85 90 1.954 0.1082 -0.966 1.929110 2.04145 1.653
20 20 1.301 0.1396 -0.855 1.30135 1.54415 1.176
4430 3530 3.548 0.0131 -1.882 3.6464370 3.6404075 3.610
1035 1100 3.041 0.0256 -1.592 3.015780 2.892880 2.944
Trial 7 240 275 2.439 0.0188 -1.727 2.380Dover 230 2.3625/1/17 230 2.362
65 80 1.903 0.1126 -0.949 1.81375 1.87535 1.544
10 20 1.301 0.1305 -0.884 1.00015 1.17610 1.000
4110 4415 3.645 0.0147 -1.833 3.6145630 3.7515260 3.721
1125 955 2.980 0.0253 -1.596 3.0511060 3.0251350 3.130
Trial 8 245 315 2.498 0.0336 -1.474 2.389Hampton 450 2.653
5/1/17 325 2.512
40 35 1.544 0.1040 -0.983 1.60255 1.74080 1.903
10 10 1.000 0.1580 -0.801 1.00010 1.00020 1.301
Proposal No. 15-114
26
3460 2765 3.442 0.0053 -2.273 3.5392940 3.4683000 3.477
620 605 2.782 0.0140 -1.853 2.792725 2.860650 2.813
Trial 9Dover 185 210 2.322 0.0213 -1.672 2.2675/8/17 175 2.243
215 2.332
35 35 1.544 0.0694 -1.158 1.54425 1.39840 1.602
5 10 1.000 0.3618 -0.442 0.6995 0.6993 0.477
3840 3490 3.543 0.0085 -2.073 3.5843675 3.5654005 3.603
1085 825 2.916 0.0148 -1.831 3.035710 2.851
Trial 10 855 2.932Hampton
5/8/17 235 175 2.243 0.0330 -1.482 2.371135 2.130185 2.267
65 60 1.778 0.0386 -1.413 1.81355 1.74075 1.875
5 10 1.000 0.1305 -0.884 0.69915 1.17620 1.301
Proposal No. 15-114

27
The replicate plate count results were log transformed and the relative standard deviation (RSD) were calculated. The RSD or coefficient of variation was plotted against the spike concentration and appears in Graph 2 below.
Graph 2. Coefficient of Variation verses Spike Concentration for Clean Effluent
To accurately determine the LOD and LOQ graphically, it was necessary to take the Coefficient of Variation and the Spike Determinations and to re-plot these as log values. Graph 3 below show the linear regression of the log transformed replicate and spiking data. Graphically, the LOQ/sensitivity of the method may be found at the point of intersection of the log spike concentration and the log coefficient of variation of –1.0 (or its antilog, 10%). The LOD may be found at the point of intersection of the log spike concentration and the log coefficient of variation of –0.477 (or its antilog of, 33%). Taking the antilog of the spike concentrations at these points of intersection gives the LOQ and LOD, respectively. Graph 3 indicates the LOQ and LOD for clean effluent to be 5.8 PFU/100gm and 0.9 PFU/100ml, respectively. The biostatistics program Prism 5.0 for Mac OS was used linear regression analysis and plots. The statistical summary of the linear regression from the log coefficient of variation verses log spike for the clean effluent data is presented in Table 3.
1 10 100 1000 10000 1000000.001
0.01
0.1
1
Spike Value (PFU/100ml)
Co
eff
icie
nt o
f Va
ria
tion
Dover WTP (Tertiery UV)Hampton WTP (2nd Chorine)
Proposal No. 15-114
28
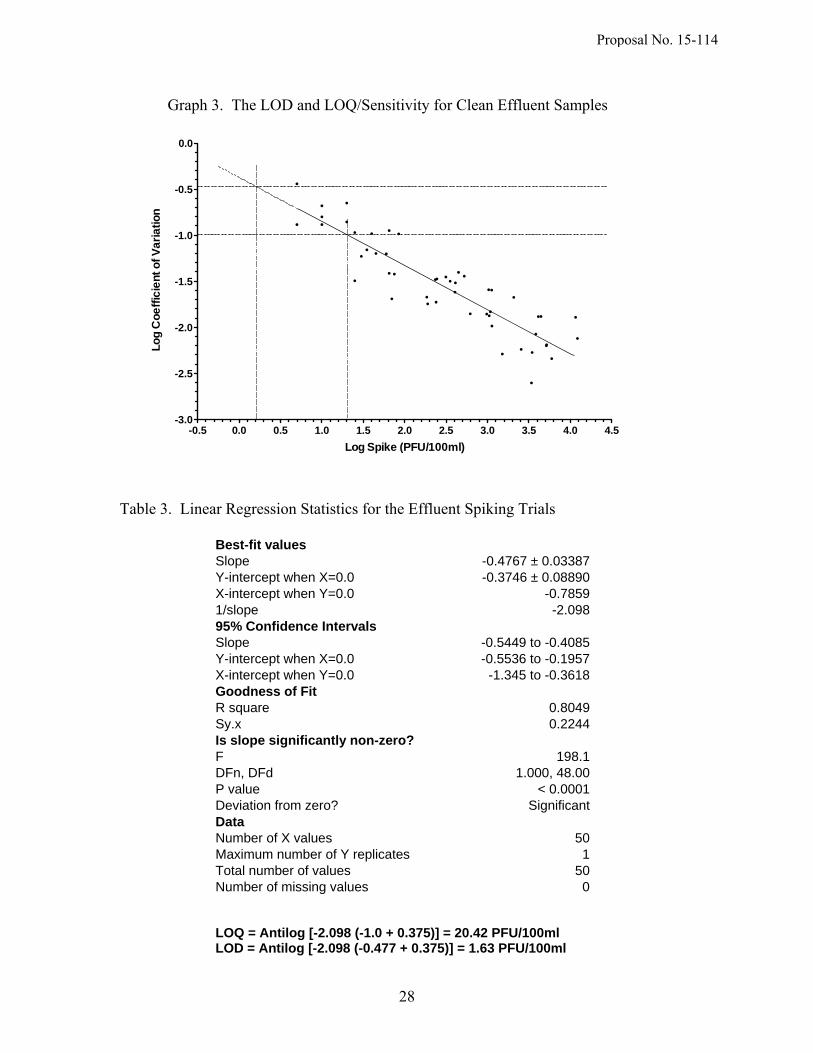
Graph 3. The LOD and LOQ/Sensitivity for Clean Effluent Samples
Table 3. Linear Regression Statistics for the Effluent Spiking Trials
Best-fit values Slope -0.4767 ± 0.03387 Y-intercept when X=0.0 -0.3746 ± 0.08890 X-intercept when Y=0.0 -0.7859 1/slope -2.098 95% Confidence Intervals Slope -0.5449 to -0.4085 Y-intercept when X=0.0 -0.5536 to -0.1957 X-intercept when Y=0.0 -1.345 to -0.3618 Goodness of Fit R square 0.8049 Sy.x 0.2244 Is slope significantly non-zero? F 198.1 DFn, DFd 1.000, 48.00 P value < 0.0001 Deviation from zero? Significant Data Number of X values 50 Maximum number of Y replicates 1 Total number of values 50 Number of missing values 0 LOQ = Antilog [-2.098 (-1.0 + 0.375)] = 20.42 PFU/100ml LOD = Antilog [-2.098 (-0.477 + 0.375)] = 1.63 PFU/100ml
-0.5 0.0 0.5 1.0 1.5 2.0 2.5 3.0 3.5 4.0 4.5-3.0
-2.5
-2.0
-1.5
-1.0
-0.5
0.0
Log Spike (PFU/100ml)
Lo
g C
oe
ffic
ien
t of V
ari
atio
n
Proposal No. 15-114

29
The correlation coefficient (R square value) of this linear regression is 0.8049 which is above the threshold level of 0.64 and indicates a good fit. The LOD and LOQ as determined by the spiking trials shows LOD and LOQ of 1.63 PFU/100ml and 20.42 PFU/100ml, respectively. Rounding up, the LOD and LOQ are 2 PFU/100ml and 21 PFU/100ml, respectively. To determine the Linear Range, data from Table 2 was manipulated to construct the relative response line, the line of constant response and the upper and lower 95% confidence interval bracketing the line of constant response as instructed in the SOP. Graph 4 below show that the upper (1.05) and the lower (.95) 95% confidence interval estimates are essentially parallel to the Relative Response line. This suggests that the method is linear through the working range of 5 PFU/100ml to 12,000 PFU/100ml.
Graph 4. Linear Range Determination
Data Summary: Linear range of the method as implemented 5 to 12,000 PFU/100ml The limit of detection of the method as implemented 2 PFU/100ml The limit of quantitation/sensitivity of the method as implemented 21 PFU/100ml Indeterminates <2 PFU/100ml to >12,000 PFU/100ml
0 1 2 3 4 50.5
1.0
1.5
2.0
log spike
Res
po
nse
Line of Constant Response
Relative Response Line
Lower 95% Confidence Interval of the Line of Constant Response
log replicate response
mean log replicate response
Upper 95% Confidence Interval of the Line of Constant Response
Proposal No. 15-114
30
The Determination of Accuracy/Trueness and Measurement Uncertainty is based upon the NSSP SOP for the Single Laboratory Validation of Marine Biotoxin and Non-MPN Based Microbiological Methods using the more robust databases acquired from the determination of the LOQ/LOD/Linear Range. The Accuracy/Trueness is calculated by dividing the log average of the plates by the log average of the spike concentrations, then multiplying the result by 100 to get a percent value. Table 4 shows the results for the Accuracy/Trueness of the method.
Table 4. Calculation of the Accuracy/Trueness of the MSC Method for Wastewater (Low Range Routine). Average log of plates (2.473 PFU/100ml)/Average log of spike (2.455 PFU/100ml) = Accuracy/Trueness of 100.7 %.
The Measurement Uncertainty is determined by subtracting the log mean replicate plate values from the reference or log spike values, then calculating the 95% confidence limits of the mean difference. Table 5 show the results of statistical analyis for Method Uncertainty.
Table 5 – Measurement Uncertainty in wastewater using low range routine. Antilog Number of values 150 Mean -0.01787 0.960 Std. Deviation 0.1566 Std. Error 0.01278 Lower 95% CI of mean -0.04314 0.905 Upper 95% CI of mean 0.00739 1.017 Data Summary: Wastewater using Low Range Routine Calculated % accuracy/trueness 100.7 % Calculated measurement uncertainty 0.905 to 1.017
The Determination of the Precision and Recovery is based upon the NSSP SOP for the Single Laboratory Validation of Marine Biotoxin and Non-MPN Based Microbiological Methods using the more robust data set acquired from the determination of the LOQ/LOD/Linear Range. To examine the precision over the working range of the method, a simple graphical approach was followed. The coefficients of variation were determined from the log transformed replicate data (50 sets of three true replicates) and were plotted verses the mean of the triplicate results (non log transformed data). The results are shown in Graph 5 for effluent using the low range routine.
Proposal No. 15-114

31
Graph 5 - Coefficient of Variability (%) of Replicate verses Mean of Replicate for Effluent Samples using the Low Range Routine of the Method.
In Graph 4 above, the precision decreases as the LOQ and LOD are approached. The mean, minimum, and maximum coefficient of variations as determined over the working range for effluent samples appear in Table 6 below.
Table 6 – Mean, Minimum, and Maximum Coefficient of Variation over the Working Ranges. Average Coefficient of Variation = 2.47% Minimum Coefficient of Variation = 0.25% Maximum Coefficient of Variation = 36.2%
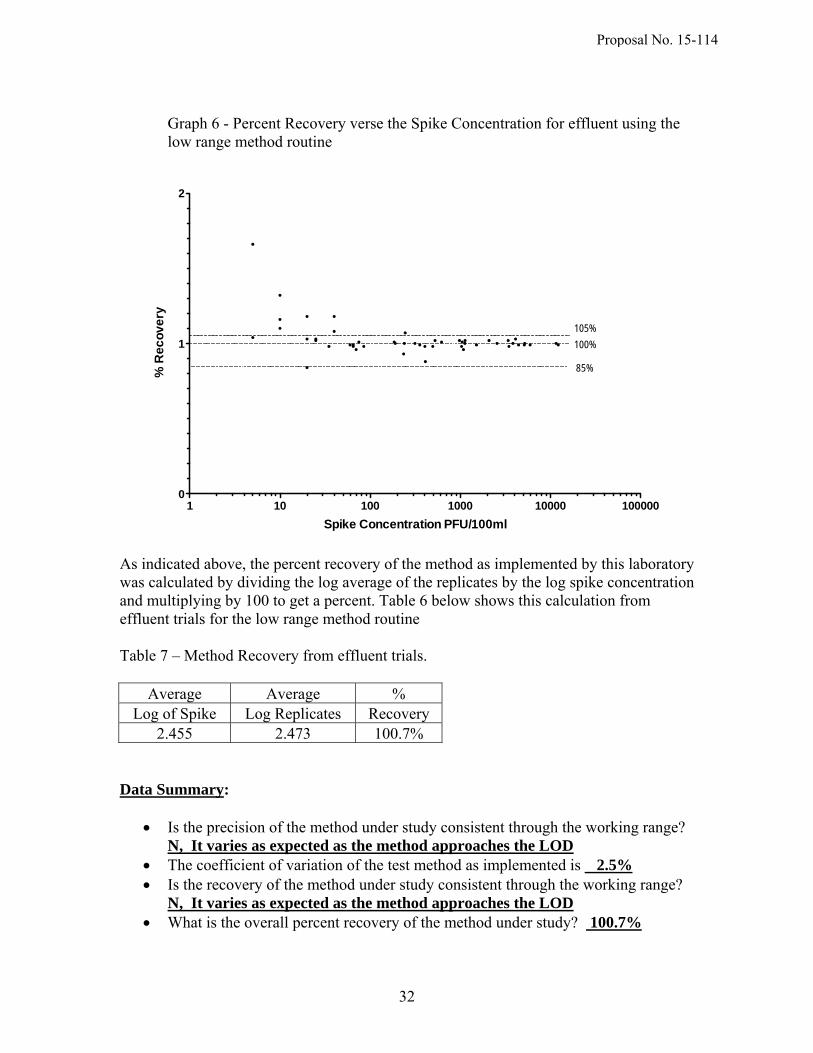
To examine the Recovery over the working range of the method, a simple graphical approach was followed. The data from the LOD/LOQ/Linear Range was used for this determination. The mean of replicates was divided by the spike concentration. The percent recovery was then plotted against the spike concentrations. Graph 6 show these recovery plots with the recoveries bracketed at 85% and 105% for clean wastewater samples using the low range method routine. Recovery by the method is highly variable due to the problems associated with spike determinations. However, recovery for the method over all is high at 98.8%. (see Table 7)
1 10 100 1000 10000 1000000
5
10
15
20
25
30
35
40
Mean of Replicates
Co
eff
icie
nt o
f Va
ria
tion
%
Average CV overWorking Range - 2.47%
Precision at LOQ approached 10%
Proposal No. 15-114
32
Graph 6 - Percent Recovery verse the Spike Concentration for effluent using the low range method routine
As indicated above, the percent recovery of the method as implemented by this laboratory was calculated by dividing the log average of the replicates by the log spike concentration and multiplying by 100 to get a percent. Table 6 below shows this calculation from effluent trials for the low range method routine Table 7 – Method Recovery from effluent trials.
Average Average % Log of Spike Log Replicates Recovery
2.455 2.473 100.7% Data Summary:
Is the precision of the method under study consistent through the working range? N, It varies as expected as the method approaches the LOD
The coefficient of variation of the test method as implemented is 2.5% Is the recovery of the method under study consistent through the working range?
N, It varies as expected as the method approaches the LOD What is the overall percent recovery of the method under study? 100.7%
1 10 100 1000 10000 1000000
1
2
Spike Concentration PFU/100ml
% R
ec
ov
ery
105%
100%
85%
Proposal No. 15-114
33
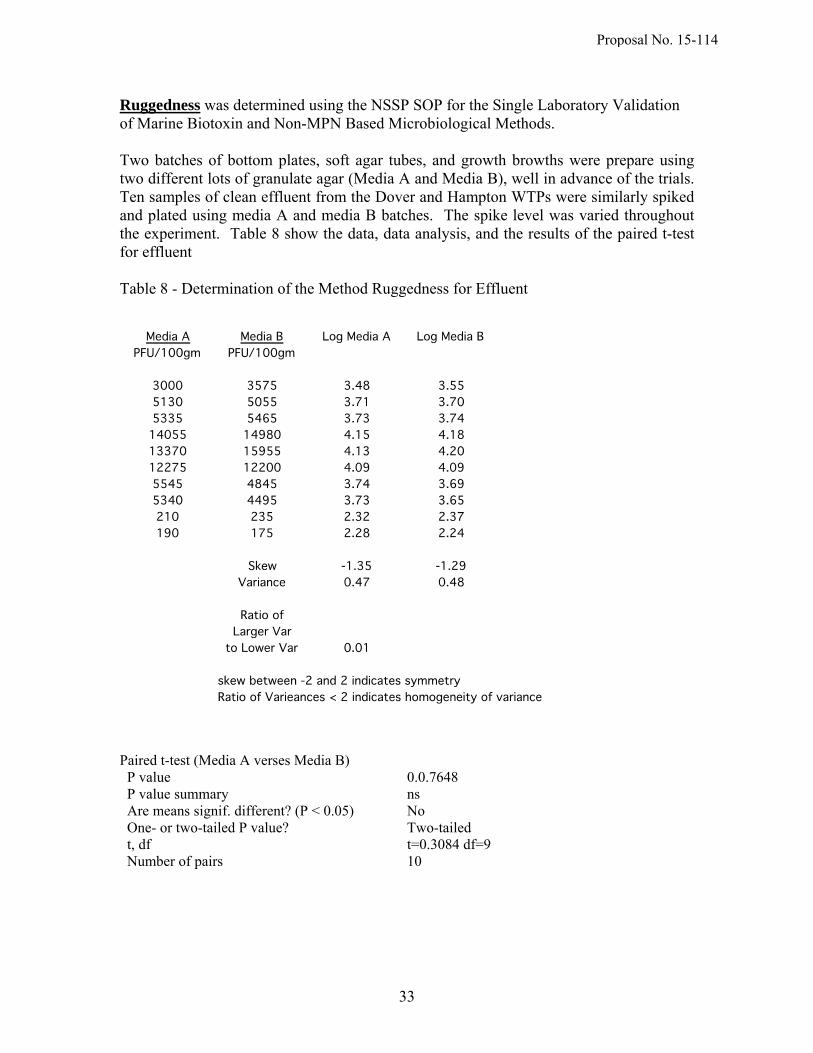
Ruggedness was determined using the NSSP SOP for the Single Laboratory Validation of Marine Biotoxin and Non-MPN Based Microbiological Methods. Two batches of bottom plates, soft agar tubes, and growth browths were prepare using two different lots of granulate agar (Media A and Media B), well in advance of the trials. Ten samples of clean effluent from the Dover and Hampton WTPs were similarly spiked and plated using media A and media B batches. The spike level was varied throughout the experiment. Table 8 show the data, data analysis, and the results of the paired t-test for effluent Table 8 - Determination of the Method Ruggedness for Effluent
Paired t-test (Media A verses Media B) P value 0.0.7648 P value summary ns Are means signif. different? (P < 0.05) No One- or two-tailed P value? Two-tailed t, df t=0.3084 df=9 Number of pairs 10
Proposal No. 15-114

34
Data Summary: Value for the test of symmetry of the distribution of Media A data -1.35 Value for the test of symmetry of the distribution of Media B data -1.29 Variance of Media A data .0.47 Variance of Media B data .0.48 Ratio of the larger to the smaller of the variances of Media A and Media B 0.01 Is there a significant difference between Media A and Media N
Proposal No. 15-114