
Method 1698: Steroids and Hormones in Water, Soil, Sediment, and ...
69
Method 1698: Steroids and Hormones in Water, Soil, Sediment, and Biosolids by HRGC/HRMS December 2007
Transcript of Method 1698: Steroids and Hormones in Water, Soil, Sediment, and ...

Method 1698: Steroids and Hormones in Water, Soil, Sediment, and Biosolids by HRGC/HRMS
December 2007

Method 1698 December 2007
U.S. Environmental Protection Agency Office of Water
Office of Science and Technology Engineering and Analysis Division (4303T)
1200 Pennsylvania Avenue, NW Washington, DC 20460
EPA-821-R-08-003 December 2007
ii

Method 1698 December 2007
Introduction
EPA Method 1698 determines steroids and hormones in environmental samples by isotope dilution and internal standard high resolution gas chromatography combined with high resolution mass spectrometry (HRGC/HRMS). EPA Method 1698 was developed for use with aqueous, solid, and biosolids matrices.
Disclaimer
This method has been reviewed by the Engineering and Analytical Support Branch of the Engineering and Analysis Division (EAD) in OST. The method is available for general use, but has not been published in 40 CFR Part 136. Mention of trade names or commercial products does not constitute endorsement or recommendation for use.
Contacts
Questions concerning this method or its application should be addressed to:
Brian Englert, Ph.D. Environmental Scientist Engineering & Analytical Support Branch Engineering and Analysis Division (4303T) Office of Science and Technology, Office of Water U.S. Environmental Protection Agency 1200 Pennsylvania Avenue NW Washington, D.C. 20460 http://www.epa.gov/waterscience [email protected]
iii

Method 1698 December 2007
Table of Contents
Introduction..............................................................................................................................................................
..............................................................................................................................
...................................................................................................................................
...........................................................................................................
................................................................................................................................................
.............................................................................................................................................................
..........................................................................................................................
iii
1.0 Scope and Application 1
2.0 Summary of Method 2
3.0 Definitions and Units of Measure 3
4.0 Interferences 3
5.0 Safety 5
6.0 Equipment and Supplies 6
7.0 Reagents and Standards ........................................................................................................................
.................................................................................
..........................................................................................................................................
...........................................................................................................
.................................................................................................................................
...............................................................................................................
....................................................................................................................
.............................................................................................................................
10
8.0 Sample Collection, Preservation, and Storage 14
9.0 Quality Control 16
10.0 Calibration and Standardization 20
11.0 Sample Preparation 25
12.0 Extraction and Concentration 31
13.0 Cleanup and Derivatization 37
14.0 HRGC/HRMS Analysis 39
15.0 System and Laboratory Performance .................................................................................................
.......................................................................................................................
....................................................................................................................
..............................................................................................................
................................................................................................................................
..................................................................................................................................
40
16.0 Qualitative Determination 42
17.0 Quantitative Determination 43
18.0 Analysis of Complex Samples 46
19.0 Pollution Prevention 47
20.0 Waste Management 47
21.0 Method Performance ...............................................................................................................................
.................................................................................................................................................
..........................................................................................................................................................
......................................................................................................................................................
47
22.0 References 48
23.0 Tables 49
24.0 Glossary 61
iv

.....................................................................................................................
Method 1698 December 2007
25.0 Definitions and Acronyms 62
v

Method 1698 December 2007
EPA Method 1698 Steroids and Hormones in Water, Soil,
Sediment, and Biosolids by HRGC/HRMS
1.0 Scope and Application
1.1 EPA Method 1698 is for determination of steroids and hormones in multi-media environmental samples by high resolution gas chromatography combined with high resolution mass spectrometry (HRGC/HRMS).
1.2 This method was developed for use in Clean Water Act (CWA) programs; other applications are possible. Technologies and quantitation techniques in this method are based on existing EPA methods (Reference 1) and on procedures developed at Axys Analytical (Reference 2).
1.3 The target analytes that may be measured by this method and their corresponding Chemical Abstracts Service Registry Numbers are listed in Table 1.
1.4 The detection limits and quantitation levels in this method are usually dependent on the level of interferences rather than instrumental limitations. The method detection limits (MDLs; 40 CFR 136, appendix B) and minimum levels of quantitation (MLs; 68 CFR 11790) in Table 2 are the levels at which steroids and hormones can be determined in the absence of interferences.
1.5 This method is restricted for use by analysts experienced in HRGC/HRMS or under the close supervision of such qualified persons. Each laboratory that uses this method must demonstrate the ability to generate acceptable results using the procedure in Section 9.2.
1.6 This method is performance-based which means that you may modify the method to improve performance (e.g., to overcome interferences or improve the accuracy or precision of the results) provided that you meet all performance requirements in this method. These requirements for establishing equivalency of a modification are in Section 9.1.2. For Clean Water Act (CWA) uses, additional flexibility is described at 40 CFR 136.6. Modifications not in the scope of Part 136.6 or in Section 9 of this method may require prior review and approval.
1.7 Some of the compounds in this method are controlled substances. Laboratories performing this method should have all appropriate licenses and certifications and obtain all needed standards and chemicals from licensed sources. For some of the compounds in this method it may be necessary for laboratories to obtain a DEA license.
1.8 This method does not measure steroid conjugates.
1
Method 1698 December 2007
2.0 Summary of Method
This method involves solvent extraction of the sample, followed by cleanup with a layered alumina/Florisil column, and an option to remove sulfur using copper. Following cleanup, the target analytes are derivatized to make them sufficiently volatile for analysis by GC/HRMS. Quantitation is performed by isotope dilution and internal standard techniques, depending on the analyte and the availability of labeled analogs. These procedures are summarized below.
2.1 Extraction
2.1.1 Aqueous samples absent visible particles – Stable isotopically labeled analogs of the steroids and hormones are spiked into a 1-L sample. The sample is extracted with methylene chloride using separatory funnel extraction (SFE) or continuous liquid/liquid extraction (CLLE).
2.1.2 Solid and semi-solid samples, including aqueous samples with visible particles (excluding biosolids) – The labeled compounds are spiked into a sample aliquot that contains 10 g dry weight of solids. Mixed-phase aqueous samples are filtered. The aqueous phase is extracted as above (Section 2.1.1). Solids are ground or homogenized (if required), mixed with anhydrous sodium sulfate, dried for a minimum of 30 minutes, and extracted for 16-24 hours using hexane:acetone in a Soxhlet extractor.
2.1.3 Biosolids – The labeled compounds are spiked into a sample containing 0.25 g (dry weight) of solids. Cholesterol-d7 is spiked at a concentration 10 times higher than in solid and semi-solid samples to account for the high concentration of cholesterol found in biosolids. The sample is mixed with anhydrous sodium sulfate, dried for a minimum of 30 minutes, and extracted for 16-24 hours using hexane:acetone in a Soxhlet extractor.
2.2 Cleanup – If necessary, extracts from aqueous and solids samples can be cleaned up using a layered alumina/Florisil column. If necessary, copper is used to remove sulfur. Use of layered alumina/Florisil may not be required for some aqueous samples.
2.3 Derivatization
Following cleanup, the sample extract is concentrated to approximately 0.1 mL. The solvent is exchanged to pyridine and the steroids/hormones are derivatized to their trimethylsilyl-ethers using N,O-Bis(trimethylsilyl) trifluoroacetamide with trimethylchlorosilane (BSTFA:TMCS). A labeled injection internal standard (Pyrene-d10) is spiked into the extract and the final volume is adjusted to either 500 μL for complex wastewaters (e.g., untreated effluents, in-process streams) or samples containing solids, or to 20 µL for clean wastewaters (e.g., ambient waters, finished drinking waters, secondary biologically treated effluents).
2.4 GC/HRMS Analysis
2.4.1 An aliquot of the extract is injected into the gas chromatograph (GC). The analytes are separated by the GC and detected by a high-resolution (∃5,000) mass spectrometer. Two exact m/zs are monitored for each
2

Method 1698 December 2007
steroid, hormone, and labeled compound throughout a pre-determined retention time window.
2.4.2 An individual steroid or hormone is identified by comparing the GC retention time and ion-abundance ratio of two exact m/zs with the corresponding retention time of an authentic standard and the theoretical or acquired ion-abundance ratio of the two exact m/zs. A compound is identified when the retention times and ratios agree.
2.4.3 Quantitative analysis is performed in one of two ways using selected ion current profile (SICP) areas:
For a steroid or hormone for which a labeled analog is available, the concentration is determined using the isotope dilution technique. For a steroid or hormone for which a labeled analog is not available, the concentration is determined using the internal standard technique.
The concentrations of the labeled compounds are determined using the internal standard technique and the recovery of each labeled compound is compared to acceptance criteria provided in Table 5.
Additional labeled compounds may be incorporated into this method and the concentration of the native compound may be determined using the isotope dilution technique provided that all performance requirements in this method are met. Requirements for establishing equivalency are given in Section 9.1.2, and additionally for CWA uses, at 40 CFR 136.6.
2.5 The quality of the analysis is assured through reproducible calibration and testing of the extraction, cleanup, derivatization, and HRGC/HRMS systems.
3.0 Definitions and Units of Measure
Definitions and units of measure are given in the glossary at the end of this method.
4.0 Interferences
4.1 Solvents, reagents, glassware, and other sample processing hardware may yield artifacts, elevated baselines, and/or lock-mass suppression causing misinterpretation of chromatograms. Specific selection of reagents and purification of solvents by distillation in all-glass systems may be required. Where possible, reagents are cleaned by extraction or solvent rinse.
4.2 Proper cleaning of glassware is extremely important, because glassware may not only contaminate the samples but may also remove the analytes of interest by adsorption on the glass surface.
4.2.1 Glassware should be rinsed with solvent and washed with a detergent solution as soon after use as is practical. Sonication of glassware containing a detergent solution for approximately 30 seconds may aid in cleaning. Glassware with
3

Method 1698 December 2007
removable parts, particularly separatory funnels with fluoropolymer stopcocks, must be disassembled prior to detergent washing.
4.2.2 After detergent washing, glassware should be rinsed immediately, first with methanol, then with hot tap water. The tap water rinse is followed by another methanol rinse, then acetone, and then methylene chloride.
4.2.3 Baking of glassware in a kiln or other high temperature furnace (300 - 500 ΕC) may be warranted after particularly dirty samples are encountered. The kiln or furnace should be vented to prevent laboratory contamination by steroid/hormone vapors. Baking should be minimized, as repeated baking of glassware may cause active sites on the glass surface that may irreversibly adsorb the steroids and hormones. Volumetric ware should not be baked at high temperature. Silanization may also be used to deactivate active sites on glassware.
4.2.4 After drying and cooling, glassware should be sealed and stored in a clean environment to prevent accumulation of dust or other contaminants. Store inverted or capped with aluminum foil.
4.2.5 Immediately prior to use, the Soxhlet apparatus should be pre-extracted for approximately 3 hours and the extraction apparatus should be rinsed with the extraction solvent.
4.3 All materials used in the analysis must be demonstrated to be free from interferences by running reference matrix method blanks (Section 9.5) initially and with each sample batch (samples started through the extraction process on a given 12-hour shift, to a maximum of 20 samples).
4.3.1 The reference matrix must simulate, as closely as possible, the sample matrix under test. Ideally, the reference matrix should not contain the analytes in detectable amounts, but should contain potential interferents in the concentrations expected to be found in the samples to be analyzed.
4.3.2 When a reference matrix that simulates the sample matrix under test is not available, reagent water (Section 7.6.1) can be used to simulate water samples; playground sand (Section 7.6.2) or white quartz sand (Section 7.3.2) can be used to simulate soils and biosolids.
4.4 Interferences co-extracted from samples will vary considerably from source to source, depending on the diversity of the site being sampled. Interfering compounds may be present at concentrations several orders of magnitude higher than the analytes in this method. The most frequently encountered interferences are humic and other acids, particularly in biosolids. Because very low levels of steroids and hormones are measured by this method, elimination of interferences is essential. The cleanup steps given in Section 13 can be used to reduce or eliminate these interferences and thereby permit reliable determination of the steroids and hormones at the levels shown in Table 2.
4.5 Each piece of reusable glassware should be numbered to associate that glassware with the processing of a particular sample. This will assist the laboratory in tracking possible sources of contamination for individual samples, identifying glassware associated with
4
Method 1698 December 2007
highly contaminated samples that may require extra cleaning, and determining when glassware should be discarded.
5.0 Safety
5.1 The toxicity or carcinogenicity of each chemical used in this method has not been precisely determined; however, each compound should be treated as a potential health hazard. Exposure to these compounds should be reduced to the lowest possible level.
5.1.1 Some steroids or hormones may be human or mammalian carcinogens. On the basis of the available toxicological and physical properties, pure standards of the compounds should be handled only by trained personnel thoroughly familiar with handling and cautionary procedures and the associated risks.
5.1.2 It is recommended that the laboratory purchase dilute standard solutions of the analytes in this method. However, if primary solutions are prepared, they should be prepared in a hood, and a NIOSH/MESA approved toxic gas respirator may be necessary when high concentrations are handled.
5.2 This method does not address all safety issues associated with its use. The laboratory is responsible for maintaining a current awareness file of OSHA regulations regarding the safe handling of the chemicals specified in this method. A reference file of material safety data sheets (MSDSs) should also be made available to all personnel involved in these analyses. It is also suggested that the laboratory perform personal hygiene monitoring of each analyst who uses this method and that the results of this monitoring be made available to the analyst. Additional information on laboratory safety can be found in References 3-5. The references and bibliography at the end of Reference 5 are particularly comprehensive in dealing with the general subject of laboratory safety.
5.3 The pure steroids/hormones and samples suspected to contain high concentrations of these compounds are handled using essentially the same techniques employed in handling radioactive or infectious materials. Well-ventilated, controlled access laboratories are required. Assistance in evaluating the health hazards of particular laboratory conditions may be obtained from consulting laboratories and from State Departments of Health or Labor, many of which have an industrial health service. Each laboratory must develop a strict safety program for handling these compounds.
5.3.1 Facility − When finely divided samples (dusts, soils, dry chemicals) are handled, all operations (including removal of samples from sample containers, weighing, transferring, and mixing) should be performed in a glove box demonstrated to be leak tight or in a fume hood demonstrated to have adequate air flow. Gross losses to the laboratory ventilation system must not be allowed. Handling of the dilute solutions normally used in analytical and animal work presents no inhalation hazards except in the case of an accident.
5

Method 1698 December 2007
5.3.2 Protective equipment − Disposable plastic gloves, apron or lab coat, safety glasses or mask, and a glove box or fume hood adequate for radioactive work should be used. During analytical operations that may give rise to aerosols or dusts, personnel should wear respirators equipped with activated carbon filters. Eye protection (preferably full face shields) should be worn while working with exposed samples or pure analytical standards. Latex gloves are commonly used to reduce exposure of the hands. When handling samples suspected or known to contain high concentrations of the compounds, an additional set of gloves can also be worn beneath the latex gloves.
5.3.3 Training − Workers must be trained in the proper method of removing contaminated gloves and clothing without contacting the exterior surfaces.
5.3.4 Personal hygiene − Hands and forearms should be washed thoroughly after each operation involving high concentrations of the analytes of interest, and before breaks (coffee, lunch, and shift).
5.3.5 Confinement − Isolated work areas posted with signs, segregated glassware and tools, and plastic absorbent paper on bench tops will aid in confining contamination.
5.3.6 Waste handling − Good technique includes minimizing contaminated waste. Plastic bag liners should be used in waste cans. Janitors and other personnel should be trained in the safe handling of waste. See Section 20 for additional information on waste handling and disposal.
5.4 Biosolids samples may contain high concentrations of biohazards, and must be handled with gloves and opened in a hood or biological safety cabinet to prevent exposure. Laboratory staff should know and observe the safety procedures required in a microbiology laboratory that handles pathogenic organisms when handling biosolids samples.
6.0 Equipment and Supplies
Note: Brand names, suppliers, and part numbers are cited for illustration purposes only. No endorsement is implied. Equivalent performance may be achieved using equipment and materials other than those specified here. Demonstration of equivalent performance that meets the requirements of this method is the responsibility of the laboratory.
6.1 Sample bottles and caps
6.1.1 Liquid samples (waters, sludges and similar materials containing 5 percent solids or less) – Sample bottle, amber glass, 1-L minimum, with screw cap.
6.1.2 Solid samples (soil, sediment, sludge, filter cake, compost, and similar materials that contain more than 5 percent solids) – Sample bottle, wide-mouth, amber glass, 500-mL minimum.
6

Method 1698 December 2007
6.1.3 If amber bottles are not available, samples must be protected from light.
6.1.4 Bottle caps – Threaded to fit sample bottles. Caps must be lined with fluoropolymer.
6.1.5 Cleaning – Bottles are washed with detergent and water, then solvent rinsed before use. Liners are washed with detergent and water and rinsed with reagent water before use.
6.2 Equipment for glassware cleaning
6.2.1 Laboratory sink with overhead fume hood
6.2.2 Kiln capable of reaching 450 °C within 2 hours and maintaining 450 - 500 ΕC within ∀10 ΕC, with temperature controller and safety switch (Cress Manufacturing Co, Santa Fe Springs, CA, B31H, X31TS, or equivalent). See the precautions in Section 4.2.3.
6.3 Compositing equipment – Automatic or manual compositing system incorporating glass containers cleaned per bottle cleaning procedure above. Only glass or fluoropolymer tubing must be used. If the sampler uses a peristaltic pump, a minimum length of compressible silicone rubber tubing may be used in the pump only. Before use, the tubing must be thoroughly rinsed with methanol, followed by repeated rinsing with reagent water to minimize sample contamination. An integrating flow meter is used to collect proportional composite samples.
6.4 Equipment for sample preparation
6.4.1 Laboratory fume hood of sufficient size to contain the sample preparation equipment listed below.
6.4.2 Glove box (optional)
6.4.3 Tissue homogenizer – VirTis Model 45 Macro homogenizer (American Scientific Products H-3515, or equivalent) with stainless steel Macro-shaft and Turbo-shear blade.
6.4.4 Vortex mixer
6.4.5 Ultrasonic mixer
6.4.6 Oven – Capable of maintaining a temperature of 110∀5 °C
6.4.7 Dessicator
6.4.8 Analytical balance – Capable of weighing 0.1 mg
6.4.9 Top loading balance – Capable of weighing 10 mg
7

Method 1698 December 2007
6.5 Apparatus for measuring pH
6.5.1 pH meter, with combination glass electrode
6.5.2 pH paper, wide range (Hydrion Papers, or equivalent)
6.6 Aqueous sample extraction apparatus
6.6.1 Graduated cylinder, 1-L capacity
6.6.2 Separatory funnels, 250-, 500-, 1000- and 2000-mL, with fluoropolymer stopcocks
6.6.3 Continuous liquid/liquid extraction (CLLE) – Fluoropolymer or glass connecting joints and stopcocks without lubrication, 1.5-2 L capacity (Hershberg-Wolf Extractor, Cal-Glass, Costa Mesa, California, 1000 mL or 2000 mL, or equivalent). CLLE is an option and is not required in separatory funnel procedures are used.
6.7 Solid sample extraction apparatus
6.7.1 Soxhlet extractor – 50-mm ID, 200-mL capacity with 500-mL flask (Cal-Glass LG-6900, or equivalent, except substitute 500-mL round-bottom flask for 300-mL flat-bottom flask)
6.7.2 Thimble – 43 Η 123 to fit Soxhlet (Cal-Glass LG-6901-122, or equivalent)
6.7.3 Heating mantle – Hemispherical, to fit 500-mL round-bottom flask (Cal-Glass LG-8801-112, or equivalent)
6.7.4 Variable transformer-Powerstat (or equivalent), 110-volt, 10-amp
6.8 Beakers and Erlenmeyer flasks – 250- , 400- , 500- , and 1000-mL
6.9 Spatulas – Stainless steel
6.10 Filtration apparatus
6.10.1 Pyrex glass wool – Solvent-extracted using a Soxhlet extractor for 3 hours minimum
6.10.2 Glass funnel – 125- to 250-mL
6.10.3 Glass-fiber filter paper – Whatman GF/D (or equivalent), to fit glass funnel in Section 6.10.2.
6.11 Centrifuge – Capable of rotating 500-mL centrifuge bottles or 50-mL centrifuge tubes at 5,000 rpm minimum, equipped with 500-mL centrifuge bottles with screw-caps, and 50-mL centrifuge tubes with screw-caps, to fit centrifuge. Bottles and tubes may be glass or plastic.
8

Method 1698 December 2007
6.12 Pipet apparatus and pipets
6.12.1 Pipetter – variable volume
6.12.2 Pipet tips – disposable polypropylene, sizes from 1 - 10 μL to 5 mL
6.12.3 Disposable – Pasteur, 150-mm long x 5-mm ID (Fisher Scientific 13-678-6A, or equivalent)
6.12.4 Disposable – Serological, 50-mL (8- to 10- mm ID)
6.13 Chromatographic column – 1 cm x 25 cm with 100- or 250- mL reservoir
6.14 Rotary evaporator – Buchi/Brinkman-American Scientific No. E5045-10, or equivalent, equipped with a variable temperature water bath and a vacuum source with shutoff valve at the evaporator and vacuum gauge. A recirculating water pump and chiller are recommended, as use of tap water for cooling the evaporator wastes large volumes of water and can lead to inconsistent performance as water temperatures and pressures vary. 6.14.1 Round-bottom flask – 100-mL and 500-mL or larger, with ground-glass fitting
compatible with the rotary evaporator
6.14.2 Boiling chips
6.14.2.1 Glass or silicon carbide – Approximately 10/40 mesh, extracted with methylene chloride and baked at 450 ΕC for one hour minimum
6.14.2.1 Fluoropolymer (optional) − Extracted with methylene chloride
6.15 Nitrogen evaporation apparatus – Equipped with water bath controlled in the range of 30 60 ΕC (N-Evap, Organomation Associates, Inc., South Berlin, MA, or equivalent), installed in a fume hood.
6.16 Amber glass vials – 2- to 5-mL with fluoropolymer-lined screw-cap
6.17 GC autosampler vials – Glass, 0.8- to 2.0- mL, conical, with fluoropolymer-lined screw or crimp cap
6.18 Gas chromatograph – Must have splitless or on-column injection port for capillary column, temperature program with isothermal holds, and must meet all of the performance specifications in Section 10.
6.18.1 GC column – 30 ∀ 5-m long x 0.25 ∀ 0.02-mm ID; 0.25-μm film (Restek RTX-5, or equivalent)
6.18.2 The GC column must resolve coprostanol and epicoprostanol to a valley height less than 20 percent of the shorter of the two peaks.
6.18.3 Alternative columns have not been tested and therefore are not permitted except as
9
Method 1698 December 2007
noted above. In a future version of this method EPA may provide criteria for determining equivalency of alternative columns.
6.19 Mass spectrometer – 28- to 40-eV electron impact ionization, must be capable of selectively monitoring a minimum of 22 exact m/zs at high resolution (∃5,000) during a period less than 1.5 seconds, and must meet all of the performance specifications in Section 10.
6.20 GC/MS interface – The mass spectrometer (MS) must be interfaced to the GC such that the end of the capillary column terminates within 1 cm of the ion source but does not intercept the electron or ion beams.
6.21 Data system – Capable of collecting, recording, storing, and processing MS data
6.21.1 Data acquisition – The signal at each exact m/z must be collected repetitively throughout the monitoring period and stored on a mass storage device.
6.21.2 Response factors and multipoint calibrations – The data system must record and maintain lists of response factors (response ratios for isotope dilution) and multipoint calibrations. Computations of relative standard deviation (RSD) are used to test calibration linearity. Statistics on initial (Section 9.4) and ongoing (Section 15.5.4) performance should be computed and maintained, either on the instrument data system, or on a separate computer system.
7.0 Reagents and Standards
Note: All reagents are ACS Reagent Grade unless specified otherwise.
7.1 pH adjustment and stabilization solutions
7.1.1 Potassium hydroxide – Dissolve 20 g reagent grade KOH in 100 mL reagent water.
7.1.2 Sulfuric acid – Reagent grade (specific gravity 1.84)
7.1.3 Hydrochloric acid – Reagent grade, 6N
7.1.4 Sodium chloride – Reagent grade, prepare at 5% (w/v) solution in reagent water
7.2 Sodium sulfate
7.2.1 Used for solution drying – Sodium sulfate, reagent grade, granular, anhydrous (Baker 3375, or equivalent), rinsed with methylene chloride (20 mL/g), baked at 400 ΕC for 1 hour minimum, cooled in a dessicator, and stored in a pre-cleaned glass bottle with screw-cap that prevents moisture from entering. If, after heating, the sodium sulfate develops a noticeable grayish cast (due to the presence of carbon in the crystal matrix), that batch of reagent is not suitable for use and should be discarded. Extraction with methylene chloride (as opposed to simple rinsing) and baking at a lower temperature may produce sodium sulfate that is suitable for use.
10

Method 1698 December 2007
7.2.2 Used as a drying agent when extracting solids and biosolids - Sodium sulfate, reagent grade, powdered, treated and stored as in Section 7.2.1.
7.3 Prepurified nitrogen
7.4 Solvents – Acetone, toluene, hexane, pyridine, methanol, and methylene chloride, distilled in glass, pesticide quality, lot-certified to be free of interferences.
7.5 White quartz sand – For use in Soxhlet extraction, 60/70 mesh (Aldrich Chemical, Cat. No. 27-437-9, or equivalent). Bake at 450 ΕC for 4 hours minimum.
7.6 Cleanup reagents
7.6.1 Alumina – Basic, Brockman Activity 1, 60-325 mesh (Fisher, or equivalent), 5% deactivated. Heat for a minimum of 8 hours at 450°C, cool, deactivate to 5% water (w/w), and store under dry nitrogen or in a bottle that will prevent moisture from entering.
7.6.2 Florisil – Pesticide grade, 60-100 mesh (Supelco or U.S. Silica, equivalent). Heat for a minimum of 8 hours at 450°C, cool, deactivate to 5% water (w/w), and store under dry nitrogen or in a bottle that will prevent moisture from entering.
7.6.3 Copper foil or powder – For sulfur removal. Fisher, Alfa Aesar, or equivalent. Copper foil is cut into approximately 1-cm squares. Copper must be activated on each day it will be used, as described below.
7.6.3.1 Place the quantity of copper needed for sulfur removal in a ground-glass stoppered Erlenmeyer flask or bottle. Cover the foil or powder with methanol.
7.6.3.2 Add HCl dropwise (0.5 - 1.0 mL) while swirling, until the copper brightens.
7.6.3.3 Pour off the methanol/HCl and rinse 3 times with acetone, then 3 times with hexane.
7.6.3.4 For the copper foil, cover with hexane after the final rinse. Store in a stoppered flask under nitrogen until used. For the powder, dry on a rotary evaporator. Store in a stoppered flask under nitrogen until used.
7.7 Derivatization reagent – N,O-bis(Trimethylsilyl)trifluoroacetamide with trimethylchlorosilane (BSTFA: TMCS; 99:1), Supelco, or equivalent, used as received.
7.8 Reference matrices – Matrices such as reagent water or sand in which the steroids and hormones and interfering compounds are not detected by this method.
7.8.1 Reagent water – Bottled water purchased locally, or prepared by passage through activated carbon.
11

Method 1698 December 2007
7.8.2 High-solids reference matrix – Playground sand or similar material. Prepared by extraction with methylene chloride and/or baking at 450 ΕC for a minimum of 4 hours.
7.8.3 Other reference matrices of interest may be used if the results from the tests given in Section 9.2 demonstrate acceptable performance. Ideally, the matrix should be free of the analytes of interest, but in no case must the background level of the analytes in the reference matrix exceed the minimum levels in Table 2. If low background levels of the analytes of interest are present in the reference matrix, the spike level of the analytes used in Section 9.2 should be increased to provide a spike-to-background ratio of approximately 5 (Reference 6).
7.9 Standard solutions – Prepare from materials of known purity and composition or purchase as solutions or mixtures with certification to their purity, concentration, and authenticity. If the chemical purity is 98 % or greater, the weight may be used without correction to calculate the concentration of the standard. Observe the safety precautions in Section 5 and the recommendation in Section 5.1.2.
7.9.1 For preparation of stock solutions from neat materials, dissolve an appropriate amount of assayed reference material in solvent. For example, weigh 10 - 20 mg of testosterone to three significant figures in a 10-mL ground-glass-stoppered volumetric flask and fill to the mark with methanol (dichloromethane or acetone may also be used). After the compound is completely dissolved, transfer the solution to a clean 15-mL vial with fluoropolymer-lined cap.
7.9.2 When not being used, store standard solutions in the dark at room temperature, or frozen, in screw-capped vials with fluoropolymer-lined caps, or under a nonreactive gas (e.g., nitrogen) in flame-sealed ampules. Place a mark on the vial at the level of the solution so that solvent loss by evaporation can be detected. Replace the solution if solvent loss has occurred.
7.10 Native (unlabeled) stock solution
7.10.1 Native stock solution – Prepare to contain the steroids and hormones at the concentrations shown in Table 3, or purchase prepared solutions. If additional analytes are to be determined, include the additional native compounds in this stock solution.
7.10.2 Stock solutions should be checked for signs of degradation prior to the preparation of calibration or performance test standards. A stock solution may be checked for degradation by diluting and analyzing the solution using this method and comparing the result to freshly prepared standards prepared previously and/or to a QC Check Sample obtained from a different source (Section 7.16).
7.11 Labeled compound stock solution (Table 3)
Note: Stock and working labeled compound solutions prepared in methanol should be stored no more than two months, as analytes such as norethindrone-d6, norgesterol-d6, and progesterone-d9 contain deuterium atoms beta to carbonyl groups that are labile. These deuterium atoms may undergo proton exchange in a protinated solvents.
12

Method 1698 December 2007
7.11.1 Labeled steroid/hormone stock solution – Prepare in methanol at the concentrations in Table 3 or purchase prepared standards. If additional compounds are to be determined by isotope dilution, include the additional labeled compounds in this stock solution.
7.11.2 Labeled cholesterol stock solution – Prepare in methanol at the concentration in Table 3, or purchase a prepared standard.
7.11.3 Labeled injection internal standard stock solution – Prepare pyrene-d10 in hexane at the concentration in Table 3, or purchase a prepared standard. This solution is added to each concentrated extract prior to injection into the HRGC/HRMS. The stock solution is used without dilution. When 50 μL of this solution are spiked into a 500-μL extract, or when 2 µL are spiked into a 20 µL extract, the concentration of pyrene-d10 will be 250 ng/mL (pg/μL), as shown in Table 3.
7.12 Calibration standards – Combine and dilute the solutions in Sections 7.10 and 7.11 to produce the calibration solutions in Table 4 or purchase prepared standards for the CS-0.2 to CS-5 set of calibration solutions. These solutions permit the relative response (native to labeled) and response factor to be measured as a function of concentration. The CS-3 standard is used for calibration verification (VER). The calibration standards must be derivatized for use (Section 13.3).
7.13 Native standard spiking solution – Used for determining initial precision and recovery (IPR; Section 9.2) and ongoing precision and recovery (OPR; Section 15.5). Dilute the native stock solution (Section 7.10.1) with methanol to produce the concentrations of the steroids/hormones shown in Table 3. When 1 mL of this solution is spiked into an IPR (Section 9.2.1) or OPR (Section 15.5) and extracted, and the extract is concentrated to 500 μL; or when 40 µL is spiked into an IPR or OPR and extracted, and the extract is concentrated to 20 µL, the concentration of the analytes in the final volume will be as shown in the last column in Table 3. Prepare only the amount necessary for each reference matrix with each sample batch.
7.14 Labeled standard spiking solution – This solution is spiked into each sample (Section 9.3) and into the IPR (Section 9.2.1), OPR (Section 15.5), and blank (Section 9.5) to measure recovery. Dilute the labeled steroid/hormone stock solution (Section 7.11.1) with methanol to produce the concentrations of the labeled compounds shown in Table 3. When 1 mL of this solution is spiked into an IPR, OPR, blank, or sample and extracted, and the extract is concentrated to 500 μL; or when 40 µL is spiked into an IPR, OPR, blank or sample and extracted, and the extract is concentrated to 20 µL, the concentration in the final volume will be as shown in the last column Table 3. Prepare only the amount necessary for each reference matrix with each sample batch.
7.15 Labeled cholesterol spiking solution – This solution is added to a sample when a high concentration of cholesterol is known or expected to be present. Dilute the labeled cholesterol stock solution (Section 7.11.2) with methanol to produce the spiking solution concentration shown in Table 3. When 1 mL of this solution is spiked into a sample along with the labeled standard spiking solution, derivatized, and concentrated to a final extract volume of 500 μL, the concentration in the final volume will be 125 µg/mL (125,000 ng/mL) (see Table 3). Prepare only the amount necessary for the number of
13

Method 1698 December 2007
samples in the sample batch. It is not necessary to spike this solution into the IPR, OPR, and blank.
7.16 QC check sample – A QC Check Sample should be obtained from a source independent of the calibration standards. Ideally, this check sample would be a Standard Reference Material (SRM) from the National Institute of Standards and Technology (NIST) containing the compounds of interest in known concentrations in a sample matrix similar to the matrix of interest. If no SRM is available, a certified reference material (CRM) may be used or a QC check sample may be prepared from materials from a source or lot of standards separate from those used for calibration and spiked into a clean reference matrix.
7.17 Stability of solutions – Standard solutions used for quantitative purposes (Sections 7.10 - 7.15) should be assayed periodically (e.g., every 6 months) against SRMs from NIST (where available), or certified reference materials from a source that will attest to the authenticity and concentration, to assure that the composition and concentrations have not changed.
8.0 Sample Collection, Preservation, and Storage
8.1 Collect samples in plastic or amber glass containers following conventional sampling practices designed to obtain a sample that is representative of the material of interest (Reference 7).
8.2 Aqueous samples
8.2.1 Samples of wastewater effluents, drinking water, ambient water, or groundwater that flow freely are collected as grab samples or in refrigerated bottles using automatic sampling equipment. Collect 1 L. If high concentrations of the steroids/hormones are expected, collect a smaller volume (e.g., 100 mL) in addition to the 1-L sample. Do not rinse the bottle with sample before collection.
8.2.2 When sampling influents to treatment, in-process waste streams, and liquid sample types other than wastewater effluents, drinking water, ambient water, or groundwater, it may be necessary to collect two 1-L aliquots of each sample to provide enough material for separate analyses of the aqueous and solid phases.
8.2.3 If residual chlorine is present, add 80 mg sodium thiosulfate per liter of water. Any method suitable for field use maybe employed to test for residual chlorine.
8.2.4 Maintain aqueous samples in the dark at <6 ΕC from the time of collection until receipt at the laboratory (see 40 CFR 136.6(e), Table II).
8.2.5 Alternatively, samples maybe stored frozen from time of receipt at the laboratory until analysis. If the samples will be frozen, collect the 1-L samples in larger containers (>1.1 L) to allow room for expansion, or collect multiple aliquots in smaller containers that are not filled completely (e.g., three 500-mL containers not filled completely).
14

Method 1698 December 2007
8.3 Solid, mixed-phase, and semi-solid samples
8.3.1 Collect samples as grab samples using wide-mouth jars. Collect a sufficient amount of wet material to provide a minimum of 20 g of solids.
8.3.2 Maintain solid, semi-solid, biosolids, and mixed-phase samples in the dark at <6ΕC from the time of collection until receipt at the laboratory.
8.3.3 Once received at the laboratory, store solid, semi-solid, and mixed-phase samples in the dark at less than -10 ΕC.
8.4 Biosolids samples
Biosolids are the residual from various wastewater treatment processes and, as such, may be produced and managed in many forms, ranging from pourable liquids containing less than 1% solids, through viscous solids thickened with polymers, to dry caked solids with little or no moisture. Sample collection procedures for biosolids require knowledge of the form of the material at the specific site.
8.4.1 For biosolids that are pourable liquids, collect 1-L grab samples in wide-mouth glass containers from taps, valves, or biosolids storage tanks.
8.4.2 Sampling biosolids produced and transferred by continuous processes such as belt presses or centrifuges involves collecting multiple small grab samples, homogenizing those grabs in a clean stainless steel container, and transferring an aliquot of the homogenized bulk sample to a wide-mouth glass container. The final sample aliquot should contain at least 20 g of dry solids, and larger volumes, up to 1-L, may be collected.
8.4.3 Biosolids in drying beds, compost piles, and other biosolids management processes involves collecting multiple grabs from different areas of the bed, pile, etc. Remove sticks, leaves, large wood chips, and other obvious plant materials used in composting and homogenize the grab samples in a clean stainless steel container. Transfer an aliquot of the homogenized bulk sample to a wide-mouth glass container. The final sample aliquot should contain at least 20 g of dry solids, and larger volumes, up to 1-L, may be collected.
8.4.4 Maintain biosolids samples in the dark at <6ΕC from the time of collection until receipt at the laboratory.
8.4.5 Once received at the laboratory, store all biosolids samples in the dark at less than -10 ΕC.
8.5 Holding times
EPA has not conducted formal holding time studies for these analytes to date. Use the information below as guidance. Exceeding these default holding times does not invalidate the sample results.
15

Method 1698 December 2007
8.5.1 Aqueous samples – Anecdotal evidence suggests that some may degrade rapidly in aqueous samples. Therefore, begin sample extraction within 7 days of collection (within 48 hours is strongly encouraged). Extracts should be analyzed within 40 days of extraction. Freezing of aqueous samples is encouraged to minimize degradation, in which case, samples should be extracted within 48 hours of removal from the freezer.
8.5.2 Biosolid, solid, mixed-phase, and semi-solid samples – Anecdotal evidence suggests that some may degrade rapidly in these samples. Therefore, begin sample extraction within 7 days of collection (within 48 hours is strongly encouraged). Extracts should be analyzed within 40 days of extraction. Freezing of biosolids, mixed phase and semisolid samples is encouraged to minimize degradation, in which case, samples should be extracted within 48 hours of removal from the freezer.
8.5.3 If extraction within 48 hours is not practical, samples should be frozen to increase the holding time to seven days.
8.5.4 If the sample will not be extracted within 48 hours of collection, the laboratory should adjust the pH of aqueous samples to 5.0 to 9.0 with sodium hydroxide or sulfuric acid solution. Record the volume of acid or base used.
8.4 Store sample extracts in the dark at less than -10 °C until analyzed. Analyze extracts within 40 days of extraction.
9.0 Quality Control
9.1 Each laboratory that uses this method is required to operate a formal quality assurance program (Reference 9). The minimum requirements of this program consist of an initial demonstration of laboratory capability, analysis of samples spiked with labeled compounds to evaluate and document data quality, and analysis of standards and blanks as tests of continued performance. Laboratory performance is compared to established performance criteria to determine if the results of analyses meet the performance characteristics of the method.
If the method is to be applied to sample matrix other than water (e.g., soils, filter cake, compost) the most appropriate alternative reference matrix (Sections 7.8.2, 7.8.3 and 7.16) is substituted for the reagent water matrix (Section 7.8.1) in all performance tests.
9.1.1 The laboratory must make an initial demonstration of the ability to generate acceptable precision and recovery with this method. This demonstration is given in Section 9.2.
9.1.2 In recognition of advances that are occurring in analytical technology, and to overcome matrix interferences, the laboratory is permitted certain options to improve separations or lower the costs of measurements. These options include alternative extraction, concentration, and cleanup procedures, and changes in columns and detectors (see also 40 CFR 136.6). Alternative determinative techniques, such as the substitution of spectroscopic or immunoassay techniques, and changes that degrade method performance, are not allowed. If an analytical
16

Method 1698 December 2007
technique other than the techniques specified in this method is used, that technique must have a specificity equal to or greater than the specificity of the techniques in this method for the analytes measured in this method.
9.1.2.1 Each time a modification is made to this method, the laboratory is required to repeat the procedure in Section 9.2. If the detection limit of the method will be affected by the change, the laboratory is required to demonstrate that the MDLs (40 CFR Part 136, Appendix B) are lower than one-third the regulatory compliance level or the MDLs in this method, whichever are greater. If calibration will be affected by the change, the instrument must be recalibrated per Section 10. Once the modification is demonstrated to produce results equivalent or superior to results produced by this method as written, that modification may be used routinely thereafter, so long as the other requirements in this method are met (e.g., labeled compound recovery).
9.1.2.2 The laboratory is required to maintain records of modifications made to this method. These records include the following, at a minimum:
9.1.2.2.1 The names, titles, addresses, and telephone numbers of the analyst(s) that performed the analyses and modification, and of the quality control officer that witnessed and will verify the analyses and modifications
9.1.2.2.2 A listing of pollutant(s) measured, by name and CAS Registry number.
9.1.2.2.3 A narrative stating reason(s) for the modifications.
9.1.2.2.4 Results from all quality control (QC) tests comparing the modified method to this method, including:
a) Calibration (Section 10). b) Calibration verification (Section 15.3). c) Initial precision and recovery (Section 9.2). d) Labeled compound recovery (Section 9.3). e) Analysis of blanks (Section 9.5). f) Accuracy assessment (Section 9.4).
9.1.2.2.5 Data that will allow an independent reviewer to validate each determination by tracing the instrument output (peak height, area, or other signal) to the final result. These data are to include:
a) Sample numbers and other identifiers. b) Extraction dates. c) Analysis dates and times. d) Analysis sequence/run chronology. e) Sample weight or volume (Section 11).
17

Method 1698 December 2007
f) Extract volume prior to each cleanup step (Section 13).
g) Extract volume after each cleanup step (Section 13). h) Final extract volume prior to injection (Section 14). i) Injection volume (Sections 10.3 and 14.3). j) Dilution data, differentiating between dilution of a
sample or extract (Section 17.5.1). k) Instrument and operating conditions. l) Column (dimensions, liquid phase, solid support,
film thickness, etc). m) Operating conditions (temperatures, temperature
program, flow rates). n) Detector (type, operating conditions, etc). o) Chromatograms, printer tapes, and other recordings
of raw data. p) Quantitation reports, data system outputs, and other
data to link the raw data to the results reported.
9.1.3 Analyses of method blanks are required to demonstrate freedom from contamination (Section 4.3). The procedures and criteria for analysis of a method blank are given in Sections 9.5 and 15.6.
9.1.4 The laboratory must spike all samples with labeled compounds to monitor method performance. This test is described in Section 9.3. When results of these spikes indicate atypical method performance for samples, the samples are diluted to bring method performance within acceptable limits. Procedures for dilution are given in Section 17.5.
9.1.5 The laboratory must, on an ongoing basis, demonstrate through calibration verification and the analysis of the ongoing precision and recovery standard (OPR) and blanks that the analytical system is in control. These procedures are given in Sections 15.1 through 15.6.
9.1.6 The laboratory should maintain records to define the quality of data generated. Development of accuracy statements is described in Section 9.4.
9.2 Initial precision and recovery (IPR)-To establish the ability to generate acceptable precision and recovery, the laboratory must perform the following operations.
9.2.1 For low solids (aqueous) samples, extract, concentrate, and analyze four 1-L aliquots of reagent water spiked with 1 mL each of the Native standard spiking solution (Section 7.13) and the labeled standard spiking solution (Section 7.14), according to the procedures in Sections 11 through 18. For an alternative sample matrix, four aliquots of the alternative reference matrix (Section 7.8) are used. All sample processing steps that are to be used for processing samples, including preparation (Section 11), extraction (Section 12), and cleanup (Section 13), must be included in this test.
9.2.2 Using results of the set of four analyses, compute the average percent recovery (X) of the extracts and the relative standard deviation (RSD) of the concentration
18

Method 1698 December 2007
for each compound, by isotope dilution for steroids/hormones with a labeled analog, and by internal standard for steroids/hormones without a labeled analog and for the labeled compounds.
9.2.3 For each native analyte and labeled compound, compare RSD and X with the corresponding limits for initial precision and recovery in Table 5. If RSD and X for all compounds meet the acceptance criteria, system performance is acceptable and analysis of blanks and samples may begin. If, however, any individual RSD exceeds the precision limit or any individual X falls outside the range for recovery, system performance is unacceptable for that compound. Correct the problem and repeat the test (Section 9.2).
9.3 To assess method performance on the sample matrix, the laboratory must spike all samples with the labeled standard spiking solution (Section 7.14).
9.3.1 Analyze each sample according to the procedures in Sections 11 through 18.
9.3.2 Compute the percent recovery of the labeled compounds using the internal standard method (Section 17.2).
9.3.3 The recovery of each labeled compound must be within the limits in Table 5. If the recovery of any compound falls outside of these limits, method performance is unacceptable for that compound in that sample. Additional cleanup procedures must then be employed to attempt to bring the recovery within the normal range. If the recovery cannot be brought within the normal range after all cleanup procedures have been employed, water samples are diluted and smaller amounts of soils, sludges, sediments, and other matrices are analyzed per Section 18.
9.4 Recoveries of labeled compounds from samples should be assessed and records maintained.
9.4.1 After the analysis of 30 samples of a given matrix type (water, soil, sludge, etc.) for which the labeled compounds pass the tests in Section 9.3, compute the average percent recovery (R) and the standard deviation of the percent recovery (SR) for the labeled compounds only. Express the assessment as a percent recovery interval from R ! 2SR to R + 2SR for each matrix. For example, if R = 90% and SR = 10% for 30 analyses of biosolids, the recovery interval is expressed as 70 to 110%.
9.4.2 Update the accuracy assessment for each labeled compound in each matrix on a regular basis (e.g., after each five to ten new measurements).
9.5 Method blanks – A reference matrix method blank is analyzed with each sample batch (Section 4.3) to demonstrate freedom from contamination. The matrix for the method blank must be similar to the sample matrix for the batch, e.g., a 1-L reagent water blank (Section 7.8.1), high-solids reference matrix blank (Section 7.8.2), or alternative reference matrix blank (Section 7.8.3).
9.5.1 Spike 1.0 mL each of the labeled standard spiking solution (Section 7.14) into the method blank, according to the procedures in Sections 11 through 18. Prepare,
19

Method 1698 December 2007
extract, clean up, and concentrate the method blank. Analyze the blank immediately after analysis of the OPR (Section 15.6) to demonstrate freedom from contamination.
9.5.2 If any steroid or hormone (Table 1) is found in the blank at greater than the minimum level (Table 2) or one-third the regulatory compliance limit, whichever is greater; or if any potentially interfering compound is found in the blank at the minimum level for each native analyte in Table 2 (assuming a response factor of 1 relative to the quantitation reference in Table 2 for a potentially interfering compound; i.e., a compound not listed in this method), analysis of samples must be halted until the sample batch is re-extracted and the extracts re-analyzed, and the blank associated with the sample batch shows no evidence of contamination at these levels. All samples must be associated with an uncontaminated method blank before the results for those samples may be reported or used for permitting or regulatory compliance purposes.
9.6 QC Check Sample – Analyze the QC Check Sample (Section 7.16) periodically to assure the accuracy of calibration standards and the overall reliability of the analytical process. It is suggested that the QC Check Sample be analyzed at least quarterly.
9.7 The specifications contained in this method can be met if the apparatus used is calibrated properly and then maintained in a calibrated state. The standards used for calibration (Section 10), calibration verification (Section 15.3), and for initial (Section 9.2) and ongoing (Section 15.5) precision and recovery should be identical, so that the most precise results will be obtained. A GC/HRMS instrument will provide the most reproducible results if dedicated to the settings and conditions required for determination of steroids and hormones by this method.
9.8 Depending on specific program requirements, field replicates may be collected to determine the precision of the sampling technique, and spiked samples may be required to determine the accuracy of the analysis when the internal standard method is used.
10.0 Calibration and Standardization
10.1 Establish the operating conditions necessary to meet the retention times (RTs) and relative retention times (RRTs) for the steroids and hormones in Table 2. The GC conditions may be optimized for compound separation and sensitivity.
10.1.1 Suggested operating conditions
Suggested GC Conditions Injector Type Split/Splitless Carrier Gas Helium, variable Injector Temperature (°C) 280 Maximum Temperature (°C) 325
20

Method 1698 December 2007
Suggested GC Temperature Program Initial temperature (°C) 100 Hold time (min) 4 First Temperature Ramp (°C min-1) 10 Hold Temperature (°C) 265 Hold time (min) 7 Second Temperature Ramp (°C min-1) 10 Hold Temperature (°C) 300 Hold time (min) 4 Third Temperature Ramp (°C min-1) 20 Final Temperature (°C) 310 Hold time (min) 3
Suggested MS Conditions Source temperature (°C) 280 Electron energy (eV) 35 Detector voltage (V) Variable Scan time (s) ≤ 1.5
Note: A shorter scan time gives more points and may improve peak definition and integration accuracy. However a faster scan reduces channel integration time and results in a slight decrease in sensitivity. The 1.5-second scan time is an upper limit and shorter scan times are recommended. Using the GC column specified in Sec. 6.18.1 (30 5-m long x 0.25 0.02-mm ID; 0.25-μm film (Restek RTX-5, or equivalent)) and the GC program above, EPA found that a 1.5-second scan time provided sufficient points to define and accurately integrate peaks. The typical peak width at the base for these compounds, under these conditions, was between 9 and 24 seconds (with a mean of 12.7), with a minimum of 9 scans (data points) across each peak.
10.1.1.1 All portions of the column that connect the GC to the ion source should remain at or above the interface temperature during analysis to preclude condensation of less volatile compounds.
10.1.1.2 The GC conditions may be optimized for compound separation and sensitivity. Once optimized, the same GC conditions must be used for the analysis of all standards, blanks, IPR and OPR standards, and samples.
10.1.2 Retention time calibration for the native and labeled compounds
10.1.2.1 Inject the CS-3 calibration standard (Section 7.12 and Table 4). Establish the beginning and ending retention times for the scan descriptors (functions) in Table 2. Scan functions other than those listed in Table 2 may be used provided the MLs in Table 2 are met. Store the retention time (RT) and relative retention time (RRT) for each compound in the data system.
10.1.2.2 The absolute retention time of last-eluted compound must be equal to or greater than its retention time in Table 2; otherwise, the GC operating conditions must be adjusted and this test repeated until this minimum retention time criterion is met.
21

Method 1698 December 2007
10.1.2.3 If a column alternate to the column suggested in Section 6.18.1 is used, a similar minimum retention time specification (Section 10.1.2.2) must be established for the alternate column so that interferences that may be encountered in environmental samples will be resolved from the analytes of interest. This specification is deemed to be met if the retention time of the last-eluted compound is equal to or greater than its retention time in Table 2.
10.2 Mass spectrometer (MS) resolution
10.2.1 Using PFK (or other reference substance) and a molecular leak, tune the instrument to meet the minimum required resolving power of 5,000 (10% valley) at m/z 280.9825, or other significant PFK fragment in the range of 250 - 300. For each function (Table 2), monitor and record the resolution and exact m/zs of three to five reference peaks covering the mass range of the function. The level of PFK (or other reference substance) metered into the HRMS during analyses should be adjusted so that the amplitude of the most intense selected lock-mass m/z signal (regardless of the function/descriptor number – see Table 2 for functions) does not exceed 10% of the full-scale deflection for a given set of detector parameters. Under those conditions, sensitivity changes that might occur during the analysis can be more effectively monitored.
Note: Different lots and types of PFK can contain varying levels of contamination, and excessive PFK (or other reference substance) may cause noise problems and contamination of the ion source necessitating increased frequency of source cleaning.
10.2.2 The analysis time for the analytes may exceed the long-term mass stability of the mass spectrometer. Because the instrument is operated in the high-resolution mode, mass drifts of a few ppm (e.g., 5 ppm in mass) can have serious adverse effects on instrument performance. Therefore, mass-drift correction is mandatory and a lock-mass m/z from perfluorokerosene (PFK) or other reference substance is used for drift correction. The lock-mass m/z is dependent on the exact m/zs monitored within each descriptor. The deviation between each monitored exact m/z and the theoretical m/z must be less than 5 ppm.
10.2.3 Obtain a selected ion current profile (SICP) at the two exact m/zs specified in Table 2 and at ∃5,000 resolving power for each native and labeled compound. Because of the extensive mass range covered in each function, it may not be possible to maintain 5,000 resolution throughout the mass range during the function. Therefore, resolution must be ∃3,000 throughout the mass range and must be ∃5,000 in the center of the mass range for each function.
10.2.4 If the HRMS has the capability to monitor resolution during the analysis, it is acceptable to terminate the analysis when the resolution falls below the minimum (Section 10.2.1 and 10.2.3) to save re-analysis time.
10.3 Ion abundance ratios, minimum levels, and signal-to-noise ratios during calibration
22

Method 1698 December 2007
Choose an injection volume of either 1 or 2 μL, consistent with the capability of the GC/HRMS instrument. Inject a 1- or 2-μL aliquot of the CS-0.2 or CS-1 calibration solution (Table 4) using the GC conditions in Section 10.1.1. The CS-0.2 solution is used for modern high-sensitivity HRMS instruments; the CS-1 solution is used for older, less-sensitive instruments.
10.3.1 Measure the SICP areas for each compound, and compute the ion abundance ratios at the exact m/zs specified in Table 2. Compare the computed ratio to the theoretical ratio given in Table 2.
10.3.1.1 The exact m/zs to be monitored in each function/descriptor are shown in Table 2. Each group or descriptor must be monitored in succession as a function of GC retention time to ensure that the steroids/hormones are detected. Additional m/zs may be monitored in each descriptor, and the m/zs may be divided among more than the descriptors listed in Table 2, provided that the laboratory is able to monitor the m/zs of all steroids/hormones that may elute from the GC in a given RT window.
10.3.1.2 The mass spectrometer must be operated in a mass-drift correction mode, using PFK (or other reference substance) to provide lock m/zs. Each lock mass must be monitored and must not vary by more than ∀ 20% throughout its respective retention time window. Variations of lock mass by more than 20% indicate the presence of co-eluting interferences that raise the source pressure and may significantly reduce the sensitivity of the mass spectrometer. Re-injection of another aliquot of the sample extract may not resolve the problem and additional cleanup of the extract may be required to remove the interference. A lock mass interference or suppression in a retention time region in which the steroids/hormones and labeled compounds do not elute may be ignored.
10.3.2 The ion abundance ratios for all native and labeled compounds in the CS-0.2 or CS-1 standard must be within ±30% of the ratios in Table 2, or in the most recent calibration or calibration verification; otherwise, the mass spectrometer must be adjusted and this test repeated until the m/z ratios fall within the limits specified. If the adjustment alters the resolution of the mass spectrometer, resolution must be verified (Section 10.2) prior to repeat of the test.
10.3.3 Verify that the HRGC/HRMS instrument meets the minimum levels (MLs) in Table 2. The peaks representing the native and labeled compounds in the CS-0.2 or CS-1 calibration standard must have signal-to-noise ratios (S/N) ∃ 3; otherwise, the mass spectrometer must be adjusted and this test repeated until the minimum levels in Table 2 are met.
10.4 Calibration by isotope dilution
Isotope dilution is used for calibration of the native compounds for which a labeled analog is available. The reference compound for each native compound is its labeled analog, as listed in Table 2. A 6-point calibration (CS-0.2 to CS-5) is prepared for each
23

Method 1698 December 2007
native compound when a high sensitivity HRMS is used (e.g., Waters Ultima). Otherwise, a 5-point calibration is used.
10.4.1 For steroids/hormones determined by isotope dilution, the relative response (RR) (labeled to native) vs. concentration in the calibration solutions (Table 4) is computed over the calibration range according to the procedures described below.
10.4.2 To calibrate the analytical system by isotope dilution, inject calibration standards CS-0.2 through CS-5 (Section 7.12 and Table 4). Use a volume identical to the volume chosen in Section 10.3, the procedure in Section 14, and the conditions in Section 10.1.1.
10.4.3 Determine the relative response (RR) of each native compound to its labeled analog using the area responses of both the primary and secondary exact m/zs specified in Table 2 for each calibration standard. Use the labeled compounds listed in Table 2 as the quantitation reference and the two exact m/zs listed in Table 2 for quantitation. The areas at the two exact m/zs for the compound are summed and divided by the summed area of the two exact m/zs for the quantitation reference.
Note: Both exact m/zs are used as reference to reduce the effect of an interference at a single m/z. Other quantitation references and procedures may be used provided that the results produced are as accurate as results produced by the quantitation references and procedures described in this section.
10.4.4 Calibrate the native compounds with a labeled analog using the following equation:
(A1 + A2 ) Cn n lRR = (A1 + A2 ) Cl l n
Where:
A1n and A2n = The areas of the primary and secondary m/zs for the native compound
A1l and A2l = The areas of the primary and secondary m/zs for the labeled compound.
Cl = The concentration of the labeled compound in the calibration standard (Table 4).
Cn = The concentration of the native compound in the calibration standard (Table 4).
10.4.5 Linearity − Store the relative response (RR) for each native compound at each concentration. Compute the average (mean) RR and the RSD of the 6 RRs. If the RR for any native compound is constant (less than 30% RSD), the average RR may be used for that compound; otherwise, the complete calibration curve for that compound must be used over the calibration range.
24

Method 1698 December 2007
10.5 Calibration by internal standard − Internal standard calibration is applied to the determination of the native compounds for which a labeled compound is not available, and to determination of the labeled compounds so that their recoveries can be measured. The reference compound for each native compound is listed in Table 2. For the labeled compounds, calibration is performed at a single concentration, using data from the 6 (or 5) points in the calibration (Section 10.4).
10.5.1 Response factors − Using data from the 6 (or 5) points in the calibration, determine the response factor (RF) of each native compound that does not have a labeled analog and each labeled compound relative to the internal standard using the area responses of both the primary and secondary exact m/zs specified in Table 2, for each calibration standard.
Use the internal standards listed in Table 2 as the quantitation reference, the two exact m/zs listed in Table 2 for quantitation, and the following equation:
(A1 + A2 ) Cs s isRF = (A1 + A2 ) Cis is s
Where:
A1s and A2s = The areas of the primary and secondary m/zs for the native or labeled compound
A1is and A2is = The areas of the primary and secondary m/zs for the Labeled injection internal standard.
Cis = The concentration of the Labeled injection internal standard (Table 4).
Cs = The concentration of the compound in the calibration standard (Table 4).
10.5.2 Linearity − Store the response factor (RF) for each native compound at each concentration. Compute the average (mean) RF and the RSD of the 6 RFs. If the RF for any native compound is constant (less than 35% RSD), the average RF may be used for that compound. Otherwise, the complete calibration curve for that compound must be used over the calibration range. Because the labeled compounds are present in each calibration standard at the same concentration, linearity of the labeled compounds is not assessed.
11.0 Sample Preparation
Sample preparation involves modifying the physical form of the sample so that the analytes can be extracted efficiently. In general, the samples must be in a liquid form or in the form of finely divided solids in order for efficient extraction to take place. Table 13 lists the phases and suggested quantities for extraction of various sample matrices. For samples known or expected to contain high levels of the analytes, the smallest sample size representative of the entire sample should be used.
25

Method 1698 December 2007
Solid samples are prepared per Section 11.4, extracted per Sections 12.2 and cleaned up according to Section 13.2 and 13.3.
Biosolids are prepared per Section 11.5, extracted per Sections 12.2, and cleaned up according to Sections 13.2 and 13.3.
Aqueous samples - Because the analytes may be bound to suspended particles, the preparation of aqueous samples is depends on the presence of visible particles. Aqueous samples absent visible particles are prepared per Section 11.3 and extracted and cleaned up according to Sections 12.1 13.2 and 13.3.
Aqueous samples with visible particles - If visible particles can be seen in aqueous samples they should be filtered and the solids and aqueous portions of these samples should be extracted and combined prior to clean up as follows. Filtration of particles - assemble a clean filtration apparatus (Section 6.6). Apply vacuum to the apparatus, and pour the entire contents of the sample bottle through the filter, swirling the sample remaining in the bottle to suspend any particles. Rinse the sample bottle twice with approximately 5 mL portions of reagent water to transfer any remaining particles onto the filter. Rinse any particles off the sides of the filtration apparatus with small quantities of reagent water. Weigh the empty sample bottle to ±1 g. Determine the weight of the sample by difference. Save the bottle for further use. Prepare and extract the filtrate using the procedure in Section 11.3. Prepare and extract the filter containing the particles using the same procedure for biosolids or solid samples as discussed above. These extracts should be combined prior to analysis (Section 14) or results of separate analysis combined. It should be noted that the judgment of the analyst must be used to determine the need to analyze samples with visible particles that compose less than 1 % of the sample weight per Section 11.1.
Procedures for grinding, homogenization, and blending of various sample phases are given in Section 11.6.
11.1 Determination of solids content
The solids content of the bulk sample is determined from a subsample that is used only for the solids determination. Separate procedures are used for the solids determination, based on the sample matrix, as described below.
11.1.1 Aqueous liquids and multi-phase samples consisting of mainly an aqueous phase
11.1.1.1 Dry a GF/A filter (Section 6.10.3) and weigh it to three significant figures. Mix the bulk sample in the original container (e.g., cap the bottle and shake it by hand) and take a 10.0 ∀ 0.2 mL aliquot. Filter that aliquot through the filter. Dry the filter in an oven for a minimum of 12 hours at 110 ∀ 5 ΕC and cool in a dessicator.
11.1.1.2 Weigh the filter and calculate percent solids as follows:
26
Weight of sample aliquot after drying (g) - weight of filter (g)% Solids = x 100
10 g

Method 1698 December 2007
11.1.2 Non-aqueous liquids, solids, semi-solid samples, biosolids samples, and multiphase samples in which the main phase is not aqueous
11.1.2.1 Weigh 5 to 10 g of the bulk sample to three significant figures in a tared beaker, weighing pan, or other suitable container. Dry for a minimum of 12 hours at 110 ∀ 5 ΕC, and cool in a dessicator.
Note: See Section 11.5 for additional considerations in preparing samples of biosolids.
11.1.2.2 Weigh the dried aliquot and calculate percent solids as follows:
Weight of sample aliquot after drying (g)% Solids = x 100
Weight of sample aliquot before drying (g)
11.2 Estimation of particle size
Extraction of any sample matrix is affected by the size of particles in the sample. Ideally, the particles should be 1 mm or less. The particle size can be estimated using the sample aliquot filtered or dried in Sections 11.1.1 or 11.1.2. Spread the aliquot on a piece of filter paper or aluminum foil in a fume hood or glove box. Visually estimate the size of the particles in the sample. If the size of the largest particles is greater than 1 mm, use one of the procedures in Section 11.6 to reduce the particle size to 1 mm or less prior to extraction. If the largest particles are 1 mm or less, proceed with sample preparation, using the procedures in Section 11.3, 11.4, or 11.5.
11.3 Preparation of aqueous samples with no visible particles and QC aliquots
11.3.1 Mark the original level of the sample on the sample bottle for reference. Weigh the sample plus bottle to ± 1 g.
11.3.2 For complex wastewaters (e.g., untreated effluents, in-process streams), spike 1.0 mL of the labeled standard spiking solution (Section 7.14) into the sample bottle. If the sample is expected to contain a high level of cholesterol, spike 1.0 mL of the labeled cholesterol spiking solution (Section 7.15) into the sample bottle. For clean waters (e.g., ambient waters, finished drinking waters, secondary biologically treated effluents), spike only 40 µL of the labeled standard spiking solution into the sample bottle. Cap the bottle and mix the sample by shaking. Allow the sample to equilibrate for 1 to 2 hours, with occasional shaking.
11.3.3 Blank and OPR aliquots − For each sample or sample batch (to a maximum of 20 samples) to be extracted during the same 12-hour shift, place two 1.0-L aliquots of reagent water in clean sample bottles or flasks. Spike the volume of labeled standard spiking solution (1.0 mL or 40 µL) that was spiked into the sample (Section 11.3.2) into both reagent water aliquots. One of these aliquots will serve as the method blank. Spike 1.0 mL or 40 µL of the native standard spiking solution (Section 7.13), consistent with the volume of labeled compound spiked into the sample (Section 11.3.2), into the remaining reagent water aliquot. This aliquot will serve as the OPR (Section 15.5).
27

Method 1698 December 2007
Note: It is not necessary to spike the labeled cholesterol spiking solution into the QC aliquots.
11.3.4 Cap the bottles and mix the QC aliquots by shaking. Allow the QC aliquots to equilibrate for 1 to 2 hours, with occasional shaking.
11.3.5 Proceed to Section 12.1 for extraction.
11.4 Preparation of solids and filtered solids from aqueous samples. This excludes biosolids. For biosolids samples, proceed to Section 11.5.
11.4.1 Homogenize the sample in its original container, by shaking samples that are pourable liquids, or by stirring solids in their original container with a clean spatula, glass stirring rod, or other suitable implement.
11.4.2 Weigh a well-mixed aliquot of each sample sufficient to provide 10 g of dry solids (based on the solids determination in Section 11.1.2) into a clean beaker or glass jar, to a maximum of 1 L of sample. If the particle size estimate (Section 11.2) indicates that size reduction is required, use one of the procedures in Section 11.6 to reduce the particle size of the 10-g aliquot.
11.4.3 Spike 1.0 mL of the labeled standard spiking solution (Section 7.14) into the sample. If the sample is expected to contain a high level of cholesterol, spike 1.0 mL of the labeled cholesterol spiking solution (Section 7.15) into the sample.
11.4.4 Blank and OPR aliquots − For each sample or sample batch (to a maximum of 20 samples) to be extracted during the same 12-hour shift, place two 10-g aliquots of sand, or other appropriate reference matrix (Section 7.8) in clean sample bottles or flasks. Spike 1.0 mL of the labeled standard spiking solution (Section 7.14) into both aliquots. One of these aliquots will serve as the method blank. Spike 1.0 mL of the native standard spiking solution (Section 7.13) into the remaining reagent water aliquot. This aliquot will serve as the OPR (Section 15.5).
Note: It is not necessary to spike the labeled cholesterol spiking solution into the QC aliquots.
11.4.5 Stir or tumble and equilibrate the aliquots for 1 to 2 hours.
11.4.6 If the sample can be filtered, filter through a glass-fiber filter (Section 6.10.3). Collect the filtrate in a separatory funnel or continuous liquid-liquid extractor and proceed to Section 12.1 for extraction of the filtrate and Section 12.2 for extraction the material remaining on the filter.
11.4.7 If the sample cannot be filtered, proceed to Section 12.2 for extraction of the sample.
11.5 Preparation of biosolids samples
28

Method 1698 December 2007
As noted in Section 8, biosolids may be produced and managed in a variety of forms, and these will dictate how the samples are collected, prepared, and analyzed. Some biosolids contain less than 1% solids and are treated in a manner similar to aqueous samples, as described in Section 11.5.1. Biosolids containing 1 - 5% solids are filtered and the filtrate and solid material are both extracted, as described in Section 11.5.2. Biosolids containing greater than 5% solids are mixed with mixed with a small amount of reagent water and extracted as described in Section 11.5.3.
Because of the likelihood that large amounts of sterols and hormones may be present in biosolids, the mass of dry solids used for the analysis is greatly reduced from that used for other solid matrices, down to 0.25 g of dry solids.
When biosolids are managed by composting, they often contain large amounts of sticks, wood chips, and/or leaves. These materials will contain plant sterols that may interfere with the analysis of the target analytes in this method. Therefore, the analyst should carefully remove any large visible plant material from the sample before determining the solids content in Section 11.1.2.
11.5.1 Biosolids containing less than 1% solids
Pourable liquid biosolids with less than 1% solids should be filtered and the filtrate analyzed according to the procedure for aqueous samples and the solids analyzed according to section 11.5.2.
11.5.2 Biosolids containing 1 - 5% solids
11.5.2.1 Homogenize the sample in its original container, by shaking samples that are pourable liquids, or by stirring solids in their original container with a clean spatula, glass stirring rod, or other suitable implement.
11.5.2.2 Using the percent solids determined in Section 11.1.2, determine the volume of sample that will provide 0.25 g of biosolids. Place this volume of sample into a clean beaker.
11.5.2.3 Spike 1.0 mL of the labeled standard spiking solution (Section 7.14) into the sample. For all biosolids samples, spike 1.0 mL of the labeled cholesterol spiking solution (Section 7.15) into the sample.
11.5.2.4 For each sample or sample batch (to a maximum of 20 samples) to be extracted during the same 12-hour shift, place two 0.25-g aliquots of sand, or other appropriate reference matrix (Section 7.8) in clean sample bottles or flasks. Spike 1.0 mL of the labeled standard spiking solution (Section 7.14) into both aliquots. One of these aliquots will serve as the method blank. Spike 1.0 mL of the native standard spiking solution (Section 7.13) into the remaining QC aliquot. This aliquot will serve as the OPR (Section 15.5).
Note: It is not necessary to spike the labeled cholesterol spiking solution into the QC aliquots.
29

Method 1698 December 2007
11.5.2.5 Stir or tumble and equilibrate the samples and QC aliquots for 1 to 2 hours.
11.5.2.6 If the sample can be filtered, filter through a glass-fiber filter (Section 6.10.3). Collect the filtrate in a separatory funnel or continuous liquid-liquid extractor and proceed to Section 12.1 for extraction of the filtrate and Section 12.2 for extraction of the material remaining on the filter. If the sample cannot be filtered, proceed to Section 12.2 for extraction of the sample.
11.5.3 Biosolids containing greater than 5% solids
11.5.3.1 Homogenize the sample by stirring solids in the original container with a clean spatula, glass stirring rod, or other suitable implement.
11.5.3.2 Using the percent solids determined in Section 11.1.2, determine the volume of sample that will provide 0.25 g of biosolids. Place this volume of sample into a clean beaker.
11.5.3.3 For each sample or sample batch (to a maximum of 20 samples) to be extracted during the same 12-hour shift, place two 0.25-g aliquots of sand, or other appropriate reference matrix (Section 7.8) in clean sample bottles or flasks.
11.5.3.4 Add 5 mL of reagent water (Section 7.8.1) to the sample and QC aliquots and mix thoroughly with clean spatulas.
11.5.3.5 Spike 1.0 mL of the labeled standard spiking solution (Section 7.14) into the sample and both QC aliquots. For all biosolids samples, spike 1.0 mL of the labeled cholesterol spiking solution (Section 7.15) into the sample.
Note: It is not necessary to spike the labeled cholesterol spiking solution into the QC aliquots.
11.5.3.6 Spike 1.0 mL of the native standard spiking solution (Section 7.13) into one of the QC aliquots. This aliquot will serve as the OPR (Section 15.5). The other aliquot will serve as the blank.
11.5.3.7 Mix the sample and each QC aliquot thoroughly. Cover the bottles or flasks with foil and allow to equilibrate for 30 - 60 minutes.
11.5.3.8 Proceed to Section 12.2 for extraction.
11.6 Sample grinding, homogenization, or blending
Samples with particle sizes greater than 1 mm (as determined in Section 11.2) are subjected to grinding, homogenization, or blending. The method of reducing particle size to less than 1 mm is matrix-dependent. In general, hard particles can be reduced by
30

Method 1698 December 2007
grinding with a mortar and pestle. Softer particles can be reduced by grinding in a Wiley mill or meat grinder, by homogenization, or in a blender.
11.6.1 Each size-reducing preparation procedure on each matrix must be verified by running the tests in Section 9.2 before the procedure is employed routinely.
11.6.2 The grinding, homogenization, or blending procedures must be carried out in a glove box or fume hood to prevent particles from contaminating the work environment.
11.6.3 Grinding – Amorphous and other solids can be ground in a Wiley mill or heavy duty meat grinder. In some cases, reducing the temperature of the sample to freezing or to dry ice or liquid nitrogen temperatures can aid in the grinding process. Grind the sample aliquots in a clean grinder. Do not allow the sample temperature to exceed 50 ΕC. Also grind the blank and OPR reference matrix aliquots using a clean grinder.
11.6.4 Homogenization or blending – Particles that are not ground effectively, or particles greater than 1 mm in size after grinding, can often be reduced in size by high speed homogenization or blending. Homogenize and/or blend the particles or filter for the sample, blank, and OPR aliquots.
11.6.5 After size reduction, return to Section 11.4 for the preparation of solid samples and QC aliquots, or Section 11.5 for biosolid samples and QC aliquots.
12.0 Extraction and Concentration
Extraction procedures include: separatory funnel (Section 12.1.1) and continuous liquid/liquid (Section 12.1.2) for aqueous liquids, and Soxhlet extraction (Section 12.2) for solids and biosolids. Extracts may be concentrated using rotary evaporation (Section 12.3.1), a heating mantle (Section 12.3.2), or Kuderna-Danish (Section 12.3.3). Microconcentration is performed by nitrogen evaporation (Section 12.4).
Note: Whichever combination of extraction and concentration techniques is used for samples must also be used for the associated QC aliquots.
12.1 Extraction of aqueous liquids
If the sample was filtered in Section 11.4.6 or 11.5.2.6, the filtrate is extracted using one of the aqueous procedures in Section 12.1.1 or 12.1.2, and the solids on the filter are extracted using the solids procedure in Section 12.2.
12.1.1 Separatory funnel extraction
12.1.1.1 Pour the sample (Section 11.3.2) into a 2-L separatory funnel. Rinse the bottle or flask twice with 5 mL of reagent water and add these rinses to the separatory funnel. Add 100 mL methylene chloride to the empty sample bottle. Cap the bottle and shake 60 seconds to rinse the
31

Method 1698 December 2007
inner surface. Transfer the solvent to the separatory funnel, and extract the sample by shaking the funnel for 2 minutes with periodic venting.
12.1.1.2 Allow the organic layer to separate from the aqueous phase for a minimum of 10 minutes. If an emulsion forms and is more than one-third the volume of the solvent layer, employ mechanical techniques to complete the phase separation (see note below).
12.1.1.3 Drain the methylene chloride extract through a solvent-rinsed glass funnel approximately one-half full of granular anhydrous sodium sulfate (Section 7.2.1) supported on clean glass-fiber paper into a solvent-rinsed concentration device (Section 12.3).
Note: If an emulsion forms, the laboratory must employ mechanical techniques to complete the phase separation. The optimum technique depends upon the sample, but may include stirring, filtration through glass wool, use of phase separation paper, centrifugation, use of an ultrasonic bath with ice, addition of NaCl, or other physical methods. Alternatively, continuous liquid-liquid extraction (Section 12.1.2), or other extraction techniques may be used to prevent emulsion formation. Any alternative technique is acceptable so long as the requirements in Section 9.2 are met.
12.1.1.4 Extract the water sample two more times with 100-mL portions of methylene chloride. Drain each portion through the sodium sulfate into the concentrator. After the third extraction, rinse the separatory funnel with at least 20 mL of methylene chloride, and drain this rinse through the sodium sulfate into the concentrator. Repeat this rinse at least twice. Concentrate the extract per Section 12.3.
12.1.2 Continuous liquid/liquid extraction
12.1.2.1 Place 100-150 mL methylene chloride in the continuous extractor and 200-300 mL in the distilling flask. Pour the sample into the extractor. Rinse the sample container with 50-100 mL methylene chloride and add to the extractor.
12.1.2.2 Begin the extraction by heating the flask until the methylene chloride is boiling. When properly adjusted, 1-2 drops of methylene chloride per second will fall from the condenser tip into the water. Extract for 16-24 hours.
12.1.2.3 Remove the distilling flask, estimate and record the volume of extract (to the nearest 100 mL) and pour the contents through a drying column containing 7 to 10 cm of granular anhydrous sodium sulfate into the concentration flask. Rinse the distilling flask with 30-50 mL of methylene chloride and pour through the drying column. Concentrate the extract per Section 12.3.
32

Method 1698 December 2007
12.2 Soxhlet extraction of biosolids, solid samples and filtered solids from aqueous samples.
12.2.1 Assemble and pre-extract the Soxhlet apparatus for 1 - 2 hours using methylene chloride or hexane:acetone (40:60). After pre-extraction, disassemble the apparatus and allow to dry.
12.2.2 Add 80 to 100 g of powdered anhydrous sodium sulfate (Section 7.2.2) to the beaker containing the sample (Section 11.4.7, 11.5.3, or 11.6.5) and mix thoroughly. If the sample was filtered in Section 11.4.6 or 11.5.2.6 and the material to be extracted is on the filter, place the filter in a beaker and treat as described here. Cover the beaker with aluminum foil and dry until the mixture becomes a free-flowing powder (30 minutes minimum). Remix prior to extraction to prevent clumping.
12.2.3 Re-assemble the pre-extracted Soxhlet apparatus and add a fresh charge of hexane:acetone (40:60) to the reflux flask.
12.2.4 Transfer the sample/sodium sulfate mixture to the Soxhlet thimble, and install the thimble in the Soxhlet apparatus.
12.2.5 Rinse the beaker with several portions of solvent and add to the thimble. Fill the thimble/receiver with solvent. Apply power to the heating mantle to begin refluxing. Adjust as necessary to achieve a reflux rate of approximately 4 cycles per hour. Extract for 16-18 hours.
12.2.6 After extraction, cool and disassemble the apparatus.
12.2.7 Quantitatively transfer the extract to a macroconcentration device with solvent rinses and concentrate the extract per Section 12.3.
12.3 Macro-concentration
Extracts from aqueous or solid samples may be concentrated using any of the macro-concentration procedures described below, including: rotary evaporation, a heating mantle, or Kuderna-Danish concentrator.
If the sample was filtered in Section 11.4.6 or 11.5.2.6 and extracted in Section 12, the extracts of filtrate and of the solids may be combined prior to concentration or, if it is desirable to know the concentrations in the aqueous and solids portions separately, the extracts may be concentrated separately.
Note: In the concentration procedures below, the extract must not be allowed to concentrate to dryness, because low molecular weight steroid/hormones may be totally or partially lost.
12.3.1 Rotary evaporation concentration – Concentrate the extracts of the sample and QC aliquots in separate round-bottom flasks.
12.3.1.1 Assemble the rotary evaporator according to manufacturer’s instructions and warm the water bath to 45 º C. On days when the apparatus is used, pre-clean the rotary evaporator by concentrating 100
33
Method 1698 December 2007
mL of clean extraction solvent through the system. Archive both the concentrated solvent from this pre-cleaning and the solvent in the catch flask for a contamination check if necessary. Between samples, rinse down the feed tube with three 2- to 3- mL aliquots of solvent and collect the rinses in a waste beaker.
12.3.1.2 Add a few clean boiling chips to the round-bottom flask containing the sample extract and attach the flask to the rotary evaporator. Slowly apply vacuum to the system, and begin rotating the flask. Lower the flask into the water bath, and adjust the speed of rotation and the temperature as required to complete concentration in 15 to 20 minutes. At the proper rate of concentration, the flow of solvent into the receiving flask will be steady, but no bumping or visible boiling of the extract will occur.
Note: If the rate of concentration is too fast, analyte loss may occur.
12.3.1.3 When the liquid in the concentration flask has reached an apparent volume of approximately 2 mL, remove the flask from the water bath and stop the rotation. Slowly and carefully admit air into the system. Be sure not to open the valve so quickly that the extract is blown out of the flask. If a feed tube is used to feed the sample into the rotary evaporation apparatus rinse the feed tube with approximately 2 mL of solvent.
12.3.1.4 Quantitatively transfer the extract to an Erlenmeyer flask. If there is evidence of water in the round-bottom flask after the transfer, rinse the flask with hexane:acetone (40:60) and add to the Erlenmeyer flask. Mark and set aside the concentration flask for future use.
12.3.1.5 Add 10 - 20 g of granular anhydrous sodium sulfate to the Erlenmeyer flask to dry the extract. If sulfur is known or suspected to be present in the sample, and for all biosolids samples, add activated copper (Section 7.6.3) to remove the sulfur. Cover and allow to the extract dry and remove sulfur for 30 - 60 minutes, swirling occasionally.
12.3.1.6 After drying and sulfur removal, quantitatively transfer the extract to a vial or tube and proceed to Section 12.4 for microconcentration and solvent exchange, taking care to leave the sodium sulfate and copper foil in the flask.
12.3.2 Heating mantle concentration – Concentrate the extracts of the sample and QC aliquots in separate round-bottom flasks.
12.3.2.1 Add a few clean boiling chips to the round-bottom flask, and attach a three-ball macro Snyder column. Prewet the column by adding approximately 1 mL of solvent through the top. Place the round-bottom flask in a heating mantle, and apply heat as required to complete the concentration in 15 to 20 minutes. At the proper rate of distillation, the balls of the column will actively chatter, but the chambers will not flood.
34

Method 1698 December 2007
12.3.2.2 When the liquid has reached an apparent volume of approximately 10 mL, remove the round-bottom flask from the heating mantle and allow the solvent to drain and cool for at least 10 minutes. Remove the Snyder column and rinse the glass joint into the flask with small portions of solvent.
12.3.2.3 Quantitatively transfer the extract to an Erlenmeyer flask. If there is evidence of water in the flask after the transfer, rinse the flask with hexane:acetone (40:60) and add to the Erlenmeyer flask. Mark and set aside the flask and macro Snyder column for future use.
12.3.2.4 Add 10 - 20 g of granular anhydrous sodium sulfate to the Erlenmeyer flask to dry the extract. If sulfur is known or suspected to be present in the sample, and for biosolids samples, add activated copper (Section 7.6.3) to remove the sulfur. Cover and allow to dry for 30 - 60 minutes, swirling occasionally.
12.3.2.5 After drying and sulfur removal, quantitatively transfer the extract to a vial or tube and proceed to Section 12.4 for microconcentration and solvent exchange, taking care to leave the sodium sulfate and copper foil in the flask.
12.3.3 Kuderna-Danish (K-D) concentration
Note: The K-D technique is most useful for solvents such as methylene chloride, acetone, and hexane, which boil at temperatures well below 100 °C. Toluene is difficult to concentrate using the K-D technique unless a water bath fed by a steam generator is used. Therefore, K-D concentration may not be as useful for sample extracts that have been subjected to the layered alumina/Florisil cleanup in Section 13 as other macroconcentration techniques.
12.3.3.1 Add 1 to 2 clean boiling chips to the K-D receiver. Attach a three-ball macro Snyder column. Pre-wet the column by adding approximately 1 mL of solvent through the top.
12.3.3.2 Place the K-D apparatus in a hot water bath so that the entire lower rounded surface of the flask is bathed with steam. Adjust the vertical position of the apparatus and the water temperature as required to complete the concentration in 15 to 20 minutes. At the proper rate of distillation, the balls of the column will actively chatter but the chambers will not flood.
12.3.3.3 When the liquid has reached an apparent volume of 1 mL, remove the K-D apparatus from the bath and allow the solvent to drain and cool for at least 10 minutes. Remove the Snyder column and rinse the flask and its lower joint into the concentrator tube with 1 to 2 mL of solvent. A 5-mL syringe is recommended for this operation.
35

Method 1698 December 2007
12.3.3.4 Remove the three-ball Snyder column, add a fresh boiling chip, and attach a two-ball micro Snyder column to the concentrator tube. Prewet the column by adding approximately 0.5 mL of solvent through the top. Place the apparatus in the hot water bath.
12.3.3.5 Adjust the vertical position and the water temperature as required to complete the concentration in 5 to 10 minutes. At the proper rate of distillation, the balls of the column will actively chatter but the chambers will not flood.
12.3.3.6 When the liquid reaches an apparent volume of 0.5 mL, remove the apparatus from the water bath and allow to drain and cool for at least 10 minutes. If sulfur is known or suspected to be present in the sample, and for biosolids samples, add activated copper (Section 7.6.3). Cover and allow to stand for 30 - 60 minutes with occasional swirling to remove the sulfur.
12.3.3.7 After drying and sulfur removal, quantitatively transfer the extract to a vial or tube and proceed to Section 12.4 for micro-concentration and solvent exchange.
12.4 Micro-concentration and solvent exchange by nitrogen evaporation
Micro-concentration is used to reduce the volume of a sample extract to the volume required for cleanup or for derivatization and analysis. The layered alumina/Florisil column cleanup requires solvent exchange to 5% toluene in hexane; injection of a derivatized extract into the GC/HRMS requires solvent exchange to hexane (Section 13.3).
If the extract will not cleaned up, or already has been cleaned up, and it was spiked with the labeled cholesterol spiking solution (Section 7.15), adjust the volume to 50 mL. Take a 2-mL aliquot from this solution and separately concentrate both portions (2-mL and 48mL) for derivatization (Section 13.3) and analysis (Section 14).
12.4.1 Transfer the tube or vial containing the sample extract to a nitrogen evaporation device. Adjust the flow of nitrogen so that the surface of the solvent is just visibly disturbed.
Note: A large vortex in the solvent may cause analyte loss.
12.4.2 Lower the vial into a 45 ΕC water bath and continue concentrating. When the volume of the liquid is approximately 100 μL, add 2 to 3 mL of the desired solvent (5% toluene in hexane for the layered alumina/Florisil cleanup, or hexane for derivatization) and concentrate to approximately 100 μL. Repeat the addition of solvent and concentrate to approximately 100 μL once more.
12.4.3 If the extract is to be cleaned up by layered alumina/Florisil column, bring the final volume to 1.0 mL with 5% toluene in hexane and proceed with cleanup (Section 13.2).
36

Method 1698 December 2007
12.4.4 If the extract is not to be cleaned up, or has been cleaned up, proceed to Section 13.3 for derivatization.
13.0 Cleanup and Derivatization
13.1 Cleanup may not be necessary for relatively clean samples (e.g., treated effluents, groundwater, drinking water). If particular circumstances require the use of a cleanup procedure, the laboratory may use the procedure below or any other procedure but the laboratory must demonstrate that the requirements of Section 9.2 can be met using any cleanup procedure.
The layered alumina/Florisil (LAF) column (Section 13.2) has been shown to be especially effective for cleanup of untreated wastewaters from publicly owned treatment works (POTWs) and for biosolids. Prior to employing this cleanup, the laboratory must establish that the recommended elution volumes and collection points (cut points) are effective in processing the standards containing the analytes of interest in this method. That process is described in Section 13.2.2.
13.2 Layered alumina/Florisil (LAF) cleanup
Note: Exposure of the column and packing to moisture from the air should be minimized to prevent moisture from altering the elution volumes.
13.2.1 Column preparation
13.2.1.1 Separately prepare slurries of 5 g each of 5% deactivated alumina (Section 7.6.1) and 5% deactivated Florisil (Section 7.6.2) in methanol. Slurry pack the column first with the alumina followed by the Florisil.
13.2.1.2 Top the column with approximately 1 g of granular, anhydrous sodium sulfate (Section 7.2.1). Flush the column with 2 bed volumes of methanol followed by 2 bed volumes of 5% toluene in hexane. Allow the solvent to drain until just to the top of, but not below, the sodium sulfate layer.
13.2.2 Confirming the cut points for the LAF column
This method recommends elution volumes for collection of two chromatographic fractions (F1 and F2) of the material processed through the LAF column cleanup. Each laboratory must confirm that these volumes and collection cut points are appropriate for the LAF columns they prepare. This demonstration must be performed during the start-up phase of using the method, should be repeated if major changes in laboratory practices occur, and when column reagents from different lots or suppliers are to be employed.
Note: The cut point confirmation is not required with each batch of extracts processed through cleanup.
37

Method 1698 December 2007
13.2.2.1 Exchange an underivatized 500-µL aliquot of the CS-3 calibration solution (Table 4) to 5% toluene in hexane using the procedure in Section 12.4. An existing or expired standard may be used for this purpose. Bring to 1.0 mL volume.
Typical cut-points are as follows:
Fraction 1 (F1) – 5% toluene in hexane, 15 mL (discard) and
Fraction 2 (F2) − MeOH, 50 mL (collect).
13.2.2.2 Elute the column and separately collect volumes of 10, 15, and 20 mL of 5% toluene in hexane, then 50 mL of methanol, or other volumes as necessary to characterize the elution.
13.2.2.3 Analyze each of these four fractions to determine the maximum volume of 5% toluene in hexane that can be discarded without loss of the steroids/ hormones. 15 mL was found to be effective in validation of this method. GC/LRMS may be used for this test, if desired. Once the elution volumes are established, they are used with the same batch of adsorbents for all samples, blanks, IPRs, and OPRs.
13.2.3 Extract clean up
13.2.3.1 Pack a fresh LAF column (Section 13.2.1) each for the sample and QC aliquot. Carefully place the extract of the sample or QC aliquot on the top of the column with 2 rinses of 5% toluene in hexane and elute to the top of, but not below, the sodium sulfate layer.
13.2.3.2 If sulfur is known or suspected to be present in the sample, and for all biosolids samples, add activated copper (Section 7.6.3) to remove the sulfur. Refer to the most recent cut-point determination for elution volumes. Elute the LAF column with 5% toluene in hexane (F1, 15 mL or other volume as determined in cut point determination) and discard the eluate.
13.2.3.3 Elute the column with MeOH (F2). Collect the eluate in a 125-mL round-bottom flask. F2 contains the sterols and hormones.
Note: Samples containing high levels of sterols (and to which an aliquot of high level labeled cholesterol standard has been added) are split before proceeding.
12.2.3.4 Quantitatively transfer a 2 mL aliquot of the 50 mL extract to a centrifuge tube. Label this portion as a dilution of the original sample. Concentrate to about 1 mL by evaporation under nitrogen. Concentrate the remaining 48 mL of extract to 1 mL macro- and/or micro- concentration and transfer to another centrifuge tube with methylene chloride rinses.
38

Method 1698 December 2007
12.2.3.5 Prior to analysis, both portions of the F2 extract must be silylated to convert the sterols and hormones to their trimethylsilyl ethers.
13.2.3.6 Proceed with silylation (Section 13.3).
13.3 Derivatization by silylation
13.3.1 Quantitatively transfer the concentrated extract (Section 12.4.4 or 13.2.3.6) to a centrifuge tube with methylene chloride. For derivatization of a calibration standard (Section 7.12), add 500 µL of the standard to a centrifuge tube. Add 50 μL (approximately 4 drops) of pyridine to the tube(s).
13.3.2 Evaporate to near dryness (50 μL) using nitrogen evaporation (Section 12.4). Add 300 µL of methylene chloride and mix using a vortex mixer.
13.3.3 Transfer the extract to a GC/MS vial with methylene chloride rinses and evaporate to dryness.
13.3.3.1 Extracts of clean waters to be concentrated to 20 µL – Add 10 µL of pyridine to the vial and mix with a vortex mixer. Add 10 µL of 99:1 BSTFA:TMCS and apply a crimp cap to the vial. Incubate at 55 °C for 30 minutes. Spike with 2 µL of Labeled injection standard solution (Section 7.11.3) and evaporate to 20 µL under nitrogen. Label the vial with the sample number. Store in the dark at room temperature until ready for GC/HRMS analysis. If GC/HRMS analysis will not be performed on the same day, store the vial at less than -10 ΕC. Proceed to Section 14 for analysis.
13.3.3.2 Extracts of complex waters and solids – Add 50 µL of pyridine to the vial and mix with a vortex mixer. Add 50 µL of 99:1 BSTFA:TMCS and apply a crimp cap to the vial. Incubate at 55 °C for 15 minutes. Add another 50 µL of BSTFA:TMCS and incubate for 15 minutes. Spike with 50 µL of Labeled injection internal standard solution (Section 7.11.3) and bring to 500 µL with hexane. Label the vial with the sample number. Store in the dark at room temperature until ready for GC/HRMS analysis. If GC/HRMS analysis will not be performed on the same day, store the vial at less than -10 ΕC. Proceed to Section 14 for analysis.
14.0 HRGC/HRMS Analysis
14.1 Establish the operating conditions given in Section 10.1.1. Bring the extract to room temperature.
14.2 If an extract is to be re-analyzed and evaporation has occurred, do not add more labeled injection internal standard stock solution. Rather, bring the extract back to its previous volume (20 or 500 μL) with hexane.
39

Method 1698 December 2007
14.3 Inject 1.0 or 2.0 μL of the concentrated extract using on-column or splitless injection. The volume injected must be identical to the volume used for calibration (Section 10.3).
14.3.1 Start the GC column initial isothermal hold upon injection. Start MS data collection after the solvent peak elutes.
14.3.2 Monitor the exact m/zs for each steroid/hormone throughout its retention time window. Where warranted, monitor m/zs associated with interferents expected to be present.
14.3.3 Stop data collection after β-Estradiol-3-benzoate elutes. Return the column to the initial temperature for analysis of the next sample extract or standard.
15.0 System and Laboratory Performance
15.1 At the beginning of each 12-hour shift during which analyses are performed, GC/MS system performance and calibration are verified for all the steroid/hormones and labeled compounds. For these tests, analysis of the CS-3 calibration verification (VER) standard (Section 7.12 and Table 4) must be used to verify all performance criteria. Adjustment and/or recalibration (Section 10) must be performed until all performance criteria are met. Only after all performance criteria are met may samples, blanks, IPRs, and OPRs be analyzed.
15.2 MS resolution − Static resolving power checks must be performed at the beginning of each shift per Sections 10.2. If the requirements in Section 10.2 cannot be met, the problem must be corrected before analyses can proceed. If any of the samples in the previous shift may be affected by poor resolution, those samples must be re-analyzed.
15.3 Calibration verification
15.3.1 Inject the derivatized VER (CS-3) calibration standard using the procedure in Section 14.
15.3.2 The m/z abundance ratios for all steroid/hormones must be within the limits in Table 2 or in the most recent calibration; otherwise, the mass spectrometer must be adjusted until the m/z abundance ratios fall within the limits specified when the verification test is be repeated. If the adjustment alters the resolution of the mass spectrometer, resolution must be verified (Section 10.2) prior to repeat of the verification test.
15.3.3 The GC peaks representing each native steroid/hormone and labeled compound in the VER standard must be present with a S/N of at least 10; otherwise, the mass spectrometer must be adjusted and the verification test repeated.
15.3.4 Compute the concentration of the steroid/hormones that have labeled analogs by isotope dilution and the concentration of the steroid/hormones that do not have labeled analogs, and of the labeled compounds, by the internal standard technique. These concentrations are computed based on the calibration data in Section 10.
40

Method 1698 December 2007
15.3.5 For each compound, compare the concentration with the calibration verification limit in Table 5. If all compounds meet the acceptance criteria, calibration has been verified and analysis of standards and sample extracts may proceed. If, however, any compound fails its respective limit, the measurement system is not performing properly. In this event, prepare a fresh calibration standard or correct the problem and repeat the resolution (Section 15.2) and verification (Section 15.3) tests, or recalibrate (Section 10).
15.4 Retention times and GC resolution
15.4.1 Retention times
15.4.1.1 The absolute retention times of the labeled compounds (Section 7.14) in the verification test (Section 15.3) must be within ∀ 15 seconds of the respective retention times in the calibration (Section 10.1).
15.4.1.2 The relative retention times of native steroid/hormones and the labeled compounds in the verification test (Section 15.3) must be within their respective RRT limits in Table 2 or, if an alternative column or column system is employed, within their respective RRT limits for the alternative column or column system (Section 9.1.2.3).
15.4.1.3 If the absolute or relative retention time of any compound is not within the limits specified, the GC is not performing properly. In this event, adjust the GC and repeat the verification test (Section 15.3) or recalibrate (Section 10), or replace the GC column and either verify calibration or recalibrate.
15.4.2 GC resolution and minimum analysis time
15.4.2.1 The resolution and minimum analysis time specifications in Sections 6.18.2 and 10.1.2.2, respectively, must be met for the RTx-5 column or, if an alternative column or column system is employed, must be met as specified for the alternative column or column system (Section 9.1.2.3). If these specifications are not met, the GC analysis conditions must be adjusted until the specifications are met, or the column must be replaced and the calibration verification tests repeated Sections 15.3 - 15.4), or the system must be recalibrated (Section 10).
15.4.2.2 After the resolution and minimum analysis time specifications are met, update the retention times and relative retention times, but not the relative responses and response factors. For the relative responses and response factors, the multi-point calibration data (Sections 10.4 and 10.5) must be used.
41

Method 1698 December 2007
15.5 Ongoing precision and recovery
15.5.1 Analyze the derivatized extract of the ongoing precision and recovery (OPR) aliquot (Section 11.3.3, 11.4.5, 11.5.2.5, or 11.5.3.7) prior to analysis of samples from the same batch.
15.5.2 Compute the percent recovery of each steroid/hormone with a labeled analog by isotope dilution (Section 10.4). Compute the percent recovery of each native compound without a labeled analog, and of each labeled compound, by the internal standard method (Section 10.5).
15.5.3 For the native and labeled compounds, compare the recovery to the OPR limits given in Table 5. If all compounds meet the acceptance criteria, system performance is acceptable and analysis of blanks and samples may proceed. If, however, any individual concentration falls outside of the range given, the extraction/concentration processes are not being performed properly for that compound. In this event, correct the problem, re-prepare, extract, and clean up the sample batch and repeat the ongoing precision and recovery test.
15.5.4 If desired, add results that pass the specifications in Section 15.5.3 to initial and previous ongoing data for each compound in each matrix. Update QC charts to form a graphic representation of continued laboratory performance. Develop a statement of laboratory accuracy for each steroid and hormone in each matrix type by calculating the average percent recovery (R) and the standard deviation of percent recovery (SR). Express the accuracy as a recovery interval from R ! 2SR to R + 2SR. For example, if R = 95% and SR = 5%, the accuracy is 85 to 105%.
15.6 Blank – Analyze the method blank extracted with each sample batch immediately following analysis of the OPR aliquot to demonstrate freedom from contamination and freedom from carryover from the OPR analysis. If steroid/hormones will be carried from the OPR into the method blank, analyze one or more aliquots of solvent between the OPR and the method blank. The results of the analysis of the blank must meet the specifications in Section 9.5.2 before sample analyses may proceed.
16.0 Qualitative Determination
A steroid/hormone or labeled compound is identified in a standard, blank, or sample when all of the criteria in Sections 16.1 through 16.4 are met.
16.1 The signals for the two exact m/zs in Table 2 must be present and must maximize within the same two scans.
16.2 The signal-to-noise ratio (S/N) for the GC peak at each exact m/z must be greater than or equal to 2.5 for each compound detected in a sample extract, and greater than or equal to 10 for all compounds in the calibration and verification standards (Sections 10.3.3 and 15.3.3).
42

Method 1698 December 2007
16.3 The ratio of the integrated areas of the two exact m/zs specified in Table 2 must be within ∀30 percent of the theoretical limit in Table 2, or within ∀30 percent of the ratio in the midpoint (CS-3) calibration or calibration verification (VER), if the VER is more recent than the calibration.
16.4 The relative retention time of the peak for a steroid/hormone must be within the window specified in Table 2 or within similar limits developed from calibration data (Section 10.1.2). If an alternative column (Section 9.1.2.3) is employed, the RRT for the steroid/hormone must be within its respective RRT QC limits for the alternative column or column system (Section 6.18.3).
Note: For native steroid/hormones determined by internal standard quantitation, a steroid/hormone with the same exact m/zs as other steroid/hormones may fall within more than one RT window and be mis-identified unless the RRT windows are made very narrow, as in Table 2. Therefore, consistency of the RT and RRT with other steroid/hormones and the labeled compounds may be required for rigorous steroid/hormone identification. Retention time regression may aid in this identification.
16.5 Because of steroid/hormone RT overlap and the potential for interfering substances, it is possible that assessment of identification criteria (Sections 16.1 - 16.4) will be difficult. If identification is ambiguous, an experienced spectrometrist must determine the presence or absence of the steroid/hormone. Reports of the results must identify any time an ambiguous identification was made in this manner.
16.6 If the criteria for identification in Sections 16.1 - 16.5 are not met, the steroid or hormone has not been identified and the result for that steroid or hormone may not be reported or used for permitting or regulatory compliance purposes. If interferences preclude identification, a new aliquot of sample must be extracted, further cleaned up, and analyzed.
17.0 Quantitative Determination
17.1 Isotope dilution quantitation
17.1.1 By adding a known amount of a labeled steroid or hormone to each sample prior to extraction, correction for recovery of each steroid or hormone can be made because the native compound and its labeled analog exhibit similar effects upon extraction, concentration, and gas chromatography. Relative responses (RRs) are used in conjunction with the calibration data in Section 10.4 to determine concentrations in the final extract, so long as labeled compound spiking levels are constant.
17.1.2 Compute the concentrations of the steroid or hormone in the extract using the RR from the calibration data (Section 10.4) and following equation:
43
(A1n + A2n ) ClC (ng / mL) = ex (A1l + A2l ) RR

Method 1698 December 2007
Where:
Cex = The concentration of the steroid or hormone in the extract, and the other terms are as defined in Section 10.4.4
17.2 Internal standard quantitation and labeled compound recovery
17.2.1 Compute the concentration in the extract of each native compound that does not have a labeled analog, and of each labeled compound, using the response factor determined from the calibration data (Section 10.5) and the following equation:
(A1C s + A2s ) Cisex (ng / mL) =
(A1is + A2is ) RF
Where:
Cex = The concentration of the labeled compound in the extract, and the other terms are as defined in Section 10.5.1
17.2.2 Using the concentration in the extract determined above, compute the percent recovery of the labeled compound using the following equation:
Concentration found (ng / mL)Recov ery (%) = x 100Concentration spiked (ng / mL)
17.3 The concentration of a native compound in the solid phase of the sample is computed C
Concentration in solid sample (ng/kg) = ex Vex
Ws
using the concentration of the compound in the extract and the weight of the solids (Section 11.1.2.2), as follows: Where:
Cex = The concentration of the compound in the extract (ng/mL) Vex = The extract volume in mL Ws = The sample weight (dry weight) in kg
17.4 The concentration of a native compound in the aqueous phase of the sample is computed using the concentration of the compound in the extract and the volume of water extracted (Section 11.3), as follows:
C VConcentration in aqueous sample (ng/L) = ex ex x 1000
Vs
Where:
Cex = The concentration of the compound in the extract (ng/mL) Vex = The extract volume in mL Vs = The sample volume in liters
44

Method 1698 December 2007
17.5 Calibration range
17.5.1 If the SICP area at either quantitation m/z for any steroid or hormone exceeds the calibration range of the system, dilute the sample extract by the factor necessary to bring the concentration within the calibration range, adjust the concentration of the Labeled injection internal standard to 1000 ng/mL (pg/μL) in the extract, and analyze an aliquot of this diluted extract. If a steroid or hormone cannot be measured reliably by isotope dilution, dilute and analyze an aqueous sample or analyze a smaller portion of a soil, biosolid, or mixed-phase sample. Adjust the compound concentrations, detection limit, and minimum level to account for the dilution.
17.5.2 Cholesterol − Biosolids and other samples may contain concentrations of cholesterol that exceed the range of the analytical system. If a sample has been spiked with the labeled cholesterol spiking solution (Section 7.15) and the cholesterol concentration exceeds the range of the analytical system, the sample may be diluted and reanalyzed for cholesterol (only) by this method or may be analyzed by GC/LRMS, if desired.
17.6 Reporting of results
17.6.1 Reporting units
17.6.1.1 Aqueous samples – Report results in ng/L (parts-per-trillion).
17.6.1.2 Samples containing greater than 1% solids (soils, sediments, filter cake, compost) − Report results in ng/kg based on the dry weight of the sample. Also report the percent solids.
17.6.2 Reporting level
17.6.2.1 Report the result for each compound in each sample, blank, or standard (VER, IPR, OPR) at or above the minimum level of quantitation (ML; Table 2) to 3 significant figures. More significant figures may be used for computerized reporting. Report the result below the ML in each sample as <ML (where ML is the concentration at the ML), or as required by the regulatory authority or permit.
17.6.2.2 Blanks – Report the result for each steroid or hormone above the ML to 3 significant figures. Report results below the ML but above the MDL to 2 significant figures. More significant figures may be used for computerized reporting. Report results below the MDL as <MDL (where MDL is the concentration at the MDL), or as required by the regulatory authority or permit. In addition to reporting results for samples and blank(s) separately, the concentration of each steroid or hormone in a method blank or field blank associated with the sample may be subtracted from the results for that sample, or must be subtracted if requested or required by a regulatory authority or in a permit.
45

Method 1698 December 2007
17.6.2.3 Results for a steroid or hormone in a sample that has been diluted are reported at the least dilute level at which the area at the quantitation m/z is within the calibration range (Section 17.5).
17.6.2.4 For a steroid or hormone having a labeled analog, report results at the least dilute level at which the areas at the quantitation m/zs are within the calibration range (Section 17.5) and the labeled compound recovery is within the normal range for the method (Section 9.3 and Table 5).
17.6.2.5 Results from tests performed with an analytical system that is not in control must not be reported or otherwise used for permitting or regulatory compliance purposes, but do not relieve a discharger or permittee of reporting timely results.
18.0 Analysis of Complex Samples
18.1 Some samples may contain high levels (>10 ng/L; >1000 ng/kg) of the compounds of interest, interfering compounds, and/or polymeric materials. Some extracts may not concentrate to 500 μL. Others may overload the GC column and/or mass spectrometer.
18.2 Analyze a smaller aliquot of the sample (Section 17.5) when the extract will not concentrate to 500 μL after all cleanup procedures have been exhausted. If a smaller aliquot of soils or mixed-phase samples is analyzed, attempt to assure that the sample is representative.
18.3 Perform integration of peak areas and calculate concentrations manually when interferences preclude computerized calculations.
18.4 Recovery of labeled compounds − In an ideal reference matrix, recoveries of labeled compounds will be similar to those from the actual sample.
18.4.1 If the recovery of any of the labeled compounds is outside of the normal range (Table 5), a diluted sample must be analyzed (Section 17.5).
18.4.2 If the recovery of any of the labeled compounds in the diluted sample is outside of normal range, the calibration verification standard (Section 7.12) must be analyzed and calibration verified (Section 15.3).
18.4.3 If the calibration cannot be verified, a new calibration must be performed and the original sample extract reanalyzed.
18.4.4 If calibration is verified and the diluted sample does not meet the limits for labeled compound recovery, the method does not apply to the sample being analyzed and the result may not be reported or used for permitting or regulatory compliance purposes. In this case, alternative extraction and cleanup procedures in this method or an alternative GC column must be employed to resolve the interference. If all cleanup procedures in this method and an alternative GC column have been employed and labeled compound recovery remains outside of
46

Method 1698 December 2007
the normal range, extraction and/or cleanup procedures that are beyond this scope of this method will be required to analyze the sample.
19.0 Pollution Prevention
19.1 Pollution prevention encompasses any technique that reduces or eliminates the quantity or toxicity of waste at the point of generation. Many opportunities for pollution prevention exist in laboratory operation. EPA has established a preferred hierarchy of environmental management techniques that places pollution prevention as the management option of first choice. Whenever feasible, laboratory personnel should use pollution prevention techniques to address waste generation. When wastes cannot be reduced at the source, the Agency recommends recycling as the next best option.
19.2 The steroids/hormones in this method are used in extremely small amounts and pose little threat to the environment when managed properly. Standards should be prepared in volumes consistent with laboratory use to minimize the disposal of excess volumes of expired standards.
19.3 For information about pollution prevention that may be applied to laboratories and research institutions, consult Reference 10.
20.0 Waste Management
20.1 The laboratory is responsible for complying with all Federal, State, and local regulations governing waste management, particularly the hazardous waste identification rules and land disposal restrictions, and to protect the air, water, and land by minimizing and controlling all releases from fume hoods and bench operations. Compliance is also required with any sewage discharge permits and regulations. An overview of requirements can be found in Reference 11.
20.2 Samples containing HCl or H2SO4 to pH <2, or KOH or NaOH to pH >12 are hazardous and must be neutralized before being poured down a drain or must be handled as hazardous waste.
20.3 The steroid/hormones decompose above 500 ΕC. Low-level waste such as absorbent paper, tissues, animal remains, and plastic gloves may be burned in an appropriate incinerator. Gross quantities (milligrams) should be packaged securely and disposed of through commercial or governmental channels that are capable of handling extremely toxic wastes.
20.4 For further information on waste management, consult References 10 and 12.
21.0 Method Performance
This method was developed in a single laboratory, and performance data from this laboratory are included in Table 7. Additional data will be included as they are developed.
47
Method 1698 December 2007
22.0 References
1 EPA Methods 1613, 1614, and 1668A. 2 "Analytical Method for the Determination of Sterols and Hormones with BSTFA
Derivatization and GC/HRMS.”Axys Analytical Services (proprietary). 3 "Working with Carcinogens," Department of Health, Education, & Welfare, Public
Health Service, Centers for Disease Control, NIOSH, Publication 77-206, August 1977, NTIS PB-277256.
4 "OSHA Safety and Health Standards, General Industry," OSHA 2206, 29 CFR 1910. 5 "Safety in Academic Chemistry Laboratories," ACS Committee on Chemical Safety,
1979. 6 Provost, L.P., and Elder, R.S., "Interpretation of Percent Recovery Data," American
Laboratory, 15: 56-83, 1983. 7 "Standard Practice for Sampling Water," ASTM Annual Book of Standards, ASTM, 1916
Race Street, Philadelphia, PA 19103-1187, 1980.
9 "Handbook of Analytical Quality Control in Water and Wastewater Laboratories," USEPA EMSL, Cincinnati, OH 45268, EPA-600/4-79-019, March 1979.
10. Less is Better: Laboratory Chemical Management for Waste Reduction, available from
the American Chemical Society's Department of Governmental Relations and SciencePolicy, 1155 16th Street NW, Washington DC 20036, 202/872-4477.
11. Environmental Management Guide for Small Laboratories (EPA 233-B-98-001). 12. The Waste Management Manual for Laboratory Personnel, available from the American
Chemical Society's Department of Government Relations and Science Policy, 1155 16thStreet NW, Washington, DC 20036, 202/872-4477.
48
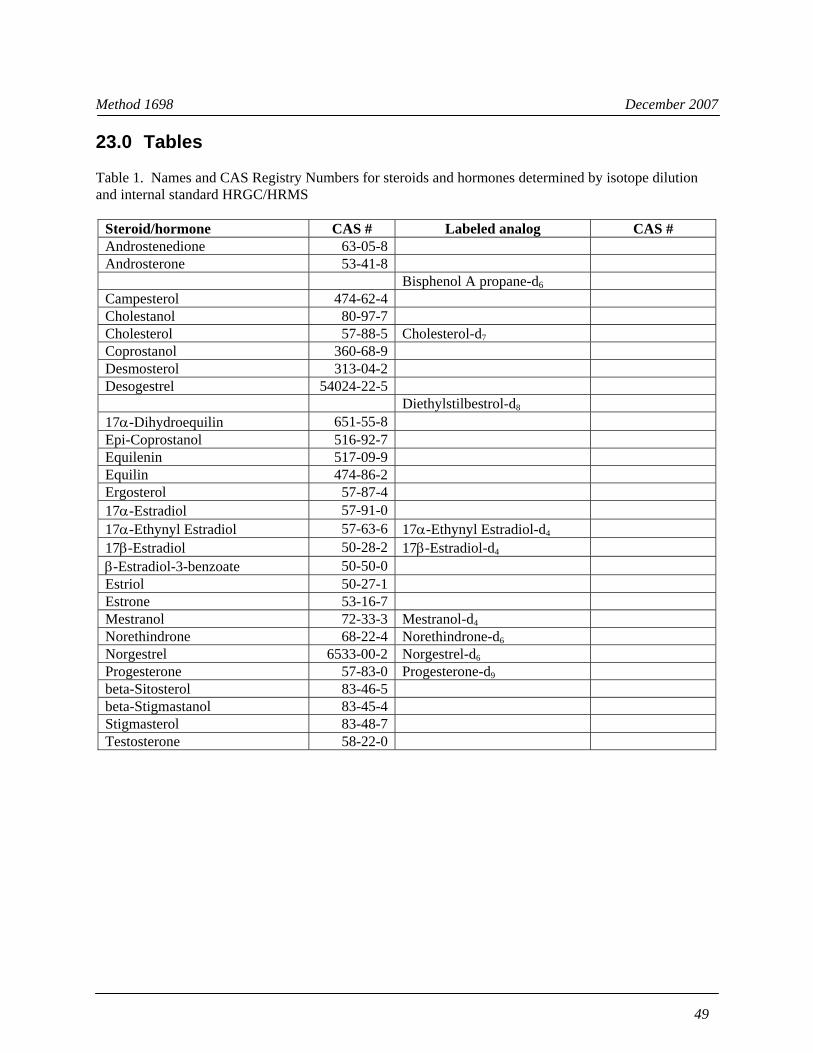
Method 1698 December 2007
23.0 Tables
Table 1. Names and CAS Registry Numbers for steroids and hormones determined by isotope dilution and internal standard HRGC/HRMS
Steroid/hormone CAS # Labeled analog CAS # Androstenedione 63-05-8Androsterone 53-41-8
Bisphenol A propane-d6
Campesterol 474-62-4Cholestanol 80-97-7Cholesterol 57-88-5 Cholesterol-d7
Coprostanol 360-68-9Desmosterol 313-04-2Desogestrel 54024-22-5
Diethylstilbestrol-d8
17α-Dihydroequilin 651-55-8 Epi-Coprostanol 516-92-7Equilenin 517-09-9Equilin 474-86-2Ergosterol 57-87-417α-Estradiol 57-91-0 17α-Ethynyl Estradiol 57-63-6 17α-Ethynyl Estradiol-d4
17β-Estradiol 50-28-2 17β-Estradiol-d4
β-Estradiol-3-benzoate 50-50-0 Estriol 50-27-1Estrone 53-16-7Mestranol 72-33-3 Mestranol-d4
Norethindrone 68-22-4 Norethindrone-d6
Norgestrel 6533-00-2 Norgestrel-d6
Progesterone 57-83-0 Progesterone-d9
beta-Sitosterol 83-46-5beta-Stigmastanol 83-45-4Stigmasterol 83-48-7Testosterone 58-22-0
49

Method 1698 December 2007
Table 2. Retention times (RTs); relative retention times (RRTs); retention time and quantitation references; exact m/zs; theoretical m/z ratios; method detection limits (MDLs); and minimum levels of quantitation (MLs), for the TMS derivatives of steroids and hormones
Ref
Labeled injection internal standard or steroid/ hormone (as TMS derivative)
RT (sec) 1 RRT 2
RT window (sec) 3
RT ref
Quant ref
Exact m/zs4 m1/m2
Theoretical ratio Function
Detection limits and minimum levels of quantitation 5
Water (ng/L)
Other (ng/kg)
Extract (pg/ΦL)
1 2 MDL ML MDL ML ML 1 n-Octadecanol-d37
(6) 1055 0.993 20 2 2 374.5405 365.5439 4.50 1 2 Pyrene-d10 1062 1.000 100 self ref 213.1400 214.0000 5.62 13 Bisphenol A-propane-d6 1104 1.040 20 2 2 360.1894 361.1927 2.90 2 4 Androsterone 1268 1.202 6 1 10 347.2406 348.2440 3.44 2 0.3 2 30 200 2 5 Desogestrel 1286 1.219 6 1 10 353.2300 354.2334 3.21 2 0.3 2 30 200 2 6 17α-Estradiol 1349 1.279 6 1 10 416.2566 417.2600 2.67 2 0.1 2 10 200 2 7 Estrone 1354 1.283 6 1 10 342.2015 343.2048 3.45 2 0.2 2 20 200 2 8 Androstenedione 1355 1.284 6 1 10 286.1933 287.1966 4.73 2 0.3 10 30 1000 10 9 Equilin 1359 1.288 6 1 1 340.1858 341.1892 3.46 2 0.1 2 10 200 2
10 17β-Estradiol-d4 1380 1.299 20 2 2 420.2817 421.2851 2.67 2 11 17β-Estradiol 1382 1.001 6 10 10 416.2566 417.2600 2.67 2 0.1 2 10 200 2 12 Testosterone 1396 1.012 8 10 10 360.2484 361.2518 3.32 2 0.7 2 70 200 2 13 Equilenin 1425 1.351 8 1 1 338.1702 339.1739 3.46 3 0.1 2 10 200 2 14 Mestranol-d4 1424 1.341 20 2 2 371.2344 372.2378 3.21 315 Mestranol 1427 1.002 6 14 14 367.2093 368.2127 3.21 3 0.1 2 10 200 2 16 Norethindrone-d6 1434 1.350 20 2 2 361.2470 362.2503 3.32 317 Norethindrone 1438 1.003 6 16 16 355.2093 356.2127 3.31 3 0.1 2 10 200 2 18 17α-Dihydroequilin 1468 0.995 6 19 19 307.1913 308.1946 3.39 4 0.2 2 20 200 2 19 17α-Ethynyl Estradiol-d4 1476 1.390 20 2 2 429.2583 430.2616 2.59 4 20 17α-Ethynyl Estradiol 1478 1.001 6 19 19 425.2332 426.2365 2.59 4 0.1 2 10 200 2 21 Progesterone-d9 1496 1.409 20 2 2 323.2811 324.2844 3.09 422 Progesterone 1503 1.005 6 21 21 314.2246 315.2279 4.44 4 2.1 10 21 1000 10 23 Norgestrel-d6 1535 1.455 20 2 2 361.2470 362.2503 3.32 424 Norgestrel 1540 1.003 6 23 23 355.2093 356.2127 3.32 4 0.1 4 10 400 4 25 Estriol 1577 1.027 6 23 23 504.2910 505.2944 2.17 5 0.1 2 10 200 2 26 Coprostanol 1737 0.957 6 28 28 370.3631 371.3664 3.18 5 1.3 2 130 200 2 27 Epicoprostanol 1745 0.961 6 28 28 370.3631 371.3664 3.18 5 0.7 2 70 200 2 28 Cholesterol-d7 1815 1.709 20 2 2 375.3913 376.3947 3.18 5
50

51
Method 1698 December 2007
Ref
Labeled injection internal standard or steroid/ hormone (as TMS derivative)
RT (sec) 1 RRT 2
RT window (sec) 3
RT ref
Quant ref
Exact m/zs4 m1/m2
Theoretical ratio Function
Detection limits and minimum levels of quantitation 5
Water (ng/L)
Other (ng/kg)
Extract (pg/ΦL)
1 2 MDL ML MDL ML ML 29 Cholesterol 1821 1.003 10 28 28 368.3474 369.3508 3.18 5 0.6 est 10 60 est 1000 10 30 Cholestanol 1829 1.008 6 28 28 445.3865 446.3899 2.62 5 2.7 10 270 1000 10 31 Desmosterol 1851 1.020 8 28 28 441.3552 442.3586 2.90 5 5.2 20 520 2000 20 32 Ergosterol 1886 1.039 6 28 28 363.3447 364.3475 3.08 5 20 est 50 2000 5000 50 33 Campesterol 1901 1.047 6 28 28 382.3631 383.3664 3.08 5 4.6 10 460 1000 10 34 Stigmasterol 1925 1.061 6 28 28 484.4100 485.4134 1.94 5 0.6 est 2 60 200 2 35 β-Sitosterol 1974 1.088 6 28 28 486.4257 487.4290 2.41 5 1.2 est 6 120 500 6 36 β-Stigmastanol 1983 1.093 6 28 28 488.4413 489.4447 2.41 5 2.0 est 6 200 500 6 37 β-Estradiol-3-benzoate 2186 1.424 12 23 23 105.0340 106.0374 12.72 6 0.6 2 60 200 2
1. Retention time of steroid/hormone or labeled compound.2. Relative retention time (RRT) between the target and reference compound.3. RT limits based on estimated RRT variability.4. Calculation of accurate masses monitored in this method is based on most abundant fragment ion for the predominant TMS derivative. Generally these
are M and M+1 ions of the TMS ether molecular ions, but there are several exceptions.5. Method detection limits (MDLs) and minimum levels of quantitation (MLs) with no interferences present.6. Use Bisphenol A-propane-d6 as the internal standard if there is an interference with n-Octadecanol-d37

Method 1698 December 2007
Table 2A. Formulas and quantitation m/zs for sterols and hormones analyzed as trimethylsilyl ethers
Compound Formula of Parent
Compound
# TMS Moieties in Derivative
Type of Ion Monitored
Formula of Ion Monitored
Masses Monitored
M1 M2
Desogestrel C22 H30 O 1 M -C2H5 C23 H33 O Si 353.2300 354.2334
17a-Estradiol C18 H24 O2 2 M C24 H40 O2 Si2 416.2566 417.2600
Estrone C18 H22 O2 1 M C21 H30 O2 Si 342.2015 343.2048
Androsterone C19 H30 O2 1 M-CH3 C21 H35 O2 Si 347.2406 348.2440
Androstenedione C19 H26 O2 Determine underivatized (1) 286.1933 287.1960
Equilin C18 H20 O2 1 M C21 H28 O2 Si 340.1858 341.1892
17b-Estradiol C18 H24 O2 2 M C24 H40 O2 Si2 416.2566 417.2600
Testosterone C19 H28 O2 1 M C22 H36 O2 Si 360.2484 361.2518
Equilenin C18 H18 O2 1 M C21 H26 O2 Si 338.1702 339.1735
Mestranol C21 H26 O2 1 M-CH3 C23 H31 O2 Si 367.2093 368.2127
Norethindrone C20 H26 O2 1 M-CH3 C22 H31 O2 Si 355.2093 356.2127
17a-Dihydroequilin C18 H22 O2 2 M-C8H9 C16 H27 O2 Si2 307.1549 308.1583
Progesterone C21 H30 O2 Determine underivatized (1) 314.2246 315.2309
17a-Ethnyl-Estradiol C20 H24 O2 2 M-CH3 C25 H37 O2 Si2 425.2332 426.2365
Norgestrel C21 H28 O2 1 M-C2H5 C22 H31 O2 Si 355.2093 356.2127
Estriol C18 H24 O3 3 M C27 H48 O3 Si3 504.2910 505.2944
Coprostanol C27 H48 O 1 M-C3 H10 O Si C27 H46 370.3600 371.3633
Epicoprostanol C27 H48 O 1 M-C3 H10 O Si C27 H46 370.3600 371.3633
Cholesterol C27 H46 O 1 M-C3 H10 O Si C27 H44 368.3443 369.3477
Cholestanol C27 H48 O 1 M-CH3 C29 H53 O Si 445.3865 446.3899
Desmosterol C27 H44 O 1 M-CH3 C29 H49 O Si 441.3552 442.3586
Ergosterol C28 H44 O 1 M-C4 H13 O Si C27 H39 363.3052 364.3085
Campesterol C28 H48 O 1 M-C3 H10 O Si C28 H46 382.3600 383.3633
Stigmasterol C29 H48 O 1 M C32 H56 O Si 484.4100 485.4134
b-Sitosterol C29 H50 O 1 M C32 H58 O Si 486.4257 487.4290
b-Stigmastanol C29 H52 O 1 M C32 H60 O Si 488.4413 489.4447
17a-Estradiol-3-Benzoate C25 H28 O3 1 C7 H5 O C7 H5 O 105.0340 106.0374
Bisphenol A-propane-d6 C15 H10 D6 O2 2 M-CD3 C20 H26 D6 O2 Si2 360.1894 361.1927
17b-Estradiol-d4 C18 H20 D4 O2 2 M C24 H36 D4 O2 Si2 420.2817 421.2851
Mestranol-d4 C21 H22 D4 O2 1 M-CH3 C23 H27 D4 O2 Si 371.2344 372.2378
Norethindrone-d6 C20 H20 D6 O2 1 M-CH3 C22 H25 D6 O2 Si 361.2470 362.2503
17a-Ethinyl-Estradiol-d4 C20 H20 D4 O2 2 M-CH3 C25 H33 D4 O2 Si2 429.2583 430.2616
Progesterone-d9 C21 H21 D9 O2 Determine underivatized (1) 323.2811 324.2844
Norgestrel-d6 C21 H24 D6 O2 1 M-C2H5 C22 H25 D6 O2 Si 361.2470 362.2503
n-Octadecanol-d37 C18 H D37 O 1 M C21 H10 D37 O Si 364.5405 365.5439
Cholesterol-d7 C27 H39 D7 O 1 M-C3 H10 O Si C27 H37 D7 375.3882 376.3916 1. The TMS derivatives of these compounds are unstable and decompose to their underivatized forms
52

Method 1698 December 2007
Table 3. Suggested stock and spiking solution concentrations, and concentrations in final 500-μL extract
Compound Stock solution (μg/mL)1 Spiking solution (ng/mL) Conc in extract (ng/mL)
Native compound solutions (2)
Desogestrel 10 100 200
17α-Estradiol 10 100 200
Estrone 10 100 200
Androsterone 10 100 200
Androstenedione 50 500 1000
Equilin 10 100 200
17β-Estradiol 10 100 200
Testosterone 10 100 200
Equilenin 10 100 200
Mestranol 10 100 200
Norethindrone 10 100 200
17α-Dihydroequilin 10 100 200
Progesterone 50 500 1000
17α-Ethynyl-Estradiol 10 100 200
Norgestrel 20 200 400
Estriol 10 100 200
Coprostanol 10 100 200
Epicoprostanol 10 100 200
Cholesterol 50 500 1000
Cholestanol 10 100 200
Desmosterol 50 500 1000
Ergosterol 50 500 1000
Campesterol 10 100 200
Stigmasterol 10 100 200
β-Sitosterol 30 300 600
β-Stigmastanol 30 300 600
β-Estradiol-3-Benzoate 10 100 200
Labeled compound solution (3)
n-Octadecanol-d37 50 500 1000
Bisphenol A-propane-d6 50 500 1000
17β-Estradiol-d4 2.0 100 200
Mestranol-d4 50 500 1000
Norethindrone-d6 50 500 1000
53

Method 1698 December 2007
Compound Stock solution (μg/mL)1 Spiking solution (ng/mL) Conc in extract (ng/mL)
17α-Ethynyl-Estradiol-d4 50 500 1000
Progesterone-d9 50 500 1000
Norgestrel-d6 50 500 1000
Cholesterol-d7 250 2500 5000
Labeled cholesterol spiking solution for biosolids (4)
Cholesterol-d7 6000 60000 120000
Labeled injection internal standard solution (5)
Pyrene-d10 2.5 250 1. Concentration of combined individual stock solutions (Section 7.9.1) 2. When 1 mL of the Native compound spiking solution is spiked into an IPR or OPR and concentrated to 500 µL,
or when 40 µL is spiked into an IPR or OPR and concentrated to 20 µL, the final extract concentrations will be as shown in the last column.
3. When 1 mL of the Labeled compound spiking solution is spiked into a sample, IPR, OPR, or blank and concentrated to 500 µL, or when 40 µL is spiked and concentrated to 20 µL, the final extract concentrations willbe as shown in the last column.
4. When 1 mL of this solution is spiked into a sample along with 1 mL of the labeled compound spiking solution,and the sample extract is concentrated to 500 µL, the concentration of Cholesterol-d7 will be 125 µg/mL(125,000 ng/mL), 25 times the nominal concentration. This solution is not spiked into a sample to beconcentrated to 20 µL, nor into an IPR, OPR, or blank.
5. When 50 µL of this solution is spiked into a 500 µL extract, or 2 µL is spiked into a 20 µL extract, theconcentration in the extract will be 250 ng/mL (250 pg/µL)
54

Method 1698 December 2007
Table 4. Concentrations of steroids/hormones in calibration and calibration verification standards
Solution concentration (ng/mL; pg/µL)
Ratio between levels 1 5 25 100 500 2500
Solution identifier CS-0.2 CS-1 CS-2 CS-3
(VER) (1) CS-4 CS-5
Native (unlabeled) compounds
Desogestrel 2.00 10.0 50.0 200 1000 5000
17α-Estradiol 2.00 10.0 50.0 200 1000 5000
Estrone 2.00 10.0 50.0 200 1000 5000
Androsterone 2.00 10.0 50.0 200 1000 5000
Androstenedione 10.0 50.0 250.0 1000 5000 25000
Equilin 2.00 10.0 50.0 200 1000 5000
17β-Estradiol 2.00 10.0 50.0 200 1000 5000
Testosterone 2.00 10.0 50.0 200 1000 5000
Equilenin 2.00 10.0 50.0 200 1000 5000
Mestranol 2.00 10.0 50.0 200 1000 5000
Norethindrone 2.00 10.0 50.0 200 1000 5000
17α-Dihydroequilin 2.00 10.0 50.0 200 1000 5000
Progesterone 10.0 50.0 250 1000 5000 25000
17α-Ethynyl-Estradiol 2.00 10.0 50.0 200 1000 5000
Norgestrel 4.00 20.0 100 400 2000 10000
Estriol 2.00 10.0 50.0 200 1000 5000
Coprostanol 2.00 10.0 50.0 200 1000 5000
Epicoprostanol 2.00 10.0 50.0 200 1000 5000
Cholesterol 10.0 50.0 250 1000 5000 25000
Cholestanol 2.00 10.0 50.0 200 1000 5000
Desmosterol 10.0 50.0 250 1000 5000 25000
Ergosterol 10.0 50.0 250 1000 5000 25000
Campesterol 2.00 10.0 50.0 200 1000 5000
Stigmasterol 2.00 10.0 50.0 200 1000 5000
β-Sitosterol 6.00 30.0 150 600 3000 15000
β-Stigmastanol 6.00 30.0 150 600 3000 15000
β-Estradiol-3-Benzoate 2.00 10.0 50.0 200 1000 5000
Labeled compounds
17β-Estradiol-d4 200 200 200 200 200 200
Mestranol-d4 1000 1000 1000 1000 1000 1000
Norethindrone-d6 1000 1000 1000 1000 1000 1000
55
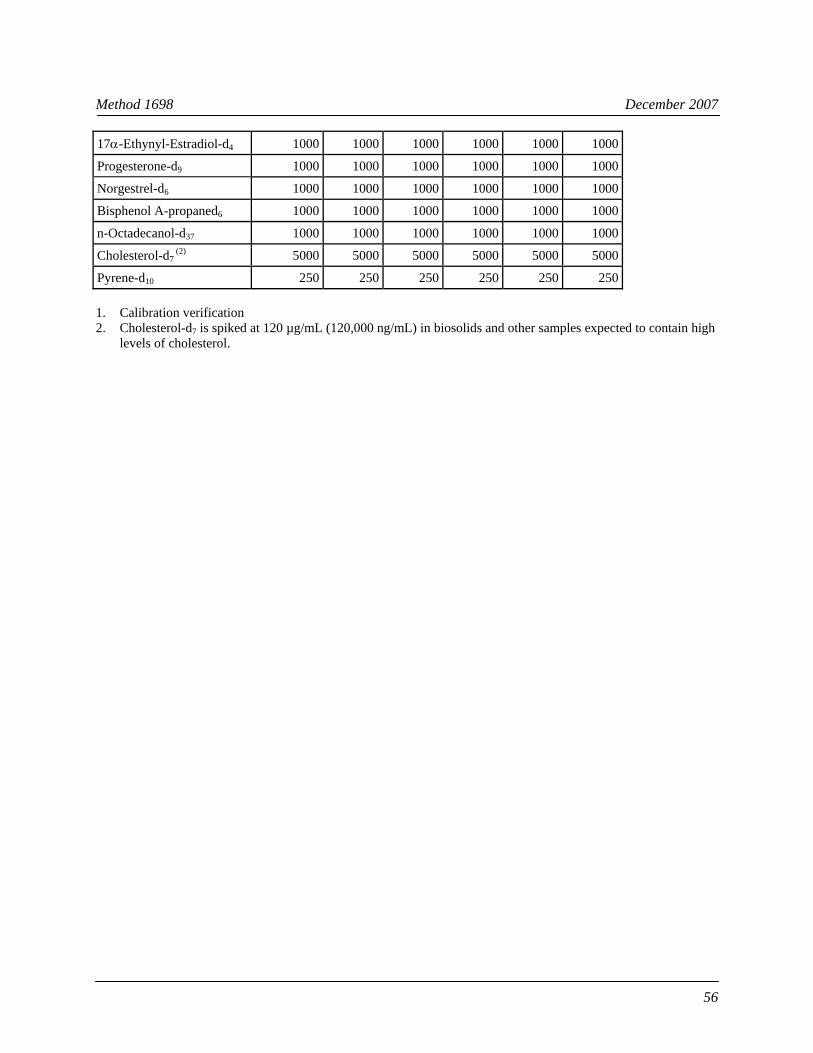
Method 1698 December 2007
17α-Ethynyl-Estradiol-d4 1000 1000 1000 1000 1000 1000
Progesterone-d9 1000 1000 1000 1000 1000 1000
Norgestrel-d6 1000 1000 1000 1000 1000 1000
Bisphenol A-propaned6 1000 1000 1000 1000 1000 1000
n-Octadecanol-d37 1000 1000 1000 1000 1000 1000
Cholesterol-d7 (2) 5000 5000 5000 5000 5000 5000
Pyrene-d10 250 250 250 250 250 250
1. Calibration verification2. Cholesterol-d7 is spiked at 120 µg/mL (120,000 ng/mL) in biosolids and other samples expected to contain high
levels of cholesterol.
56

Method 1698 December 2007
Table 5. QC acceptance criteria for steroids and hormones in VER, IPR, OPR, and samples.
Steroid/Hormone VER (%) IPR
OPR (%) Labeled compound recovery in samples X (%) RSD (%)
Native compounds
Androstenedione 70 – 130 6 – 180 59 5 – 200
Androsterone 70 – 130 55 – 109 30 50 – 121
Campesterol 70 – 130 44 – 180 30 40 – 200
Cholestanol 70 – 130 55 – 148 30 50 – 164
Cholesterol 70 – 130 6 – 180 71 5 – 200
Coprostanol 70 – 130 37 – 180 30 34 – 200
Desmosterol 70 – 130 6 – 180 30 5 – 200
Desogestrel 70 – 130 55 – 108 30 50 – 120
17α-Dihydroequilin 70 – 130 49 – 136 30 45 – 151
Epi-Coprostanol 70 – 130 55 – 177 30 50 – 197
Equilenin 70 – 130 6 – 180 106 5 – 200
Equilin 65 – 135 6 – 180 95 5 – 200
Ergosterol 50 – 150 6 – 180 58 5 – 200
17α-Estradiol 70 – 130 55 – 108 30 50 – 120
17α-Ethynyl Estradiol 70 – 130 55 – 110 30 50 – 123
17β-Estradiol 70 – 130 55 – 158 30 50 – 176
β-Estradiol-3-benzoate 70 – 130 6 – 170 128 5 – 189
Estriol 70 – 130 6 – 173 49 5 – 193
Estrone 70 – 130 55 – 155 30 50 – 173
Mestranol 70 – 130 55 – 108 30 50 – 120
Norethindrone 70 – 130 50 – 180 38 45 – 200
Norgestrel 70 – 130 50 – 180 36 46 – 200
Progesterone 70 – 130 6 – 180 153 5 – 200
β-Sitosterol 70 – 130 6 – 180 74 5 – 200
β-Stigmastanol 70 – 130 32 – 180 30 29 – 200
Stigmasterol 70 – 130 55 – 180 30 50 – 200
Testosterone 70 – 130 55 – 123 30 50 – 136
Labeled compounds
Cholesterol-d7 70 – 130 55 – 108 30 50 – 120 50 – 120
17α-Ethynyl Estradiol-d4 70 – 130 55 – 108 30 50 – 120 50 – 120
17β-Estradiol-d4 70 – 130 55 – 108 30 50 – 120 29 – 132
Mestranol-d4 70 – 130 55 – 108 30 50 – 120 50 – 120
57

Method 1698 December 2007
Steroid/Hormone VER (%) IPR
OPR (%) Labeled compound recovery in samples X (%) RSD (%)
Norethindrone-d6 70 – 130 40 – 108 30 37 – 120 12 – 120
Norgestrel-d6 70 – 130 40 – 108 30 36 – 120 7 – 120
Progesterone-d9 70 – 130 6 – 180 73 5 – 200 5 – 200
58
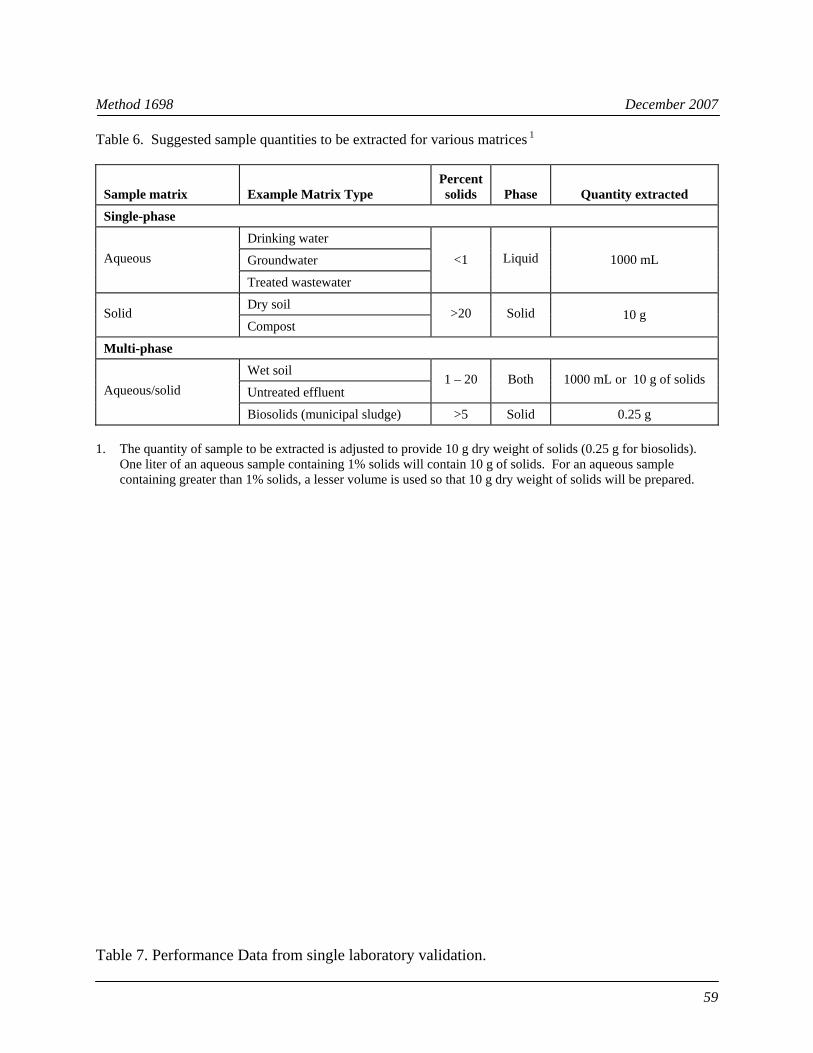
Method 1698 December 2007
Table 6. Suggested sample quantities to be extracted for various matrices 1
Sample matrix Example Matrix Type Percent solids Phase Quantity extracted
Single-phase
Aqueous Drinking water
<1 Liquid 1000 mL Groundwater
Treated wastewater
Solid Dry soil
>20 Solid 10 g Compost
Multi-phase
Aqueous/solid Wet soil
1 – 20 Both 1000 mL or 10 g of solids Untreated effluent
Biosolids (municipal sludge) >5 Solid 0.25 g
1. The quantity of sample to be extracted is adjusted to provide 10 g dry weight of solids (0.25 g for biosolids).One liter of an aqueous sample containing 1% solids will contain 10 g of solids. For an aqueous samplecontaining greater than 1% solids, a lesser volume is used so that 10 g dry weight of solids will be prepared.
Table 7. Performance Data from single laboratory validation.
59

Method 1698 December 2007
Biosolids-Based on 2 samples Solid-Based on 4 samples Reagent Water-Based on 6 samples
Biosolids Average
Recovery
Biosolids Standard Deviation
Biosolids Relative Standard Deviation
Solids Average
Recovery
Solids Standard Deviation
Solids Relative Standard Deviation
Water Average
Recovery
Water Standard Deviation
Water Relative Standard Deviation
Desogestrel 212.63 15.05 7.08 85.07 3.44 4.04 79.44 0.10 0.13 17a-Estradiol 195.39 17.45 8.93 88.23 3.18 3.61 102.46 0.02 0.01
Estrone 243.71 67.16 27.56 103.79 7.17 6.91 134.07 0.12 0.09Androstenone 85.28 9.22 10.81 107.04 4.87 4.55 108.42 0.04 0.03
Androstenedione 179.66 61.61 34.29 142.25 40.84 28.71 60.72 0.13 0.21 Equilin 23.52 11.56 49.15 210.68 33.47 15.89 154.16 1.15 0.75
17b-Estradiol 73.24 3.58 4.89 128.60 10.33 8.03 139.75 0.14 0.10Testosterone 32.23 5.07 15.72 94.68 4.22 4.46 114.27 0.06 0.05
Equilenin 109.98 9.19 8.36 152.30 11.95 7.85 179.13 1.29 0.72Mestranol 94.97 1.94 2.04 102.07 1.44 1.41 108.01 0.01 0.01
Norethindrone 104.06 50.40 48.43 123.13 6.78 5.51 158.91 0.36 0.2217a-Dihydroequilin-bis 168.94 16.41 9.71 81.19 6.91 8.51 111.59 0.13 0.11
Progesterone 176.87 55.04 31.12 149.93 10.71 7.15 271.70 2.26 0.83 17a-Ethynyl-Estradiol 100.82 3.02 3.00 98.71 1.29 1.31 111.04 0.01 0.01
Norgestrel 101.60 13.43 13.21 118.36 6.37 5.38 155.36 0.33 0.21Estriol-tris 184.60 53.91 29.20 111.14 20.62 18.55 23.00 0.09 0.40
Coprostanol * * * 89.93 4.44 4.93 157.29 0.04 0.02Epicoprostanol * * * 95.67 1.92 2.00 147.77 0.07 0.05
Cholesterol * * * 297.43 109.48 36.81 136.96 0.12 0.09Cholestanol * * * 102.03 5.72 5.61 133.35 0.03 0.03Desmosterol * * * 28.36 6.65 23.44 152.83 0.04 0.02Ergosterol * * * * * * 138.13 0.43 0.31
Campesterol * * * 95.50 6.11 6.40 161.93 0.05 0.03Stigmasterol * * * 114.75 16.46 14.34 164.65 0.12 0.07b-Sitosterol * * * 203.53 90.81 44.62 275.05 0.89 0.32
b-Stigmastanol * * * 103.19 7.98 7.73 191.00 0.07 0.04b-Estradiol-3-Benzoate 194.45 41.50 21.34 50.67 22.69 44.77 68.91 0.51 0.75 d6-Bisphenol-a-propane 76.65 3.64 4.75 79.54 6.12 7.70 70.33 8.69 12.36
d8-diethylstilbesterol 56.18 2.01 3.58 13.74 2.22 16.13 31.63 8.29 26.22 d4-Equilin 86.10 24.79 28.79 31.28 1.86 5.94 56.67 22.73 40.10
d4-17b-Estradiol 58.80 7.07 12.02 86.02 2.41 2.80 99.57 11.91 11.96 d4-Mestranol 76.65 4.37 5.70 84.70 2.22 2.62 80.88 9.88 12.21
d6-Norethindrone 60.38 15.08 24.98 56.38 5.15 9.14 49.68 18.80 37.85 d4-17a-Ethynyl-Estradiol 82.95 5.56 6.70 78.66 4.10 5.21 71.02 10.74 15.13
d9-Progesterone 129.15 53.61 41.51 88.34 35.57 40.26 28.98 15.90 54.87 d6-Norgestrel 61.95 16.93 27.33 57.46 5.56 9.67 42.03 16.72 39.77 d7-Cholesterol 89.58 6.86 7.66 92.66 3.54 3.82 74.27 8.13 10.95
Note: For biosolids recoveries * indicates that compounds were found in high concentrations in biosolids samples, rendering MS/MSD results unreliable.
60

Method 1698 December 2007
24.0 Glossary
These definitions and purposes are specific to this method but have been conformed to common usage to the extent possible.
24.1 Units of weight and measure and their abbreviations
24.1.1 Symbols
ΕC degrees Celsius μL microliter μm micrometer < less than > greater than % percent
24.1.2 Alphabetical abbreviations
cm centimeter g gram h hour ID inside diameter in. inch L liter M Molecular ion m mass or meter mg milligram min minute mL milliliter mm millimeter m/z mass-to-charge ratio N normal; gram molecular weight of solute divided by hydrogen equivalent
of solute, per liter of solution OD outside diameter pg picogram ppb part-per-billion ppm part-per-million ppq part-per-quadrillion ppt part-per-trillion psig pounds-per-square inch gauge v/v volume per unit volume w/v weight per unit volume
61
Method 1698 December 2007
25.0 Definitions and Acronyms
Analyte − A steroid or hormone tested for by this method. The analytes are listed in Table 1.
Calibration standard (CAL) − A solution prepared from a secondary standard and/or stock solution and used to calibrate the response of the HRGC/HRMS instrument.
Calibration verification standard (VER) − The mid-point calibration standard (CS-3) that is used to verify calibration. See Table 4.
CS-0.2, CS-1, CS-2, CS-3, CS-4, CS-5 − See Calibration standards and Table 4.
Field blank − An aliquot of reagent water or other reference matrix that is placed in a sample container in the field, and treated as a sample in all respects, including exposure to sampling site conditions, storage, preservation, and all analytical procedures. The purpose of the field blank is to determine if the field or sample transporting procedures and environments have contaminated the sample.
GC − Gas chromatograph or gas chromatography
HRGC − High resolution GC
HRMS − High resolution MS
Labeled injection internal standard − Labeled pyrene (d10) is spiked into the concentrated extract immediately prior to injection of an aliquot of the extract into the HRGC/HRMS.
Internal standard − A labeled compound used as a reference for quantitation of other labeled compounds and for quantitation of steroids and hormones other than the steroid or hormone of which it is a labeled analog. See internal standard quantitation.
Internal standard quantitation − A means of determining the concentration of (1) a naturally occurring (native) compound by reference to a compound other than its labeled analog and (2) a labeled compound by reference to the labeled injection internal standard.
IPR − Initial precision and recovery; four aliquots of a reference matrix spiked with the analytes of interest and labeled compounds and analyzed to establish the ability of the laboratory to generate acceptable precision and recovery. An IPR is performed prior to the first time this method is used and any time the method or instrumentation is modified.
Isotope dilution quantitation − A means of determining a naturally occurring (native) compound by reference to the same compound in which one or more atoms has been isotopically enriched. In this method, labeled compounds are enriched with deuterium and/or 13C to produce deuterium- and/or 13C-labeled analogs. The labeled compounds are spiked into each sample to allow identification and correction of the concentration of the native compounds in the analytical process.
KD − Kuderna-Danish concentrator; a device used to concentrate the analytes in a solvent
62

Method 1698 December 2007
Laboratory blank − See method blank
Laboratory control sample (LCS) − See Ongoing precision and recovery standard (OPR)
Laboratory reagent blank − See method blank
May − This action, activity, or procedural step is neither required nor prohibited.
May not − This action, activity, or procedural step is prohibited.
Method blank − An aliquot of reagent water that is treated exactly as a sample including exposure to all glassware, equipment, solvents, reagents, internal standards, and surrogates that are used with samples. The method blank is used to determine if analytes or interferences are present in the laboratory environment, the reagents, or the apparatus.
Method detection limit (MDL) − The lowest concentration at which a steroid or hormone can be detected under routine operating conditions (see 40 CFR 136, appendix B). MDLs are listed in Table 2.
Minimum level (ML) – This is the greater of a multiple of the MDL or the lowest calibration point (see 68 FR 11790, March 12, 2003.) MLs are listed in Tables 2.
MS − Mass spectrometer or mass spectrometry
Must − This action, activity, or procedural step is required.
OPR − Ongoing precision and recovery standard (OPR), also known as a laboratory control sample (LCS): a method blank spiked with known quantities of analytes. The OPR is analyzed exactly like a sample. Its purpose is to assure that the results produced by the laboratory remain within the limits specified in this method for precision and recovery.
Perfluorokerosene (PFK) − A mixture of compounds used to calibrate the exact m/z scale in the HRMS.
Preparation blank − See method blank
Quality control check sample (QCS) − A sample containing all or a subset of the analytes at known concentrations. The QCS is obtained from a source external to the laboratory or is prepared from a source of standards different from the source of calibration standards. It is used to check laboratory performance with test materials prepared external to the normal preparation process.
Reagent water − Water demonstrated to be free from the analytes of interest and potentially interfering substances at the method detection limit for the analyte.
Relative standard deviation (RSD) − The standard deviation times 100 divided by the mean. Also termed "coefficient of variation."
RF − Response factor. See Section 10.5
63

Method 1698 December 2007
RR − Relative response. See Section 10.4
RSD − See relative standard deviation
Signal-to-noise ratio (S/N) − The height of the signal as measured from the mean (average) of the noise to the peak maximum divided by the width of the noise.
Should − Although, this action, activity, or procedural step is suggested and not required, you may be asked to explain why you changed or omitted this action, activity, or procedural step.
SICP − Selected ion current profile; the line described by the signal at an exact m/z.
Specificity (also known as selectivity) − the ability of an analytical method to determine the presence and concentration of an analyte in the presence of interferences and other analytes in the method.
Stock solution − A solution containing an analyte that is prepared using a reference material traceable to EPA, the National Institute of Science and Technology (NIST), or a source that will attest to the purity and authenticity of the reference material.
Unique GC resolution or uniquely resolved − Two adjacent chromatographic peaks in which the height of the valley is less than 20 percent of the height of the shorter peak (see Section 6.9.1.1.2).
VER − See calibration verification.
64


![Endocrine System Chp 13. Hormones: Produced by endocrine glands [e.g. pituitary] Circulate in the blood stream 1.Steroids - lipid soluble 2.Nonsteroids.](https://static.fdocuments.us/doc/165x107/56649d6d5503460f94a4d127/endocrine-system-chp-13-hormones-produced-by-endocrine-glands-eg-pituitary.jpg)


