
Methanogen Community Structure and Function
61
Linking Ecosystem Function to Methanogen Community Structure in Peatland Soils Steve McAllister, Brendan Bohannan, Rongzhong Ye, Qusheng Jin, and Scott Bridgham University of Oregon
Transcript of Methanogen Community Structure and Function
Linking Ecosystem Function to Methanogen Community Structure in
Peatland Soils
Steve McAllister, Brendan Bohannan, Rongzhong Ye, Qusheng Jin, and Scott Bridgham
University of Oregon
Microbial ecology: a core question
Microbial ecology: a core question
• Does microbial community structure explain ecosystem function beyond the effect of environmental factors?
Microbial ecology: a core question
• Does microbial community structure explain ecosystem function beyond the effect of environmental factors?
• Does spatial and temporal variation in microbial diversity and activity contribute to the control of key biogeochemical processes?
Methanogens: a small community, an essential function
Methanogens: a small community, an essential function
• A microbial group with a distinct, unique function and (relatively) low diversity
Methanogens: a small community, an essential function
• A microbial group with a distinct, unique function and (relatively) low diversity
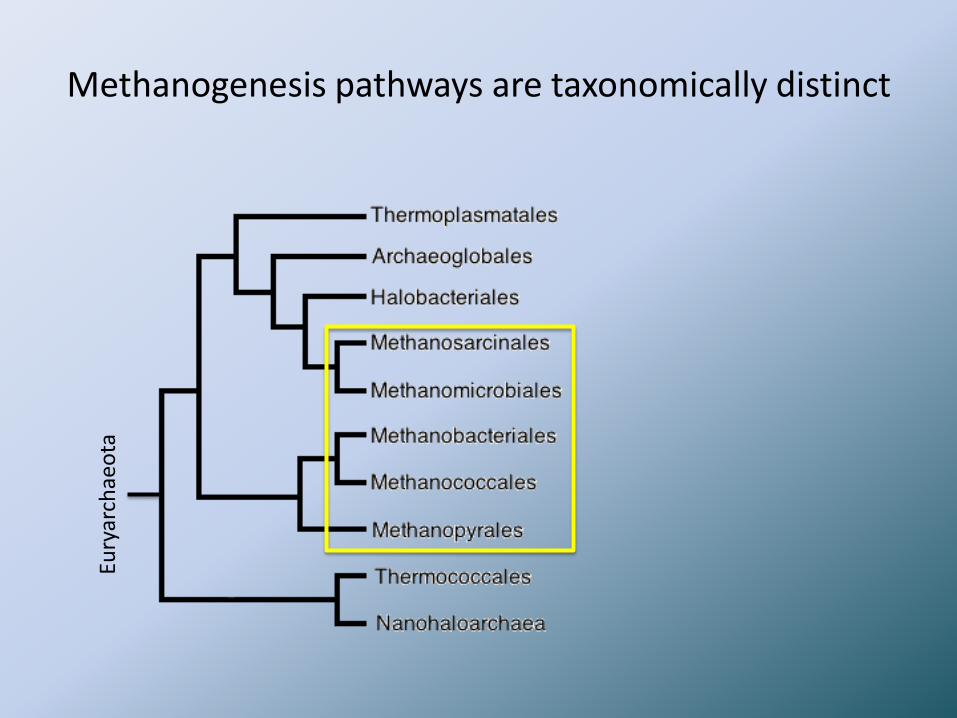
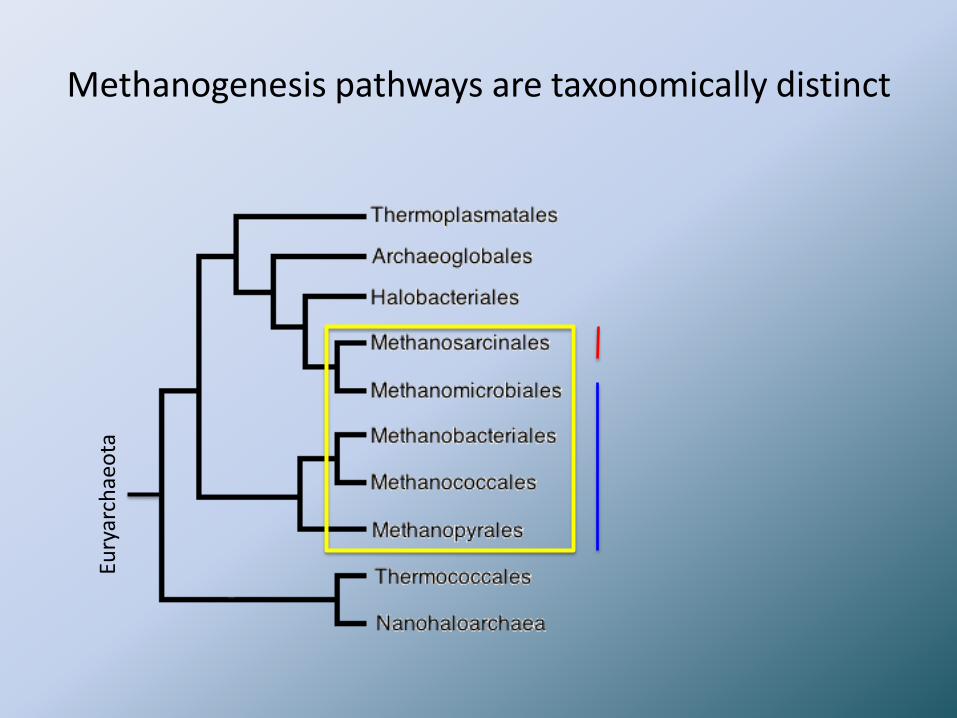
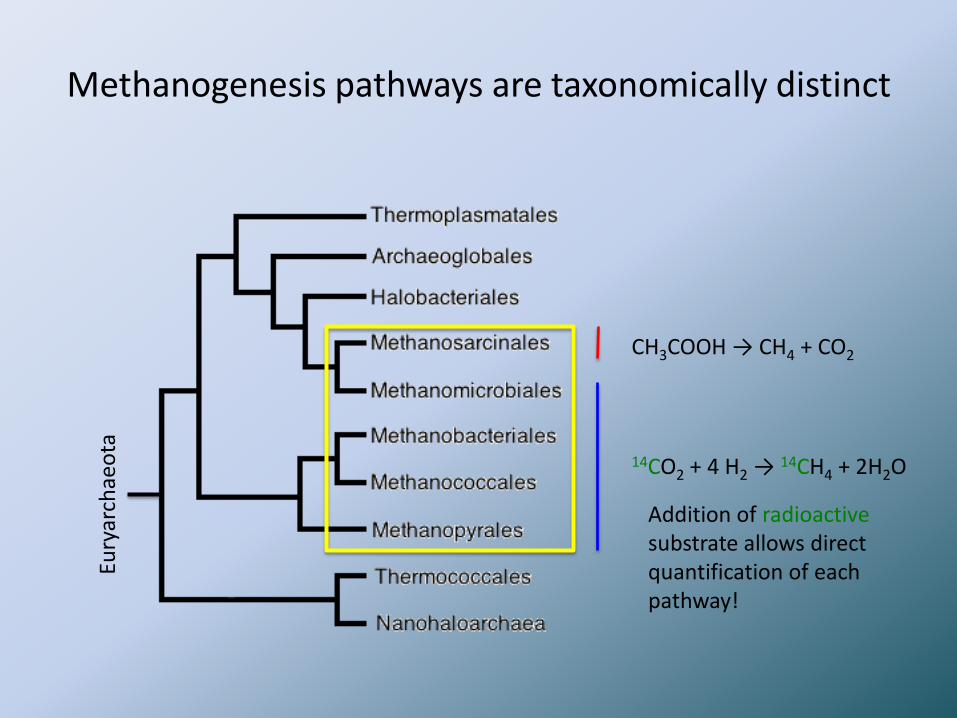
• Two distinct biochemical pathways that are phylogenetically distributed within the methanogens, and can be quantified independently via radioisotope labeling
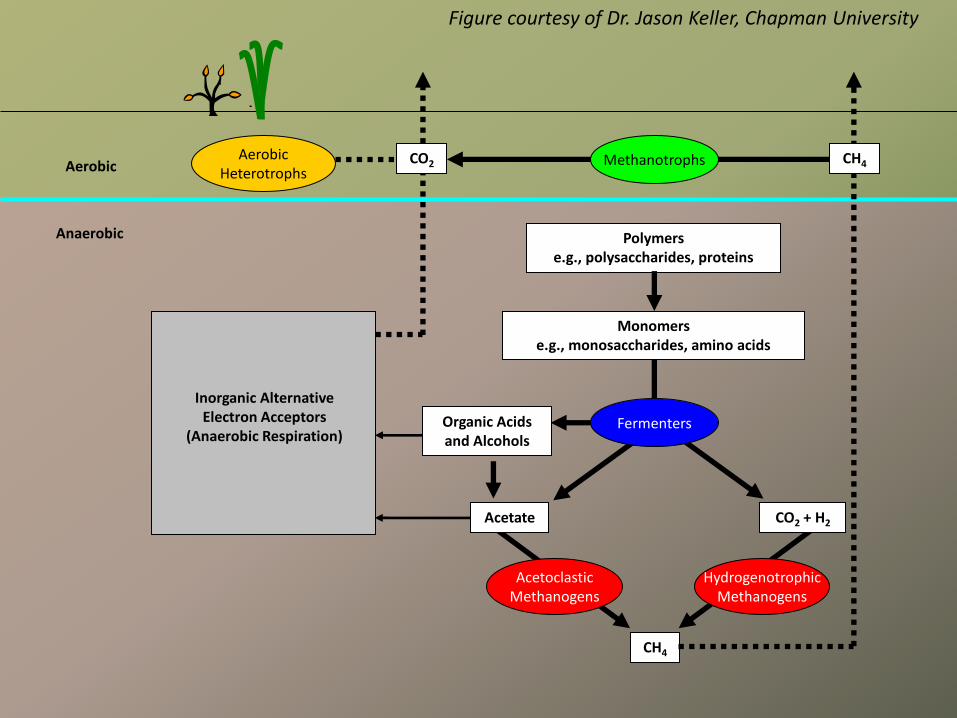
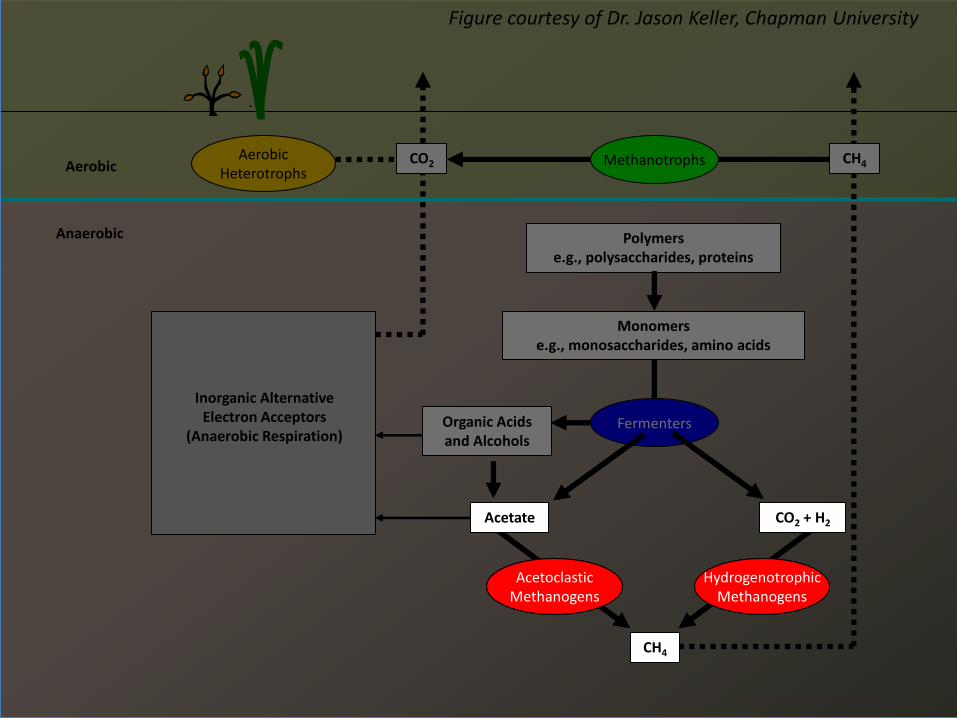
Polymers e.g., polysaccharides, proteins
Monomers e.g., monosaccharides, amino acids
Organic Acids and Alcohols
Acetate CO2 + H2
CH4
Fermenters
Acetoclastic Methanogens
Hydrogenotrophic Methanogens
CH4 CO2 Methanotrophs Aerobic
Anaerobic
Aerobic Heterotrophs
Figure courtesy of Dr. Jason Keller, Chapman University
Inorganic Alternative Electron Acceptors
(Anaerobic Respiration)
Acetate CO2 + H2
CH4
Acetoclastic Methanogens
Hydrogenotrophic Methanogens
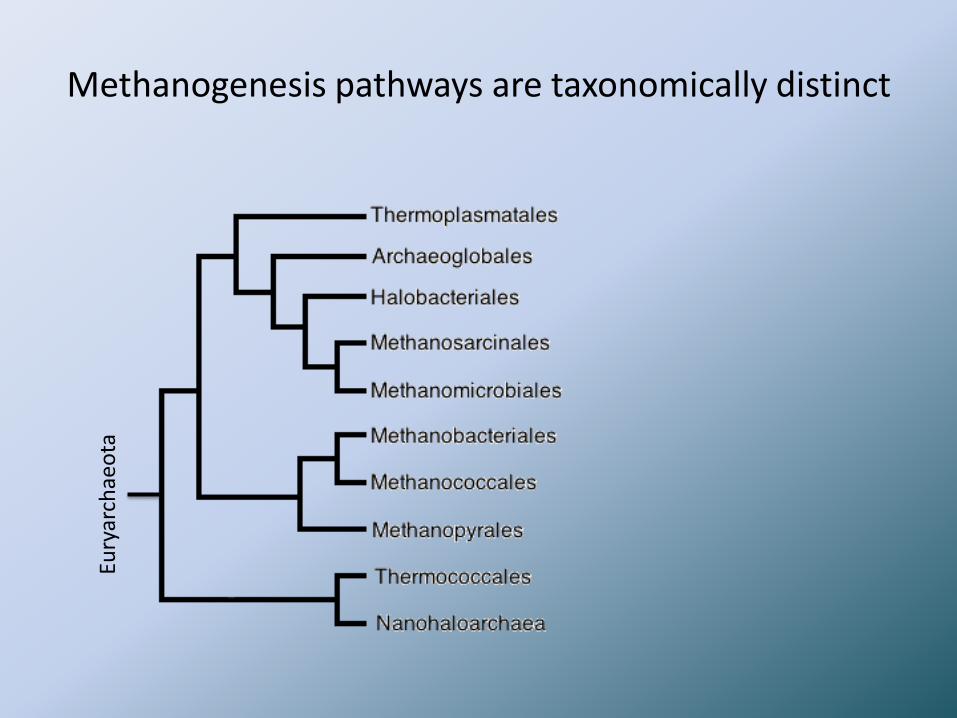
Methanogenesis pathways are taxonomically distinct Eu
ryar
chae
ota
Methanogenesis pathways are taxonomically distinct Eu
ryar
chae
ota
Methanogenesis pathways are taxonomically distinct Eu
ryar
chae
ota
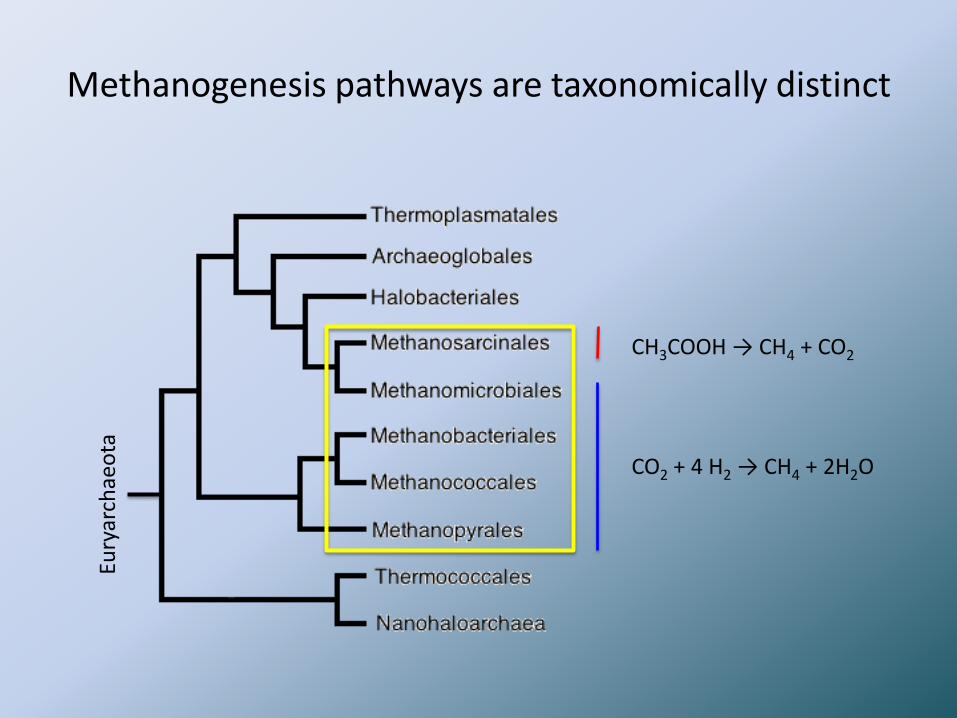
Methanogenesis pathways are taxonomically distinct
CO2 + 4 H2 → CH4 + 2H2O
CH3COOH → CH4 + CO2
Eury
arch
aeo
ta
Methanogenesis pathways are taxonomically distinct
14CO2 + 4 H2 → 14CH4 + 2H2O
CH3COOH → CH4 + CO2
Eury
arch
aeo
ta
Addition of radioactive substrate allows direct quantification of each pathway!
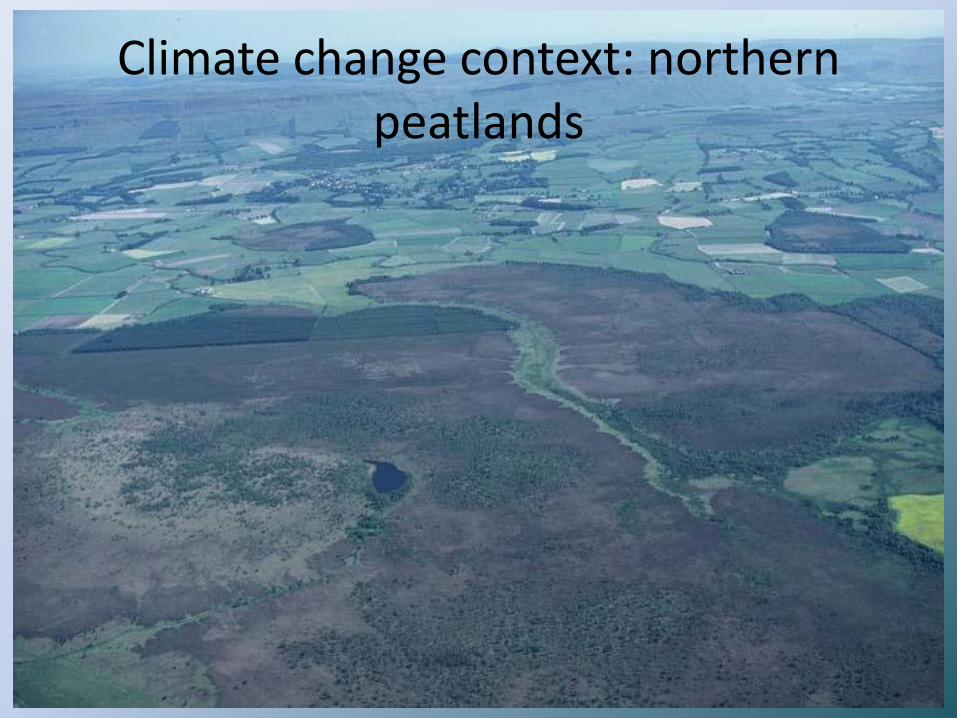
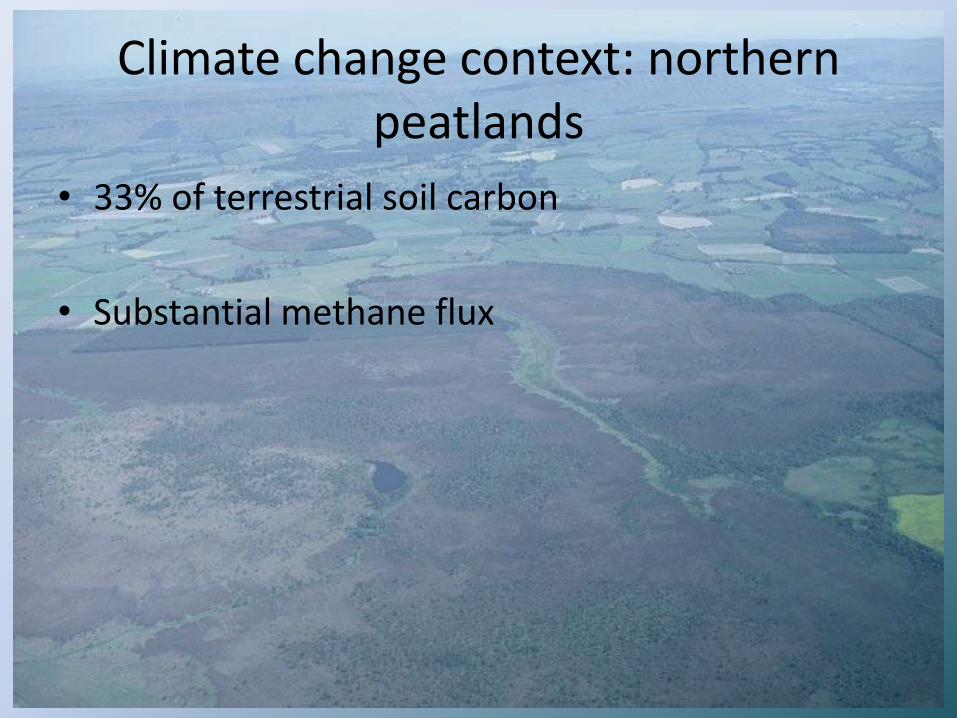
Climate change context: northern peatlands
Climate change context: northern peatlands
• 33% of terrestrial soil carbon
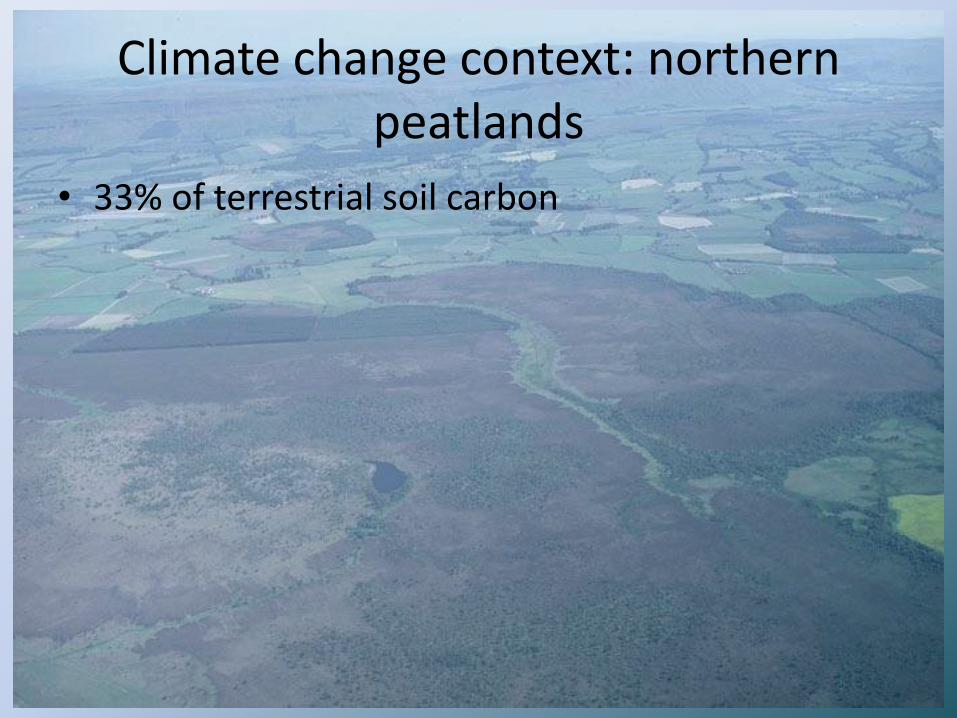
Climate change context: northern peatlands
• 33% of terrestrial soil carbon
• Substantial methane flux
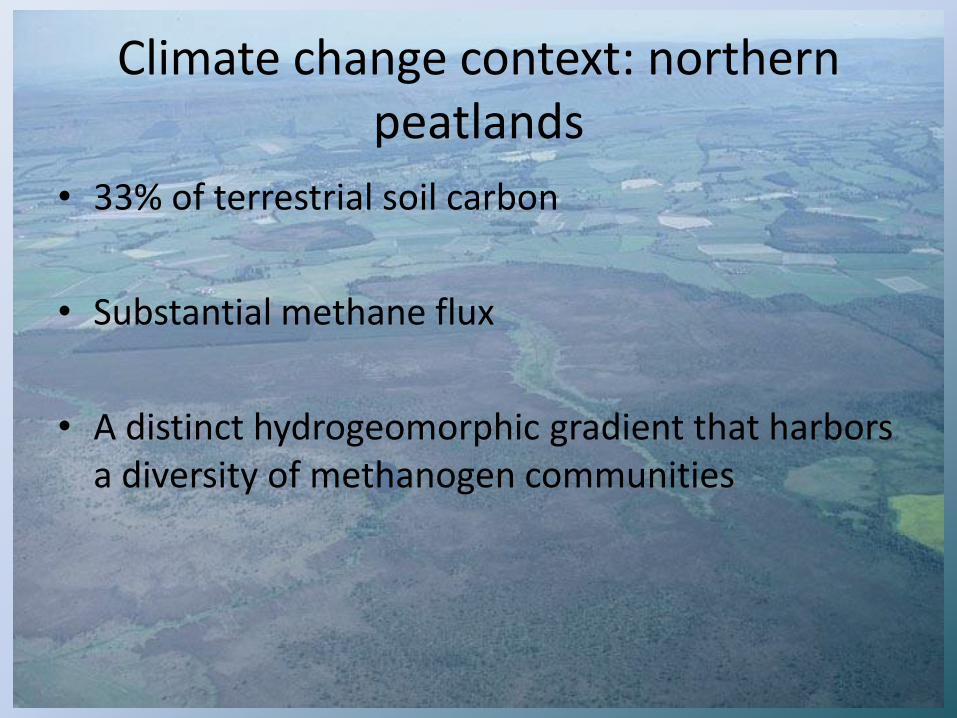
Climate change context: northern peatlands
• 33% of terrestrial soil carbon
• Substantial methane flux
• A distinct hydrogeomorphic gradient that harbors a diversity of methanogen communities
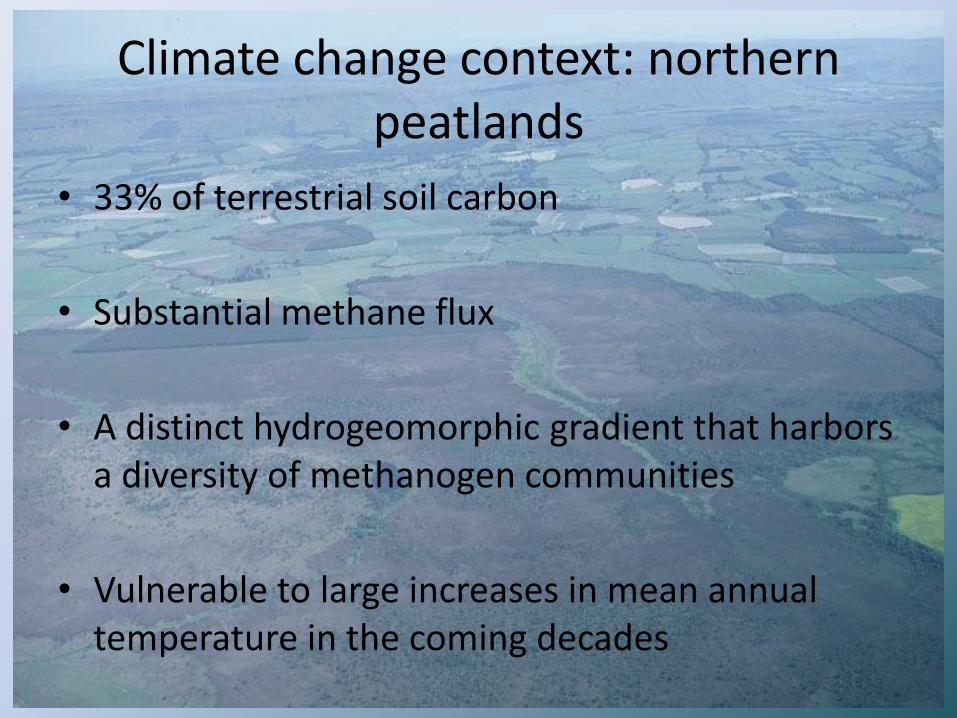
Climate change context: northern peatlands
• 33% of terrestrial soil carbon
• Substantial methane flux
• A distinct hydrogeomorphic gradient that harbors a diversity of methanogen communities
• Vulnerable to large increases in mean annual temperature in the coming decades
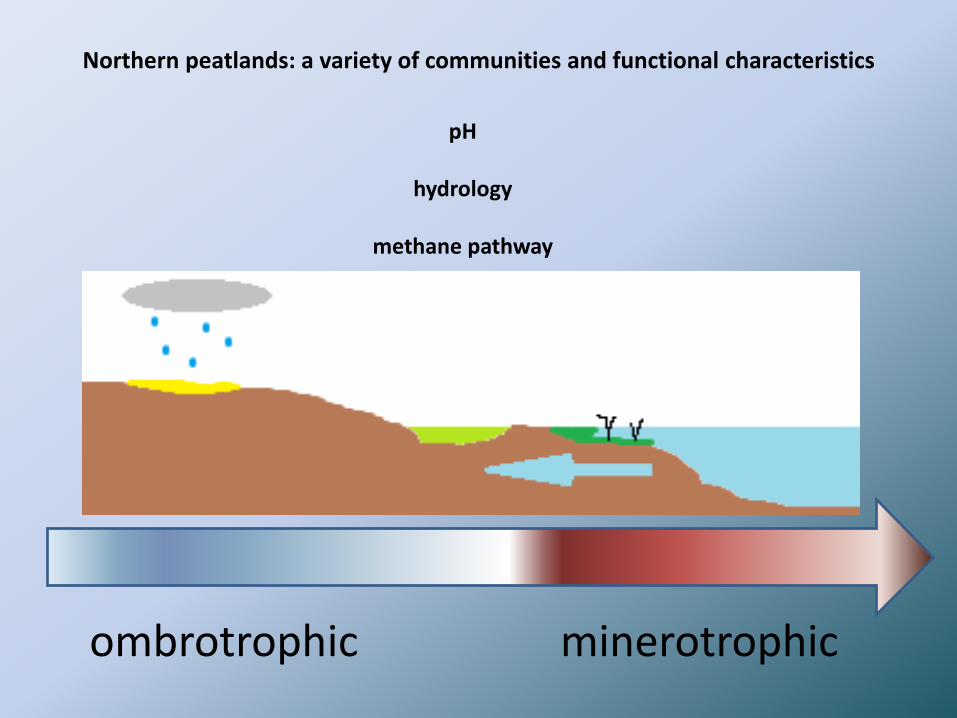
ombrotrophic minerotrophic
pH
hydrology
methane pathway
Northern peatlands: a variety of communities and functional characteristics

ombrotrophic minerotrophic
low
neutral
pH
hydrology
methane pathway
Northern peatlands: a variety of communities and functional characteristics

ombrotrophic minerotrophic
low precipitation
neutral
groundwater
pH
hydrology
methane pathway
Northern peatlands: a variety of communities and functional characteristics
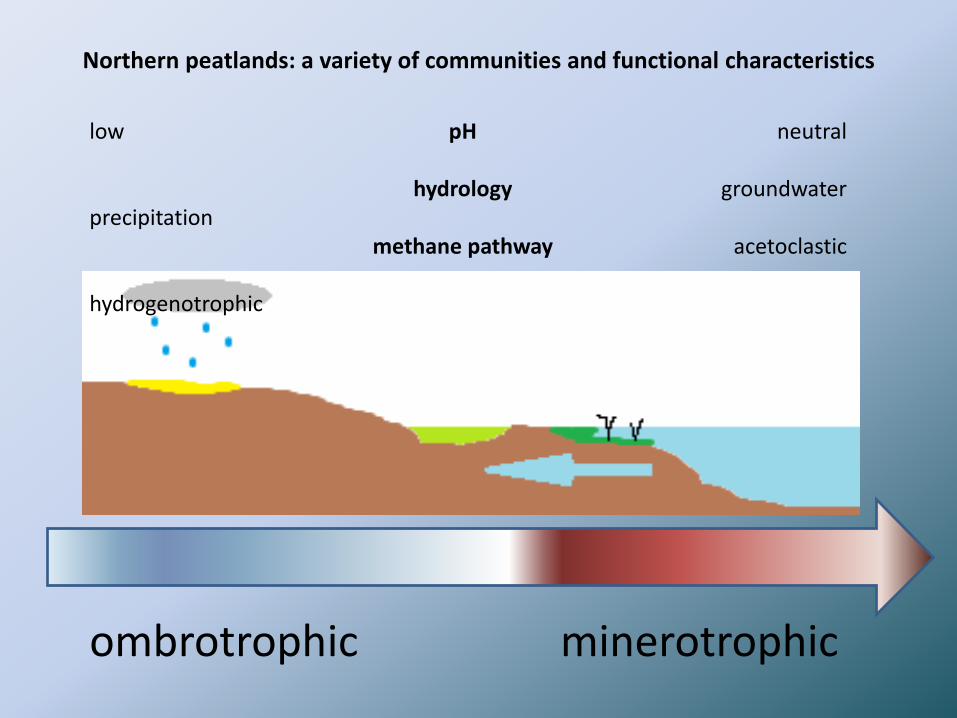
ombrotrophic minerotrophic
low precipitation hydrogenotrophic
neutral
groundwater
acetoclastic
pH
hydrology
methane pathway
Northern peatlands: a variety of communities and functional characteristics
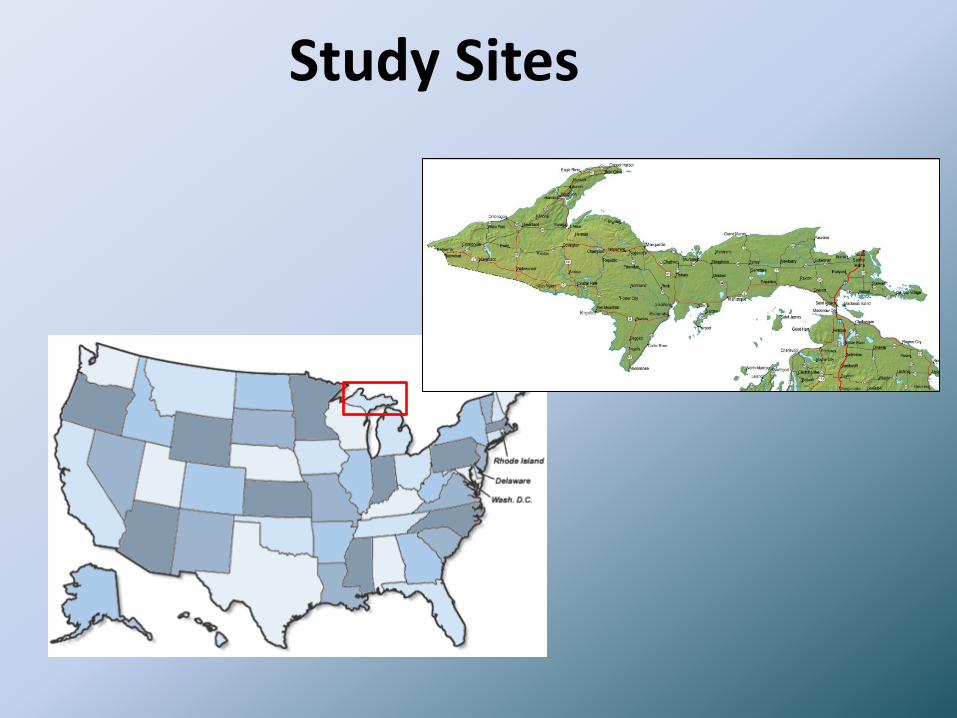
Study Sites
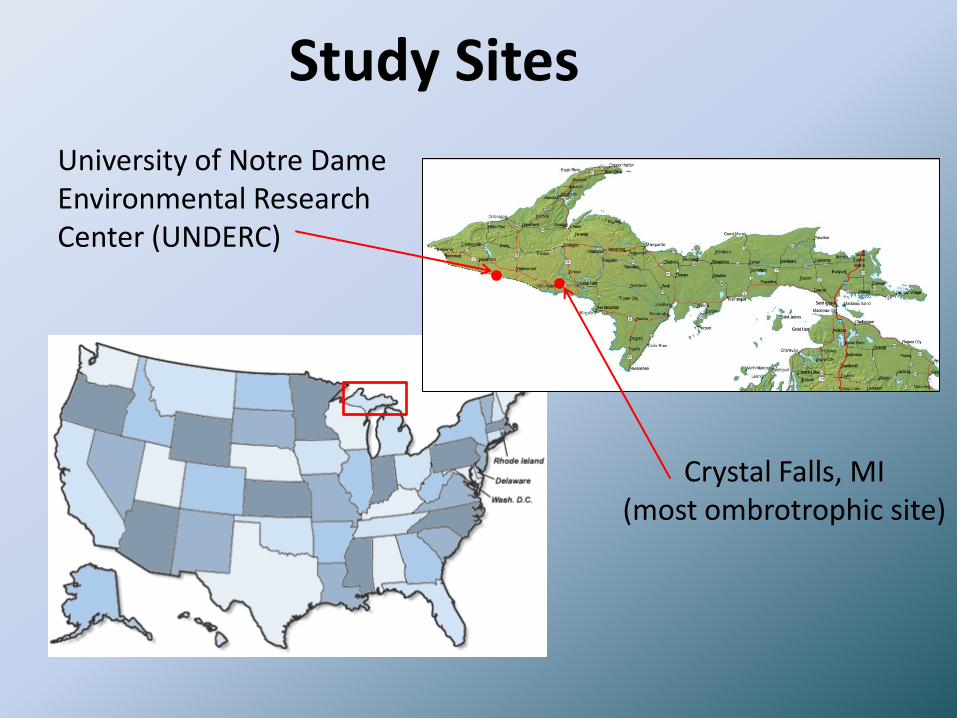
University of Notre Dame Environmental Research Center (UNDERC)
Crystal Falls, MI (most ombrotrophic site)
Study Sites
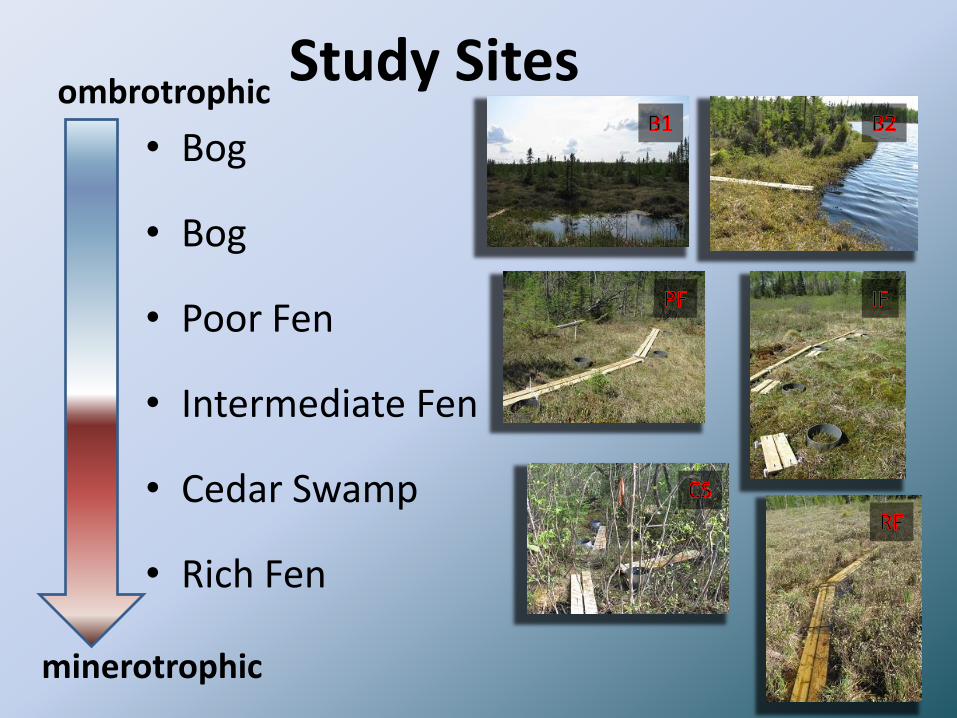
• Bog
• Bog
• Poor Fen
• Intermediate Fen
• Cedar Swamp
• Rich Fen
ombrotrophic
minerotrophic
Study Sites
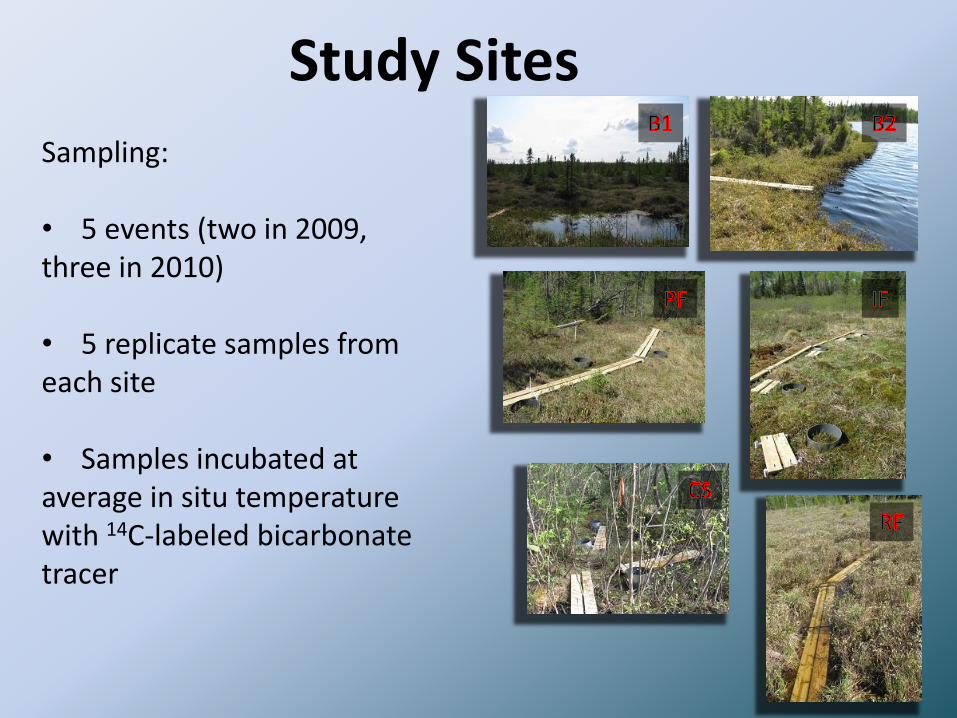
Study Sites
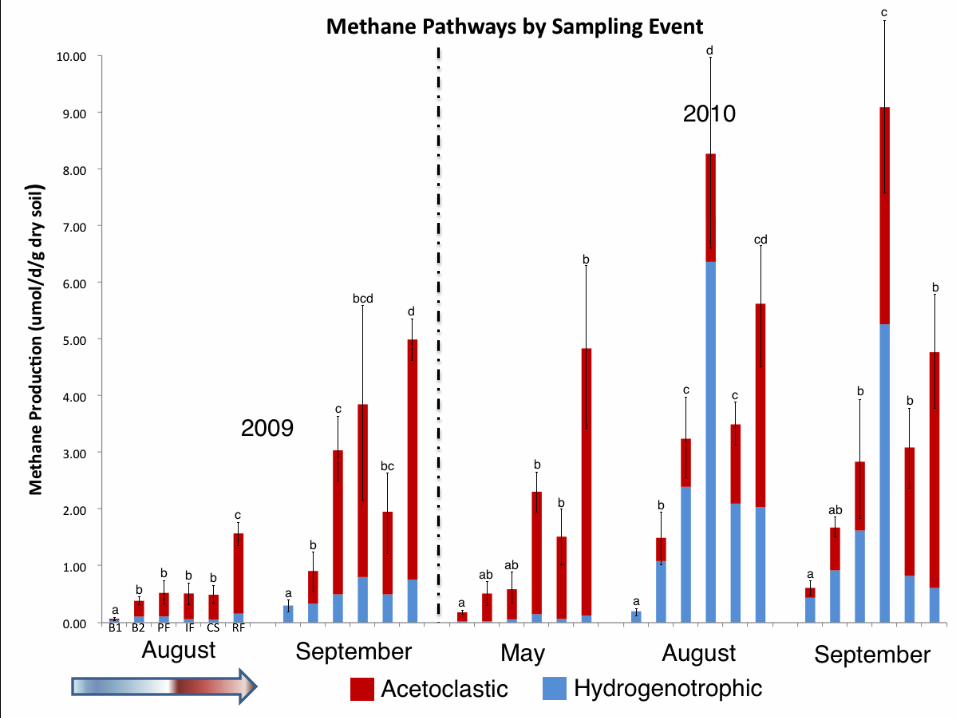
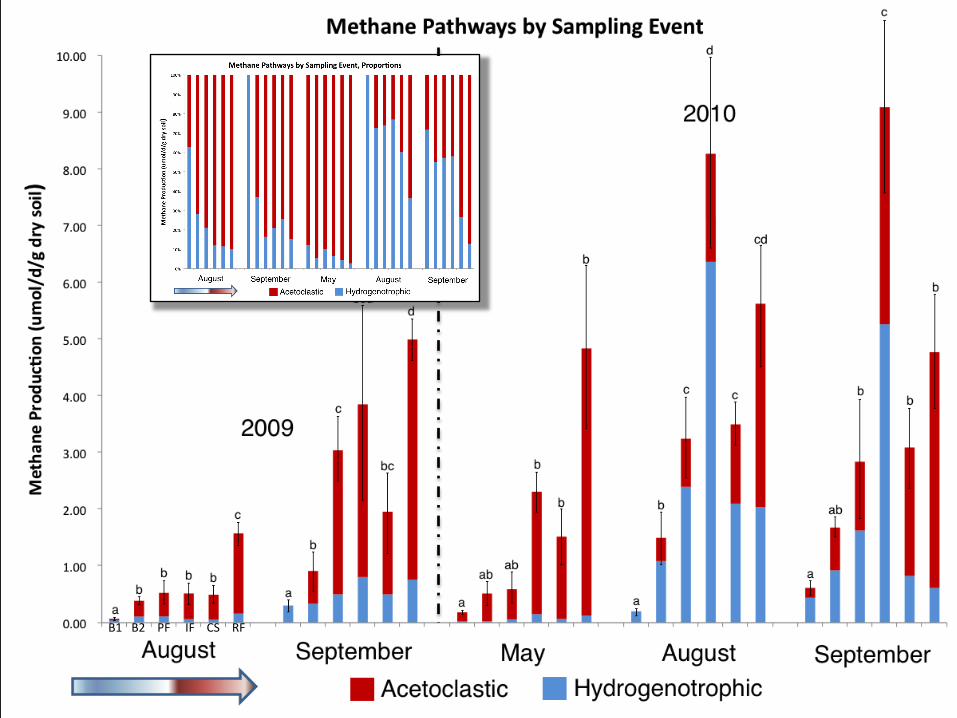
Sampling: • 5 events (two in 2009, three in 2010) • 5 replicate samples from each site • Samples incubated at average in situ temperature with 14C-labeled bicarbonate tracer
B1 B2 PF IF CS RF
B1 B2 PF IF CS RF
0.00
1.00
2.00
3.00
4.00
5.00
6.00
7.00
Me
than
e P
rod
uct
ion
(u
mo
l/d
/g d
ry s
oil)
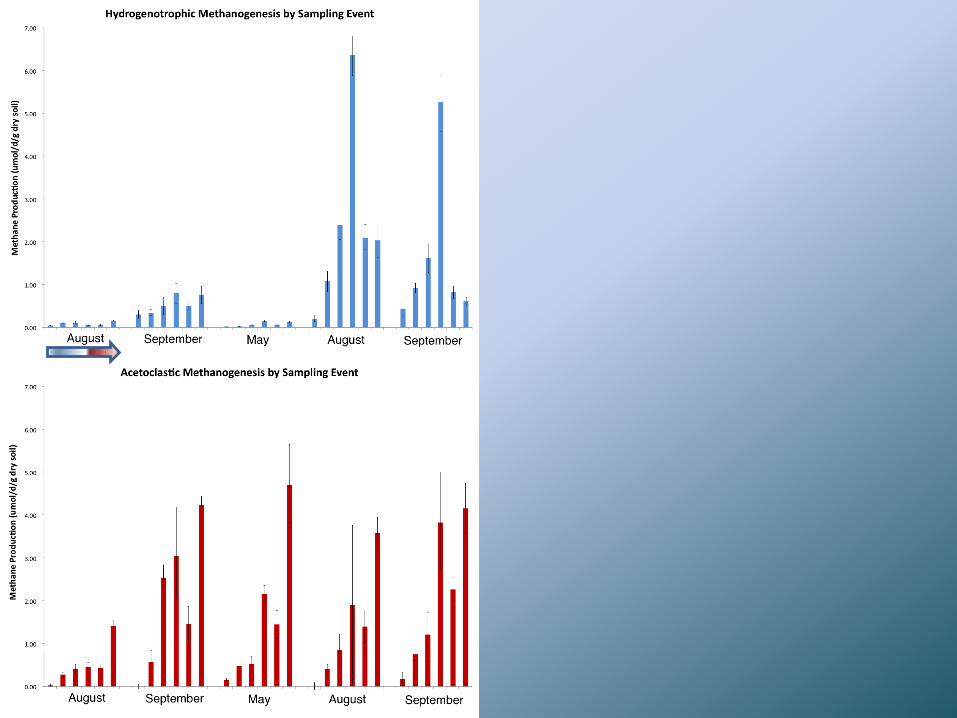
Hydrogenotrophic Methanogenesis by Sampling Event
0.00
1.00
2.00
3.00
4.00
5.00
Me
than
e P
rod
uct
ion
(u
mo
l/d
/g d
ry s
oil)
Acetoclastic Methanogenesis by Sampling Event
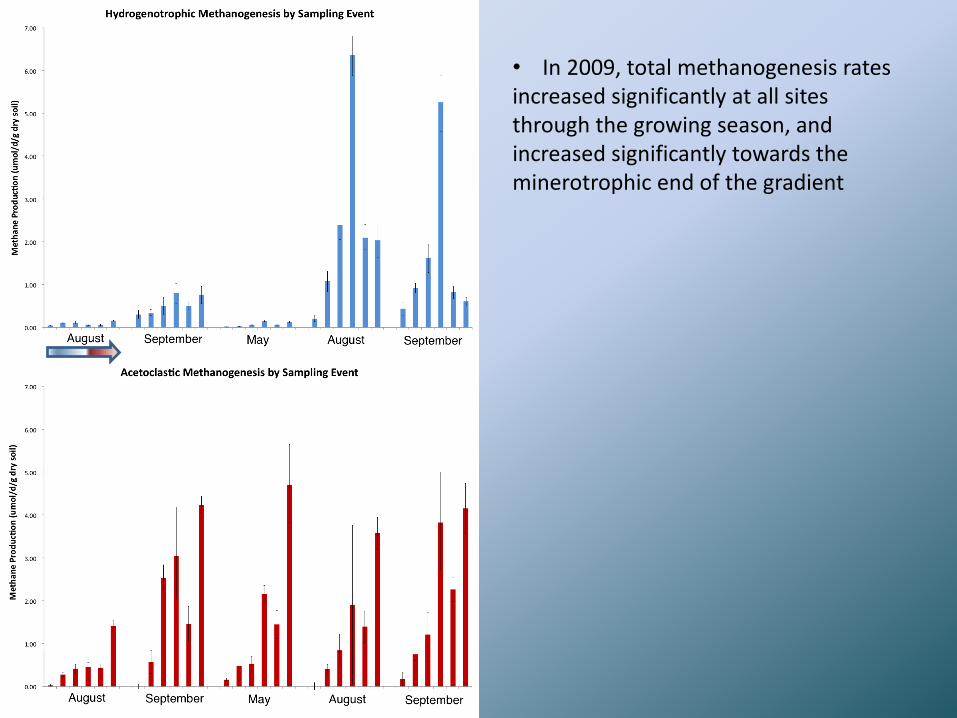
• In 2009, total methanogenesis rates increased significantly at all sites through the growing season, and increased significantly towards the minerotrophic end of the gradient
0.00
1.00
2.00
3.00
4.00
5.00
6.00
7.00
Me
than
e P
rod
uct
ion
(u
mo
l/d
/g d
ry s
oil)
Hydrogenotrophic Methanogenesis by Sampling Event
0.00
1.00
2.00
3.00
4.00
5.00
Me
than
e P
rod
uct
ion
(u
mo
l/d
/g d
ry s
oil)
Acetoclastic Methanogenesis by Sampling Event
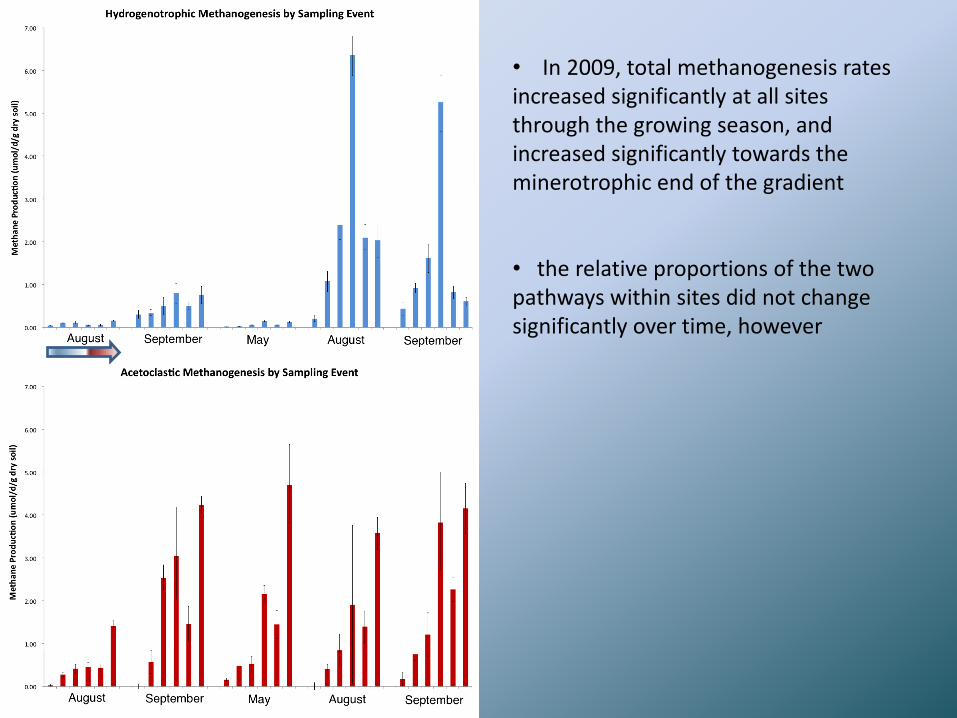
• In 2009, total methanogenesis rates increased significantly at all sites through the growing season, and increased significantly towards the minerotrophic end of the gradient • the relative proportions of the two pathways within sites did not change significantly over time, however
0.00
1.00
2.00
3.00
4.00
5.00
6.00
7.00
Me
than
e P
rod
uct
ion
(u
mo
l/d
/g d
ry s
oil)
Hydrogenotrophic Methanogenesis by Sampling Event
0.00
1.00
2.00
3.00
4.00
5.00
Me
than
e P
rod
uct
ion
(u
mo
l/d
/g d
ry s
oil)
Acetoclastic Methanogenesis by Sampling Event
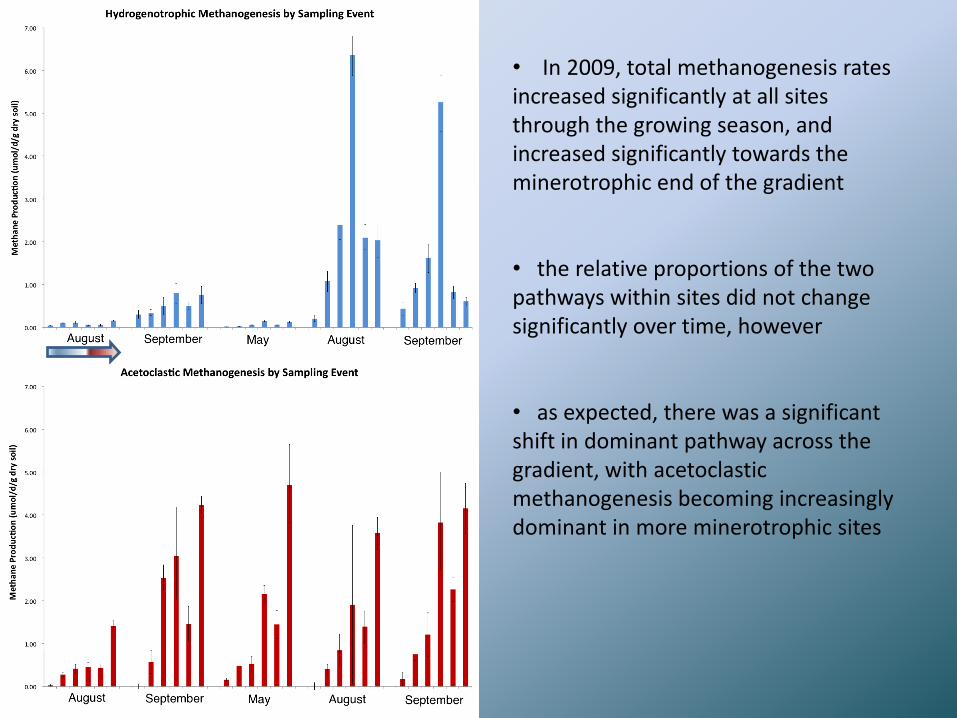
• In 2009, total methanogenesis rates increased significantly at all sites through the growing season, and increased significantly towards the minerotrophic end of the gradient • the relative proportions of the two pathways within sites did not change significantly over time, however • as expected, there was a significant shift in dominant pathway across the gradient, with acetoclastic methanogenesis becoming increasingly dominant in more minerotrophic sites
0.00
1.00
2.00
3.00
4.00
5.00
6.00
7.00
Me
than
e P
rod
uct
ion
(u
mo
l/d
/g d
ry s
oil)
Hydrogenotrophic Methanogenesis by Sampling Event
0.00
1.00
2.00
3.00
4.00
5.00
Me
than
e P
rod
uct
ion
(u
mo
l/d
/g d
ry s
oil)
Acetoclastic Methanogenesis by Sampling Event
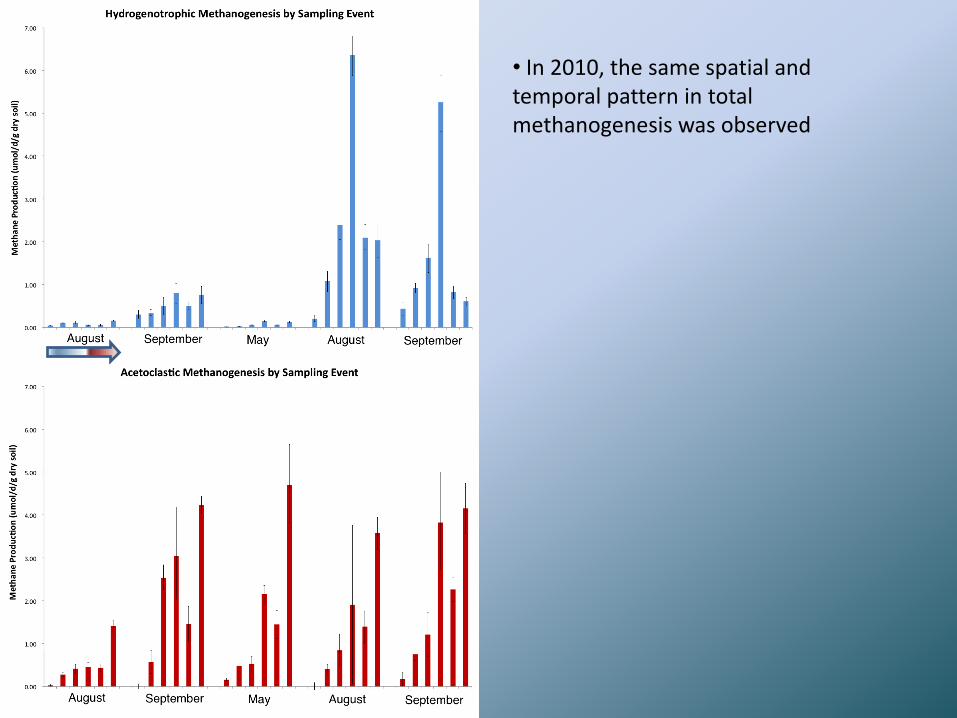
• In 2010, the same spatial and temporal pattern in total methanogenesis was observed
0.00
1.00
2.00
3.00
4.00
5.00
6.00
7.00
Me
than
e P
rod
uct
ion
(u
mo
l/d
/g d
ry s
oil)
Hydrogenotrophic Methanogenesis by Sampling Event
0.00
1.00
2.00
3.00
4.00
5.00
Me
than
e P
rod
uct
ion
(u
mo
l/d
/g d
ry s
oil)
Acetoclastic Methanogenesis by Sampling Event
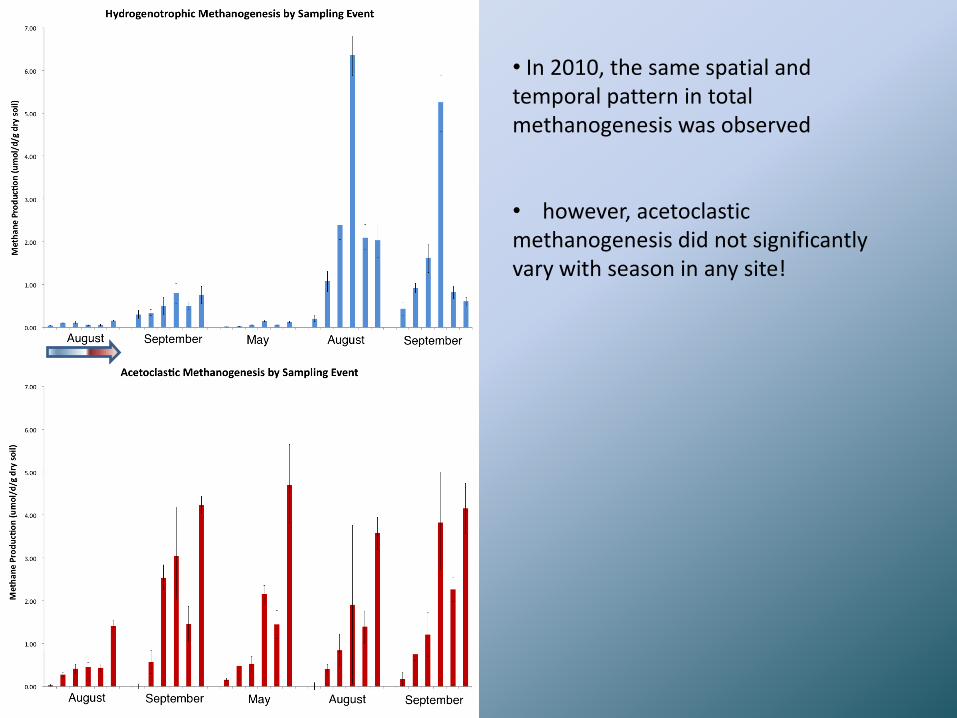
• In 2010, the same spatial and temporal pattern in total methanogenesis was observed • however, acetoclastic methanogenesis did not significantly vary with season in any site!
0.00
1.00
2.00
3.00
4.00
5.00
6.00
7.00
Me
than
e P
rod
uct
ion
(u
mo
l/d
/g d
ry s
oil)
Hydrogenotrophic Methanogenesis by Sampling Event
0.00
1.00
2.00
3.00
4.00
5.00
Me
than
e P
rod
uct
ion
(u
mo
l/d
/g d
ry s
oil)
Acetoclastic Methanogenesis by Sampling Event
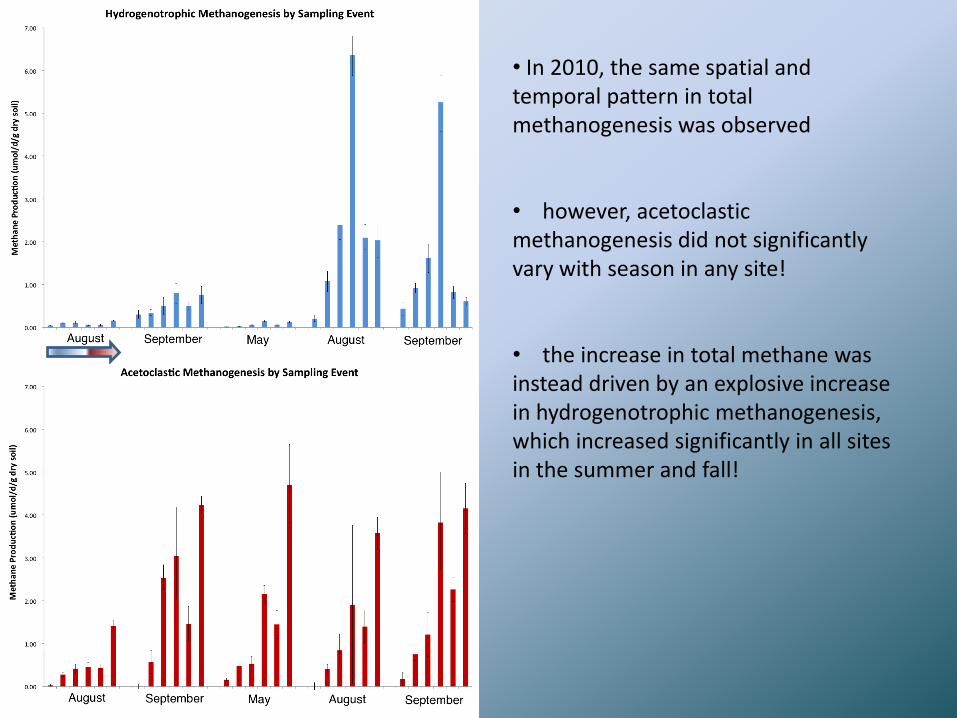
• In 2010, the same spatial and temporal pattern in total methanogenesis was observed • however, acetoclastic methanogenesis did not significantly vary with season in any site! • the increase in total methane was instead driven by an explosive increase in hydrogenotrophic methanogenesis, which increased significantly in all sites in the summer and fall!
0.00
1.00
2.00
3.00
4.00
5.00
6.00
7.00
Me
than
e P
rod
uct
ion
(u
mo
l/d
/g d
ry s
oil)
Hydrogenotrophic Methanogenesis by Sampling Event
0.00
1.00
2.00
3.00
4.00
5.00
Me
than
e P
rod
uct
ion
(u
mo
l/d
/g d
ry s
oil)
Acetoclastic Methanogenesis by Sampling Event
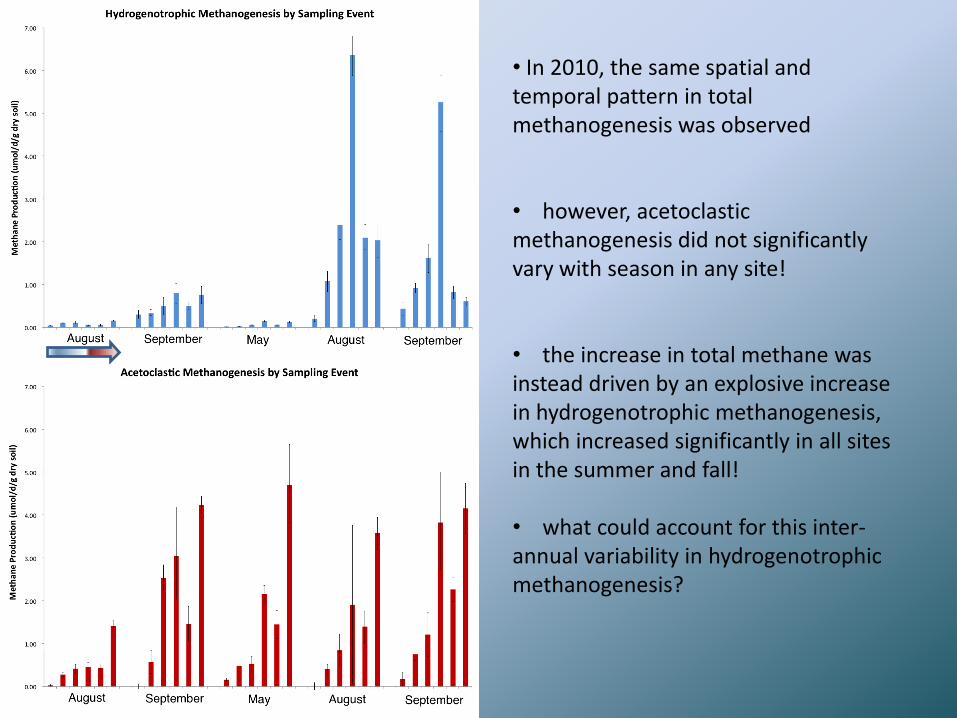
• In 2010, the same spatial and temporal pattern in total methanogenesis was observed • however, acetoclastic methanogenesis did not significantly vary with season in any site! • the increase in total methane was instead driven by an explosive increase in hydrogenotrophic methanogenesis, which increased significantly in all sites in the summer and fall! • what could account for this inter-annual variability in hydrogenotrophic methanogenesis?
0.00
1.00
2.00
3.00
4.00
5.00
6.00
7.00
Me
than
e P
rod
uct
ion
(u
mo
l/d
/g d
ry s
oil)
Hydrogenotrophic Methanogenesis by Sampling Event
0.00
1.00
2.00
3.00
4.00
5.00
Me
than
e P
rod
uct
ion
(u
mo
l/d
/g d
ry s
oil)
Acetoclastic Methanogenesis by Sampling Event
0
1
2
3
4
5
6
7
8
9
10
-60 -40 -20 0 20 40 60
Me
than
e P
rod
uct
ion
(u
mo
l/d
/g d
ry s
oil)
Water Table (cm)
Acetoclastic Methane Production vs Water Table Depth B1
B2
PF
IF
CS
RF
0
1
2
3
4
5
6
7
8
9
-60 -40 -20 0 20 40 60
Me
than
e P
rod
uct
ion
(u
mo
l/d
/g d
ry s
oil)
Water Table (cm)
Hydrogenotrophic Methane Production vs Water Table Depth
B1
B2
PF
IF
CS
RF
0
1
2
3
4
5
6
7
8
9
10
-60 -40 -20 0 20 40 60
Me
than
e P
rod
uct
ion
(u
mo
l/d
/g d
ry s
oil)
Water Table (cm)
Acetoclastic Methane Production vs Water Table Depth B1
B2
PF
IF
CS
RF
0
1
2
3
4
5
6
7
8
9
-60 -40 -20 0 20 40 60
Me
than
e P
rod
uct
ion
(u
mo
l/d
/g d
ry s
oil)
Water Table (cm)
Hydrogenotrophic Methane Production vs Water Table Depth
B1
B2
PF
IF
CS
RF
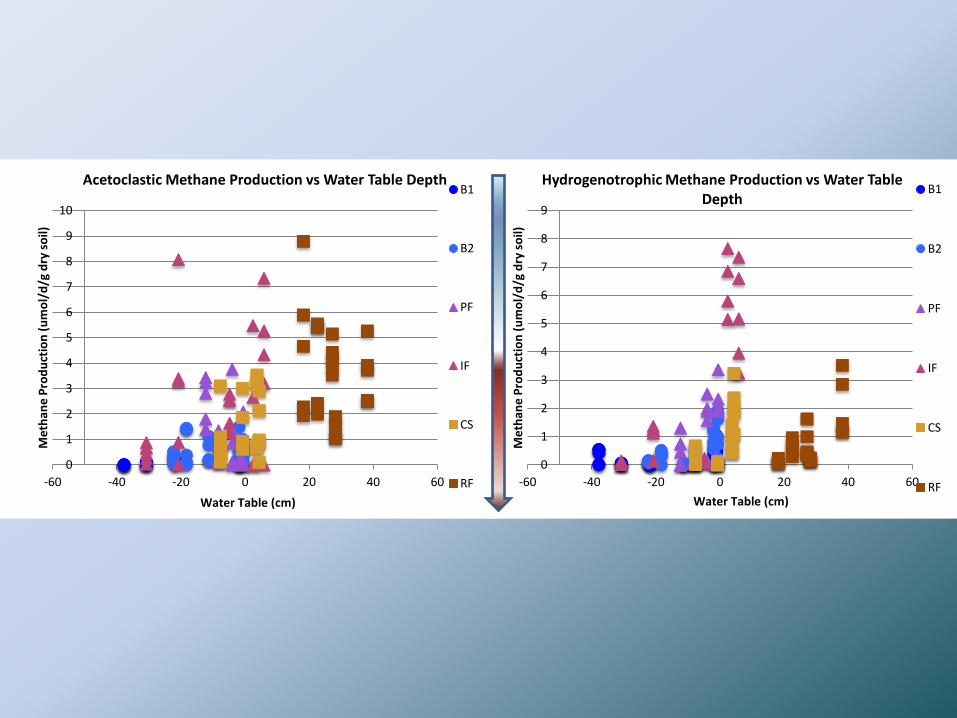
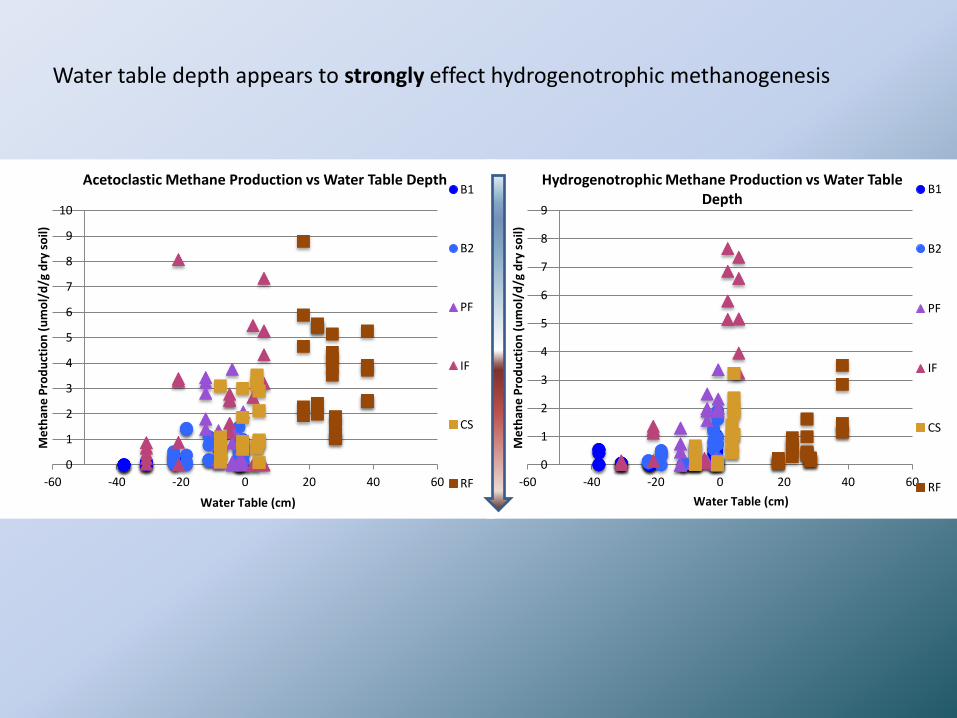
Water table depth appears to strongly effect hydrogenotrophic methanogenesis
Pathways Summary
• Acetoclastic methanogenesis varied primarily with gradient position, and did not vary significantly between years or (generally) throughout the growing season
Pathways Summary
• Acetoclastic methanogenesis varied primarily with gradient position, and did not vary significantly between years or (generally) throughout the growing season
• Hydrogenotrophic methanogenesis, on the other hand, varied tremendously between 2009 and 2010, becoming dominant in nearly every site in the latter year, which was unusually wet
• Could the substantially different spatial and temporal dynamics of the two pathways be explained by the phylogenetically distinct methanogens carrying them out?
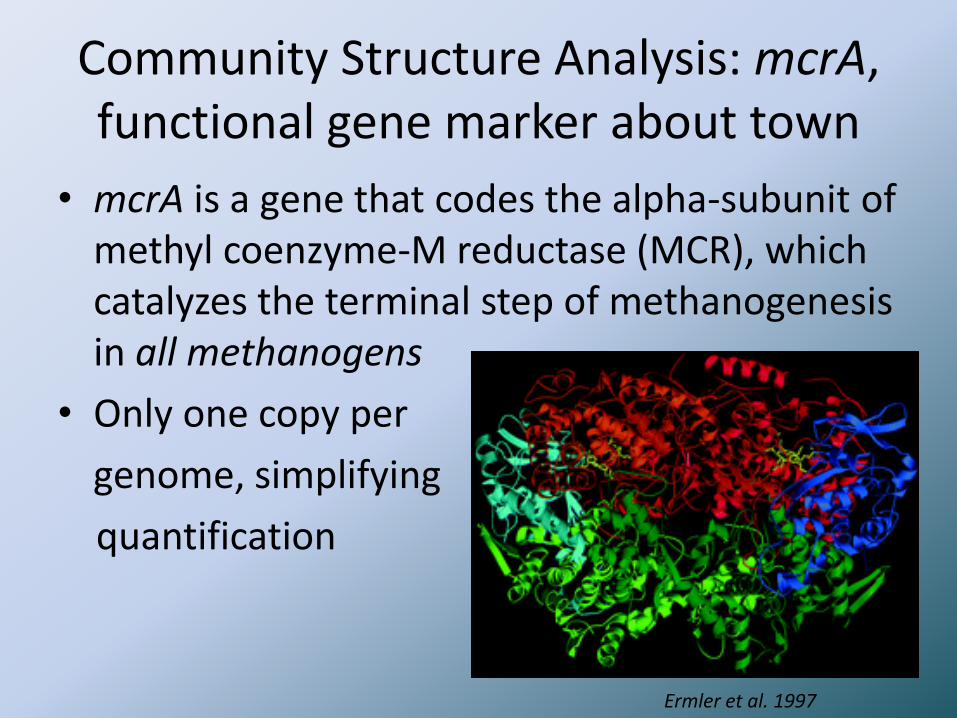
Community Structure Analysis: mcrA, functional gene marker about town
• mcrA is a gene that codes the alpha-subunit of methyl coenzyme-M reductase (MCR), which catalyzes the terminal step of methanogenesis in all methanogens
• Only one copy per
genome, simplifying
quantification
Ermler et al. 1997

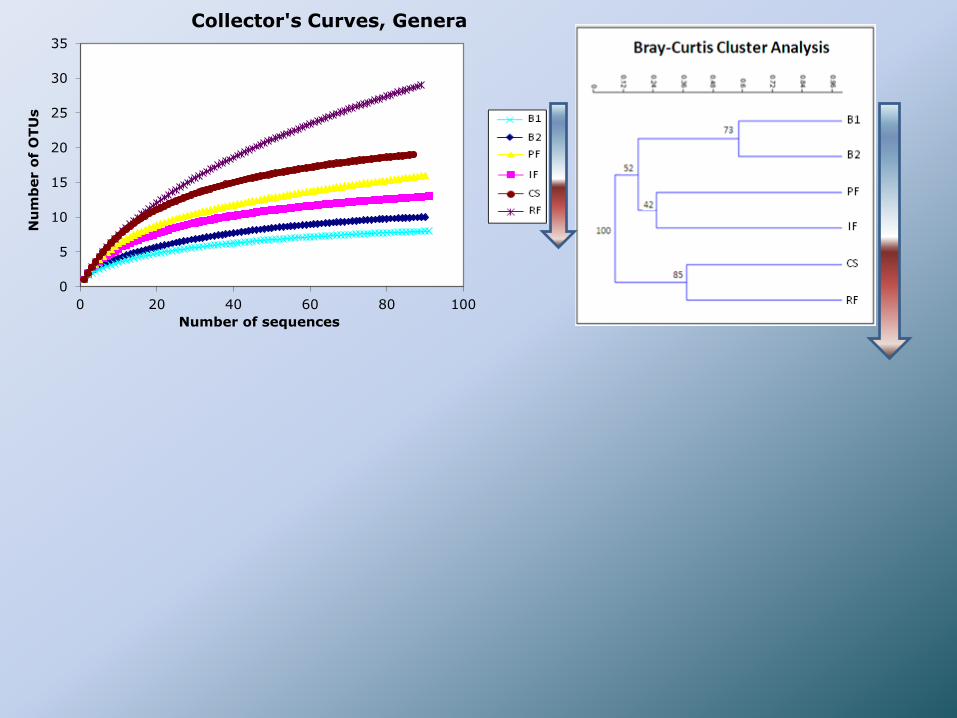
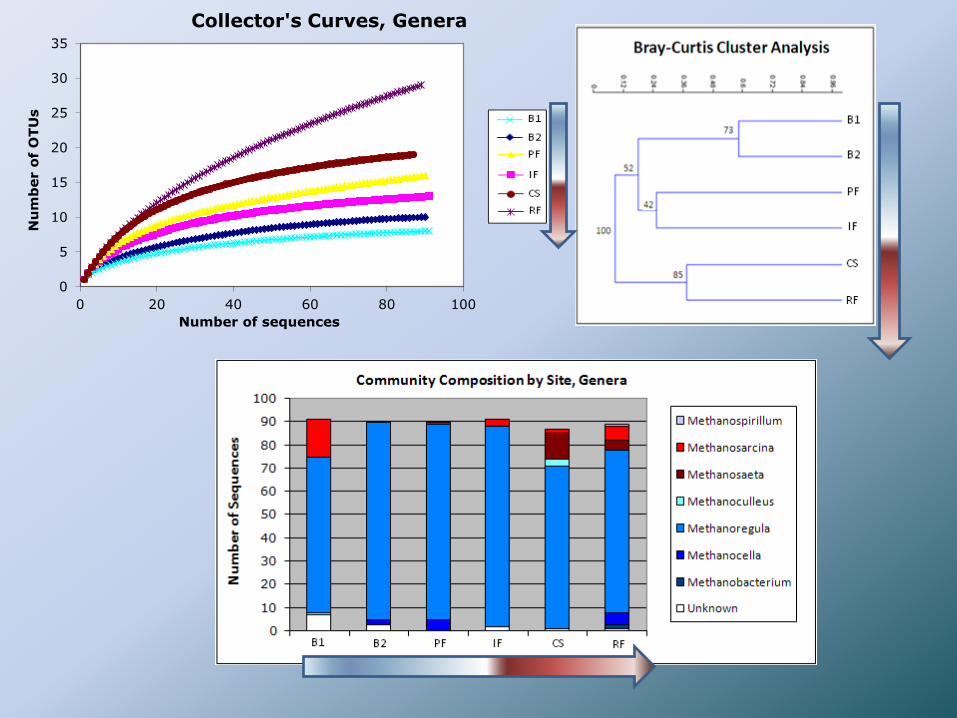
Preliminary Community Data
• DNA was extracted from one core from each site taken in May 2010 • mcrA was amplified from each core using PCR, and the PCR amplicons were cloned and sequenced via Sanger sequencing • the resulting sequence libraries were trimmed, aligned, and binned into operational taxonomic units (putative genera) using the MOTHUR microbial genomics software package
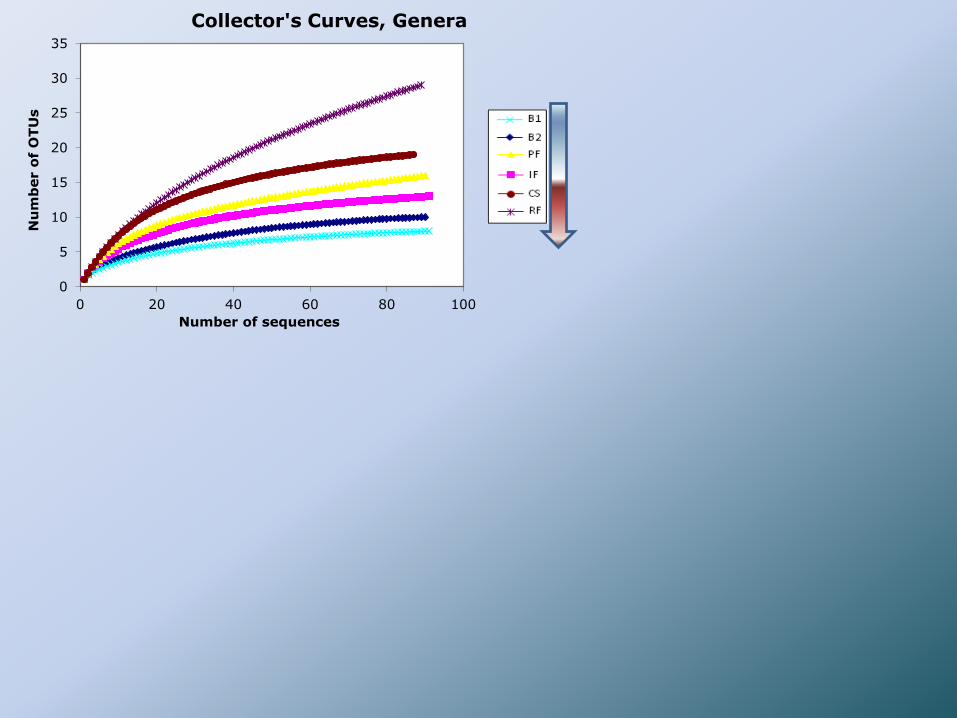
0
5
10
15
20
25
30
35
0 20 40 60 80 100
Nu
mb
er o
f O
TU
s
Number of sequences
Collector's Curves, Genera
0
5
10
15
20
25
30
35
0 20 40 60 80 100
Nu
mb
er o
f O
TU
s
Number of sequences
Collector's Curves, Genera
0
5
10
15
20
25
30
35
0 20 40 60 80 100
Nu
mb
er o
f O
TU
s
Number of sequences
Collector's Curves, Genera
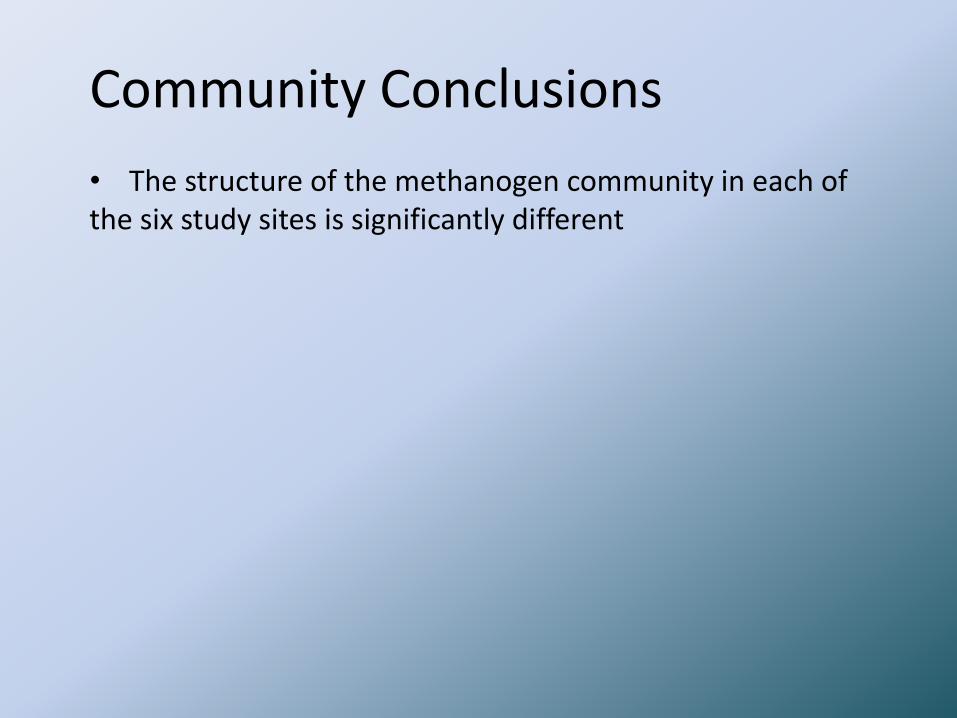
Community Conclusions • The structure of the methanogen community in each of the six study sites is significantly different
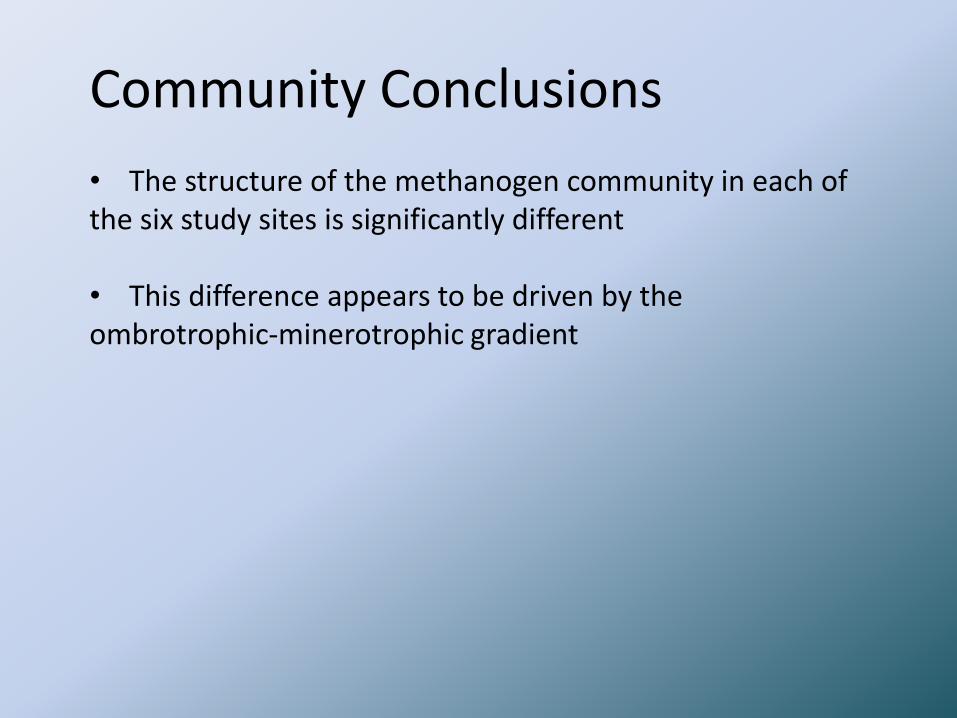
Community Conclusions • The structure of the methanogen community in each of the six study sites is significantly different • This difference appears to be driven by the ombrotrophic-minerotrophic gradient
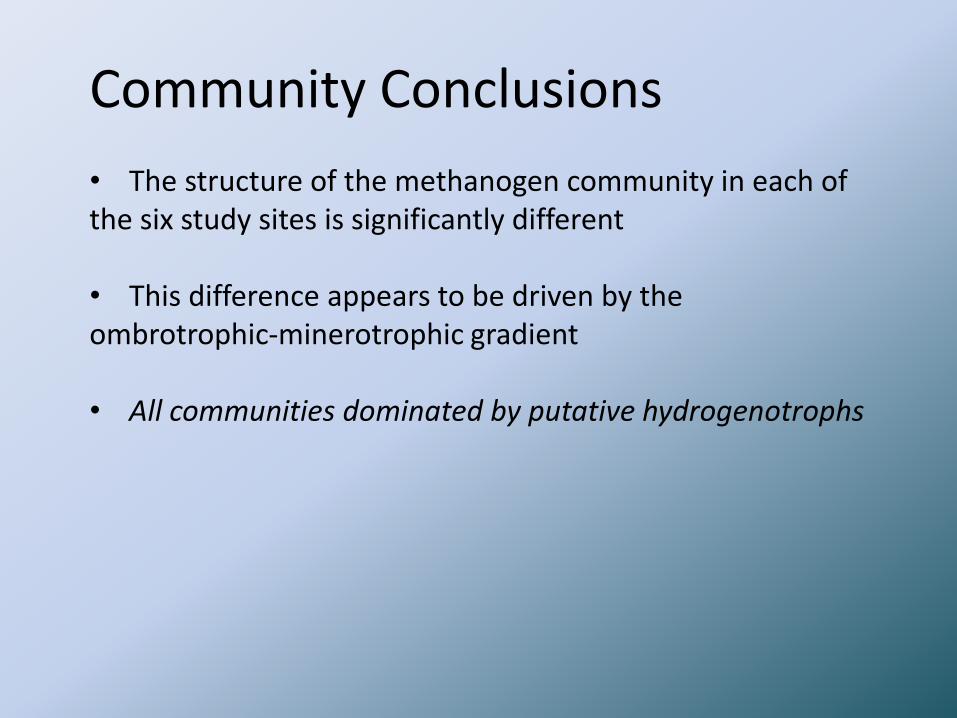
Community Conclusions • The structure of the methanogen community in each of the six study sites is significantly different • This difference appears to be driven by the ombrotrophic-minerotrophic gradient • All communities dominated by putative hydrogenotrophs
Structure and Function
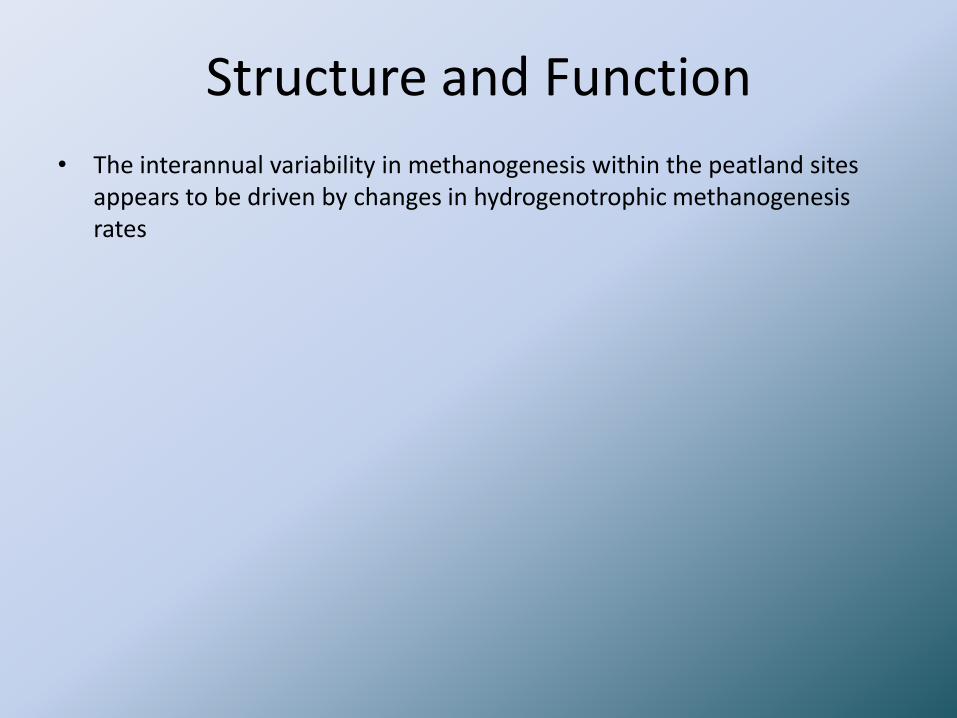
• The interannual variability in methanogenesis within the peatland sites appears to be driven by changes in hydrogenotrophic methanogenesis rates
Structure and Function
• The interannual variability in methanogenesis within the peatland sites appears to be driven by changes in hydrogenotrophic methanogenesis rates
• Putative hydrogenotrophs are dominant in all May 2010 community samples
Structure and Function
• The interannual variability in methanogenesis within the peatland sites appears to be driven by changes in hydrogenotrophic methanogenesis rates
• Putative hydrogenotrophs are dominant in all May 2010 community samples
• Acetoclastic methanogenesis correlate very strongly to gradient position, while hydrogenotrophic methanogenesis does not

Hypotheses
Hypotheses
• H1: Acetoclastic methanogenesis in northern peatlands is primarily driven by hydrogeomorphic conditions, resulting in a strong spatial pattern of different rates, performed by a relatively small but robust community acetoclasts
Hypotheses
• H1: Acetoclastic methanogenesis in northern peatlands is primarily driven by hydrogeomorphic conditions, resulting in a strong spatial pattern of different rates, performed by a relatively small but robust community acetoclasts
• H2: Hydrogenotrophic methanogenesis in northern peatlands is primarily driven by dynamic or opportunistic changes in hydrogenotroph community activity by season, resulting in a strong temporal pattern of rate variation

Future Directions
Future Directions
• Thoroughly sample the mcrA DNA of each site during all seasons, to determine if the total communities remain stable throughout the growing season (H1) using high-throughput sequencing (454 pyrosequencing)
Future Directions
• Thoroughly sample the mcrA DNA of each site during all seasons, to determine if the total communities remain stable throughout the growing season (H1) using high-throughput sequencing (454 pyrosequencing)
• Use SEM and NMS to compare effects of community and hydrogeomorphic context on the two pathways (H1)
• Thoroughly sample mcrA mRNA from each site and sampling event, to determine if the transcriptional activity of functional methanogen groups fluctuates in sync with the rates of their associated pathways (H2)
Acknowledgements Jason Keller
Pat Megonigal
Danielle Fuchs
Bharat Narang
Chrissy Anderson
Nate Eisenhut
Kathryn Docherty
JR Giska
Becky Mueller
Lorien Reynolds
Ann Womack
Evan Jones
National Science Foundation
Society of Wetland Scientists
The Wetland Foundation
William R. Sistrom Graduate Fellowship in Biology


