Methane UK - Environmental Change Institute - University ... · Christian N. Jardine, Brenda...
96
Christian N. Jardine, Brenda Boardman, Ayub Osman Julia Vowles and Jane Palmer Environmental Change Institute, University of Oxford 1a Mansfield Road, Oxford OX1 3SZ Tel: +44 (0)1865 281180 Web: www.eci.ox.ac.uk email: [email protected] methane uk
Transcript of Methane UK - Environmental Change Institute - University ... · Christian N. Jardine, Brenda...

Christian N. Jardine, Brenda Boardman, Ayub OsmanJulia Vowles and Jane Palmer
Environmental Change Institute, University of Oxford1a Mansfield Road, Oxford OX1 3SZTel: +44 (0)1865 281180Web: www.eci.ox.ac.ukemail: [email protected]
methane uk

ObjectivesThis report forms part of the BiffawardProgramme on Sustainable Resource Use. The aimof this programme is to provide accessible, well-researched information about the flows ofdifferent resources through the UK economybased either singly, or on a combination ofregions, material streams or industry sectors.
BackgroundInformation about material resource flowsthrough the UK economy is of fundamentalimportance to the cost-effective management ofresource flows, especially at the stage when theresources become ‘waste’.
In order to maximise the Programme’s fullpotential, data will be generated and classified inways that are both consistent with each other,and with the methodologies of the othergenerators of resource flow/waste managementdata.
In addition to the projects having their ownmeans of dissemination to their ownconstituencies, their data and information will begathered together in a common format tofacilitate policy making at corporate, regional andnational levels.
Mass balance UKThe methane uk project is not strictly a massbalance project, as it deals with post-disposalgeneration of methane from landfill sites as wellas that from agriculture and fossil fuel sources.However, it complements existing publications inthe Sustainable Resource Use series includingCarbon UK (2002). More than 30 different massbalance projects have been funded by Biffaward.For more information on the Mass Balance UKprogramme please visit www.massbalance.org
AcknowledgementsThe authors would like to acknowledge the manyhelpful discussions held with Mike Mason(Climate Care), Peter Jones (BIFFA) and CameronDavies (Alkane Energy), James Blunt (Spectron)and Tim Atkinson (Natsource).
Further thanks goes to Deborah Strickland forher help with the images contained within thisreport.
We would also like to recognise our partnerson the www.ch4.org website – Richard Watson,Catherine Bottrill and Ian Curtis – for theiractivities in promoting the links between waste,energy and climate change.
Biffaward programme on sustainable resource use

Figures 4Tables 4Executive summary 5
1 Methane and climate change1.1 Climate change and the role of
greenhouse gases 61.2 Why methane? 91.3 International policy context 101.4 UK policy context 121.5 Role of methane emissions reductions 12
2 Climate science of methane2.1 Introduction 142.2 Methane sources 142.3 Methane sinks 182.4 Methane in the atmosphere 20
3 Methane emissions trading3.1 Emissions trading concept 243.2 Emissions trading schemes 263.3 Review of the UK ETS 293.4 Conclusions 30
4 Methane in the UK4.1 UK methane sources 324.2 Historical trends 324.3 Breakdown by region 334.4 Data uncertainties 344.5 UK greenhouse gas emissions 35
5 Waste and landfill5.1 Methane from landfill 375.2 Landfill in the UK 395.3 Methane capture 415.4 Alternatives to landfill 455.5 Recommendations 49
6 Agriculture6.1 How is methane produced? 526.2 Mitigating emissions from livestock 536.3 Mitigating emissions from manure
management 556.4 Existing EU and UK policy 576.5 Recommendations 58
7 Oil and gas sector7.1 Introduction 607.2 Sources of methane 607.3 Mitigating methane emissions 617.4 Existing UK policies 617.5 Recommendations 62
8 Coal mine methane8.1 Production 648.2 Mitigation 658.3 Current policy 688.4 Recommendations 69
9 Discussion and conclusions9.1 Importance of methane 729.2 Disparity of methane sources 729.3 Methane trading 729.4 Recommendations 749.5 Conclusions 74
Glossary 78
References 83
Appendix I The atmospheric chemistry of methane 89
Contents

4
Figure 1 Infra-red radiation is trapped within theearth’s atmosphere by trace greenhouse gases 9
Figure 2 Global average surface temperature since 1860 10
Figure 3 Historical and projected atmosphericconcentrations of carbon dioxide 11
Figure 4 Global methane cycle 17
Figure 5 A representative distribution of worldwideanthropogenic and natural sources of methane 19
Figure 6 Relative concentration of methane in theatmosphere 22
Figure 7 Radiative forcing of methane and carbondioxide 25
Figure 8 Effect of emissions cessation (a) and gradual reduction (b) on atmospheric concentration 27
Figure 9 Comparison of (a) regulated approach & (b) market trading approach 29
Figure 10 UK ETS carbon prices, 2002-4 34
Figure 11 UK sources of methane, 2002 36
Figure 12 Long term trends in methane emissions, UK 37
Figure 13 Methane emissions by source and region, 2000 39
Figure 14 UK greenhouse gas emissions, 1990-2002 41
Figure 15 Estimated annual waste by sector (by mass) 43
Figure 16 Disposal methods of municipal waste,England, 1996-2003 46
Figure 17 Enteric fermentation in ruminantmammals 59
Figure 18 Gas consumption by sector, UK,1970-2003 67
Figure 19 North Sea Oil and Gas Fields 68
Figure 20 Coal fields in the UK 72
Figure 21 Recovery of methane from abandoned wells 74
Figure 22 Thermal flow reversal reactor 75
Figure 23 Oxidation of methane in the troposphere 101
Figure 24 Sources and sinks of the hydroxyl radical 102
Table 1 Global Warming Potentials of the ‘basket’ of six gases 11
Table 2 Sources of global methane emissions 16
Table 3 Emissions of methane (Mt) by source asquantified by different academic studies 17
Table 4 Sinks of methane 21
Table 5 Radiative forcing of selected greenhouse gases 23
Table 6 Global Warming Potentials for the greenhouse gas ‘basket’ 25
Table 7 Comparison between the UK and EU Emissions Trading Schemes 31
Table 8 UK methane emissions from 1990-2002 (Mt CH4) 37
Table 9 Regional breakdown of methane and total GHG generation, UK, 2000 37
Table 10 UK GHG emissions 1990-2002 (MtCO2e) 39
Table 11 Methane formation in landfill 43
Table 12 The waste hierarchy and options for dealing with biodegradable matter 45
Table 13 Contracts under Renewables Obligation,December 2001 50
Table 14 Financial incentives for electricity generation from waste streams 53
Table 15 Methane produced by enteric fermentation and manure management(kg methane per head per year) 57
Table 16 Potential for methane trading in each sector 80
Table 17 Disparity of methane sources and appropriate mitigation measures 81
Figures and tables

5
Methane is an extremely powerful greenhousegas, particularly in the short-term (less than 12years). It becomes more long-lived and damagingas the concentrations in the atmosphere increase,by altering the balance of the atmosphericchemical processes. These two importantconsiderations for methane mitigation policyindicate that the focus should be on immediatereductions.
The main sources of methane in the UK relatedto human activity are landfill, coal mines,ruminants and their manure, and leakages fromthe natural gas system.
In landfill sites, methane results from thebreakdown of biomass derivatives (e.g. tea leaves,paper) over a period of at least 15 to 20 years. Upto 85% of the methane generated can becaptured and then burned to produce electricitywhich qualifies for Renewable ObligationCertificates – an economically profitable processthat provides sufficient incentive to improvemethane capture. The remaining uncapturedmethane will still escape to the atmosphere. TheEU Landfill Directive requires the amount ofbiodegradable waste going to landfill in the UK tobe reduced to 35% by 2020, so the quantity ofmethane produced will decrease over time.
Coal mine methane comes from both activeand abandoned mines, but only the former isaccounted for in greenhouse gas inventories. Thelatter represents a potentially significant figurethat is ignored by the present system althoughDEFRA is close to completing an inventory. Thisform of methane release should no longer beignored. Technologies for capturing methanefrom deep mines exist but lack the necessaryfinancial drivers to encourage implementation inthe UK. There are no current policies toencourage capture for energy recovery and it isrecommended that these should be developed bythe Government.
There are opportunities to process animalmanure in anaerobic digesters and thus trap themethane for use in electricity generation thatqualifies for ROCs. This avenue is advocated for
greater encouragement. Policies to reduce theamount of methane produced by sheep and cows(the source of 90% of agricultural methaneemissions) – for instance injections, differentfeedstocks and preferential breeding – could meetconsumer resistance and are not seen as amainstream option. The Common AgriculturalPolicy is expected to reduce the present subsidy(£1.40 per day, per cow), which, along withconsumer trends to less dairy and red meatconsumption, is likely to have a gradual butpersistent effect on UK demand and possiblyproduction. Agricultural emissions have beenslowly reducing and may continue to do so, butwill remain the major source of methane in theUK.
The leakage of natural gas from thetransmission and distribution system is poorlyquantified but probably a substantial problem.Because of uncertainty about the numbers therecan be no possibility of using reductions in atrading system. The policy emphasis has to bewith Ofgem and regulation.
Methane trading is a viable option for reducingemissions in some sectors. Methane from activecoal mines and gas and oil rigs has beensuccessfully traded under the UK EmissionsTrading Scheme. It is essential that this tradingopportunity continues through incorporation ofmethane into the EU Emissions Trading Scheme in2008, with interim policies to cover the two yeargap after closure of the UK ETS in 2006.
These various programmes should besupported by a more imaginative framework thatreflects the importance of achieving rapidmethane reductions. Serious consideration mustbe given to the short-term influence of gasessuch as methane. A focus on emissions that havea strong, immediate effect on the climate wouldbuy time for carbon dioxide reducing policies andtechnologies to become more effective andprevent methane from becoming more potent.
Executive summary

6 Chapter 1: Methane and climate change
Methane (CH4) is a colourless, odourless, tastelessgas, which is naturally present in the atmosphereand is the main component of the fossil fuel,natural gas. The importance of methane (CH4) issecond only to carbon dioxide (CO2) in terms ofoverall contribution to human-induced climatechange. Whilst methane exists in a far loweratmospheric concentration than carbon dioxide, itis a particularly powerful greenhouse gas,deemed responsible for around 20% of post-industrial global warming.1 The relative potencyand short atmospheric lifetime of the gas makeefforts to reduce methane emissions an attractiveclimate change policy option. A unit reduction ofone tonne of methane is deemed equivalent to areduction of 23 tonnes of carbon dioxide.1Because of the relative potencies, mitigatingmethane emissions is often more cost effectivethan mitigating carbon dioxide emissions and istherefore an ideal method of achievinginternational and government set targets atminimum cost to the economy. It can also buytime for the development of carbon dioxidemitigation technologies not sufficiently advancedat present to be cost-effective.
So far, methane has played a pivotal role inefforts to meet the UK’s greenhouse gas emissionreduction target under the Kyoto Protocol,accounting for 30% of the overall greenhouse gasreduction between 1990 and 2002. However,much of this decrease in methane emissions hasbeen serendipitous, being a result of a decline in
the UK coal industry and improved landfill captechnologies, rather than a result of targetedpolicy. In order to help mitigate climate changeand be assured of meeting the Kyoto target andsubsequent obligations, it is imperative thatfurther methane emission reductions are bothachieved and maintained in the long term.Identifying the most efficient way of reachingthese goals, coupled with effective policies, mustnow be a priority. The question for policy makersis this – what is the easiest way of reducing ourinfluence on the climate of our planet withminimal impact to individuals and minimumimpact to the economy?
This report examines the major sources ofmethane in the UK, technologies for emissionsabatement, current policies and future policymeasures that could bring about lastingemissions reductions, with a particular focus onthe potential for methane trading.
1.1 Climate change and the role ofgreenhouse gases
There is now widespread scientific consensusrelating to the profound influence of humanactivity on the global climatic system, particularlythrough increased emissions of greenhouse gasesin the post-industrial era. The effect on the globalclimate is already apparent and is likely tobecome more pronounced over the forthcomingdecades.
What is the greenhouse effect?The greenhouse effect is the term used todescribe the warming mechanism provided bycertain atmospheric gases. These are typicallytrace gases, known as greenhouse gases, whichnaturally make up about 1% of the atmosphere.Greenhouse gases are effective absorbers of infra-red radiation (heat), so the radiation emitted fromthe earth’s surface cannot then escape into space(Figure 1). The net result is that the greenhousegases trap energy inside the earth’s atmosphereand maintain the earth’s surface temperature at
Methane and climate change
Figure 1 : Infra-redradiation is trapped withinthe earth’s atmosphere bytrace greenhouse gases

7 Chapter 1: Methane and climate change
definitive as our current understanding allows.The IPPC’s Second Assessment Report of 19952
was instrumental in the development of theKyoto Protocol and the Third Assessment Report 1
was published in 2001.It is now widely acknowledged that the
delicate natural equilibrium is being thrown outof balance. The IPPC reports that during the lastcentury, global average surface temperature hasincreased by over 0.6oC1. This is likely to be thelargest temperature increase of any centuryduring the last 1000 years and the implicationsare becoming increasingly apparent. It is verylikely that the warming during the 20th centuryhas contributed significantly to the observed sealevel rise of 10 to 20 cm, through thermalexpansion of seawater and widespread loss ofland ice. Since the 1950s, the extent of spring andsummer ice cover in the Northern Hemispherehas decreased by 10-15% and, since the 1960s,land snow cover has reduced by around 10%.Global warming is also linked to marked changesin precipitation regimes. The intensity andfrequency of droughts in some parts of Asia andAfrica have increased, whilst elsewhere, areashave become wetter and heavy precipitation
Figure 2 Global averagesurface temperature since1860 Note: Bars are annual average,solid line is decadal average
Source: IPCC, 20011
approximately 30ºC warmer than it would bewere these trace gases not present. As such, thepresence of greenhouse gases in the atmosphereis vital for our existence. Most notably, theymaintain a moderate temperature where watercan exist in liquid form – an importantprecondition for organic life.
The changing global climateClimate science is extremely complex and whilstour current understanding is incomplete, it isadvancing as modelling and monitoring improve.The most accurate picture of our understandingof the planet’s atmosphere has been achievedthrough a ‘consensus’ of current knowledge underthe Intergovernmental Panel on Climate Change(IPCC). This is a body established by the WorldMeteorological Organisation and United NationsEnvironment Programme to assess scientific,technical and socio-economic informationrelevant for the understanding of climate change,its potential impacts and options for adaptationand mitigation. It does not carry out its ownresearch but collates information from peer-reviewed papers into a coherent whole. As such,the IPCC reports are seen as being as close to

8 Chapter 1: Methane and climate change
events leading to flooding have become morecommonplace.
The IPCC’s Third Assessment Report2 attributes‘most’ of the observed warming over the last 50years to human activity (anthropogenicemissions) and increased atmosphericconcentrations of greenhouse gases (Figure 3),leading to an enhanced greenhouse effect.
Continued growth in greenhouse gasemissions is predicted to intensify climate changeover the next century. In particular, global climatemodels predict that average surface temperaturewill increase by between 1.4 and 5.8ºC between1990 and 2100 based on a range of greenhousegas emission scenarios. This is far in excess of theobserved changes during the last century andconsequently the knock-on effects for icecoverage, sea level rise and precipitation regimesare likely to be intensified.
Global warming and climate changeClimate change is the variability in the earth’sclimate, which is increasing as a result of globalwarming. However, the relationship betweenglobal warming and the impacts of climatechange is complex: we cannot say that, forexample in terms of livelihood or economicimpacts, a 4ºC temperature rise will be twice asharmful as a 2ºC temperature rise.
Some climate impacts are directly related tothe extent of the temperature rise; ice cover willreduce and sea levels will rise as temperatureincreases. For other climate impacts it is the rateof temperature rise that is the critical factor;ecosystems are capable of adapting totemperature rises, but only over suitably longtimescales. The different greenhouse gases havedifferent potencies and lifetimes and so affect theextent and rate of global warming in differentways. Methane is a peculiar case, being potent in
Figure 3 : Historical andprojected atmosphericconcentrations of carbondioxideSource: Global CommonsInstitute
Flooding and flood management currently cost theUK around £2.2 billion per year

9 Chapter 1: Methane and climate change
the short term yet short-lived, thereforepredominantly affecting the short-term rate ofglobal warming.
1.2 Why methane?Anthropogenic emissions of greenhouse gaseshave caused substantial changes to our climateand will continue to do so over the course of thenext century and beyond, if emissions are notstabilised, or preferably reduced.
The IPCC has identified a ‘basket’ of sixgreenhouse gases that contribute toanthropogenic climate change. These are carbondioxide (CO2), methane (CH4), nitrous oxide (N2O),the chlorofluorocarbons (CFCs), perfluorocarbons(PFCs) and sulphur hexafluoride (SF6).
The Kyoto Protocol (Section 1.3) is a multi-gasabatement strategy, allowing reductions to bemade in any of the six major greenhouse gases.Such multi-gas strategies have been shown to becheaper than a single gas strategy.3, 4 They arealso politically less sensitive as they allowcountries to choose their own pathway to anoverall greenhouse gas (GHG) emission reduction,rather than having limits per gas imposed onthem by an external body. This allows flexibilitybetween different countries with differentportfolios of GHG emissions. For example,countries with good renewable energy resourcesmay wish to promote these resources and therebyreduce carbon dioxide emissions. Other countriesmay find it more effective to reduce methaneemissions by altering waste management oragricultural practices.
PotencySuch multi-gas abatement strategies require ameasure of the relative potency of the differentgases. The Global Warming Potential (GWP) is themost commonly used parameter for this. Severaldifferent definitions of the GWP exist – by far themost common is the 100 year GWP, which is usedin all international and government policiesincluding the Kyoto Protocol (Table 1).
Table 1: Global Warming Potentials of the ‘basket’of six gases
Global Warming Lifetime Gas Potential (100-year) (years)CO2 1 5-200CH4 23 12N2O 296 114HFCs 12-12,000 0.3 - 260PFCs 5,700-11,900 2,600-50,000SF6 22,200 3,200
Source: IPCC 20011
It can be seen that on a 100-year timescale, onetonne of methane is 23 times more potent thanone tonne of carbon dioxide. This makesmethane an attractive option for greenhouse gasemission reductions because smaller reductionsare necessary to achieve the same environmentalgoal. Methane is currently emitted in enoughvolume to make any reductions significant interms of the overall GHG picture. Methane can bereadily captured from localised sources such aslandfill and coal mines. Furthermore, methane isa flammable gas with a high energy contentwhich, once captured, can be used as a fuel withthe added economic benefits of heat or electricitygeneration.
True potentialThe Third Assessment Report provided revisedGWP figures for a number of gases, notablyincreasing the relative potency of methane from21, quoted in the Second Assessment Report, to 23.However, parties to the UNFCCC have agreed thatthe revised figures will not apply until the secondcommitment period (2013-2017). Thereforeprogress towards the original Kyoto targets setfor 2008-2012 will continue to be calculated usingGWP figures provided within the SecondAssessment Report (i.e. a GWP of 21). Similarly,inventory submissions will continue to be basedon old GWP figures throughout this period,according to the current reporting guidelines.5

10 Chapter 1: Methane and climate change
For the remainder of this report, a GWP of 23 isused when referring to the current level ofscientific understanding. However, a GWP of 21 isimplied in all discussions relating to current policyconcerned with emissions as reported under theUN Framework Convention on Climate Changeguidelines (Section 1.3).
LifetimeIt is also worth noting that methane has acomparatively short lifetime in the atmosphere ofjust 12 years, compared with up to 200 years forcarbon dioxide. This means that reductions inemissions are rapidly turned into atmosphericconcentration reductions. Gases with a longerlifetime reach higher atmospheric concentrationsand experience a longer lag between emissionsreductions and decreased atmosphericconcentrations. Reducing emissions of short-lifetime potent gases such as methane istherefore a valuable means of rapidly slowingglobal temperature rise. This gives reduction ofmethane emissions a high economic value(perhaps even greater than reflected in the GWPof 23) as they are effective at slowing the rate ofglobal warming. They are also likely to be evenmore important at some point in the futureshould the effects of climate change becomecritical and fast-acting measures need to beadopted.6, 7
1.3 International policy contextThe international community originally drewattention to the link between climate change andhuman activities at First World ClimateConference in 1979. Extensive scientific research,international debate and a series ofintergovernmental conferences followed,culminating in 1992 with the production of theUN Framework Convention on Climate Change(UNFCCC).
The UN Framework Convention on ClimateChangeThe UNFCCC entered into force in 1994. Currently181 governments and the European Union areparty to the Convention. Its ‘ultimate objective’ isto stabilise atmospheric concentrations ofgreenhouse gases at safe levels, although it doesnot assess what these levels are. The signatoriesare required to submit regular nationalcommunications, including information onstrategies for mitigating and adapting to climatechange along with detailed greenhouse gasemission inventories.
The atmospheric concentration of anygreenhouse gas is determined by the balancebetween emissions from sources of the gas andremovals by sinks. At present, emission ratesexceed rates of removal and consequentlyatmospheric concentrations of greenhouse gasescontinue to rise. The IPCC report that in order tostabilise carbon dioxide emissions at 450, 650 or1000 ppm, global anthropogenic emissions wouldneed to drop below 1990 levels within a fewdecades, about a century, or about two centuries,respectively, and continue to decrease steadilythereafter.
Even if emissions are stabilised now, globalaverage surface temperature is expected tocontinue to rise for centuries to come. However,by stabilising emissions as quickly as possible, thetemperature increase could be reduced fromseveral degrees per century to tenths of a degree.The lower the level at which emissions arestabilised, the smaller the increase in temperatureexpected. Furthermore, by acting on the moreshort-lived methane, the global temperatureincrease can be minimised more rapidly.
The Kyoto ProtocolThe ultimate goal of the UNFCCC is the“stabilisation of greenhouse gas concentrations inthe atmosphere at a level that would preventdangerous anthropogenic interference with theclimate system”. In 1997, the adoption of theKyoto Protocol went one step further towards this
11 Chapter 1: Methane and climate change
goal, strengthening the commitments under theUNFCCC by providing legally binding emissionreduction targets for developed countries (the so-called Annex I countries). Targets for individualcountries were established through negotiation,although in total are equivalent to a 5.2%reduction from 1990 levels by the firstcommitment period of 2010 (defined as theaverage emissions for the period 2008-2012, tocope with anomalous years).
It is widely acknowledged that these 5.2%targets set by the Kyoto Protocol are not stringentenough to avert potentially catastrophic climatechange, but they are a major step in the rightdirection. Crucially, it is envisaged that the KyotoProtocol will entail further five-year commitmentperiods, with progressively stricter emissionreduction targets. The second commitment periodis scheduled for 2013-2017, with negotiations oftargets beginning in 2005.
The Kyoto Protocol will finally become legallybinding on 16 February 2005, followingratification of the treaty by Russia in November2004.
How will the Kyoto Protocol work?To alleviate the adverse economic effects ofcomprehensive limits on greenhouse gasemissions, three flexibility mechanisms, alsoreferred to as the Kyoto mechanisms, wereincluded in the Kyoto Protocol: InternationalEmissions Trading (IET), Joint Implementation (JI)and the Clean Development Mechanism (CDM).The purpose of these mechanisms is to allow
industrialised countries to meet their targetsthrough trading emission allowances with eachother and gaining credits for emission-curbingprojects abroad.
The central strategy to curb greenhouse gasemissions is that of emissions trading throughthe IET. Emissions trading involves the trading ofpermits to emit greenhouse as if they wereconventional commodities such as gold or oil. Itallows emissions reductions to be achieved atminimal cost to the economy, by allowing over-emission from those who cannot meet targetscheaply to be offset by under-emission fromthose who can mitigate at low cost. Emissionstrading, and the role that methane might playwithin such a scheme, is discussed in greaterdetail in Chapter 3. While implementation of thethree flexibility mechanisms at international levelwill become possible only once the Kyoto Protocolcomes into force, emissions trading of greenhousegases has already begun at a domestic level in theUK and in other countries such as Denmark. TheEU has already put in place an EU-wide tradingscheme, due to start in 2005.
Joint Implementation and the CleanDevelopment Mechanism are designed to provideflexibility for countries to meet part of their Kyototargets by taking advantage of opportunities toreduce greenhouse gas emissions in othercountries at lower cost than at home. These twomechanisms are project-based and allow thegeneration of credits when projects achieveemission reductions that are additional to thatwhich would have occurred in the absence of theproject. Joint Implementation refers to projects incountries that also have emission targets,whereas the Clean Development Mechanismrefers to projects in developing countries with notargets. The rationale is that, for the globalenvironment, where the emission reductionoccurs is of secondary importance provided thatreal emission reductions are achieved. In order topromote participation by corporate investors, thisshould be allowed to occur where costs arelowest.
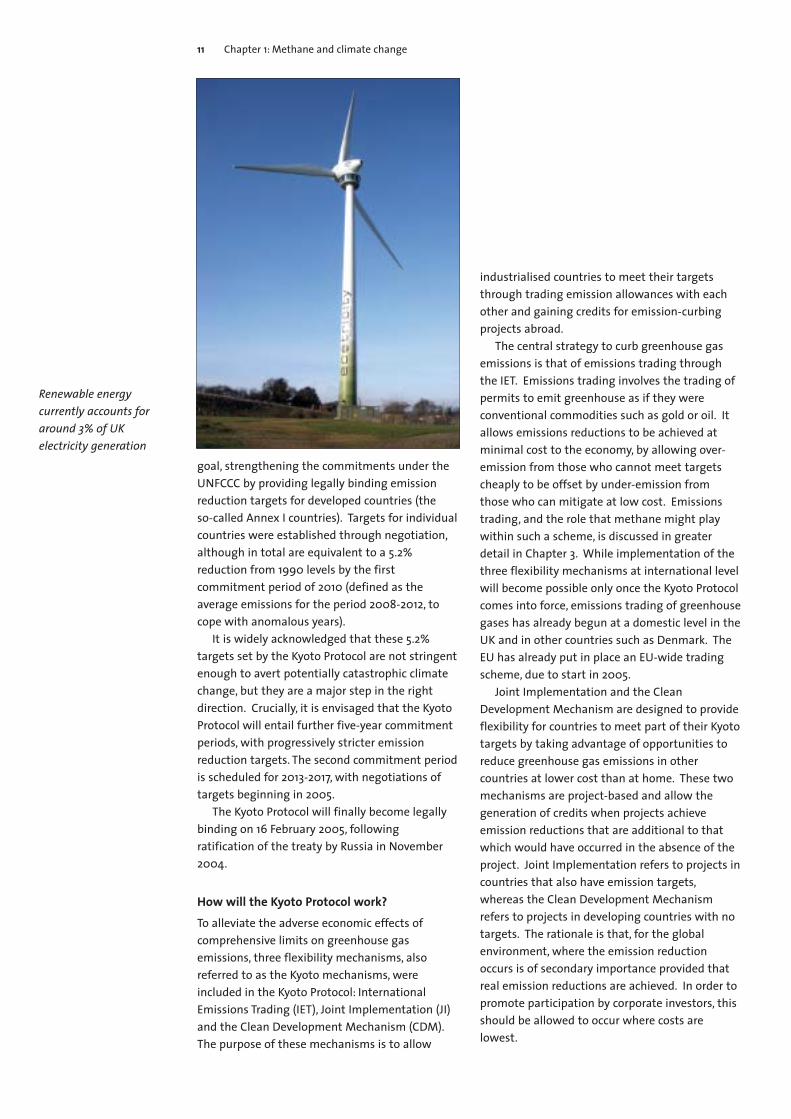
Renewable energycurrently accounts foraround 3% of UKelectricity generation

12 Chapter 1: Methane and climate change
Addressing climate change in the UKThe UK was amongst the first nations to ratifythe Kyoto Protocol. Under burden sharingagreements within the EU, the UK has committedto an emissions reduction target of 12.5%, relativeto a 1990 baseline, on the ‘basket’ of sixgreenhouse gases by 2008-2012. This target canbe met through reductions in all or any of thebasket of six gases, allowing flexibility in thechoice of policy options, and is calculated in CO2equivalent terms.
The Energy White Paper, published in February2003, has positioned the UK at the forefront ofinternational efforts to tackle climate change,with an ambitious target of a 60% reduction incarbon dioxide emissions by 2050.8 The UKGovernment is working to encourage theinternational community to adopt similar targetswith the launch of its International EnergyStrategy in October 2004.9
1.4 UK policy contextThere are certain UK policies which have played arole in encouraging methane emissionsreductions, either directly or indirectly.
Renewables targetsUnder the EU Renewables Directive, which cameinto force in October 2001, the UK has adopted atarget of 10% of UK electricity consumption by2010 to come from renewable sources. Inprevious years wastes have been included withrenewables, but from 2004, the internationaldefinition of total renewables has been adoptedwhich excludes non-biodegradable wastes.10
Renewables ObligationThe Renewables Obligation, introduced in April2002, is the key policy measure to help achievethe UK’s renewable energy targets and willremain in place until 2027, with yearly targets setup until 2011. It requires all licensed electricity
suppliers in England and Wales to supply aspecific proportion of their electricity fromrenewables, evidenced via a system ofRenewables Obligation Certificates (ROCs).
ROCs are issued to accredited generators andmay be traded separately from the electricity towhich they relate, allowing suppliers who havefailed to reach the target to purchase certificatesfrom those suppliers that have surpassed theirObligation requirements. Renewabletechnologies eligible for ROCs include wind,landfill gas and incineration of biomass, amongstothers. Incineration and co-firing of mixed wasteare excluded. ROCs are one of the key economicdrivers in the UK for encouraging investment inmethane mitigation.
Climate Change LevyThe Climate Change Levy (CCL) was introduced inApril 2001 as a tax on electricity supplied to non-domestic customers in the UK. Intensive users ofenergy are able to join Climate Change LevyAgreements, helping to mitigate the effects ofthis tax. Under these agreements, businessesthat accept and subsequently meet energyreduction targets will receive an 80% levydiscount until the year 2013. Electricity fromqualifying renewable sources, such as solar andwind power, is exempt from the Levy and eligiblefor Levy Exemption Certificates (LECs). Electricityfrom some energy from waste schemes is notexempt.
1.5 Role of methane emissionsreductions
The importance of methane in meeting the UK’sKyoto target cannot be understated. So far,methane emissions have fallen by 43% between1990 and 2002 (Section 4.5), equivalent to 30% ofthe UK’s total greenhouse gas emissionreductions. The proportional contribution ofmethane to total emission reductions is expectedto increase, with UK Government baseline

13 Chapter 1: Methane and climate change
projections aimed at halving methane emissionsby 2020. 11
Emphasis on methane emission reductioncould pave the way for commercial opportunitiesand enhanced competitiveness, with increasedefficiency and technological developments inmethane mitigation, capture and utilizationforming an integral component of a lower carboneconomy. Methane emission reduction is alsoparticularly apposite to improved safety, owing tothe flammable and explosive nature of the gas.Furthermore, the high energy content of methanemakes its combustion for energy recovery highlydesirable. Utilisation of methane to generateelectricity or heat, producing the less potentcarbon dioxide, can offset emissions from morecarbon-intensive coal or oil powered generators.
On a global basis, the benefits of methaneemission reductions in terms of climate changeabatement may be even more profound. The shortlifetime and relative potency of methane in theatmosphere mean that the benefits of emissionreductions are quickly apparent. Investment inmethane abatement technologies would buytime for the development of cheaper carbondioxide mitigation technologies, especially newrenewable energy technologies. Large cuts inmethane emissions could potentially avert ordelay climate change in the short term, providingthe much needed time for carbon dioxidemitigation policies to be implemented and theireffects observed in the atmosphere.

2.1 IntroductionMethane is the most abundant reactive trace gasin the atmosphere and arises from both naturaland anthropogenic sources. It is a valuable gasand is usable at a wide range of concentrations,down to 5%. In concentrated form it is flammable,representing an explosion risk in confinedconditions.
The global atmospheric burden of methane (in1998) was 4850 Mt(CH4), equivalent to an averageconcentration of 1745 parts per billion (ppb). Theglobal methane budget can be modelled bysimply considering emissions as increasing theatmospheric burden of methane, with sinksremoving methane from the atmosphere – themethane cycle. The concentration of methane inthe atmosphere is thought to be increasing at arate of 22 Mt/yr, due to the imbalance betweenestimated annual global emissions of 598 Mt andremovals of 576 Mt (Figure 4).1
It is therefore important to reduce globalemissions to such a level that they areoutweighed by methane sinks, so that theconcentration of methane in the atmospheredecreases and its subsequent warming effect isreduced. A reduction of global emissions by just22 Mt per year would result in stabilisation ofmethane concentrations in the atmosphere. Sucha reduction represents just 3.6% of total methaneemissions, or 6.1% of anthropogenic emissions.Such small reductions should be attainable.Obtaining a reduction in atmospheric methaneconcentrations would provide an encouragingexample in the fight against global warming.
14 Chapter 2: Climate science of methane
2.2 Methane sourcesMethane is emitted from a range of natural andanthropogenic (relating to human activity)sources as a result of the anaerobicdecomposition of organic matter, land usechanges and fossil fuel related emissions (Table 2).
Table 2: Sources of global methane emissions
Natural AnthropogenicWetlands Agricultural livestockTermite activity Rice cultivationOceans Waste practices
Coal miningNatural gas distributionBiomass burning
Whilst the major sources of atmospheric methanehave been identified, quantifying their individualcontributions to global emissions has proved
Climate science of methane
Figure 4: Global methane cycle
Wetlands are areas of marsh, fen, peatland andwater, representing approximately 6% of theworld’s land surface

15 Chapter 2: Climate science of methane
problematic.12, 13 For many sources, emissions arehighly variable in space and time. For instance,emissions from most types of wetlands can varyby a few orders of magnitude over just a fewmetres.1
Based on a range of studies, the IPCC1
estimates that global emissions of methane arearound 598 Mt per year, but does not provide adefinitive breakdown of CH4 emissions by source.Other studies have attempted to classify this, butthere are a wide range of estimates anddefinitions used for each sector (Table 3). This lackof accuracy and definitive emissions figures is aserious handicap to the design of practical policyand trading schemes.13
Table 3: Emissions of methane (Mt) by source as quantified by different academic studies
Source Fung Hein Lelieveld HouwelingMosier Olivier Cao et al.14 et al.15 et al.16 et al.17 et al.18 et al.19 et al.20 SAR2 TAR1
NaturalWetlands 115 237 225 145 92Termites 20 20 20Ocean 10 15 15Hydrates 5 10Anthropogenic Energy 75 97 110 89 109Landfill 40 35 40 73 36Ruminants 80 90 115 93 80 93Waste Treatment 25 14Rice Agriculture 100 88 25-54 60 53Biomass 55 40 40 40 34 23Other 20 15TOTAL 500 587 600 597 598
Source: IPCC, 20011
The role of bacteriaThere are two classes of bacteria actively involvedin the methane cycle. Methanogenic bacteriagenerate methane by breaking down organicmatter in the absence of oxygen (anaerobically),releasing carbon dioxide and methane accordingto the reaction:
BacterialActionC6H12O6
(e.g. cellulose) 3CO2 + 3CH4
Conversely, methanotrophic bacteria oxidisemethane to carbon dioxide. Methanotrophicbacteria are of two sorts; low affinity oxidation,where methanotrophs oxidise highconcentrations of methane at the source ofproduction (usually a population ofmethanogenic bacteria), and high affinityoxidation, which can oxidise methane present atatmospheric concentrations.

16 Chapter 2: Climate science of methane
Natural sourcesThe main natural sources of methane arewetlands, termites and oceans. Wetlands are byfar the largest source, accounting for 30% of totalemissions (Figure 5), with methane beingproduced from the anaerobic decomposition oforganic matter covered by water. Because thisprocess involves the action of bacteria, the rate ofmethane production is strongly temperaturedependent. Maximum methane production isexperienced at temperatures between 37 and45ºC and so future increases in globaltemperature may enhance methane productionfrom wetlands, thereby reinforcing thegreenhouse effect.
Methane is also produced by the digestiveprocesses of termites, resulting in the generationof around 20 Mt per year – approximately 5% ofworld methane emissions. This value is unlikelyto change as termite populations are notexpanding despite greater availability of biomassdue to deforestation.22 Methane emissions fromtermites should be treated as a significant, butbackground, source that is likely to remainconstant.
Oceans contribute approximately 2% to globalmethane emissions. The methane is produced bymethanogenic bacteria within sinking particles in
surface waters. The production of methane fromoceans is spatially dependent, with muchmethane arising from methanogenesis in marinesediments, particularly in nutrient rich areas suchas estuaries. There is also an anthropogeniccomponent to ocean emissions, with bacterialpopulations being increased by high nutrientlevels from agricultural fertiliser run-off andwaste treatment effluents.
Anthropogenic sourcesApproximately 60% of emissions are related tohuman activities. The key anthropogenic sourcesof methane include fossil fuels, agriculture,landfill and the burning of biomass. Methaneemissions arising from the fossil fuel industryform the largest anthropogenic source ofmethane, estimated to be between 80 and 100Mt per year. The main sources of fossil fuel-related methane emissions are the release ofnatural gas from coal mining and leakage fromgas processing and distribution pipes. Pockets ofmethane that have been trapped between layersof coal during its formation and methane withinthe coal itself are released once the coal is mined.
Agricultural practices also result in significantmethane emissions, the two major sectors beingrice production and the rearing of livestock.Paddy fields for rice production are essentiallyman-made wetland areas and are characterisedby high moisture content, oxygen depletion andhigh organic substrate and nutrient levels.23 Assuch, they provide ideal conditions formethanogenic bacteria and result in substantialemissions of methane of approximately 40 Mtper year. Up to 90% of this methane is absorbedby populations of methanotrophic bacteria, whichconvert the methane to carbon dioxide, but theremaining 10% escapes to the atmosphere. Theproduction of 1 kg of rice corresponds to theemission of 100 g of methane.24 It is worthnoting that the accuracy of methane emissionsestimates has improved substantially over thepast decade, with current figures almost halfprevious estimates.1
Figure 5: A representative distribution of worldwide anthropogenic and naturalsources of methaneSource: Khalil, 200021

17 Chapter 2: Climate science of methane
Methane is produced as part of the naturaldigestive processes of ruminant animals such ascattle, sheep and goats. Food is broken down bybacteria in the rumen, aiding digestion, sincestomach enzymes are insufficient to break downplant polymers. However, the action of thesebacteria yields methane, carbon dioxide andammonia as gaseous by-products. With anincreasing global population, coupled with higherliving standards, livestock numbers are increasingworld-wide and contribute some 50-100 Mt peryear to global methane emissions.
Landfill sites also provide an anaerobicenvironment where methanogenic bacteria breakdown waste organic materials. Somewherebetween 40 and 60% of landfill gas is methane,depending on the composition of the waste. Theremainder is mainly carbon dioxide with othertrace gases. The amount of methane emitted tothe atmosphere from a landfill site is stronglydependent on the design and operation of thesite. Unchecked, the landfill gas will simplypermeate through the waste or along cracks inthe compacted waste or bedrock. Modern landfillsites use impermeable liners and a capping layerto control the movement of the gas, which maythen be collected. However, even the best capsare only 85% efficient25 with the remaining 15% ofmethane escaping through the cap.26 This isoffset by breakdown of up to 90% of themethane in the capping layer by methanotrophicbacteria (Section 5.1).
The burning of biomass releases around 40 Mtof methane into the atmosphere each year.Biomass burning results mainly in the production
of carbon dioxide, but if fires smoulder andcombustion is incomplete, methane and othervolatile organic compounds are released. Theextent of methane emissions is dependent on thecompleteness of combustion and the carboncontent of the fuel used.27
Methane hydratesAlthough currently neither a source nor a sink,methane hydrates are by far the largest store ofmethane on the planet and account for 53% of allfossil fuels on earth.28 They are a crystalline solidmixture of water and methane (essentiallymethane trapped in ice) and are found in oceanfloor sediments and arctic permafrost. Methanehydrates are stable compounds and are not partof the methane cycle described in this chapter.
The methane in ocean sediment hydrates istrapped by the high pressure deep in the oceanbut is released above a depth of 400m as thepressure drops. The energy industry is keen totake advantage of this and mine these deposits.29
Methane contained in arctic tundra, trappedwithin the frozen solid structure of the hydrate, isa more serious issue. Should temperatures rise,the methane hydrate will melt, releasing methanegas to the atmosphere. There is concern that, ifrising global temperatures due to anthropogenicclimate change cause the arctic permafrost tomelt, massive quantities of methane would bereleased into the atmosphere, causing acatastrophic run-away greenhouse effect beyondeven the upper 5.8ºC estimate postulated by theIPCC. Such a process is believed to have occurredin the Palaeocene-Eocene Thermal Maximum,30
some 55 million years ago, when average globaltemperatures increased by 5ºC and which lastedfor 150,000 years.
Is it renewable?The question of whether methane is a renewableresource is central to determining its eligibility forstrong financial incentives such as ROCs.Renewable energy technologies are defined as
Rice paddy soil is fullywaterlogged for 4 monthseach year, creating anartificial wetland

18 Chapter 2: Climate science of methane
relying on “natural energy flows and sources inthe environment, which, since they arecontinually replenished, will never run out”.31
Agricultural emissions, being biogenic areclearly renewable. Methane from landfill ismostly derived from decomposition of plant-based material and once flared is approximatelycarbon neutral.32 It is also arguable whetherwaste streams are a ‘natural flow’, but it isassumed that societies will always produce somewaste as a consequence of their activities.Landfill gas is therefore defined as a renewableresource. However, if the same waste stream iscombusted to generate electricity, this does notcount as renewable because fossil-fuel basedplastics are incinerated.
Coal mine methane is certainly an energy flowwithin the environment, but is it a natural flow?As a resource, methane would not be released tothe atmosphere were it not for human action,although the same could be argued for landfillgas, which does qualify for ROCs. However,landfill gas is carbon-neutral, whereas the releaseof coal mine methane must be considered anaddition to the present carbon cycle. The DTI doesnot consider coal mine methane to be a
renewable resource.33 Methane from the oil andgas industries is also considered non renewable.
Although the issue of what is classified asrenewable is not straightforward, especially whenconsidering landfill and coal mine methane, theseparation assumed by policy makers is clear. Ifthe methane is generated from biogenic sources,it is renewable. Conversely, if it is derived fromfossil fuel sources, it does not count as renewable.
Future outlookBoth natural and anthropogenic sources ofmethane are likely to change the atmosphericburden over the forthcoming century.1 There isconsiderable potential to reduce theanthropogenic sources of methane by improvedwaste management and changes in agriculturalpractice. However, these sectors are still prone toupward pressure due to an increasing globalpopulation with increasing energy, land anddietary demands. Natural emissions may alsoincrease further as a result of global warming, ashigher average global temperatures maystimulate microbial activity.2, 20
2.3 Methane sinksMethane is removed from the atmosphere (i.e.converted to less harmful products) by a range ofchemical and biological processes, which occur indifferent regions of the atmosphere. Theseinclude tropospheric oxidation, stratosphericoxidation and uptake by soils.
The troposphere is the lowest 15 km of theatmosphere. As colder air lies on top of warmerair in this section of the atmosphere, thetroposphere is well mixed vertically by convectioncurrents. The methane is therefore present at aconstant concentration of approximately 1.7 ppmthroughout the troposphere. Becauseatmosphere decreases in density with increasingaltitude, over 75% of the atmosphere, andtherefore by far the majority of methane, iscontained within the troposphere (Figure 6).Oxidation of methane in the troposphere is the
Flaming ice: methanehydrates are essentiallymethane trapped in ice

19 Chapter 2: Climate science of methane
largest methane sink, removing 506 Mt ofmethane per year from the global methaneburden (Table 4). It is therefore changes to thechemistry and composition of the tropospherethat will dominate the future environmentalimpact of methane emissions.
Above the troposphere lies the stratosphere.The stratosphere is less dense than thetroposphere and is not mixed vertically byconvection, as warmer air lies on top of colder airin this region. Methane enters the stratospherefrom below and is consumed by chemicalreactions, so the relative concentration ofmethane decreases with altitude. Stratosphericoxidation of methane consumes 40 Mt per year.
The third process for removal of methane fromthe atmosphere occurs at the ground-atmosphereinterface. Bacteria present in soils can alsooxidise methane, thereby removing it from theatmosphere.
Table 4: Sinks of methane
Mechanism Methane removal (Mt)Tropospheric oxidation 506Stratospheric oxidation 40Soil uptake 30Total 576Emissions 598
Tropospheric oxidationThe predominant mechanism for removal ofmethane from the earth’s atmosphere isoxidation within the troposphere by the hydroxylradical (OH). The hydroxyl radical is responsiblefor the breakdown and removal of a host of tracegases, including methane, and for this reason isknown as the ‘cleanser of the atmosphere’. Inessence, atmospheric OH effects a low-temperature combustion of ‘fuels’, such asmethane and other hydrocarbon species, byeventually oxidising methane to carbon dioxide,as would happen if methane were burned.
Reactions between methane and the hydroxylradical initiates a chain of possible reactions thatproduce other species, such as carbon monoxide,nitrogen dioxide and hydroperoxide, which canthen be removed from the atmosphere. This is acomplex process with numerous feedback loops.A more detailed discussion of these reactions isprovided in Appendix I.
The overall rate of removal of methane isdependent on the rate of the initial reactionbetween methane and hydroxyl. This, in turn, isdependent on the concentrations of these speciesin the atmosphere. This has two importantconsequences.• Reaction between methane and hydroxyl
removes both species from the atmosphere. Asthe concentration of hydroxyl reduces, the rateof methane removal will slow down. Increasingatmospheric methane concentrations removeshydroxyl from the atmosphere and so slows itsown removal.
• Because the hydroxyl radical - the cleanser ofthe atmosphere - is capable of reacting withmany species, methane is not the onlyinfluence on its concentration. Sources ofhydroxyl (mainly ozone) are roughly constant,but it may be removed from the atmosphere byreactions with carbon monoxide (CO), nitrogendioxide (NO2), hydroperoxide (HO2) and volatileorganic compounds. In particular, the reactionbetween carbon monoxide and hydroxylproceeds very rapidly, so carbon monoxide
Figure 6: Relative concentration of methane in theatmosphereSource: Warneck, 198834

20 Chapter 2: Climate science of methane
scavenges hydroxyl from the atmosphere.Increased anthropogenic emissions of carbonmonoxide (from transport), coupled with thefurther carbon monoxide produced fromoxidation of methane, can cause significanthydroxyl concentration reductions and so slowthe rate of methane removal.
As the rate of methane removal slows, its lifetimein the atmosphere and therefore its GWP willincrease. Methane will become a more potentgreenhouse gas over time if hydroxylconcentrations continue to decrease. In terms ofpolicy, it is more effective to reduce methaneemissions now while hydroxyl concentrationsremain relatively high. Delaying action to reducemethane emissions, until a time when hydroxylconcentrations are lower, will result in theemitted methane being more potent.
Furthermore, successful methane emissionreductions, preferably accompanied by loweranthropogenic carbon monoxide emissions, couldresult in an increase in hydroxyl concentrationsand a subsequent lowering of the GWP of futuremethane emissions. This beneficial positivefeedback loop is a further reason for encouragingmethane emissions reduction in the short term.
Stratospheric oxidationSome of the methane present in the tropospherepasses into the stratosphere. Approximately 40Mt of methane are oxidised in the stratosphere,representing 7% of all methane removal. Thechemistry of methane in the lower stratosphere isidentical to that in the troposphere, with hydroxylradicals oxidising methane in the same manner.Indeed, oxidation of methane to carbon dioxideand water is the source of approximately 50% ofstratospheric water vapour.
In the upper stratosphere, methanedecomposition can be initiated in two other ways:by reaction with chlorine radicals or oxygenatoms. Chlorine atoms are produced bydecomposition of CFCs and related compounds bythe high intensities of ultraviolet light found in
the upper stratosphere. Oxygen atoms aresimilarly produced by the decomposition of ozone(O3) in uv light; it is this reaction in the ‘ozonelayer’ that prevents harmful ultraviolet radiationreaching the earth’s surface.
When chlorine or oxygen atoms react withmethane, they initiate the same chain reactionsthat occur in the troposphere, resulting in overalloxidation of methane and removal from theatmosphere.
Uptake by soilsApproximately 30 Mt of methane are removedfrom the atmosphere annually by uptake in soils.Soils contain populations of methanotrophicbacteria that can oxidise methane, by a processknown as ‘high affinity oxidation’. These bacteriaconsume methane that is in low concentrations,close to that of the atmosphere (<12 ppm). Thebacteria favour upland soils, in particular forestsoils.24 Surprisingly, the bacteria responsible forhigh affinity oxidation processes remain largelyunidentified. It is known, however, that exposureof soils to high ammonium concentrations leadsto a loss of methanotrophic bacteria and asubsequent reduction in the rate of methaneoxidation. The use of artificial fertiliserscontaining ammonia is therefore detrimental tothe removal of methane.24
2.4 Methane in the atmosphereThe atmospheric concentration of methane isthought to have increased by a factor of 2.5 sincepre-industrial times, reaching 1745 ppb in 1998.1This rate of increase far exceeds that of carbondioxide, concentrations of which are only 30%higher than in pre-industrial times. In fact,information is sufficient for the IPCC to assertthat the current methane concentration has notbeen exceeded in the last 420,000 years.1

21 Chapter 2: Climate science of methane
forcing of methane is 0.48 W/m2. It is importantto note that this is not the radiation absorbed bythe 1745 ppb methane in the atmosphere. Ratherit is the radiative forcing of the extra 1045 ppbmethane present in the atmosphere since 1750.Essentially the radiative forcing is the differencein rate of heat capture now versus then.
Table 5: Radiative forcing of selected greenhousegases
CO2 CH4 N2OPre-industrial concentration (ca. 1750) ppb 280,000 700 270Concentration in 1998 (ppb) 365,000 1745 314Relative concentration 1998/1750 1.30 2.49 1.16Radiative forcing (W/m2) 1.46 0.48 0.15Atmospheric lifetime (years) 5-200 12 114
Source: IPCC, 20011
From Table 5, it can be seen that carbon dioxide isthe most important greenhouse gas, with aradiative forcing of 1.46 W/m2. Methane is thesecond most important anthropogenicgreenhouse gas, contributing 20% to the totalradiative forcing, proportionally far greater thanexpected according to atmosphericconcentrations of the gases. The explanation liesin the considerable potency of methane as agreenhouse gas.
Global Warming PotentialThe different greenhouse gases vary in bothpotency and their lifetime within the atmosphere.On emission, different greenhouse gases havedifferent abilities to absorb radiation. However,the radiative forcing of the emitted gas decaysexponentially as the gas is removed from theatmosphere over time and the concentration
Ecosystems may not beable to adapt to a rapidrate of climate change
How much heat is being trapped?The amount of ‘extra’ energy being held withinthe earth’s atmosphere because of the rise inatmospheric GHG concentrations is termedradiative forcing, measured in units of watts permetre square (W/m2). Radiative forcing is thechange in radiation balance due to a change ingreenhouse gas concentrations over a quotedtimeframe. The total radiative forcing of the well-mixed greenhouse gases since pre-industrialtimes (1750) is 2.43 W/m2. Of this, the radiative

22 Chapter 2: Climate science of methane
decreases (Figure 7). The rate of this removal isdependent on the atmospheric lifetime of thespecies involved. It is therefore difficult todetermine an absolute measure of the relativeeffects of one tonne of each gas, because thesewill vary over time. In fact, it is impossible tocombine the two influences of potency andlifetime into a single definitive figure that reflectsthe properties of a greenhouse gas. However, it isuseful to have one single parameter that reflectsthe influence of different gases, especially undermulti-gas abatement schemes such as the KyotoProtocol and other emissions trading schemes.
The Global Warming Potential (GWP) is theparameter that has been adopted.
The GWP of a greenhouse gas is defined as“the [cumulative] radiative forcing from theinstantaneous release of 1 kg of a trace substancerelative to that of 1 kg of a reference gas”.1 Thereference gas is almost always carbon dioxide andso its GWP is always unity (Table 6). In visualterms, this is the relative area under the curves inFigure 7, up to a certain time limit. Short-livedgases such as methane have higher GWPs undershort time-horizons. Conversely, long-livedspecies such as SF6 have higher GWPs under longtime-horizons. Table 6 shows the Global WarmingPotential of the basket of six greenhouse gasesover three different timeframes.
The effect of different time horizons posesinteresting questions with regards to policy.Which value of GWP should be used to assess therelative importance of methane emissions versuscarbon dioxide? The Kyoto Protocol and other keypolicies use the 100-year time horizon, althoughthese are currently based on the old GWP formethane of 21 given in the IPCC’s SecondAssessment Report. This will be updated to 23 forthe second commitment period (2013-17). TheIPCC most frequently quotes the 100-year GWPs,although has made no policy recommendationsas to which GWP timescale to use.
Calculating CO2 equivalent emissionsIt proves useful to measure the potency ofgreenhouse gas emissions in one set of units:tonnes CO2 equivalents (t CO2e). To calculate theimpact of methane emissions, the mass emittedis multiplied by the 100-year GWP. One tonne ofmethane is deemed equivalent to 23 t CO2e.
It is also important to note that GWP isdefined in terms of mass of emitted gas, notvolume. Care must be taken if GHG emissions aremeasured as volumes – one litre of carbon dioxideweighs 2.75 times as much as one litre ofmethane. So one litre of methane is 8.4 times(23/2.75) as potent as one litre of carbon dioxide.
Figure 7: Radiative forcing of methane and carbon dioxide
Table 6: Global Warming Potentials for the greenhouse gas ‘basket’Global Warming Potential
Lifetime (time horizon in years)Gas (years) 20 years 100 years 500 years
CO2 5-200 1 1 1CH4 12 62 23 7N2O 114 275 296 156HFCs 0.3-260 40-9,400 12-12,000 4-10,000PFCs 2,600-50,000 3,900-8,000 5,700-11,900 8,900-18,000SF6 3,200 15,100 22,200 32,400
Source: adapted from Table 3, IPCC 20011

23 Chapter 2: Climate science of methane
The influence of lifetimeThe Global Atmospheric Lifetime of methane inthe atmosphere is defined as the atmosphericburden (concentration) divided by the sinkstrength (annual removal).
However, the chemistry of methane in theatmosphere contains several feedback loopsaffecting the concentration of other atmosphericspecies such as O3 and OH, which slows theremoval of GHGs (including methane itself) fromthe atmosphere. This feedback effect is includedin the Perturbation Lifetime, which is longer thanthe Global Atmospheric Lifetime and is equal to 12years. The Perturbation Lifetime is the standardfigure used.
For constant emissions, species with a shortlifetime do not reach such high atmosphericconcentrations because they can be removedmore rapidly from the atmosphere. If emissions
= = = 8.4 yearsGlobal AtmosphericLifetime of CH4
Atmospheric burden
Sink strength
4850 Mt
576 Mt
are stopped completely, as shown in Figure 8a, theatmospheric concentration of a short lifetime gaswill drop away much more rapidly than a gas witha long lifetime.
A sudden stop in emissions of a particular gasis an unlikely scenario, so Figure 8b looks at theeffect of gradually reducing emissions over aperiod of time. It can be seen that theconcentration of the short lifetime gas reaches itspeak earlier and also drops away more rapidlyafter this point. This means that policiestargeting short-lived gases, such as methane, willrapidly lead to tangible atmosphericconcentration reductions. Gases with a longerlifetime reach higher atmospheric concentrationsand experience a longer lag between emissionsreduction and atmospheric concentrationreductions. Reducing emissions of short-lifetimepotent gases such as methane is therefore avaluable means of rapidly slowing globaltemperature rise.
Figure 8: Effect of emissions cessation (a) and gradual reduction (b) on atmospheric concentration

24 Chapter 3: Methane emissions trading
One of the key issues in this report is whethermethane trading is a viable option for the UK.Market based trading schemes are currently apopular option for dealing with a range ofenvironmental issues. A consequence of thediverse and diffuse nature of methane sources isthat policies with the potential to address themitigation of methane emissions are similarlyvaried and tend to be focused within theindividual sectors (e.g. waste, agriculture, coalmines). Methane emissions trading offers thepossibility of a consolidated approach that couldapply across all sectors.
This chapter explains the concept of emissionstrading and looks at both the UK and EUEmissions Trading Schemes, before outlining theoptions for trading methane. This sets thecontext for the remaining chapters in which thevarious sources of methane are discussed in detailand the possibility of methane trading for eachsector is explored, amongst other policies for themitigation of methane emissions.
3.1 Emissions trading conceptEmissions trading is a mechanism for deliveringemissions reductions at minimum economic cost.It is a move away from the traditional ‘command-and-control’ regulatory approach to a market-based mechanism, directly involving thoseresponsible for the emissions and allowing thepolluters to decide their own emissionsabatement pathway. Trading is therefore seen asa highly attractive option by both corporationsand government and has become a central tenetof international policy to reduce greenhouse gasemissions, such as the Kyoto Protocol.
The UK has already implemented the firstindustry-wide trading system incorporatingcarbon dioxide, methane and other greenhousegases. The EU Emissions Trading Scheme starts in2005, although initially this will only cover carbondioxide. Opportunities to include methane in theEU ETS are under review, but it will be 2008 at theearliest before methane is included.
Historically, trading was first proposed as anenvironmental policy instrument in the 1960s.35, 36
Trading has become an increasingly popularmeasure over the last two decades, especially aspart of pollution reduction regimes in the USA. Inparticular, trading is credited with the significantreduction in emissions of sulphur dioxide (a majorsource of acid rain), although it has been arguedthat these reductions would have occurredanyway.37
As a policy tool, trading is well suited for GHGemissions control because the costs of reducingemissions vary widely between individualgreenhouse gases, sectors and countries,providing opportunities and large potential gainsfrom trade.38-40 The international carbon tradingmarket is expanding rapidly and more thandoubled in size in 2003 to 70 Mt CO2e.41
How does trading work?A traditional command-and-control approachimposes absolute performance or technologicalstandards on companies, but takes no account ofthe individual economic burden placed on thosecompanies.42 Such an approach is illustrated inFigure 9a, where the two plants face differentabatement costs for achieving the samereductions in emissions. In Figure 9b, underemissions trading, the market determines theprice of the commodity and the benefit to thecompany is determined by the differencebetween the abatement cost and market price.For instance, plant 1 gains £15 since it can reduceemissions by one tonne at a cost of £5 and thensell this credit on the market for £20. Instead ofplant 2 actually undertaking emissions reductionsand paying £30 per tonne, it can purchase a crediton the market for £20, thereby making a saving of£10 compared to the regulated approach. Hence,the overall cost of reducing two tonnes undertrading is just £10, instead of £35 under theregulated scenario shown in Figure 9a.
Trading therefore has the advantage ofenabling the most cost-effective implementationof the overall target, with cost benefits to all
Methane emissions trading

companies irrespective of their individualabatement costs. Furthermore, trading providesincentives to invest in environmentally soundtechnologies. Emissions trading is thus seen asthe “least bad of all options”43 in terms of policy.
The carbon trading market is merely amechanism for ensuring that baseline targets aremet and its success in achieving significantgreenhouse gas emissions reductions dependssimply on where the baseline is set. Emissionstrading combines buying and selling of emissionswith the right to emit GHGs, identified throughcompany or country specific allowances (alsoreferred to as quotas, permits or caps). The totalallowance of a regulated pollutant is determinedcentrally by government or international bodies.This baseline is reduced over time to achieve thedesired emissions reduction in the requiredtimeframe.
Allowances are distributed to entities, allowingmarket forces to control their price, and can beassigned in two ways: either through an auction,where allowances are sold on a market basis, orby ‘grandfathering’, where allowances areallocated on a discretionary basis, typically basedon the historical emissions of an entity. Ideally,the system should reward companies that havealready taken action to reduce emissions andpenalise those that have not; grandfathering
enables such flexibility. Within a classic ‘cap andtrade’ scheme, participants take on targetsrequiring them to reduce their emissions to acapped level, which may be more or less stringentthan the overall baseline reductions.
Trading emissions is no different from tradingother commodities. Once allocated or created,emissions allowances act as fully interchangeablecommodities and they can be bought, sold andtraded, or in some circumstances banked forfuture use. Account holders in a central registrycan buy and sell allowances and trade eitherbetween themselves or with third party brokers.Entities with low abatement costs (costs ofreducing emissions) or those that reduce theiremissions by more than their allocated amountcan sell their surplus (‘carbon credits’) to otherswho are not able to reach their target easily.42
Conversely, companies that exceed their limitscan choose to purchase allowances on the openmarket to match their emissions or invest inabatement technology, generally whichever ischeaper. The market price of allowances will riseif the overall baseline is not being achieved, sincedemand will increase, and fall if overachieved.Allowances can even be retired withoutcounterbalancing an actual emission therebymaking the adopted baseline stricter and creatingan additional environmental benefit.
25 Chapter 3: Methane emissions trading
Figure 9: Comparison of (a) regulated approach & (b) market trading approach

26 Chapter 3: Methane emissions trading
When trading methane that has beencombusted, either by flaring or to recover energy,the negative impact of emitting the combustionproduct carbon dioxide must also be accountedfor. Burning one tonne of methane (equivalent to21 tonnes of carbon dioxide) produces 2.75 tonnesof carbon dioxide. One tonne of combustedmethane is therefore equivalent to 18.25 tCO2e (21 - 2.75).
3.2 Emissions trading schemesInternational Emissions Trading is the majormechanism of the Kyoto Protocol but, with thedelay in ratification, other emissions tradingschemes have been developed, most notably theUK and EU Emissions Trading Schemes (UK ETSand EU ETS).
UK Emissions Trading SchemeThe UK ETS was launched in April 2002 as avoluntary scheme to run until December 2006.The aims of the UK ETS are two-fold: to delivercost-effective greenhouse gas emissionsreductions and to provide UK industry withpractical experience of emissions trading aheadof a European or international system. In thismanner, UK businesses should be well placed totake a leading and influential role in bothdevelopment and use of these wider schemes.The UK ETS was expected to deliver total savingsof 2-4 Mt CO2e by 2006 through encouraging fuelswitching in power generation, principally fromcoal to gas.
Both direct and indirect emissions are coveredin the UK scheme, meaning that emissionsassociated with both the generation and use of
energy are included. The scheme covers allindustrial sectors apart from power generators.Landfill sites, households and the transport sectorare all exempt.
The UK ETS is also unique in that it is a multi-gas trading system. Methane has been activelytraded as part of this scheme by participants suchas UK Coal, Shell and BP.44 Allowances are tradedin the ‘currency’ of carbon dioxide equivalents; theexchange rate for methane is simply the 100 yearGWP of 21.
Participation in the UK ETS takes three forms:direct participation, as a climate changeagreement (CCA) participant and as a tradingparticipant. All participants are committed to thescheme for its full duration.
Direct participants operate on a ‘cap and trade’basis and are required to make an absolutereduction in emissions against a 1998-2000baseline over the period 2002-06. If targets arenot achieved, penalties, and ultimately fines, areincurred. To encourage participation in thescheme, participants received incentive paymentsfrom the Government, set through a competitivebidding process. The UK Government committeda total of £215m incentive money (after tax),payable over five years (2002-6).45
A total of 34 companies were successful in theauction of the five-year allowances, which tookplace in February 2002. These include Ineos Fluor,Dupont, Shell, UK Coal and BP. Collectively thesecompanies have committed to reduce emissionsby around 4 MtCO2e/yr by December 2006. Atthe end of each year, organisations have a threemonth reconciliation period to compile theirverified emissions report. By the end of thisperiod they are required to demonstrate to theGovernment that they have sufficient allowancesto cover all of their emissions. The first yearresults show 31 out of 32 direct participants mettheir emissions reductions targets.45 Allparticipants trading methane are acting as directparticipants.
Climate change agreement participants arethose companies already covered by the Climate
The UK ETS coversemissions from both thegeneration and use ofenergy

27 Chapter 3: Methane emissions trading
Change Levy (CCL). These participants use theemission or energy targets previously set throughthe CCL agreement, which, if met, entitle them toan 80% discount on the levy. This form of trading,sometimes referred to as ‘baseline and credit’, isused to either help meet the target by purchasingallowances, or by selling any over-achievement. Ifthe target has been met and the over-achievement verified, allowances are given at theend of each compliance period. Targets for CCAparticipants are defined in terms of absoluteemissions reductions (tonnes CO2e) or relativetargets according to levels of output (tonnes CO2eper tonne product).
CCA participation covers 866 firms46 which areexpected to deliver additional emissionreductions of over twice that of direct entry ETSparticipants.47
Trading participants are companies, brokers orindividuals not subject to reduction targets whoopened trading accounts with the EmissionsTrading Registry, which they then use to buy orsell allowances. In the first year of trading therewere 35 active trading participants.46
A fourth option that has been considered inthe UK, but is not part of the current scheme, isparticipation through projects: the generation ofcredits from new emission reduction projects inthe UK. Under this route, projects are notassigned a baseline and therefore the emissionsreductions have to be quantified. The savingsmust also be additional (i.e. the reductions wouldnot have occurred without the project). The UKGovernment decided not to use this optionbecause of the risks associated with it in light ofthe EU’s proposal for linking Joint Implementation(JI) and Clean Development Mechanism (CDM)projects into the EU ETS.48
EU Emissions Trading SchemeThe EU ETS starts on 1 January 2005 and will bethe first multinational scheme in the world withemissions trading between Member States of theenlarged European Union.
The European scheme is mandatory and covers
only direct emissions. It is divided into twophases: an initial phase (2005-2007) and a mainphase (2008-2012) concurrent with the firstcommitment period under the Kyoto Protocol. Sixsectors are covered: energy activities (all plantsover 20 MW), oil refining, cement production, ironand steel manufacture, glass and ceramics, andpaper and pulp production. The first phase of thescheme will only cover carbon dioxide emissions,but this will be reviewed by the Commission in2006 and may be extended to other greenhousegases, including methane. Gases not coveredunder the Kyoto Protocol may still be eligible fortrading. Additional sectors will also beconsidered. The scheme may also be expanded topermit European companies to carry outemissions curbing projects around the world, asproposed by the European Commission in the‘Linking Directive’. This would convert creditsearned into emissions allowances in the samemanner that JI and CDM projects would workunder the Kyoto protocol.
Member states were required to develop anational allocation plan for emission permits tocompanies by March 2004. This grandfatheringprocess set targets for the relevant sectors anddelineated methods for division of allowances(each worth 1 tonne CO2) between participants ofthe respective Member States. The Directiveallows up to 5% of allowances to be auctioned in2005 and 10% after 2008. So far this process hasresulted in a great deal of controversy withcompanies disputing their allocations.
All installations must meet their targets byreducing emissions or by buying allowances.Installations without sufficient allowances tocover their emissions will pay a direct financialpenalty (40 € per tonne CO2 from 2005-7, 100 €per tonne thereafter) and have to make up thedeficit in subsequent commitment periods. Forinstallations that have a surplus of allowances,Member States can allow banking.
More than 12,000 installations – representingapproximately 46% of the EU’s total carbondioxide emissions – will participate in the scheme.

28 Chapter 3: Methane emissions trading
Market analysts predict that trading could beworth more than €7-8 billion a year by 2007,creating a brand new financial market.49
Although the scheme does not start until 2005,the first deals have been brokered already with upto 250,000 credits traded in just one day.50
Interaction of the UK and EU ETSThe UK and EU Emissions Trading Schemes differon a number of issues (Table 7), which essentiallymake the two systems incompatible. One of thekey differences lies in the trading arrangements:the EU scheme considers direct emissions only
Table 7: Comparison between the UK and EU Emissions Trading SchemesUK ETS EU ETS
Type of scheme • Voluntary • MandatoryPeriod • 1st period 2002-2006 • Phase 1 2005-2007
• No guarantee of 2nd period, • Phase 2: 2008-2012but review in 2005
GHGs • All six GHGs • Only CO2 in Phase 1• Other gases may be included in Phase 2,
provided adequate monitoring and reportingsystems are available and provided there is no damage to environmental integrity ordistortion to competition
Sectors • Indirect and direct emissions • Direct emissions (source) only(end-user) • Subset of IPPC sectors, excluding chemicals,
• All industrial sectors except food and drink and waste incinerationpower generators • Energy activities (all plants over 20 MW), oil
• Transport, landfill, households refining, cement production, iron and steel exempt manufacture, glass and ceramics, and paper
and pulp productionType of • Direct entrants (absolute targets) • Absolute targets for all participants targets • CCA participants (absolute or
relative targets)Market size • 34 direct entrants (~ 1 MtC- • More than 12000 installations (Phase 1)
reductions over 5 years) • 46% of EU carbon dioxide emissions• ~6000 CCA businesses (~ 2.5
MtC/year)Allocation • Financial incentive (auction) for • Member states decide allocation method.method direct entrants They have the option to auction up to 5% in
• Negotiated energy saving targets Phase 1 and 10% of allowances in Phase 2through CCAs • Commission retains the right of veto over
national allocation plansCompliance • Loss and repayment of financial • Penalty of 40 €/tonne.
incentive for direct participants • Increased to 100 €/tonne after 2008• Statutory penalties to be introduced• CCA participants have separate
compliance procedures

29 Chapter 3: Methane emissions trading
whereas the UK ETS incorporates emissions fromend-users as well. Now that the EU scheme hasbeen approved to start in 2005, it is highlyunlikely that the UK ETS will continue beyond itscurrent phase (2002-2006). The UK Governmenthas confirmed that there will be no transfer ofcredits between the two schemes.
Cessation of the UK ETS in 2006 will haveconsequences on the trading of methane sincemethane will not be included in the EU ETS until2008 at the earliest.
Methane tradingAlthough methane is already being tradedsuccessfully in the UK ETS, this is currently limitedto emissions from active coal mines and offshoregas, thereby excluding a large proportion of otheranthropogenic methane emissions. With thelikely closure of the UK ETS in 2006, even thisrestricted level of trading will cease. There is noguarantee that methane will be incorporated intothe EU ETS in 2008 and even if it is, there will stillbe a two year gap until methane trading ispossible again. This delay will act as a deterrent toinvestment in methane capturing technologies iftrading is the main incentive.
A separate methane market is not a viableoption in the UK because the market would betoo small to be liquid. For methane to be tradedit must be incorporated into a multi-gas tradingscheme.
If methane is included in the EU ETS from2008, there are two possible routes throughwhich methane could be introduced: through newinstallations or via the project entry route.
New installations. As part of the EU ETS reviewin 2006, new sectors beyond those specified inthe first phase will be considered for inclusion inthe scheme. This could open up methane tradingfrom sectors such as the gas industry.
Project entry route. New projects have thepotential to encourage emissions reductions, butonly if the emissions reduction obtained isadditional (i.e. they would not have occurred inthe absence of the project).51 Through the‘Linking Directive’, JI and CDM projects wouldpermit entities in industrialised countries todevelop greenhouse gas reducing projects.
However, because the EU ETS is focused onlarge emitters of carbon dioxide, small-scaleemitters in the methane sector, such as farmers,are unlikely to be able to participate withoutaggregation.
3.3 Review of the UK ETS The UK ETS has provided companies withexperience of trading and established a tradingsupport industry. However, there are someaspects of the scheme that were not whollysuccessful, providing valuable lessons indeveloping an effective emissions tradingscheme.
In the first year of the UK ETS, trading wentwell with over 32 million allowances allocated tocompanies. Selling activity was initiallydominated by a few direct participants.47 Thisforced the price of carbon up to a peak of £12.40/t CO2e in October 2002 (Figure 10). Asmore CCA companies had their emissions verifiedtowards the end of the year, they then had
Methane will not beincluded in the EU ETSuntil 2008 at the earliest
Figure 10: UK ETS carbon prices, 2002-4Source: DEFRA, 200455

30 Chapter 3: Methane emissions trading
emissions to offer to the market causing thebalance of selling activity to shift and the price toslump to £5/t CO2e.52 Such problems are partlydue to lack of liquidity in the UK market: themarket is highly skewed as a result of thestructure of the scheme, with very few playersand the sellers generally outweighing thebuyers.53, 54 Also, activity is dictated by CCAparticipants, who have provided much of thebuying activity so far,54 as most trading occurswhen they need to demonstrate compliance onceevery two years. Shorter compliance periodswould have ensured a more constant level oftrading. Shorter compliance periods would haveensured a more consistent level of trading.
However, the direct participants are largercompanies with lower abatement costs, and havesold to the CCA participants, who in general willhave higher abatement costs due to economies ofscale. In this sense, the scheme has beensuccessful in achieving emissions reductions atlowest cost.55
To date, approximately 2,000,000 allowances(1 allowance equals 1 tonne CO2e) have beentraded in the market, of which 580,000allowances were bought for CCA compliance.Some sophisticated direct participants (e.g. oilcompanies) have been active in both in buyingand selling, trading speculatively rather than asdirect participants. Activity in the UK ETS hasnow dropped since CCA companies do not have toprove compliance until February 2005 and sothere is no immediate incentive to purchaseallowances in the market. There is still a limitedamount of trading, with CCA companies buying atthe current low price to hedge against future risksof price increases and meeting CCA targets.Allowances purchased now can be banked andused towards later targets.
The market integrity and environmentaleffectiveness of the scheme was badly damageddue to an imbalance in allocation of allowancesamongst the direct participants.56, 57 Althoughthe achieved emissions reduction was over sixtimes greater than the direct participants’
collective target, the majority of savings camefrom just two companies, both of whoseemissions were expected to fall anyway throughregulatory requirements.56 In other words, DEFRAawarded a huge ‘hot air’ surplus andcompromised the integrity of the scheme, a factwhich they have acknowledged.55 The price ofcarbon had slid down to £1.75/t CO2e by August2003 as a result of oversupply from the directparticipants.58
Hence, although the UK ETS might havestimulated significant market activity, itseffectiveness in contributing to greenhouse gasemissions reduction targets is questionable.47
There is debate as to whether the scheme hasdelivered significant quantities of absoluteemission reductions with participating firmsreducing emissions further than would haveoccurred in the absence of the scheme.
3.4 ConclusionsReflecting on the experience of the UK ETS, it ispossible to identify some critical factors essentialfor effective emissions trading markets:• Commodity to trade. To state the obvious, for
trading to occur, there has to be a product orcommodity to trade. This must be of sufficientvolume and from enough individual sources toencourage liquidity. In practical terms, it mustbe possible to quantify the amount of gasrecovered, which can be done most easilythrough capture.
• A liquid market. Emissions trading schemesmust have sufficient supply and demand,supported by financial derivatives, if they are tofunction effectively.59 In traditional commoditytrading, markets are driven by supply anddemand and the incentive to make profits, but,in the case of emissions trading, the system isdriven by legislation which operates in a highlyuncertain environment. Trading markets workmore efficiently as their size increases. Themore liquid the market, the more quickly amarket price is established, offering greatercertainty to all market participants.

31 Chapter 3: Methane emissions trading
• Suitable mix of players. Markets do notfunction efficiently if there is disparity in thesize of players. Under the UK ETS, two largecompanies dominated the selling activity, setagainst the thousands of small CCAparticipants as buyers. For brokers, it is morecost efficient to trade large volumes ofcommodities than small volumes with manyplayers, as the transaction cost for the latterwill be high.54
• Additionality. It is a primary requirement of anytrading scheme that credits for reducingemissions must be additional to those requiredto fulfil other regulatory obligations such as theRenewables Obligation. This will avoid thedouble counting of emissions reductions (‘hotair’) that occurred in the UK ETS.56 This alsomeans that any new legislation will affect theviability of trading and, conversely, participationin a trading scheme makes legislating difficult.Governments are therefore faced with a choiceas to whether to legislate or allow trading. Thisis a particularly difficult decision with regardsto methane in the UK due to the two year gapbetween the UK ETS finishing and methanebeing introduced into the EU scheme.
• Monitoring, reporting and verification.Standards must be in place for setting baselinesand reporting and verifying emissions for anentity. High standards of monitoring, reporting,verification and compliance are crucial toguarantee the environmental integrity andfinancial credibility of any emissions tradingscheme.60, 61 A reliable baseline against whichsavings can be measured is crucial. This givescertainty to what is being exchanged, theobligations to be met and sanctions to beimposed (in the case of non-compliance).Accurate verification of emissions also helpsprevent incorporation of ‘hot air’ into thetrading system, which can lead to a fall inmarket price.
• Conflicting policies. It is important to identifywhether there are existing policies which mayconflict with the trading scheme and therebyaffect viability of the market. For instance, ifthe price of ROCs is higher than the marketprice for carbon, companies may choose not totrade and opt for ROCs instead.
Potential for methane tradingMethane trading has the potential to act as astrong incentive towards achieving significantreductions in methane emissions. However, notall methane produced in the UK will be eligiblefor trading: the diversity of methane sourcesmeans there is similar diversity in the feasibilityof trading amongst different methane generatingsectors. The criteria identified here will be used inthe following chapters to assess the potential formethane trading in each of these sectors.

32 Chapter 4: Methane in the UK
The UK is party to the UN Framework Conventionon Climate Change (UNFCCC), which came intoforce in 1994 and requires accurate reporting ofemissions. The UK is committed to reducinggreenhouse gas emissions to 12.5% below 1990levels by 2010. As a UNFCCC signatory, the UKmust monitor progress towards achieving thesetargets by compiling a UK inventory andpublishing an annual inventory report whichincludes a break down of emissions byanthropogenic source. The National AtmosphericEmissions Inventory62 provides detailed methaneemissions data from 1990, enabling major trendsand the relative contribution of different sourcesto be identified.
Reports have been published annually since1995, although it is important to note that figuresin these reports have been revised over time asmonitoring and modelling procedures have beenrefined and become more accurate. Emissionsdata for 1990 have therefore altered over thecourse of the inventory development and baselinelevels for Kyoto Protocol commitments have alsochanged.
4.1 UK methane sourcesIn 2002, 2.10 Mt of methane was emitted fromanthropogenic sources in the UK.63 Thisrepresents 6.9% of all UK GHG emissions. On aglobal scale, the UK is responsible forapproximately 0.7% of all anthropogenicemissions of methane, from approximately 1% ofthe world’s population.
The major sources of methane in the UK areagriculture, landfill waste, natural gas leakageand coal mining. Together these sources accountfor 95% of total anthropogenic emissions (Figure 11).
Agriculture is the dominant anthropogenicsource of methane, responsible for 0.91 Mt(CH4)of emissions in 2002. Of the total agriculturalemissions, around 90% is derived from thedigestive processes (enteric fermentation) inanimals, whilst the remainder is from animalwastes. The second largest anthropogenic sourceof methane in the UK is the anaerobicdecomposition of biodegradable waste in landfill,accounting for 0.46 Mt(CH4) of emissions.Leakage from natural gas distribution andemissions from active coal mines account for afurther 0.39 and 0.24 Mt(CH4) respectively.However, it is important to note that themethane seepage is from active coal mines only;emissions from old unused mines are notincluded in the inventory. Inclusion of abandonedcoal mines would add up to a further 0.3 Mt toUK methane emissions.64 Other measurablesources of methane include manufacturing,transport and waste water handling, accountingfor 0.10 Mt(CH4) per year.
4.2 Historical trendsHistorically, coal mines were the dominant sourceof methane in the UK. However, after the miners’strike in 1984, the coal mining industry declinedand emissions from active mines fell as thenumber of working pits decreased (Figure 12). By1990 landfill sites had become the primary source
Methane in the UK
Figure 11: UK sources of methane, 2002Source: Baggott, 200463
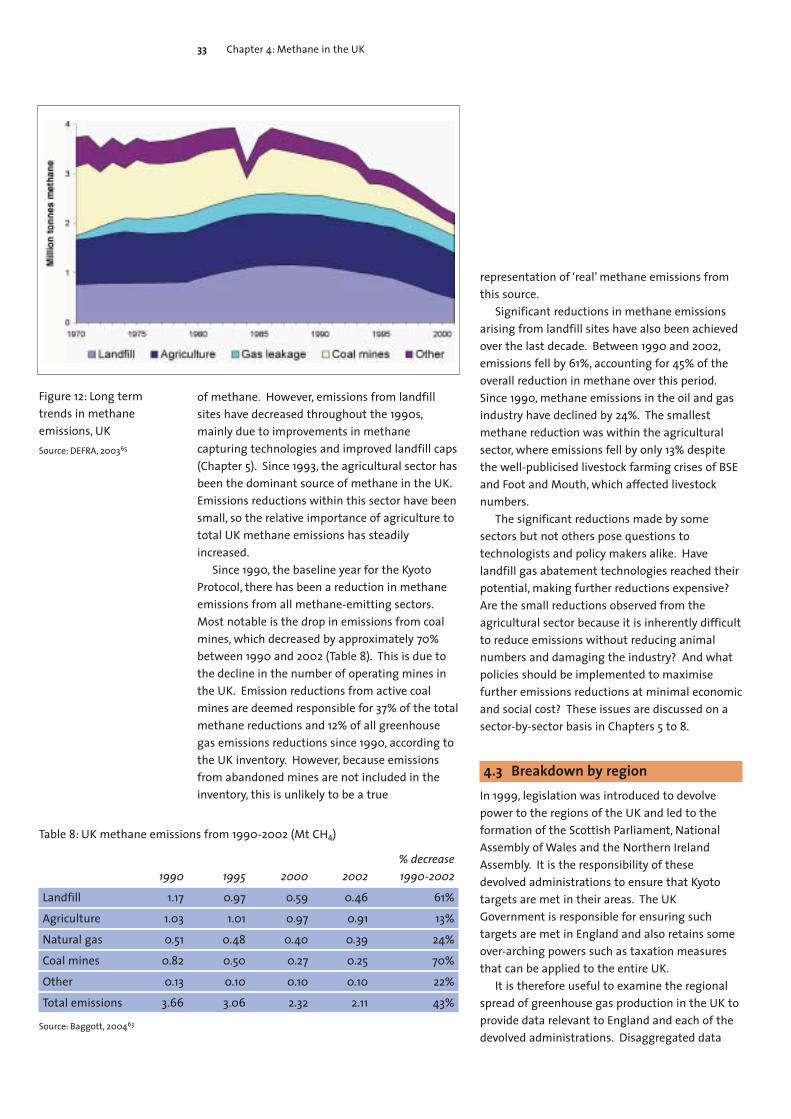
of methane. However, emissions from landfillsites have decreased throughout the 1990s,mainly due to improvements in methanecapturing technologies and improved landfill caps(Chapter 5). Since 1993, the agricultural sector hasbeen the dominant source of methane in the UK.Emissions reductions within this sector have beensmall, so the relative importance of agriculture tototal UK methane emissions has steadilyincreased.
Since 1990, the baseline year for the KyotoProtocol, there has been a reduction in methaneemissions from all methane-emitting sectors.Most notable is the drop in emissions from coalmines, which decreased by approximately 70%between 1990 and 2002 (Table 8). This is due tothe decline in the number of operating mines inthe UK. Emission reductions from active coalmines are deemed responsible for 37% of the totalmethane reductions and 12% of all greenhousegas emissions reductions since 1990, according tothe UK inventory. However, because emissionsfrom abandoned mines are not included in theinventory, this is unlikely to be a true
representation of ‘real’ methane emissions fromthis source.
Significant reductions in methane emissionsarising from landfill sites have also been achievedover the last decade. Between 1990 and 2002,emissions fell by 61%, accounting for 45% of theoverall reduction in methane over this period.Since 1990, methane emissions in the oil and gasindustry have declined by 24%. The smallestmethane reduction was within the agriculturalsector, where emissions fell by only 13% despitethe well-publicised livestock farming crises of BSEand Foot and Mouth, which affected livestocknumbers.
The significant reductions made by somesectors but not others pose questions totechnologists and policy makers alike. Havelandfill gas abatement technologies reached theirpotential, making further reductions expensive?Are the small reductions observed from theagricultural sector because it is inherently difficultto reduce emissions without reducing animalnumbers and damaging the industry? And whatpolicies should be implemented to maximisefurther emissions reductions at minimal economicand social cost? These issues are discussed on asector-by-sector basis in Chapters 5 to 8.
4.3 Breakdown by regionIn 1999, legislation was introduced to devolvepower to the regions of the UK and led to theformation of the Scottish Parliament, NationalAssembly of Wales and the Northern IrelandAssembly. It is the responsibility of thesedevolved administrations to ensure that Kyototargets are met in their areas. The UKGovernment is responsible for ensuring suchtargets are met in England and also retains someover-arching powers such as taxation measuresthat can be applied to the entire UK.
It is therefore useful to examine the regionalspread of greenhouse gas production in the UK toprovide data relevant to England and each of thedevolved administrations. Disaggregated data
33 Chapter 4: Methane in the UK
Figure 12: Long termtrends in methaneemissions, UKSource: DEFRA, 200365
Table 8: UK methane emissions from 1990-2002 (Mt CH4)
% decrease1990 1995 2000 2002 1990-2002
Landfill 1.17 0.97 0.59 0.46 61%Agriculture 1.03 1.01 0.97 0.91 13%Natural gas 0.51 0.48 0.40 0.39 24%Coal mines 0.82 0.50 0.27 0.25 70%Other 0.13 0.10 0.10 0.10 22%Total emissions 3.66 3.06 2.32 2.11 43%
Source: Baggott, 200463

34 Chapter 4: Methane in the UK
exist for the four home nations for 1990, 1995 and1998 to 200066 (Table 9).
Table 9: Regional breakdown of methane andtotal GHG generation, UK, 2000
All greenhouse Methane (%) gases (%)
England 71.5 73.6Scotland 11.6 10.9Wales 8.6 8.0Northern Ireland 5.9 3.2Unallocated 2.4 4.2
Source: Salway, 200366
The regional production of methane follows thesame trends as total GHG emissions, as might beexpected from simple farm area and populationarguments. A regional breakdown by sourcepresents a different picture, with agriculturebeing more predominant, and landfill lessimportant, in the more sparsely populatednations with their mainly rural economy. Oil andgas emissions are concentrated in the moreindustrial nations, and coal emissions only fromthose nations with active coal mines (Figure 13).
4.4 Data uncertaintiesWhilst the general trends in methane emissionsdata are widely accepted, there is less confidencesurrounding the exact figures presented. The IPCCreports this to be a generic problem, hinderingefforts to provide quantitative projections offuture methane emissions.1
Since the UK’s first submission to the UNFCCCin 1997, the emissions inventory has undergonesubstantial revision (including the 1990 baselinefigure). A number of studies were commissionedwith the aim of quantifying methane emissionsmore accurately. In particular, estimates forlandfill emissions have been reduced significantlyand figures for gas pipeline leakage have beenincreased. Despite these efforts, the uncertaintylevel for methane emissions data is ±14%overall,63 and higher for individual sources.Variations in emissions estimates from landfill are±48% and for gas pipe leakage between 17 and75%, depending on the type of gas main andservice. In the agricultural sector, animalnumbers are accurately known (±1%), but theemission per animal error is estimated at ±20%.Similarly, the emission factor for coal mines ispredicted with an uncertainty of ±13%.
Further revisions can be expected in the future,as methodologies for quantifying methaneemissions are refined and uncertainty levelsreduced. In addition, there are severaloutstanding issues to be addressed, such as theinclusion of abandoned coal mines, which maysubstantially affect emission totals.
The high levels of data uncertainty are a causefor concern, as it is becomes difficult to quantifyemissions reductions. Furthermore,contradictions between the models on whichUNFCCC submissions are based and real-worldexperience are possible. This is particularlyimportant for methane trading, where baselinesare set to produce overall GHG emissionsreduction targets. Should a project be able tocapture more methane than its targets becausethe targets set are found to be based onFigure 13: Methane emissions by source and region, 2000
Source: Salway, 200366

35 Chapter 4: Methane in the UK
inaccurate or uncertain data? If so, then thatproject will be financially rewarded for what iseffectively ‘hot air’. The presence of ‘hot air’ intrading systems can cause a collapse of thetrading price and ruin the effectiveness of such ascheme for all participants, as discussed in
Chapter 3. It is clear that if significant andsustained reductions in GHGs are to be achievedthrough trading then the accuracy of emissionsquantification will need to improve across allsectors. This should be made a major focus ofgreenhouse gas abatement policy.
4.5 UK greenhouse gas emissions Carbon dioxide makes up the majority of GHGemissions, although production has declined overthe past 12 years by 8% largely due to the ‘dashfor gas’: switching to cleaner natural gascombustion (for electricity generation) from themore polluting oil and coal. This has resulted in acleaner energy supply, but there are signs thatcarbon dioxide emissions are now rising againdue to increased energy consumption. Incontrast, methane and nitrous oxide emissionshave both declined by approximately 40% in thesame period. This has resulted in an overalldecrease in emissions from the basket of sixgreenhouse gases of 15% (Table 10).
Since the Kyoto base year of 1990, UK methaneemissions have fallen by 1.57 Mt from 3.67 Mt to2.09 Mt, equivalent to 33.0 Mt CO2e. This is a dropof 43%, accounting for 30% of GHG emissionsreductions since 1990, which dwarfs the 8%emission reductions of carbon dioxide over thesame time period. Other greenhouse gases (N2O,HFCs and PFCs) have achieved similarly highemissions reductions.
The reduction in methane emissions has beena major contributor to meeting targets as laid outby the Kyoto Protocol. However, because almosthalf of the reduction in methane emissions is dueto the closure of coal mines and non-inclusion ofemissions from abandoned mines, the ‘real’reductions achieved may not be as significant asthe UNFCCC submissions portray. This picture willchange substantially once a methodology for theinclusion of emissions from abandoned coalmines is agreed and included.
So far, the UK is one of the few Annex I nationsto have reduced greenhouse gas emissions over
Table 10: UK GHG emissions 1990-2002 (Mt CO2e)
CO2 CH4 N2O HFCs PFCs SF6 Total % CH4
1990 584.0 76.9 67.9 11.4 1.4 1.1 742.6 10%1995 547.6 64.3 57.0 15.5 0.5 1.3 686.1 9%2000 542.6 48.8 44.8 9.1 0.5 1.9 647.7 8%2002 537.4 44.1 41.0 10.4 0.4 1.6 634.9 7%Decrease 1990-2002 8% 43% 40% 33% 16% –23% 15% 30%
Note: 1 Mt CO2e = 21 Mt CH4
Source: Baggott, 200463
Coal accounts for morethan a third of UKelectricity generation

36 Chapter 4: Methane in the UK
the 1990 baseline (Figure 14). A 13% reduction in200067 slipped to a 12% reduction in 2001.68
Emissions in 2002 did, however, show a maximumobserved reduction of 15%,63 but are predicted torise again in 2003 because of an increase in coalburning in power stations as opposed to gas, dueto relative market prices. This has provokedconsiderable debate as to whether or notemissions reductions will be maintained in thelong term and, in particular, whether the UK willmeet its Kyoto commitment.
The basis for this scepticism lies in the mannerin which emission reductions have been achievedto date. In particular, the majority of emissionreductions witnessed over the last decade are notthe result of targeted policy. Rather, carbondioxide emissions were inadvertently cut by aneconomically-driven shift in the energy resourcebase, away from a coal intensive industry towardsgas-fired and nuclear power. However, such goodfortune is unlikely to continue indefinitely: theplanned decommissioning of nuclear powerstations, along with forecast economic growthand increases in road traffic, are expected toincrease carbon dioxide emissions over theforthcoming decades. The UK Governmentmaintain that the Kyoto target will be met, withbaseline projections showing emissions to bearound 15% below 1990 levels in 2010.69 Further
policy measures were introduced in the ThirdNational Communication11 which, if successfullyimplemented could increase the reduction to 23%by 2010.
However, there is mounting evidence that theUK’s efforts to meet the greenhouse gas targetare “slipping off track”. In any case, DEFRA confessto having long-term concerns regarding UK’sgreenhouse gas emission trajectory. Baselineprojections point to a rise in emissions in thepost-2010 period, which by 2020 could leave theUK in breach of current and future rounds ofKyoto commitments.69 With the stringent targetsset in the 2003 Energy White Paper, the UK hasreinforced its commitment to tackling climatechange.
The recent increases in GHG emissions due tocarbon dioxide need to be addressed by increasedenergy efficiency, an increase in renewableelectricity and reducing consumption from thetransport sector. However, due to its high GWP,further reductions in methane emissions stillhave a significant role to play in meeting shortterm targets, such as those agreed under theKyoto Protocol, and may buy time for carbondioxide abatement and renewable energytechnologies to be developed.
Figure 14: UK greenhousegas emissions, 1990-2002Source: Baggott, 200463

37 Chapter 5: Waste and landfill
Waste in the UK is big business: the UK servicesmarket for waste management is valued at about£5bn, with the potential to grow to at least £12bnover the next 10 years.70 This market, whichcomprises approximately 0.5% of the UK GDP,involves an estimated 3500 firms.71 Each year,over 400 Mt of waste is produced in the UKalone,65, 70, 72 most of which ends up in landfillsites. By far the majority of this waste (~370 Mt)arises from agriculture, the mining and quarryingindustry, and the construction and demolitionindustry73, 74 (Figure 15). Landfill sites account for22% of UK methane emissions (0.46 Mt).
In terms of methane production, the criticalfactor is the amount of biodegradable waste sentto landfill sites. Municipal waste (fromhouseholds and small businesses), although onlya small proportion of total waste production,comprises the most biodegradable matter andtherefore generates the most methane. Bothagricultural waste (Chapter 6) and sewage sludgecan be highly biodegradable. Sewage sludge isnot considered here since it represents less than1% of total waste generated. The other wastestreams contain only a minute fraction ofbiodegradable material. Therefore the main focusof this chapter is municipal waste.
The generation of methane from
biodegradable waste in landfill is the mostcomplex of all the sectors explored in this report.The quantities of methane arising depend on thequalities and quantities of waste and the wastedisposal methods chosen. The proportion ofmethane captured, rather than emitted to theatmosphere, is dependent on the landfill captechnology employed. Furthermore, any methanecaptured may be burned to generate heat orelectricity. In the latter case, the methane countsas a renewable energy resource and is eligible forvaluable Renewable Obligation Certificates. Thechallenge is to find the optimum balancebetween environmentally benign waste disposalpractices, renewable energy generation andminimising GHG emissions to the atmosphere.This poses a host of challenges at the waste-energy-climate change interface.
5.1 Methane from landfillThe production of methane in landfill is a resultof the restricted availability of oxygen during thedecomposition of organic waste. Many modernlandfill management practices aimed atimproving safety and environmental control haveparadoxically accentuated the generation ofmethane by restricting airflow to the site.Improving aeration can reduce methaneproduction, as has been successfully practised inJapan, although this process is energy intensive.Also, the introduction of air into landfill creates anexplosion hazard, if oxygen concentrations are toohigh, and a greater risk of fire due to the highertemperatures reached by aerobic decompositionprocesses.75
The amount of methane emitted to theatmosphere depends almost entirely on thedesign and management of the landfill and thequantity of biodegradable waste entering thelandfill. Unchecked, the landfill gas will migratethrough the site in response to gradients ofpressure or gas concentration, or simply alongpaths of least resistance. The gas may migratethrough the waste (depending on itspermeability) or through cracks and fissures in
Waste and landfill
Figure 15: Estimated annual waste by sector (by mass)Source: DEFRA, 200365

38 Chapter 5: Waste and landfill
the compacted waste or bedrock material. In theabsence of obstacles, such as impermeable linersalong the landfill perimeter, the gas can travelconsiderable distances from the boundary of asite, for example, along buried utility installationrouteways (i.e. pipes for water, gas or sewage, orchannels for electricity and telecommunicationscables). Similarly, the propensity for migration tothe atmosphere depends largely on thepermeability of the landfill cover. Sand and gravelcaps will do little to impede vertical migration ofthe gas, whilst more impermeable silts and clayscan successfully restrict this movement. However,any weaknesses within the capping layer will bereadily exploited.
In a modern, well-engineered landfill,deposited waste is mechanically compacted toeliminate voids and then sealed with a low-permeability capping layer, usually clay. Thisprocess restricts the availability of oxygen withinthe site, so that, once capped, the majority ofwaste decomposition is carried out anaerobically.The resultant landfill gas typically consists of
between 40 to 60% methane (by volume) withthe remainder being mainly carbon dioxide and ahost of trace constituents. The actualcomposition of landfill gas is dependent upon anumber of factors, most importantly thedegradable organic carbon content of the wasteand the speed at which the material degrades.The composition also changes over time asbiochemical conditions alter during the process ofdecay.
Laboratory studies have identified five mainstages in the process of waste decomposition andthe process is relatively well understood76 (Table11). Methane production is variable over these fivephases and, even within the methanogenic phase,production of methane depends upon the mix ofeasily digestible biodegradable material versusharder to digest materials such as wood. Somecarbon based materials will not decompose andwill remain in the landfill. It has been estimatedthat 6.6 Mt of the 18.6 Mt of carbon going tolandfill remains and is sequestered there.32
Because the emissions of methane are so
Table 11: Methane formation in landfill
Phases Description Time GasesPhase 1 Aerobic phase where easily degradable organic matter is decomposed in the Days to a CO2 increasesInitial adjustment presence of oxygen (from air trapped in landfill), resulting in CO2 generation. month O2 & N2 decreasePhase 2 Oxygen is depleted and anaerobic conditions begin to develop. CO2 is 2 weeks or N2 & O2 decreaseTransition phase produced as complex organic compounds undergo hydrolysis and acid more CO2, H2 & H2S
fermentation. increasePhase 3 Hydrolysis converts organic matter to intermediate compounds, including 3 months CH4 produced.Acid phase acetic acid and volatile fatty acids. Acids accumulate in leachate. or more H2 & CO2 reach
Methanogenesis begins. maximumconcentration
Phase 4 Hydrolysis continues and methanogens proliferate. Methanogens convert May be as CH4 production Methanogenesis acids, H2 and CO2 into methane. For slowly biodegradable organic compounds long as 30 increases
(e.g. cellulose from paper and wood) this process continues for many years. years H2 & CO2
decrease Phase 5 Readily available biodegradable material has been converted to methane and Decades CH4 & CO2
Maturation phase carbon dioxide, and emissions decrease. Air diffuses back into landfill. decreaseN2 & O2 increase
Source: Ong, 200376

39 Chapter 5: Waste and landfill
variable over time, it is exceptionally difficult topredict how much methane is produced bylandfill. Whilst it is easy to measure the quantityof gas captured, estimating the amount ofmethane lost to the atmosphere through the capis much more difficult, as it is impossible topredict accurately how much methane isgenerated. Furthermore, the quantity of methaneescaping to the atmosphere is not simply thedifference between production and capture; somemethane may be oxidised in the capping layerthrough contact with low-affinitymethanotrophic bacteria, particularly close to thesurface of the site. Such contact can reducemethane content through oxidation to formcarbon dioxide, although the importance of thisin reducing overall emissions is unclear.77
5.2 Landfill in the UKThe current dominance of landfill in the UK is aresult of economics, geography and advances inconstruction and maintenance. Due to thehydrology and geology of England and Wales, thisoption is more economically favoured as a wastedisposal option compared to elsewhere in
Northern Europe.78-80
Over the last six years, the amount of wastesent to landfill has stayed roughly constant,whilst recycling or composting has more thandoubled (Figure 16). Around 75% (34 Mt) ofmunicipal waste is sent to landfill each year bythe devolved administrations, with the remainderincinerated, recycled or composted. This isestimated to contain more than 21 Mt ofbiodegradable matter, based on the assumptionthat between 60 to 70% of municipal waste isbiodegradable.81-85
There is uncertainty around the exact numberof landfill sites in the UK, estimated to be around1500156. In England and Wales there were 2,300working landfill sites in 2003, a fall from about3,400 in 1994, although newer sites are larger. Itis estimated that the total area of land taken forlandfill sites is about 28,000 hectares – almost0.2% of the land area of England and Wales.
Landfill policyThe primary focus of waste policy in both the UKand EU has been on waste reduction rather thanspecifically targeted at methane. The main policyin the UK to date with regards to landfill has beenthe Landfill Tax, which centred on diverting wasteaway from landfill. Whilst such policy hasinfluenced methane emissions to a certain extent,a more coherent and focused approachaddressing methane emissions abatementdirectly is likely to be more effective in this area.The EU Landfill Directive represents a move in thisdirection, supported by the IPPC Directive (seebelow).
The waste management hierarchy (Table 12) isa central feature of European waste policy and, assuch, has been adopted by the UK. This approachprioritises elimination and prevention of wasteover minimisation, re-use, recycling, recovery,treatment and disposal. Moving up the hierarchyleads to more sustainable methods of wastemanagement and increases the possibilities forreducing methane production. The hierarchy has,however, been criticised for not necessarily
Figure 16: Disposal methods of municipal waste, England, 1996-2003Source: DEFRA, 200486
Year

40 Chapter 5: Waste and landfill
reflecting what is best for the environment.87
Certainly the relative merits of landfill andincineration, with and without energy recovery,are unclear.
Current waste management practices withinthe UK, with heavy reliance on landfill, areweighted towards the bottom of the hierarchy;generally the least environmentally friendly butmost cost-effective and easiest wastemanagement options for the local authority.
It is difficult to deliver waste strategies thatfocus on the top levels of the waste hierarchy.Successful implementation of such policiesrequires large-scale social change; manythousands of people each altering their personalwaste disposal habits to a more environmentallybenign method. Whilst some will be enthusiasticabout such issues, achieving a widespreadconversion is an uphill battle requiring resourcesand education.
UK Landfill TaxThe Landfill Tax was introduced in the UK inOctober 1996 and is levied on disposal of waste tolandfill, with very limited exemptions, operatingon the ‘polluter pays’ principle.88 It intends topromote diversion of waste from landfill throughincreasing the economic viability of sustainable
waste practices, such as re-use, recycling andcomposting, by imposing a tax on landfill waste.
Landfill operators are liable for the tax on allconsignments of waste accepted for landfilldisposal. In practice, the costs are passed throughthe waste management chain and the landfilloperator pays the levy to Customs & Excise.Introductory tax rates were set in 1996 at £7 pertonne of active waste (mainly biodegradablewaste), and £2 per tonne of inactive waste. TheLandfill Tax ‘escalator’ was announced in the 1999Budget. This raised the standard rate to £10 pertonne and included a commitment to increase itby £1 per tonne each year to £15 per tonne by2004-0579 and by at least £3 per tonne each yearthereafter, towards a rate of £35 per tonne in themedium to long-term.89
Has the Landfill Tax been effective?To date, there is still confusion over the effect ofthe Landfill Tax: the reduction in waste going tolandfill has not been documented and there is noquantification of the amount of waste diverted.What is available is a measure of the amount oftax raised and fiscal contributions through theLandfill Tax credit scheme, which offsets wastegoing to landfill via investment in sustainablewaste projects. In 2001/2, over £500M of LandfillTax was generated, net of the contribution to thecredit scheme,90 representing almost a five-foldincrease since introduction. However, despite thetax, there has been a rise in the amount of wastesent to landfill over the same period: in England,municipal waste increased from 20.6 milliontonnes in 1996/97 to 22.1 million tonnes in2000/01.91 This puts into question the realeffectiveness of the Landfill Tax as a policyinstrument.
In 2000, the DETR97 claimed the tax wasalready having a “notable impact” on wastemanagement practices and a consultationpaper98 stated that the tax “is alreadyencouraging some waste minimisation, re-useand recycling”. On the contrary, a review of the UKLandfill Tax in 2002, commissioned by DEFRA,
Table 12: The waste hierarchy and options for dealing with biodegradable matter
Level What this means for biodegradable waste ResponsibilityReduce Home composting
Less packaging IndividualsLower consumption
Re-use Reusable packagingRecycle Recycle paper and cardboard wastesRecovery Obtain maximum energy from waste
Combustion of methane from anaerobicdigesters Local government
Incineration with energy recoveryCombustion of methane from landfill
Treatment Incineration without energy recoveryDisposal Landfill

41 Chapter 5: Waste and landfill
suggests that the tax plays a limited role inencouraging people to recycle and compost and is“largely irrelevant” in helping the UK achieve thetargets set out by the Landfill Directive.92 Theineffectiveness of the tax to stimulate changes inbehaviour has been attributed to its low level.93-96
The EU Landfill DirectiveThe EU Landfill Directive 1999/31/EC, which wasadopted into UK domestic legislation in 2002, isthe most explicit policy addressing the reductionof methane generated by landfill. It takes a dualapproach, aiming to decrease reliance on landfillas a method of biodegradable waste disposalcoupled with requirements to install best-practicemethane recovery technologies. The Directivemakes it clear that landfill is the least preferredmethod of waste disposal, with an emphasis onmoving up the waste management hierarchytowards reuse, recovery and recycling.Compulsory installation of gas collection anddisposal systems is stipulated, with emphasis onenergy recovery at new landfill sites. TheDirective also prohibits disposal of liquid wastes,tyres and clinical wastes to landfill anddistinguishes between hazardous and non-hazardous landfill.
The long-term objective of the LandfillDirective is to reduce methane emissions at
source by diverting biodegradable waste awayfrom landfill. The Directive provides a series oftargets that require reductions in the amount ofbiodegradable municipal waste sent to landfill.These targets have been agreed by the UKGovernment and Welsh National Assembly,although, since the UK is heavily reliant on landfillto dispose of its waste, it has been given an extrafour years by the EU to meet the requirements ofthe Directive.82 This means that the UK isrequired to reduce the amount of biodegradablewaste to landfill to:99
• 75% of that produced in 1995 by 2010;• 50%, by 2013;• 35%, by 2020.
For the UK, this equates to a maximum of 13.1, 8.7and 6.1 million tonnes of municipal biodegradablewaste to landfill in 2010, 2013 and 2020respectively.82 These dates include the four yearextension, which the UK is to adopt for the firsttwo target years with the decision still to bemade on the final target year.100
IPPC DirectiveThe European Integrated Pollution Prevention andControl (IPPC) Directive 96/61/EC provides furthersupport for the reduction of methane emissionsfrom landfill. The IPPC Directive wasimplemented in England, Wales and Scotlandthrough the Pollution Prevention and Control Act(PPC) in 2000. Industrial activities subject tocontrol under the PPC regime include certainwaste management operations. The PPCdemands that operators show they havesystematically developed plans to apply the bestavailable technology to prevent pollution or,where that is not practical, to reduce it to anacceptable level.
5.3 Methane captureUnder the EU Landfill Directive, from 2002, allnew landfill sites are required to capture themethane produced, with energy recovery being
Municipal waste hasincreased in quantity byapproximately 3% perannum since 1996/7 –faster than thecorresponding increase inGDP

42 Chapter 5: Waste and landfill
the preferred option. A recent study has foundthat the largest factor in the mitigation ofmethane from landfill is through methanecapture, rather than diversion or recycling, due tothe quantities of waste already in landfill sites.154
Historically, control of methane at landfill siteswas driven by safety concerns, rather than activeGHG emission control, due to the flammablenature of the gas. The most basic systems merelyattempt to control the movement of the gas, withthe aim of avoiding lateral migration, therebyavoiding the risk of fire and explosion at nearbyfacilities. Such systems comprise impermeableliners and a capping layer (usually clay), oftencoupled with trenches or wells, which provideconvenient ‘vents’ through which gas can escapeto the atmosphere.
Technologies have become increasinglysophisticated over the past two decades. Inparticular, the integrity of impermeable liners andcapping layers has been vastly improved andthese are now considered a fundamentalcomponent of landfill design. Improved landfillcaps on new sites are the main driver behind the61% reduction in methane emissions from landfillbetween 1990 and 2002 (Table 8). Additionally, avariety of systems have been developed whichnot only control, but also capture, landfill gas.These more advanced gas control systems operateusing a network of pipes, wells, fans and/orvacuums to provide a favourable migration routeto a common end point. Once collected, the gascan be disposed of by flaring or recovered for itsenergy value – it is a valuable fuel which hasadded value due to its classification as arenewable energy source under the RenewablesObligation and so any electricity generated iseligible for ROCs. It is estimated that around 63%of landfill gas is currently flared or utilised – thisis forecast to rise to 72% in 2005.155
FlaringFlaring involves the collection of gas into achimney, where it is ignited in order to oxidisemethane to carbon dioxide prior to emission.
Flares are the simplest technology for theprevention of methane emissions to theatmosphere and are of two types: ‘open flame’and ‘enclosed flame’. In an ‘open flame’ flare, thegas is simply combusted on top of a flame burner,with oxygen coming from the atmosphere. Suchcombustion is largely uncontrollable and willresult in sub-optimal oxidation of the methaneand therefore emission to the atmosphere.Conversely, in an ‘enclosed flame’ flare, the gas iscombusted in a chamber with both landfill gasand airflow controlled to ensure optimumefficiency (in excess of 99%) of methanecombustion.26
All flares require a minimum concentration ofmethane to operate. Stable ignition requires amethane content of between 30 and 60%,although special flare designs can accept lowermethane concentrations of 5-15%.75 Methaneconcentrations may be too low for the flare in theearly and late stages of a landfill’s lifecycle, andalso possibly at intermediate times due tovariable gas production rates over time. Undersuch circumstances, the flare can be primed withnatural gas or propane, although the GHGconsequences of this are not ideal.75
Energy recoveryEnergy recovery is the conversion of waste toproduce useful heat or electricity. The methanecontent of landfill gas makes energy recovery adesirable option. One tonne of biodegradablewaste is thought to produce between 200 and500 cubic metres of landfill gas with a calorificvalue of up to 20 MJ per m3 (5.5 kWh/m3).101-103
In order to exploit this resource effectively, asite must fulfil a number of requirements. Inparticular, a site must generate a sufficientquantity of landfill gas to make methanecombustion economically viable, which meanscurrent projects are restricted to sites in receipt ofrelatively large quantities of biodegradable waste.The methane content of the gas must berelatively high (at least 40%) and also consistent,as fluctuations in methane concentrations can

43 Chapter 5: Waste and landfill
cause severe operational problems. In order toavoid large variations in methane concentrations,collected gas must be closely monitored andadjustments made accordingly. For example,over-pumping could introduce air into the landfillsite, reducing methane production. It is possibleto optimise a site for landfill gas utilisation, sincefactors such as landfill temperature, moisturecontent and pH can have a large impact on therate of landfill gas generation and composition.Development of techniques such as recirculationof landfill leachate also have the potential toincrease rates of waste decomposition and gasgeneration.77 If successfully implemented, suchdevelopments will improve the viability of landfillgas utilisation and may, in particular, improve theprospects for projects on smaller sites.
Landfill gas is considered a renewable energyresource104 and therefore displaces greenhousegas emissions from energy derived from fossilfuels. There are three main methods of utilisinglandfill gas for its energy value: direct use,electricity generation and purification. A fourthoption, the use of fuel cells, is still a relatively newand expensive technology, but may become moreviable in the future.
Direct useThe direct use of landfill gas as a fuel (to generateheat) is the most efficient energy recovery option,utilising over 80% of the calorific value of themethane. Piping the gas over long distances hasproven problematic and costly, therefore the gasis most commonly piped directly to a local heat-intensive industry, such as fuelling kilns, boilers orfurnaces. However, since landfill sites aretypically located away from population centresdue to the unaesthetic nature of waste disposal,they are rarely located near such industrial sites.
This practice has worked best if the producer ofthe landfill gas is also the user, so that supply anddemand are closely matched.
Electricity production Landfill gas can be combusted to drive engines orturbines for electricity generation. Fuelconversion efficiencies typically range from 26%(for gas turbines) to 42% (for dual-fuel engines),which are comparable to conventional gas-firedpower stations. Production capacity varies from afew kilowatts (kW) to several megawatts (MW).75
The electricity generated can then either be useddirectly or sold to the grid.
Since the 1980s, the landfill gas technology forelectricity generation has evolved dramaticallyand the necessary equipment is now readilyavailable on the market. Landfill gas can also beused to generate combined heat and power(CHP), although this requires a use for the heatclose to the landfill site itself.
In 2003, landfill gas generated about 3.27 TWhof electricity,105 equivalent to 24% of renewableelectricity production in the UK and 1% of net UKgeneration. Landfill gas is by far the largest singlesource of new renewable electricity (i.e. excludinglarge hydro plants) – by contrast, all the windfarms in the UK generated just 1.3 TWh.
Purification to natural gas qualityLandfill gas can be cleaned to pipeline quality(100% methane) and fed into the natural gasdistribution network. This process involvesremoving the carbon dioxide and tracecontaminants from the landfill gas. The highfixed costs of refining equipment and therelatively low value of natural gas have precludedthe widespread uptake of this technology.
Fuel cellsA fuel cell is a device which converts a fuelfeedstock, usually hydrogen, directly into electricalenergy. Fuel cells that operate at hightemperatures, namely ‘solid oxide fuel cells’ and‘molten carbonate fuel cells’, can utilise methanedirectly.
One million tonnes oflandfill waste will beadequate to generate1MW of electricity for 10years

44 Chapter 5: Waste and landfill
Fuel cells rely on expensive catalysts tofunction, so the feedstock entering the fuel cellmust be free of impurities to prevent poisoning ofthe catalyst. The purity required, in terms ofremoving the trace elements, is even higher thannatural gas quality, which provides an additionalexpense. However, fuel cells can operate at lowmethane concentrations so carbon dioxideremoval is not a requirement for successfuloperation.
Fuel cells are currently expensive and only afew pilot projects exist for converting landfill gasto electricity. However, they do offer somesignificant advantages over other technologies.The efficiency of fuel cells is currently around 40%,which is higher than conventional heat engines.Furthermore, nitrogen from air does not react in afuel cell, whereas it does in combustion devices, sonitrogen oxides are not emitted. Fuel cells are alsoa modular technology and so the size of the fuelcell array can be adjusted to suit the output of thelandfill over time: as methane emissions decline,fuel cells can simply be removed so that theremaining stack is better matched to the supply ofmethane. The removed fuels cells can then beredeployed at other landfill sites.
Encouraging capture Both flaring and energy recovery reap substantialgreenhouse gas emission savings by oxidisingmethane and releasing only carbon dioxide. It isestimated that 1.7 Mt of methane was abated in2000, forecast to rise to 2.47 Mt in 2005.155 Thedegree of savings depends largely on theefficiency of the gas collection system. No systemhas yet been developed which completely inhibitsthe release of landfill gas to the atmosphere. In amodern landfill with a comprehensive gascollection system, an average of 85% of the gaswill be collected,25 whilst the remaining methanewill migrate through the capping layer where 90%will be oxidised by methanotrophic bacteria enroute.26 So, at a minimum, methane emissionsfrom new landfill will be just 2% of totalgenerated methane.
Emissions from pre-1996 sites (prior toimplementation of 1994 regulations) have beenshown to be negligible.156 However, since landfillsites generate significant methane for 15 to 20years,106 post-96 sites which have been closedbecause they do not meet the regulations mayrepresent an important source of methaneemissions. The extent of this issue is unclear:data on the number of landfill sites are uncertain,as are data on methane emissions from thesesites. It is difficult to establish a firm baseline foremissions from this sector since methaneconcentration decreases over time due to naturalprocesses.
In 2002, only 211 landfill sites in the UKextracted landfill gas for energy recovery107 – avery small proportion, given that there are 2300working landfill sites in England and Wales alone.The main incentive for methane capture in the UKhas been through ROCs under the RenewablesObligation, which has improved cost-effectivenessof landfill gas electricity production. As of June2002, landfill gas utilisation contracts had beenawarded to around 10% of licensed sites in theUK, of which around 60% (201 of 329) wereoperational108 (Table 13).
Table 13: Contracts under Renewables Obligation,December 2001
Capacity (MWe)Projects Projects
awarded liveEngland and Wales 653.4 384.6Scotland 40.0 16.6Northern Ireland 6.3 0Total 699.7 401.2
Source: DUKES, 2003105
Further growth is expected in the foreseeablefuture, encouraged by the Landfill Directive, sincethe resource potential is far from maximised. Infact, the DTI estimates the UK landfill gasresource to be equivalent to around 6.75 TWh peryear, over twice the generation in 2003 of 3.27

45 Chapter 5: Waste and landfill
TWh, and representing around 2% of presentelectricity demand.8
5.4 Alternatives to landfillIn order to comply with the Landfill Directive, incombination with best-practice methane recovery,alternative waste disposal methods are necessaryto reduce reliance on landfill. In effect, this meansprogressing up the waste hierarchy towards moresustainable waste management options.
UK Waste StrategyThe targets under the Landfill Directive pose atough challenge for the UK, exacerbated by thecurrent 3% annual growth in municipal waste.70
Reducing the amount of biodegradable wastedisposed to landfill will require considerableeffort by the entire UK waste management chain,including central and local government, wasteproducers and the general public. Consequently,the UK Government’s Waste Strategy 200097 hasbeen developed in accordance with the principlesof the waste hierarchy and wider sustainability,with a strong presumption against sending wasteto landfill.
Under the Strategy, the Government hasestablished a number of other targets to
complement those for biodegradable wastereduction. In particular, the following targetshave been established for the recovery of valuefrom municipal waste, via recycling, compostingand other forms of material and energy recovery:• to recover value from 40% of municipal waste
by 2005;• 45%, by 2010;• 67%, by 2015.
Recycling and compostingIn addition to diverting biodegradable waste fromlandfill, both recycling and composting enablevalue to be reclaimed from the waste. Of thebiodegradable component, paper, wood and sometextiles can be recycled successfully, with theresultant materials used in a range of products.Food, garden waste and cardboard can all becomposted, with the residue forming a valuableorganic fertiliser.
Neither recycling nor composting avoidgreenhouse gas emissions. However, if managedwell, both options offer significant advantagesover landfill. Whilst recycling demands asignificant energy input, the associatedgreenhouse gas emissions are relatively low whencompared to those offset from both theproduction of virgin materials and disposal ofmaterials to landfill. Recycling is also pivotal toresource conservation.
Composting is a largely aerobic process,meaning that the major by-product of wastedecomposition is carbon dioxide. The majority ofthe carbon remains within the compost, hencegiving it high value as an organic fertiliser.However, the process must be well managed, withthe compost well mixed and regularly turned toensure sufficient aeration, else methane can begenerated under anaerobic conditions.Composting has the advantage of being feasibleon a local level, for individual households, or ascommunity compost schemes. Large scale,centralised composting systems tend to bemechanised, although the sophistication of thesystem can vary markedly. Highly complex
The UK has a target torecycle and compost atleast 33% of householdwaste by 2015

46 Chapter 5: Waste and landfill
systems may have the capacity for up to 100,000tonnes of organic waste per year.109
Both composting and recycling depend uponseparation of the waste. At the household levelthis may require significant education of thepublic, whereas on larger scales, labour is requiredto perform an often unpleasant task. However,mechanical biological separation schemes (seebelow) may offer a viable alternative that doesnot require separation of the waste stream.
Current situationRecycling rates in the UK are currently amongstthe lowest in Europe at 9%,97 although they areincreasing. Large scale waste composting isgrowing at an exponential rate and doubled insize in the two years to 2002.110 Individualhouseholds have practised small-scalecomposting for many years and the UKGovernment is encouraging this on a wider scale.
Under the UK Waste Strategy, there isparticular emphasis on improving recycling ratesin the UK. These efforts have included a focus onproducer responsibility, particularly with regard topaper and packaging waste. Regulations havebeen introduced which specify targets for therecovery and recycling of packaging waste.111 Thisis supported by the 1994 EU Packaging Directive,which aims to pass the responsibility forpackaging waste onto the producer thusproviding an incentive to minimise such waste.
The Government has also been working withthe Newspaper Publishers Association to increase
the recycled content of newspapers, which hadincreased from 28% in 1991 to approximately 54%in 1999. Targets were introduced to increase thisto 60% by 2001, 65% by 2003 and 70% by 2006.The 2001 and 2003 targets were both met aheadof schedule.112 The Government is also workingwith the Direct Marketing Association and othertrade bodies to reduce the quantity of junk mail,which had more than doubled between 1990 and1999, from 1.5 to 3.3 billion junk items per year.
Energy from waste Energy from waste (or incineration) is seen as akey technology for diverting waste away fromlandfill sites and is widely used throughoutEurope. It is a well-developed technology, cost-effective and makes use of the calorific value ofthe waste material.
Energy from waste does not require theseparation of waste prior to treatment and, onceburned, the original volume of the waste istypically reduced by around 70%.26 The inert ashresidue is suitable for landfill and in some casesmay be recycled (e.g. for road surfacing). Energycan also be recovered from the incinerationprocess for district heating or electricityproduction. Interestingly, electricity generatedfrom incinerating mixed (biodegradable and non-biodegradable) waste is not eligible for ROCs,whereas energy generated from landfill methanefrom the same initial waste feedstock is eligible113
(Table 14). However, electricity from wasteincineration is exempt from the Climate ChangeLevy.
The combustion of waste in incinerators doesnot produce any methane, since carbon dioxide isthe main by-product of any efficient combustionsystem. There has been concern about emissionsto the atmosphere of heavy metals and dioxinsfrom municipal solid waste incinerators.114, 115 Theintroduction of the Waste Incineration Directive2000/76/EC alleviates this concern as it setsstringent operating conditions and minimumtechnical requirements for waste incineration andco-incineration. The Directive is aimed at
Table 14: Financial incentives for electricity generation from waste streams
Technology Useful output RO eligible? CCL eligible?Landfill CH4 Yes YesEnergy from waste Heat No YesPyrolysis Oils, hydrocarbons, Biodegradable Yes
CH4 fraction onlyGasification CH4, H2 Biodegradable Yes
fraction onlyAnaerobic digestion CH4 Yes Yes

47 Chapter 5: Waste and landfill
preventing and limiting negative environmentaleffects of emissions into air, soil, surface andground-water from the incineration and co-incineration of waste, and the resulting risks tohuman health.
Current situationMore than 9% of UK municipal waste is dealtwith by incineration.116 Energy from wastetechnologies are almost always used – just 0.3%of waste is incinerated without energy recoveryand this value is falling. The UK incinerates asmaller proportion of its municipal wastecompared to other European countries, such asDenmark (52%) and France (24%).117
However, despite the introduction of tighteremissions controls, incineration is still sociallyunpopular in the UK, with incineration schemesattracting widespread opposition, especially at acommunity level. This makes promotion ofincineration schemes a politically sensitive issue.
In addition, since any electricity generated is noteligible for ROCs there is less financial incentiveto invest in this technology.
Advanced thermal treatmentEnergy from waste is simply combustion of thewaste in an excess of oxygen, which generatesheat that may be used for electricity generation.However, advanced thermal treatment methodshave been developed that also allow value to berecovered from the calorific value of wastematerials. Advanced thermal treatment plantsare of two types – pyrolysis and gasification –depending on the availability of oxygen andtemperatures reached. Pyrolysis heats the wasteto approximately 500ºC in the absence of air andmay be considered analogous to the formation ofcharcoal. This process produces oils and gaswhich may then be used as fuels in their ownright. Gasification is a higher temperatureprocess (1000-1200ºC) which partially combusts
Pyrolysis plants are foundin Europe but are not yetwidespread in the UK

48 Chapter 5: Waste and landfill
the waste in the presence of some oxygen. Thisproduces hydrogen and gaseous hydrocarbonswhich may then be combusted as a fuel.
Unlike energy from waste, advanced thermaltreatment plants do require the separation ofwaste prior to entering the plant. Recyclablematerials such as glass and metals are removedbefore entering the plant. Post treatment, theflue gases are scrubbed to remove particulatesand higher hydrocarbons before using the gasesas fuel. Advanced thermal treatment plants arecomparatively small as they deal with onlyspecialised sections of the waste stream. Theycan also act as a modular component for a largerwaste plant, such as mechanical biological sortingplants.
Electricity generated from by-products of theadvanced thermal treatment of waste is eligiblefor ROCs. However, only the fraction generatedfrom biodegradable waste is eligible, so thefinancial returns will be dependent of thecomposition of the waste entering the plant113
(Table 14).
Current situationThere are currently no demonstrated advancedthermal treatment facilities in the UK other thanon a pilot scale.154
Anaerobic digestionFully-optimised anaerobic decomposition ofwaste is possible using purpose-built anaerobicdigesters in a process known as biogasification. Awide range of biodegradable waste can be treatedin this way, including wastes that are unsuitablefor composting, such as meat and cooked food.Typically, biodegradable waste is separated fromother material before digestion, either manuallyor mechanically, although newer mechanicalbiological separation plants can avoid thisrequirement.
Anaerobic digesters can reduce the time ittakes for waste to fully degrade from a fewdecades to a few weeks, hence maximising theproduction of methane over a shortened time
period.26 Because anaerobic digesters areenclosed systems, more methane can berecovered, enhancing the efficiency of the systemand allowing maximum value to be recoveredfrom the waste stream. The use of anaerobicdigesters also yields a more regular and sustainedsupply of gas compared to landfill. Between 10and 50% more methane is produced per tonne ofwaste (depending on waste composition anddigester design) than if sent to landfill, yetemissions are typically 1% or less.26 The gate feescharged for taking the waste are the keyeconomic driver behind this technology. Thebiogas may be burned as a fuel and is eligible forROCs, providing an additional financial driver forinvestment (Table 14).113 Greater efficiency alsomeans that large areas are not required, althougha sizeable industrial-style plant must be built. Inaddition to the valuable methane, the processalso produces a solid digestate, which can be usedto improve soil quality, and a nutrient rich liquidresidue, which can also be applied as a fertiliser.
Current situationIn contrast to countries like Denmark, which usesanaerobic digestion to treat about 1.1 Mt of wasteper year, this method is less common for wastedisposal in the UK.118 Sewage sludge andagricultural wastes have been treated byanaerobic digestion for several years, but theprocess is now slowly extending to municipalsolid waste with a small number of plants inoperation, each of which can handleapproximately 260-300 tonnes of waste peryear.118 Encouragement to invest in such schemesalready exists in the form of the waste gate feesand ROCs.113 However, as a relatively unproventechnology in the UK, additional support throughgrants or subsides may be necessary to stimulatethe market.
Mechanical biological separation schemesSeveral commercial mechanical biologicalseparation schemes have been developed in theUK to recover value from all parts of the waste

49 Chapter 5: Waste and landfill
stream. In each case, the initial stage is to shredthe municipal waste into small pieces. Biffa’sintegrated waste management process separatesthe biodegradable waste at this stage and sendsit to an anaerobic digester. Conversely, Shanks’Intelligent Transfer Station passes all waste intoan aerobic digestion chamber, which rapidlydegrades biodegradable waste. Value is recoveredfrom the rapidly biodegradable component in theform of methane and then energy. The wastematerial from both systems is dry, clean andsterile and can be sorted into componentmaterials, with ferrous and glass materialsrecovered for recycling. Approximately 50% of thewaste material, mainly cardboard and plastic, isonly slowly biodegradable and is not removed bythe digestion process. This material has a highcalorific value and can be used as a secondary fuelin fossil fuel combustion plants capable of co-firing, where it counts as a renewable energyresource (as far as the UK’s 10% target isconcerned) and is exempt from the ClimateChange Levy. Renewable Obligation Certificatescan also be obtained if the plastic portion of thefuel is not too high.119
Current situationAs with anaerobic digesters, there are only a fewof these schemes currently in operation in the UK.Gate fees and ROCs could provide the incentivefor further investment in this area. This methodof waste disposal is highly flexible and will beable to cope with the changing wastecomposition over the next 20 years.
5.5 Recommendations
Data uncertaintiesLandfill sites are a major source of methaneemissions, with significant methane generatedfor at least 15 to 20 years at any one site.However, there is uncertainty as to the extent ofthis problem due to lack of data on the exactnumber of landfill sites in the UK and associated
methane emissions. Although it is impossible topredict how much methane is actually producedwithin a landfill site, the quantity of gas capturedis easy to measure.
A comprehensive inventory of UK landfill sites,both working and closed, detailing the type ofcapping layer and other methane capturingtechnologies installed and amount of gascaptured, is needed. This is particularly importantfor older and closed sites which are unlikely toutilise modern technologies and so couldrepresent a significant source of emissions.
PolicyFor maximum savings in this area, there needs tobe a stronger policy focus on methane mitigation,as in the EU Landfill Directive, rather than relyingsolely on achieving emissions reductionsindirectly through waste reduction policy.
Methane captureThe energy content of waste should be recoveredwherever possible. Encouraging and supportingthe installation of suitable methane recoverytechnologies is central to the Landfill Directive.The crucial issue is how this will be implementedin practice. The Renewables Obligation has beena key driver in encouraging energy recovery frommethane in the UK by providing an economicincentive to capture as much of the generatedmethane as possible, relying on market-basedmechanisms. This could be underpinned by theprovision of grants or subsidies by theGovernment to encourage the uptake of best-practice technologies.
Lower production volumes of methane fromlandfill in future years (assuming the Directive issuccessful) would open up the way for newlandfill gas technologies capable of operating atlower concentrations, such as fuel cells, providedthere are sufficient economic incentives to attractinvestment. Grants or subsidies from theGovernment would encourage the developmentof such technologies.

Alternatives to landfillIf biodegradable waste is to be diverted fromlandfill, as required by the Directive, support mustbe given to viable alternatives (withoutassociated methane emissions) for the disposal ofthis waste. Given the political sensitivities aroundincinerators in the UK and the lack of a strongfinancial incentive in the form of ROCs,incineration looks to be a less politically favouredmethod of waste disposal. Anaerobic digestersand mechanical biological separation schemesappear to be more attractive options, with thewaste gate fees and eligibility for ROCs providingeconomic drivers for investment. As with themethane capturing technologies, the introductionof these schemes could be further encouragedthrough the provision of grants or subsidies.
Waste reductionWaste reduction still has an important role inreducing methane emissions. The problem here is
not really the lack of relevant policies but merelya problem in implementation of existing policies.The UK Government’s primary concern,particularly for municipal waste, is to move up thewaste management hierarchy towards wasteavoidance and minimisation. This requires actionby manufacturers, to reduce packaging, and localcouncils, working with their residents to achievewidespread changes in lifestyles and attitudes.
Conflict with the Renewables ObligationIn the UK, the Renewables Obligation is one ofthe key drivers behind investment in methanerecovery technologies through the provision ofROCs. However, the Landfill Directive also aims toreduce the amount of biodegradable waste sentto landfill. This will result in less methane beingproduced and so the financial rewards fromgenerating electricity from landfill gas will belower. Hence, there is a danger that the incentiveprovided by ROCs to introduce best-practice
Anaerobic digestion ofwaste generates electricitywithout any methaneemissions
50 Chapter 5: Waste and landfill

51 Chapter 5: Waste and landfill
capturing and electricity generating technology atlandfill sites will be lessened and other incentivesmay be needed in the future. However, there willbe a significant delay before the impacts ofbiodegradable waste reduction are felt, sincecurrent landfill sites will continue to producemethane for tens of years.
TradingTwo possibilities exist for trading in the wastesector: trading the actual waste itself and tradingof methane emissions from landfill.
Trading of wasteThe opportunity of trading waste is currentlyunder consideration in the UK. The system ofbiodegradable waste trading is a system,underpinned by the Waste and Emissions TradingBill, which would enable waste disposalauthorities to meet the objectives of the LandfillDirective and thus reduce methane emissions atminimum cost. Operating on a system oftradable allowances, those authorities thatexceed their allowances by sending lessbiodegradable waste to landfill will be able tradethe excess allowances with those that sendmore.120 Such a policy tool will certainly helpmeet the targets set out by other waste policiessuch as the Landfill Directive.
Methane trading In terms of trading, the possibilities from landfillsites are limited since methane capture is alreadyrequired at all sites for safety reasons, with best-practice technology specified for new sites underthe Landfill Directive. None of the methanesavings would be ‘additional’ and are thereforenot tradable. Similarly, diversion of waste fromlandfill to reduce methane emissions is not aviable route into the trading process either as thisis also required under the Directive. Poor cappingtechnology at older landfill sites may result inhigher methane emissions and so any furtherreductions would count as additional. However,there is no easy way to capture the methane that
leaks out through the cap – retrofits are notpossible. Even if there were methane available totrade, because the market price of ROCs iscurrently higher than that of methane, obtainingROCs would be the preferable option, thusremoving the incentive to trade.

52 Chapter 6: Agriculture
Agriculture is responsible for 43% of methaneemissions (0.91 Mt) making it the largestmethane-emitting sector in the UK.63 Emissionsarise entirely from the livestock sector, almost90% of which are a direct result of the digestiveprocesses in livestock mammals121 (entericfermentation). The remaining 10% arises frommanure management practices which promoteanaerobic decomposition of waste. Non-livestockagriculture is not a measurable source ofmethane in the UK.
Emissions from the agricultural sector aredeclining slowly, being 13% lower in 2002 than1990. This is not so pronounced as emissionsreductions achieved by other sectors. As aconsequence, the relative importance of methaneemissions from agriculture has grown. Policymeasures will be required to achieve substantialcuts in emissions, but implementing such policiesis a major challenge.
The UK livestock industry has suffered greatlyin recent years, with both the BSE (bovinespongiform encephalopathy) and Foot and Mouthcrises damaging consumer confidence andprofitability of farms. The UK farming industry isregarded by the public as a vital component of
the UK economy, so any policy measuresintroduced must reflect this and not penalise analready strained industry. Furthermore, there ispublic mistrust of the effects of agri-technologiesand large scale agri-business, as exemplified byBSE, Foot and Mouth, and genetic engineering.Any mitigation measures actively promoted bythe Government should reflect these concerns.
6.1 How is methane produced?Methane emissions from the agricultural sectorderive from two sources: enteric fermentation andmanure management practices (Table 15).
Enteric fermentationMethane is produced as a result of the naturaldigestive processes in ruminant mammals (thosethat chew the cud), such as cattle and sheep.Unlike humans and other non-ruminantmammals, ruminants are unable to digest theirfeed entirely, particularly cellulose-based plantpolymers, by the action of stomach enzymesalone. Instead, ruminants have an expanded gut(the retrulo-rumen) in which feed is broken downby bacteria and ferments prior to gastricdigestion. In an adult ruminant, the rumencomprises approximately 85% of the stomachcapacity and typically contains digesta equivalentto around 10-20% of the animal’s weight.26, 123
Food is retained in the rumen for aconsiderable period of time where, in thepresence of a large and diverse microbialpopulation, it is anaerobically fermented to formvolatile fatty acids, ammonia, carbon dioxide,methane, cell material and heat (Figure 17). Thebalance of these products varies between animalsand with dietary intake, being largely determinedby the composition and activity rates of micro-organisms present in the rumen. The gaseouswaste products are mainly removed by theprocess of eructation (burping) or eliminated aspart of the respiration process.124 Less than 10% isemitted as flatus (farts).
Agriculture
Table 15: Methane produced by enteric fermentation and manure management(kg methane per head per year)
Animal Enteric fermentation Manure managementDairy cows 115 13Beef 48 6Other cattle > 1yr 48 6Other cattle < 1yr 33 6Pigs 1.5 3Sheep 8 0.2Lambs < 1 yr 3.2 0.1Goats 5 0.1Horses 18 1.4Poultry Not estimated 0.1Deer 10 0.3
Source: National Atmospheric Emissions Inventory, 2004122

Figure 17: Enteric fermentation in ruminantmammals
Non-ruminant mammals do produce somemethane as a result of digestive processes, but atfar lower rates. For example, pseudo-ruminants(such as horses) do not have a rumen, yet fermentfeed during the digestive process to enable themto obtain essential nutrients from plant material.Mono-gastric animals (such as pigs) also producesmall quantities of methane during digestion.
Manure managementModern manure management systems tend torestrict the availability of oxygen to the waste,promoting the production of methane. Anaerobicmanure management is associated with intensiveagriculture, particularly dairies and pig farmswhere large numbers of animals are containedwithin a single, relatively confined facility. Thehigh density of animals leads to the production oflarge quantities of waste, which is typicallywashed out into tanks, lagoons or pits where it isstored as a liquid or ‘slurry’. Being liquid, air isexcluded and waste decomposition takes placeunder predominantly anaerobic conditions,resulting in the production of methane.
The amount of waste produced is dependentupon the number and types of animals, alongwith the quantity and quality of food consumed.
The precise amount of methane produced fromany given animal waste is dependent upon anumber of factors, most notably the quantity andcomposition of the waste, which, in turn isdependent upon the type of animal and feedingpractices. Ambient climatic conditions are alsoimportant. Increased temperature promotesbiological activity, thereby enhancing methaneproduction.
Emissions from livestock are a diffuse source andas such are not easily captured or quantified.Therefore mitigation strategies for this sectorfocus on reducing production at source. Methaneproduction from animals is dependent on anumber of factors, represented simply as:
Total emissions = Number of animals x Lifetime of animal
x Emissions per head per day
The overall emissions may be reduced by alteringany of the above parameters: reducing livestocknumbers, reducing the emissions per animal, orachieving the same product yields over a shorterlifetime. There is a range of management andtechnological options available, some of whichwill alter more than one of these parameters atonce.
Methane from animals is a waste product,representing a loss of dietary energy available tothe animal of 2-12%. As such, the production ofmethane both directly from enteric fermentationand from the decomposition of organic animalwaste, is a reflection of the inefficiency of thedigestive process. Consequently, methaneemissions can be reduced through productivityimprovements, which also offer potential cost-benefits to the agricultural sector. Increasedproductivity can be achieved through increasingthe yield of meat or milk from an animal over thesame lifetime, or attaining the same yields in a
53 Chapter 6: Agriculture
6.2 Mitigating emissions from livestock

54 Chapter 6: Agriculture
shorter lifetime. Both have the effect of reducingthe overall methane production per mass ofproduct. This requires nutritional adjustments,such as changes in diet and use of feedsupplements, or genetic modifications. Theseoptions are discussed in more detail below.However, the applicability of these techniques inpractice is limited by a number of factors, namely:risks to human health; consumer acceptability;animal welfare issues (particularly risks to animalhealth and development); ethical considerations;and cost effectiveness.
Dietary adjustments Improved nutrition and dietary adjustment inorder to optimise rumen and animal efficiency isa growing area of interest in terms of bothenvironmental and productivity benefits.Methane emissions depend on the average dailyfeed intake and efficiency with which feed energyis converted into product (meat, milk). This inturn depends upon the efficiency of rumenfermentation and the quality of the feed.Improvements to the quality of animal feedstuff,particularly in terms of digestibility and energyvalue, or improvements to rumen efficiencyprovide two potential routes to methanereductions.
Feed qualityFeed conversion efficiency – the rate at whichfeed energy is converted into product rather thanwaste – is higher for certain types of feed. Forexample, grain feeds are converted moreefficiently than forages (grass), as they arerelatively easy to digest and have a high energycontent.
Rumen efficiency Efficient digestion requires a diet that containsessential nutrients for the fermentative micro-organisms. If nutrients such as ammonia,sulphate and phosphate are limited, digestiveefficiency will diminish, resulting in increasedemissions of methane. Nutritional supplements
can therefore be used to enhance dietarynutrition. In some cases this has resulted inincreased milk yields of 20-30% and increasedgrowth rate of 80-200%,26 with typical methanereductions of up to 40% per unit output. Thelargest gains from nutritional supplementationare likely to be amongst animals on low qualityfeeds: in tropical areas with chronic feedconstraints, supplements can result in emissionreductions of up to 75%. In the UK, whereruminants have relatively high quality diets, thispotential is more limited. Nevertheless, a numberof advanced supplements, in the form of chemicaland pharmaceutical additives, have beendeveloped which have the potential to deliverfurther efficiency or productivity improvements.This may not prove a popular option given thegrowing consumer backlash against the use ofchemical additives in recent years and a numberof such substances have already been prohibitedfrom use in the EU and elsewhere.
The extent to which dietary adjustments andsupplements could achieve methane reductionsin practice is largely dependent on the real andperceived risks to human and animal welfare,along with the economic cost.
Genetic improvementsSelective breeding can result in significantimprovements to the genetic characteristics ofruminants, such as digestive efficiency andproductivity, although developments have beenhindered by associated problems with fertility,lameness, mastitis and metabolic disorders.26
Arguably, greater scope exists with improvementsto reproductive efficiency, which couldsignificantly reduce the large numbers of animalswhich typically comprise a reproductive herd. TheUNFCCC (fact sheet 271) reports that pilot projectsin India have achieved increased birth rates as aresult of improved feeding practices: the intervalbetween births was reduced by almost half, from24 months to 12-15 months. There have also beensuggestions that genetic engineering couldachieve methane reductions from ruminants by

55 Chapter 6: Agriculture
increasing fermentation efficiency throughadjustments to rumen micro-organisms.
However, there remains strong publicresistance to genetic engineering in the food-chain due to both ethical objections and scientificuncertainty regarding associated risks and knock-on effects.
Reducing livestock numbersFewer animals will result in a reduction inmethane emissions from both entericfermentation and manure management.However, this is a highly contentious andpolitically troublesome option, especially after theBSE and Foot and Mouth crises have strained theUK livestock farming industry. Attempts to forcea reduction in livestock numbers are unlikely tobe successful; in New Zealand, proposals tointroduce a tax on livestock to reduce emissionsproved so unpopular the measure waswithdrawn. Any drop in numbers would alsoneed to be matched by a corresponding drop inconsumer demand for meat and animal products,otherwise production and methane emissions willmerely be displaced to other countries.
There are signs of a shift in consumerpreferences with a change in demand for meatand animal products. Within the UK, as well as anumber of other European countries and the USA,there has been a noticeable move away from redmeat towards poultry, along with a growingvegetarian movement and support for organicproduce. Whilst this has been greeted
optimistically by some in terms of the widerimplications for sustainability, including potentialgreenhouse gas emissions reductions, the truebenefits remain unclear. In particular, the stabilityof this trend, the wider implications for theeconomy and agricultural sector, and the complexknock-on effects for the environment andsustainability are uncertain. Because of therelative emissions factors (Table 15), minimisingconsumption of dairy products is more significantthan minimising meat consumption, in terms ofgreenhouse gas emissions. However, this wouldbe a difficult area to legislate.
Organic farming requires lower livestockdensities through tighter controls on animalwelfare standards. An individual farm turningorganic would therefore have to reduce stocknumbers to comply with these standards, butwould retain income due to the premium paid byconsumers for organic produce. However, thismay not reduce livestock numbers across thewhole agricultural sector if other farmers increasetheir herds in order to supply the same level ofconsumer demand for meat and milk.
Therefore, neither enforced reductions inagricultural production levels or consumerdemand are considered to be realistic or viableroutes to long-term methane emission reduction.
Reductions in methane emissions from manuredecomposition can be achieved simply bymodifying waste management practices. Severalwaste management techniques are availablewhich favour aerobic decomposition.
Dry depositionThe ‘dry deposition’ (land application) of waste isa widely practised, relatively low-tech option,which enables value to be recovered from wasteas a fertiliser. In order to minimise anyopportunity for anaerobic decomposition, themanure needs to be spread as soon as possible
There is widespreadopposition to geneticengineering in the foodchain
6.3 Mitigating emissions from manuremanagement

56 Chapter 6: Agriculture
following production and collection. The IPCCreport that, for the average EU climate, dailyspreading of manure results in the release of 0.1to 0.5% of the manure’s methane potentialcompared to 10 to 35% from conventional manuremanagement practices.26 However, landspreading of waste is not without problems. Inparticular, this practice is associated withrelatively large ammonia and nitrous oxideemissions and risks eutrophication of nearbylakes and rivers from nutrient-rich run-off.
CompostingComposting offers another low-tech option formanaging manure. Liquid waste can be dried,making the waste suitable for composting. Ifnecessary, other dry organic material can beadded to the waste. However, for air penetrationto be maximised, and therefore anaerobicdecomposition minimised, the compost must beregularly turned.
In the case of both dry deposition andcomposting, the complex organic compoundswithin animal waste are broken down naturallyby bacteria, releasing carbon dioxide. This is partof the natural carbon cycle, the carbon dioxidebeing originally absorbed by the plants used aslivestock feed during photosynthesis. However,both techniques are likely to require energy input(for the mechanised processes) and therefore anyassociated greenhouse gas emissions should bededucted from the total methane savings. Theseoptions may not be appropriate because theyboth require a certain amount of space; methaneemissions from manure management aregenerally associated with intensive farmingfacilities dealing with large quantities of wastewithin a confined area.
Aeration of liquid wasteA more practical way of reducing methaneproduction may be through the aeration of liquidwaste. By increasing the levels of dissolvedoxygen within liquid waste, typically using
mechanical pumps, aerobic decomposition isencouraged. Again, this process requiressubstantial energy input, with implications forgreenhouse gas emission savings. Furthermore,this process has been linked to increased nitrousoxide emissions.
Methane captureIn reality, it is often preferable to capturemethane emissions from the manuremanagement practice rather than attempt toprevent them. Technologies to capture anddispose of methane arising from manuremanagement practices are similar to thoseapplied to landfill and have proved highlysuccessful. Waste pits or lagoons can be lined andcovered with impermeable materials in order tocontain and collect the methane. Whilst thisoption has the advantage of being relatively low-tech, it does require space and the gascapture rate may be fairly low due to problemsassociated with sealing large areas.
Anaerobic digestionA better rate of methane capture is achieved bypurpose-built anaerobic digesters, which operateaccording to the same principles as those usedwithin the solid waste management process,optimising decomposition of manure for methaneproduction and collection. The IPCC report thatanaerobic digesters typically release just 5% ofthe total methane potential of the waste, most ofwhich comes from further decomposition of thewaste residue once it has been removed from thedigester.
Digesters have become increasingly popularwithin the agricultural waste sector, bolstered bythe range of benefits offered by this technology.By heating the vessel to around 60ºC, theproduction of methane can be maximised over arelatively short period, decreasing retention timeof the manure from around 60 to 20 days. Thebiogas generated can be recovered for its energyvalue, improving the cost effectiveness of this
57 Chapter 6: Agriculture
practice. The resultant gas comprisesapproximately 65% methane, which can either becombusted directly as a local source of fuel or elseused to generate electricity for use onsite or forsale to the grid. This process ensures thatmethane is converted into carbon dioxide prior toemission and also offsets greenhouse gasemissions from the equivalent energy supplyfrom coal or oil. Furthermore, the electricitygenerated is eligible for ROCs, providing animportant financial incentive to implementdigester technology as well as being an additionalrevenue stream for the agricultural community.
Other benefits of managed anaerobicdigestion include reduced contamination fromrunoff, removal of noxious odours, lower levels ofpathogens and retention of the organic nitrogencontent of the manure. This means that theresidue is a valuable organic fertiliser. Otherproducts contained within the effluent have beensuccessfully used for animal feed and asaquaculture supplements. Such advantages maymake anaerobic digesters an attractive optioneven if energy recovery is not possible. In thesecases, the collected gas can be flared prior toemission, oxidising methane to the less potentcarbon dioxide.
The UK’s first dung-fired power station is inHolsworthy, Devon. It collects 146 000 tonnes ofslurry per year from 27 local farmers and has acapacity of 1.4 MW, with the waste heat used fora community heating scheme. The project wasrelatively cheap, receiving £3.5m in EU grants,coupled with matched funding from a Germanbiogas company. The intention is to introduce 100such plants across the UK.125
6.4 Existing EU and UK policyThere is currently no agricultural policy in the UKspecifically targeted at mitigating methaneemissions. Reductions in emissions have beenachieved fortuitously through policies aimed atother objectives, such as nitrate pollution andmanure management.
Most UK agricultural policy is based on the EUCommon Agricultural Policy (CAP). Introduced inthe 1960s, the CAP was intended to decreasedependence on imports and deliberately increasedomestic food production through a system ofsubsidies paid to EU farmers. Other mechanismsused by this policy were market management todecrease surpluses, and import taxes and exportsubsidies to protect the domestic market, thusensuring food security and a fair standard ofliving for those dependent on agriculture. Thesubsidies have resulted in some overproduction,often at the expense of the environment, byencouraging a more intensive form of agricultureand so adversely affecting the amount ofmethane produced.
The policy is also expensive, costing the EU£28.5bn per year. It has been estimated that everyhead of cattle in the EU is subsidised by £1.40 perday.126 The UK receives 9% of available CAP funds(some £3bn in 2000-2001), but overall is asignificant net contributor to the policy.127
The CAP is currently undergoing majorreform127 as it is considered unsustainable in itspresent state. These reforms are unlikely toreduce costs but may decrease methaneemissions by reducing livestock numbers. The EUhas suggested ‘decoupling’ direct payments tofarmers (or separating payments from production)so that farmers are encouraged to farm for marketdemand rather than the subsidies available.Removal of subsidies should lead to higher pricesand preserve farm income. Studies investigatingthe impact of decoupling indicate that the recentproposals will result in reduced agriculturalproduction and livestock numbers.128-130 A furtherreform of arable and dairy market regimes willreduce intervention price support while partiallycompensating farmers for income loss throughincreased direct payments.131 This is likely tofurther reduce livestock numbers and thereforemethane emissions.
Another policy that influences emissions fromthe agricultural sector is the Integrated PollutionPrevention and Control (IPPC) Directive discussed

58 Chapter 6: Agriculture
in Chapter 5. This Directive extends the pollutioncontrol regime to the UK agriculture sector bycovering intensive pig and poultry installations.Again, this policy does not specifically targetmethane, its focus being more on reducingammonia, but since it covers manuremanagement and production, it will also havesome impact on methane emissions.
6.5 RecommendationsWhilst the agriculture sector is responsible for themajority of methane emissions in the UK, it isalso one of the most difficult in terms ofemissions reduction legislation, reflected in thecurrent lack of such policies.
Emissions from livestockMethane capture is not a realistic option forlivestock emissions. Of the options for reducingemissions, neither lowering livestock numbers norpromotion of agri-technologies appear to beparticularly attractive or feasible politically.Policies must be acceptable to the UK farmingindustry and publicly acceptable in terms of foodsafety and other environmental issues.
Reducing livestock numbers via direct policymeasures would be unacceptable to the farmingindustry, who would view it as a loss of income. Itis possible that the CAP reforms may help toreduce livestock numbers through the removal ofsubsidies thus preventing overproduction,although to what extent is unclear.
The current social trends towards organicproduce, lower meat consumption andvegetarianism could help underpin any reductionsin animal numbers, although they are unlikely tobe major factors by themselves. Such trendscould be encouraged through educationalprogrammes focused on lower red meat and(especially) dairy consumption, linked to thecorresponding environmental and greenhousegas benefits.
Organic farming is a farming system that bestaddresses many policy objectives for agricultureand has a strong growth potential givencontinuing consumer demand. Supporting amove towards more sustainable methods offarming may help towards decreasing livestocknumbers.
Policies encouraging emissions reductionsthrough improving livestock productivity andefficiency may find support amongst theagricultural community due to increased profits.However, such policies are unlikely to be popularwith the public, who, in general, wish for a morenatural form of agriculture with a minimum ofchemical or biotechnological inputs into the foodchain. The widespread rejection of geneticengineering in this country and Europe, coupledwith fears over food safety following theagricultural practices that led to the BSE crisis,mean that any direct promotion of such measuresto reduce methane emissions are likely to beviewed with distrust.
Further research is required into theopportunities for productivity increases andmethane emission reductions from animal dietarychanges. This should be conducted within animalwelfare guidelines, taking into account publicacceptability of agri-technologies such as geneticengineering.
In essence, as far as agricultural emissionsfrom enteric fermentation are concerned, there isa trade-off to be made. Some reductions willoccur as part of the CAP, but any furtherreductions in methane are likely to be difficult toachieve without alienating the farmingcommunity or the general public. Faced withsuch an impasse, it may be necessary to acceptthat the livestock industry is sufficientlyimportant to the UK and that a certain level ofmethane emissions will always be produced byagriculture. This shortfall can be made up bysimpler, more cost-effective reductions in othermethane generating sectors.

59 Chapter 6: Agriculture
Manure managementPolicies targeted at reducing methane emissionsthrough improved manure management practicesare more straightforward. In this case, themethane is capturable and therefore can be usedto generate electricity or fuel gas-firedequipment. Best-practice technology exists in theform of anaerobic digesters and a strong financialincentive to support this technology is alreadyavailable through ROCs.
The main barrier to widespreadimplementation at present appears to be lack ofknowledge about the technology or conservatismwithin the sector. This could be overcomethrough education of the farming communityabout the positive benefits of anaerobicdigestion, further supported by grants or longterm low-interest loans to reduce the initial costsof capital equipment, similar to those under theClear Skies Programme. Assistance in setting upfarming co-operatives with shared digesterfacilities would also aid the development ofcommunity level anaerobic digestion schemes.
Methane tradingTrading of emissions from livestock is unlikely dueto the scattered and diffuse nature of methaneproducers, making capture difficult. Emissionsfrom this sector are hard to quantify, being basedon estimates of emissions factors from differentanimals and feedstocks. Verifying any emissionsreductions would also prove complicated.
A further barrier to trading from theagricultural sector is the small size of players –traders require larger quantities than individualfarmers would be capable of producing. Suchplayers would therefore not be capable ofparticipating effectively in a trading scheme,especially the EU Emissions Trading Schemewhich focuses on large scale emitters. Some formof aggregation would be necessary, but thiswould be likely to be so complicated as to beineffectual.
Food supplements andgrowth hormones can cutmethane emissions. But dothe public want them?

60 Chapter 7: Oil and gas sector
7.1 IntroductionThe oil and gas sector was responsible for 0.39 Mt(19%) of methane emissions in the UK in 2002,63
making it the third largest methane-producingsector. Emissions are from two major sources –venting of methane from rigs and plants duringmaintenance and leakage from the gas pipelinenetwork. Of these, the latter is by far the mostimportant, accounting for 85% of methaneemissions from this sector in 2001.68 Importantly,venting from rigs is a point source and thereforecapturable, whereas leakage from the pipelinenetwork is a diffuse source of methane andtherefore can only be reduced, not captured. Thisis reflected in the large uncertainties of emissionsestimates from pipeline leakage (±40%).
Since 1990, the overall consumption of gas inthe UK has nearly doubled, rising from 597 TWhto 1104 TWh in 2003105 (Figure 18).
The increased throughput of gas since 1990 ismainly due to an increase in gas-fired powerstations, rather than an increase in domestic andindustrial usage, which have remained roughlyconstant. With the decline of nuclear powercoupled with increased electricity demand, gas islikely to form an increasing contribution to UKelectricity generation in the foreseeable future.
Therefore methane emissions associated with thissector are becoming progressively moresignificant.
7.2 Sources of methane
Pipeline leakage In 2003, it was estimated that 4.5 TWh of gas waslost through leakage.105 Leakage from pipelines isdifficult and costly to eliminate. Individual joints,flanges and seals along the distribution networkleak frequently and, although not a major sourceof methane individually, are cumulativelysignificant over the whole 275,000 km pipenetwork.62 Leakage is greater from traditionalcast iron pipes than modern plastic versions.132
Most of the methane leakage, perhaps tens oftonnes per year, is from compressor seals in theboosters which are required every 60-100 milesalong the pipe network to maintain pressure fortransmission. Valve leakage can be very high inolder installations.132
Venting from rigsMethane may be mined independently as naturalgas or alongside oil and coal. In 1998, there werea record 204 offshore oil and gas fields inoperation (Figure 19). Of these, 109 wereproducing oil, 79 gas and the rest condensate (aliquid condensed from natural gas).133 In total, 127million tonnes of oil and 103 Mt oil-equivalent ofnatural gas were mined in 2002.105
When oil is mined from a rig, it contains amixture of oil, water and natural gas. This isseparated on site by passing the mixture intolarge settlement tanks, where the three fractionsseparate by gravity. Gas is removed at the topand water from the bottom, leaving just the crudefraction. After repeating this process severaltimes, the oil is of high purity and can be pumpedalong a pipeline to shore.
When the tanks need maintenance they mustbe made safe for human activity; methane is bothexplosive and a non-pungent asphyxiate. The
Oil and gas sector
Figure 18: Gas consumption by sector, UK, 1970-2003Source: DUKES 2004105

tanks are sealed off and flushed with water, thennitrogen, followed by air. The latter processespurge methane from the tanks, which werehistorically vented to the atmosphere. Thisresulted in significant methane emissions,especially due to the high operating pressure.Gas only rigs must also be purged of methanebefore work can recommence.134
7.3 Mitigating methane emissions
Pipeline leakage As a diffuse source of methane, capture is not anoption. Mitigation of methane emissions fromthe pipeline network can be achieved simply byreplacing old cast iron pipes with modern plasticpiping. However, this is a laborious and costlyprocess, involving labour-intensive constructionwork. Despite gains in operating efficiency to bemade by minimising leaks, the relatively low costof gas, especially compared to the cost ofupgrades, means there is little economic incentiveto do so. Even with the likely rise in gas pricesover the coming years as the UK becomes morereliant on fossil fuel imports, fuel price alone isunlikely to encourage network investment.
Venting from rigsAs a point source, capturing methane from rigs ismore straightforward. By flaring instead ofsimply venting to the atmosphere, carbon dioxideis emitted in place of the more potent methane.This tends to be the most common method usedto deal with the methane. Alternatively, allgreenhouse gas emissions can be avoided bypassing the aqueous and gaseous by-productsfrom the tank back into the well during
maintenance, thereby sequestering thegreenhouse gases that would otherwise beemitted to the atmosphere. This methane doesnot remain sequestered: it is mined again whenthe rig is operational once more.134
7.4 Existing UK policiesIn the UK, there are few policies or regulations inplace that address natural gas leakage from pipesor even leakage monitoring. National GridTransco operate the pipeline network and areresponsible for its maintenance and attending toleaks. Transco spends an average of £600m peryear on maintenance, of which £335m is spent onpipeline replacement. Transco is also mandatedby the Health and Safety Executive to replace ironpipelines that lie within 30m of any property; aprogramme that will take place over 30 years.This, however, is a safety issue rather than activegreenhouse gas abatement.
Leakage rates from the natural gastransmission and distribution network haveimproved as a result of a number of efforts:replacing old cast iron pipework, gas conditioning,pressure management and a mains and servicereplacement programme.135, 136 Emissions havereduced by 14% (for the period 1990-2001)135
against a target of 20% by 2000 (relative to 1992levels).136 In line with this, Transco revised itsinternal target to reduce leakage, in absoluteterms, by 12.5% from 1990 levels by the year 2010,citing increased throughput as the reason forrevision of the 20% target. It does, however, aimto overachieve this target by 7.5% by that date.136
Encouraged by the UK Emissions TradingScheme (UK ETS), significant advances have beenmade in reducing methane emissions from oiland gas rigs. Companies such as Shell and BPhave been able to trade carbon credits gainedfrom capturing methane that would haveotherwise been released into the atmosphere.
Both BP and Shell have also developed theirown internal trading schemes in advance of boththe UK and EU ETS. Pilot trading of greenhouse
61 Chapter 7: Oil and gas sector
Figure 19: North Sea oil and gas fieldsSource: UK Offshore Operators Association, 2002133

62 Chapter 7: Oil and gas sector
gases was started by BP between its own sectorsand installations in 1999, going company wide in2000.137 Internal trading allows companies toinstitutionalise the concept of a cost associatedwith environmentally damaging emissions,reinforce a culture of environmentalaccountability and develop trading skills toprepare for the emerging internationalmarketplace. As a business practice it also allowsa company to allocate capital to initiatives whichhave the greatest impact at lowest cost.138
7.5 Recommendations
Pipeline leakage Although leakage rates have reduced over the lastten years, methane emissions from gas pipelinesare still significant and becoming more so withthe growth in gas consumption. One of the majorobstacles to achieving reductions in this area isthe poor quality of data. Historically, pipelineleakage has been primarily a safety issue but with
growing awareness about the environmentalimpact of methane emissions, quantification hasbecome more important. Without a reliablebaseline, there is uncertainty regarding the extentof the problem and no standard against which toevaluate any measures taken to mitigateemissions. Therefore, one of the first steps needsto be improved monitoring and data collection.
Regular, cost effective programmes fordetecting, prioritising, and repairing leaks acrossall sectors of the gas industry – production,processing, transmission and distribution – arerequired. Monitoring equipment could beinstalled as part of the ongoing maintenance andupgrade of the gas pipeline network with aparticular focus on boosters, since this is wherethe majority of leaks occur. This would enablemore effective detection as well as more accuratequantification of gas leaks.
Although leakage represents a loss in revenueto the industry, the relatively low cost of gasmeans the economic incentive to achieveemissions reductions is weak. Safety tends to bethe main concern at present. Minimisation ofpipeline leakage is therefore more likely to beunderpinned by environmental concerns andimplemented through policy instruments ratherthan on an economic basis.
The industry would benefit from a focus oncost effective technologies and practices thatimprove operational efficiency and reduceemissions of methane. The USA’s Natural GasSTAR Programme encourages the natural gasindustry to reduce emissions through market-based activities that are both profitable forindustry partners and beneficial to theenvironment.139 This has introduced a range ofbest management practices to achieve emissionsreductions at all stages of the gas production-distribution cycle. Opportunities and options toreduce leaks and venting from the largest sourceswere jointly identified by EPA and gas industryrepresentatives and it is intended to reproducethese solutions across all sectors.
Trading could prove a strong driver towards
Carbon trading hasencouraged the capture ofmethane emissions fromoil and gas rigs

63 Chapter 7: Oil and gas sector
lower methane emissions provided additionalityof the savings can be shown. Those reductionsalready required through legislation under theHealth and Safety Executive would not qualify asadditional and therefore could not be traded.Also, the lack of reliable data means there is a riskof introducing ‘hot air’ into the trading schemewhere the gas industry could be rewarded forapparent reductions due to statistical error ratherthan ‘real’ savings. However, it is debatable as towhether the industry should be rewarded forcarrying out repairs that should be done as amatter of course. It is Ofgem’s responsibility toensure the necessary investment in pipelineinfrastructure is made and maintained in the longterm. Direct legislation through, for example,mandatory standards for leakage, is required tosecure further emissions reductions. Improveddata would also help in monitoring and enforcingsuch targets.
Venting from rigsEmissions trading has proved effective inencouraging methane capture from rigs.However, with the cessation of the UK ETS in2006, the opportunity for trading methane will belost, at least for two years until the EU ETS review.This results in a dilemma for the UK Government:to either legislate to encourage methane captureand underpin the savings already made or waitfor two years until trading can recommence. Anylegislation must ensure that methane reductionscan still be classed as additional so as not toundermine the market for trading in the future.

64 Chapter 8: Coal mine methane
8.1 ProductionCoal mine methane (CMM) is the term given tothe gas trapped in coal seams, which has anapproximate chemical composition of 70%methane, 15% carbon dioxide and 15% nitrogen.The gas is released once the seams are mined andcan then escape to the atmosphere.
Internationally, the UK was the sixth largestproducer of coal mine methane in 1990,140 behindChina, the former Soviet Union, the USA, Germanyand South Africa. The UK submission to theUNFCCC declares that 0.24 Mt of methane were
emitted from active coal mines during 2002,accounting for 12% of all UK methane emissions.Historically, the contribution of coal minemethane to the UK’s methane budget was moresignificant when major coal fields in the UKwhere extensively mined for power generationand industry (Figure 20). However, the decline ofthe UK coal industry and subsequent large scalepit closures has resulted in far fewer mines andemissions. In 1947 there were 958 minesproducing 189.6 Mt of coal annually. At present,there are just 17 deep mines and 39 open castmines in the country, producing a total of 27.8 Mtcoal in 2003.105 The open cast mines releasemethane directly to the atmosphere. However,emissions from such mines are small as theseams lie close to the surface and have retainedlittle of their original methane over geologicaltime.75
Why recover coal mine methane?The primary reason for recovering coal minemethane is safety. Historically, underground mineexplosions have been the cause of many injuriesand fatalities, so reducing methaneconcentrations underground has aided minesafety operations.
Secondly, there is an economic motivation: ifmethane from coal mines can be captured, it canbe used directly as a fuel or to generate electricity.
Lastly, there is the environmental imperative:reducing emissions of methane to theatmosphere aids the meeting of Kyoto and othertargets.
Abandoned minesIn 1988, a house in the village of Arkwright inDerbyshire exploded due to contamination of thevillage with seeping coal mine methane. Becausethe ground above mined seams subsides andfissures slightly, methane can seep through thebedrock and find its way to the surface, oftenmiles from the pit head. This incident was a keyfactor in alerting the industry and Government to
Coal mine methane
Figure 20: Coal fields in the UKSource: Bibler, 1998140

the environmental impacts of methane emissionsfrom abandoned mines.
A major shortcoming of the UK UNFCCCsubmission is that it only includes emissions fromactive mines. At present, the decrease in methaneemissions accounts for 30% of the UK greenhousegas emissions reductions achieved since 1990,with coal mine closure responsible for 36% of this(i.e. 12% of total greenhouse gas emissionsreductions). Inclusion of methane emissions fromabandoned mines may significantly alter thesefigures. Both the current figures and the 1990baseline would be higher and, whilst emissionsfrom the sector would still decline over thisperiod, it would not be so pronounced ascurrently implied.
A suitable methodology has not yet beendeveloped for the inclusion of abandoned mines.This is a worldwide problem, but particularlypertinent in the UK. Whilst it is true thatemissions from active coal mines are higher thanfrom disused mines because the mining processopens up pockets of methane, abandoned coalmines are still capable of producing significantquantities of methane. This is especially true inthe UK where 1096 coal mines have beenabandoned since 1947,141 compared to the 17 deepmines still currently active.
Emissions of methane from abandoned coalmines are poorly quantified at present, withestimates ranging from 0.02 to 0.3 Mt per year.64
The large range of values is an indicator of themassive uncertainty in these estimations. At thelow end of this range, inclusion of abandonedcoal mine methane makes a negligiblecontribution to UK methane emissions. Theupper end of this estimate corresponds to morethan doubling the methane released from coalmines and would make coal mines (active andabandoned) the second largest source of methanein the UK, responsible for 21% of UK methaneemissions. The Association of Coal Mine MethaneOperators (ACMMO) believes emissions fromabandoned mines to be higher still, at 0.6 Mt peryear, by including seepage from unvented mines
as well as those with vents.142 They estimate that45 sites in the UK are commercially viable, capableof supporting 300 MW of electricity generatingcapacity and saving 0.37 Mt of methane.142
However, the DTI maintain that coal minemethane from abandoned mines is not a problemin the UK and use this assumption as the basis fortheir policy recommendations. They estimatethat just 0.05 Mt of methane are emitted fromsites capable of being controlled.143 Furthermorethey assert that methane seepage from mineswill rapidly diminish, particularly if floodingoccurs.
The Association of Coal Mine MethaneOperators claim that the DTI have seriouslyunderestimated both the extent of the resource,the number of possible projects andoverestimated the rate in decline of emissions.144
The huge discrepancy in both the postulatedresource and its longevity requires furtherindependent research. At present, poorknowledge is likely to lead to inappropriate policyand economic support measures – particularly ifthe problem is not perceived as serious.
8.2 Mitigation
Non-extractionThe flow of methane from abandoned coal minesmay be inhibited by blocking vents and sealingpathways where methane is detected.Alternatively, the coal mine may be flooded,providing an aqueous barrier to methaneemissions.143 Transport of methane through thewater layer is prevented by its low solubility.Flooding can be an attractive option where thereis no risk of aquifer contamination and wherethere is a suitable water resource available for theoperation.
Such techniques are only applicable to siteswhere the risk of uncontrolled emissions is low.Because methane can seep along fissures andcracks in de-stressed bedrock many miles from itssource, this is not seen as a workable option formost sites. Indeed, the Coal Authority has had to
65 Chapter 8: Coal mine methane

66 Chapter 8: Coal mine methane
install a further 40 vents at abandoned minesaround the country since 1994 to cope with thehazards of new leakage points.143
The preferred options of methane emissionmitigation revolve around recovery andconversion to carbon dioxide.
ExtractionCoal mine methane can be extracted from minesin four different ways: through an existing gasvent, a vent well, a gob gas well and a CBM well.
Existing gas ventAll active coal mines have an existing gas vent toremove methane from the mine for safetyreasons. Typically this gas is merely vented to theatmosphere, although some UK collieries doutilise the methane liberated. In active mines,ventilation air methane (VAM) is the major sourceof methane because the throughput ofventilation air is so high. Once the mine is nolonger active, the VAM can still be drawn throughthe vent and captured, rather than being lost tothe atmosphere (Figure 21).
Vent wellThe upper layers of rock above a coal mine canoften subside and fissure, creating a pathway formethane to seep through to the surface. Thisdiffuse flow is difficult to capture and can resultin significant methane emissions. A vent well canbe drilled into the disused mine away from thecentral shaft and, by pumping on the well,methane will preferentially exit by this simplerroute. Methane captured here also reducesmethane emissions to the atmosphere.
Gob gas wellGas trapped in destressed coal seams near thecoal face (known as gob gas) will release methaneinto the mine or out through porous rock strata tothe atmosphere. Drilling into this seam andpumping allows the gob gas to be captured. Forabandoned mines this clearly reduces methaneemissions, whereas for active mines, such aprocess mines the gas before the coal is extracted.
CBM wellVents can also be drilled directly down into coalseams adjacent to the coal face. Virgin coalseams are stimulated and, after removing anywater, methane can be extracted from the coalseam. This is essentially a direct mining processinvolving the creation of a virgin coal bedmethane (CBM) mine. As such it is not mitigatingagainst methane emissions as the methanepresent in the coal bed would not naturally have
Methane emissions fromabandoned coal mines arenot recognised by nationalinventories

67 Chapter 8: Coal mine methane
escaped to the atmosphere. CBM is a fossil fuelresource and therefore is not be eligible for ROCs.
Acceleration of coal mine methanePumping coal mine methane results in a morerapid removal of methane from the mine thanwould occur naturally and possibly increases theamount of methane extracted. This lowers thepressure inside the mine and increases thedesorption of methane from the coal seams.However, there is still much debate within thescientific community about the extent ofacceleration.33
The extent of acceleration has implications forthe trading of methane – does it matter thatmethane is being extracted from the mine fasterthan baseline natural emissions? Currently, it isbelieved that either accepting all extractedmethane by ignoring the acceleration issue or
allocating a fraction of output to be eligiblewould both be feasible methods for emissionstrading.33
Using captured methaneOnce captured, coal mine methane is eithervented to the atmosphere, flared (oxidising themethane to carbon dioxide) or utilised in someform of energy recovery. The latter is thepreferred environmental option but notnecessarily the most economic since, as a non-renewable resource, the electricity does notqualify for ROCs. In 2003, 0.8 TWh of electricitywas generated from colliery methane.105
Methane is currently captured at seven operatingsites and utilises a mixture of flares, generatorsand gas utilisation for boilers. Electricity isgenerated at six of these sites. Electricitygeneration from CMM also takes place at sevenabandoned mines,146 with a total capacity of35 MW. ACMMO estimates that around 300disused coal mines have the potential to generateelectricity from CMM, which would result in aninstalled capacity of around 400 MW.147
The purity of the methane extracted variesdepending on its source. Gob gas is of mediumquality, typically containing 30-90% methane,which is a sufficiently high concentration toutilise abatement technologies similar to thoseemployed in landfill.
Ventilation air methane and vent wellmethane are of lower purity (less than 1%methane), but more sophisticated technologiesnow exist that are capable of utilising this gasdirectly.148 Flow reversal reactors use a bed ofsilica gravel or ceramic as a heat exchangemedium. The bed is preheated to 1000ºC toinitiate methane oxidation and the VAM is passedinto the bed. As the methane combusts, thetemperature rises and the excess heat can berecovered from the exhaust gas. This process alsocauses the far side of the bed to heat up, so thedirection is reversed periodically to ensure thatthe combustion hotspot remains in the centre ofthe reactor bed (Figure 22).
Figure 21: Recovery of methane from abandoned minesSource: The Coal Authority, 2001145
Figure 22: Thermal flow reversal reactorSource: US EPA Coalbed Methane Outreach Program, 2003149

68 Chapter 8: Coal mine methane
Ventilation air methane may also be utilised ascombustion air – in other words it is used as a‘primed’ air mix for the combustion of other fuels.In this way, the calorific value of the VAM is notlost. Such a process requires an alternate sourceof fuel on site.
8.3 Current policy
Coal mine methane emissionsThe UK’s current policy on coal mine methane hasrecently been laid out by the DTI.33, 143 The DTIassessed a total of 18 different policy instrumentson the basis of cost effectiveness, ease ofimplementation and political acceptability.Environmental best-practice was not consideredas one of the criteria. The most important factorin deciding which policy to utilise was theassumption that the methane resource fromabandoned mines is small and will reduce overtime through natural processes. However, asnoted earlier, this is a highly contentiousstatement.
The favoured policy instrument was a series ofcompetitive bidding rounds amongst ProductionExploration and Development Licence (PEDL)holders across relevant sites for the most cost-effective bids to control methane emissions. TheUK Coal Authority will be responsible foroverseeing this process, thereby extending itsenvironmental duties from mine water alone toinclude greenhouse gases. In most cases, giventhe lack of financial support for electricitygeneration, it is likely that simple flaring will bethe most cost-effective choice. This policy willwork alongside existing mechanisms, includingthe Climate Change Levy (CCL) and emissionstrading.
Of the other policies considered, neither of theother two ‘front-runners’ – do nothing orincorporation into the Renewables Obligation –were deemed acceptable or consistent withcurrent Government policy. Whilst ‘do nothing’ isthe lowest cost option, it is inconsistent withGovernment environmental objectives and runs
contrary to the commitments made on coal minemethane within the Energy White Paper.8Incorporation into the Renewables Obligation wasrejected on the grounds that coal mine methaneis not a renewable resource and that it wouldinfringe EU rules on state aid. Development of an‘Alternative Obligation’ for encouraging non-renewable, yet beneficial, low-carbontechnologies was rejected for fear of raising the‘nuclear question’.
Whilst the proposal for a competitive grantscheme is still at an early stage, it is clear that theemphasis is on control options, rather thanelectricity generation. Many proposed methanemining schemes are to be scrapped due toinsufficient Government incentives.150 Alkane, amajor CMM company, has dropped proposals for50 MW of electricity generating capacity inAyrshire and is likely to take its operations abroadto Germany where economic conditions are morefavourable.
Climate Change LevySince April 2002, electricity generated from coalmine plants has been exempt from the ClimateChange Levy (CCL).151 This full exemption wasincorporated in the 2002 Finance Act, whichaccorded CMM renewable status for the purposesof exempting it from the CCL.152 The Governmentclaims that the exemption was granted on thebasis that electricity generated from CMM offersboth environmental gains and employmentopportunities.151 This creates a policyinconsistency where coal mine methane is eligiblefor Levy Exemption Certificates (LECs) but notROCs.
Exemption from the CCL was expected toboost electricity generation from CMM with aconsequent reduction in GHG emissions.However, the price of LECs is low at approximately£4/MWh; an order of magnitude smaller thanROCs. As a stand-alone policy, the ClimateChange Levy will not provide a sufficienteconomic driver for investment in electricitygeneration technologies.

69 Chapter 8: Coal mine methane
Emissions tradingIn order for the industry to continue to reduceemissions throughout the UK, the Governmenthas offered support through other policies suchas the UK Emissions Trading Scheme (UK ETS).Under the UK ETS, coal mine methane has beenincorporated and rewarded for its environmentalbenefits through trading by UK Coal. However,trading is only allowed for emissions creditsgenerated from active mines (either throughflaring or electricity generation). Emissions fromabandoned mines do not qualify for carboncredits since there is no baseline measure forthese emissions and therefore no way forreductions to count.
DEFRA has commissioned studies to determinea baseline for abandoned CMM emissions thatcould enable it to qualify for this scheme,64, 141
although so far only a protocol for methane fromworking coal mines has been developed.153
8.4 Recommendations The key factor in determining the importance ofthis sector lies in the debate around abandonedcoal mines, which could shift the current policyfocus. In terms of capturing CMM from bothactive and abandoned mines, the technology isavailable and ultimately it depends on the policyemphasis as to how the captured gas is thendealt with.
Abandoned coal minesAt present, only methane from active mines isrecognised by international targets. As aconsequence, emissions from abandoned minesare not given the same policy priority as methaneemissions that actively help the UK achieve thesetargets. It could be that emissions fromabandoned mines represent both a significantproblem and resource in the UK, but there is agreat deal of uncertainty surrounding currentestimates. Not only does this represent a majorenvironmental issue, in terms of possiblemethane emissions which are currentlyunchecked, it is also a potential missed
Capture of coal minemethane results in bothsafety and environmentalbenefits

70 Chapter 8: Coal mine methane
opportunity – an unexploited resource whichcould provide both financial and environmentalbenefits as well as employment opportunities.
An essential first step in addressing this issuewould be to quantify these emissions accurately.This would involve developing an internationallyagreed methodology for estimating emissionsfrom abandoned mines, which currently does notexist. These emissions could then be included inthe UK inventory for the UNFCCC. This wouldaffect both current and historic estimates ofemissions and therefore the contribution towardsthe Kyoto target. Improved data quality wouldprovide a firmer foundation on which to buildpolicy and may require a change in policydirection. The development of a reliable baselinefor abandoned mines would also be required toenable trading of these emissions. Untilestimates are improved, the debate andconjecture will persist and methane will continueto be released into the atmosphere.
Policy Methane captureCurrent policy addresses capture at active sitesbut not from abandoned mines. Until emissionsfrom abandoned mines are better quantified,there is unlikely to be any change in thissituation.
Electricity generationFollowing the recent DTI review, the emphasis incurrent policy is on control, most likely in the formof flaring, rather than energy recovery. Whilst thisis successful in reducing methane emissions andusually the most cost-effective option, it does notmaximise the environmental benefits ofcapturing the gas. Because methane from bothactive and abandoned mines is a non-renewableresource, the economic incentives are not in placeto encourage the implementation of best-practicetechnologies. Apart from the Climate ChangeLevy, there are no other policies or incentives for
Over 27 Mt of coal wasproduced in the UK in2003

71 Chapter 8: Coal mine methane
energy recovery and the Levy ExemptionCertificates do not have a high enough marketvalue to encourage energy generation. Fiscalpolicies such as trading will encourage flaringrather than electricity generation, as the mostcost-effective option. Other policies such as feed-in-tariffs (as in Germany) and incorporation intothe Renewables Obligation have been rejected bythe DTI as inconsistent with existing Governmentpolicy.
Given the lack of financial incentives, ifelectricity generation is to be encouraged it willrequire some support from the Government. Thiscould be in the form of grants or subsidies toencourage the implementation of best-practicetechnology, or through legislation, similar to theEU Landfill Directive. This could have implicationsfor trading since emissions reductions required orsupported in this way may not then be eligible totrade.
New technologyThere is still room for improvement in currentmethane capturing technology, but investment inincreasing efficiency is likely to require some formof incentive. Similar to energy recoverytechnologies, if there are no strong financialincentives to encourage improved capture,support may be need through grants andsubsidies or legislation.
Methane tradingThe successful trading of methane from activecoal mines on the UK Emissions Trading Schemedemonstrates the feasibility of this approach forthis sector. Inclusion of emissions fromabandoned mines could potentially double thesize of this market, but first requires theestablishment of a reliable baseline. The two yeargap between the closing of UK ETS and entry ofmethane into the EU ETS provides a timelyopportunity to establish this baseline andinvestigate the potential of this market. As in theoil and gas sector, with this gap in trading, the UKGovernment faces a choice between legislating to
underpin the savings made to date or putting theprocess on hold for two years until trading canrecommence. Similarly, any mandatoryrequirements will impact on the viability of thefuture trading market.
The current political situation in the UK meansthat whilst trading will aid the economics ofinstalling capturing capacity it will onlyencourage capture and flaring rather thanelectricity generation. Other policy measuresneed to be put in place to promote the adoptionof energy recovery, which could then besupported through trading.

72 Chapter 9: Discussion and conclusions
9.1 Importance of methaneMethane is a powerful greenhouse gas, twenty-three times more potent than carbon dioxide(over a 100 year lifetime) and with a relativelyshort atmospheric lifetime of just 12 years,meaning that emissions reductions are rapidlytranslated into atmospheric concentrationreductions. Therefore mitigating methane ishighly cost-effective, particularly in the shortterm. Despite this, there is currently a lack ofpolicy specifically targeted at methane.
There is also a climate change imperative forreductions in methane emissions to be achievedsooner rather than later – the higher theconcentration of methane in the atmosphere, themore slowly it is removed by natural processesdue to feedback loops in the atmosphericchemistry of the gas. Therefore it is moreeffective to reduce emissions in the short term;failure to do so will increase the lifetime ofmethane in the atmosphere and make it an evenmore potent greenhouse gas.
Controlled properly, methane represents avaluable resource – it is a combustible fuel with ahigh calorific value. Once captured, combustionof methane produces the less potent carbondioxide and energy, which can then be used forheating or electricity generation. Production ofelectricity from methane will offset electricityproduction from the more polluting nationalenergy mix.
Hence, the chemistry and physical propertiesof methane make it an attractive option foremissions reductions within the framework of thebasket of six greenhouse gases, providing bothenvironmental and economic benefits. Thequestion is how best to secure these reductions –what policies and technologies would be mosteffective?
9.2 Disparity of methane sourcesThis report has focused on the four major sourcesof methane in the UK: landfill, agriculture, gaspipes and coal mines. These are disparate in
nature, differing in the way in which the methaneis generated, control options available and theoverall policy context.
Sources may be either biogenic (agriculture,landfill) or fossil fuel derived (gas leakage andcoal mines). This has implications for howmethane is classified (renewable or non-renewable) and therefore its eligibility forfinancial rewards such as ROCs. Furthermore, thesource may be a single point and thereforeinherently capturable (landfill, coal mines) oressentially diffuse (agriculture, gas leakage). To acertain extent, this determines whether the policyemphasis is on capture or reduction and whetherthe resource can be further exploited.
Each sector also has its own political history,with different players and sensitivities, andparticular policy focus. All these factors togethermake identifying a single unifying methane policya major challenge.
9.3 Methane tradingAlthough there are policies in place that will havethe effect of reducing methane, these are notuniform across the four major sectors and areoften focused on a different goal (e.g. divertingwaste from landfill). Methane trading was a keyoption considered in this report as a possiblemeans of unifying policy into a single coherentabatement mechanism. According to the maincriteria necessary for an effective emissionstrading scheme (Chapter 3), there are a number ofdrawbacks to implementing a UK methanetrading scheme:• Commodity to trade. This requires
quantification of the methane available fortrading which is most easily achieved throughcapture, but this is only possible in certainsectors.
• A liquid market. The methane market alone istoo small to function efficiently since thevolumes involved are too low. For methane tobe traded it must be incorporated into a multi-gas trading scheme.
Discussion and conclusions

• Suitable mix of players. There is a widevariation in the size of players across thedifferent sectors, from big oil companies toindividual farmers, with a large number ofsmall players, which would result in aninefficient market.
• Additionality. Mandatory requirements formethane reductions are already in place inseveral sectors so future reductions could notbe considered additional and are therefore nottradable.
• Monitoring, reporting and verification. In thesectors where methane is capturable (landfilland coal mines) data quality is poor with noreliable baseline to provide certainty and allowfor verification.
• Conflicting policies. Where methane is capturedand used to generate electricity, it is financiallyadvantageous to accrue alternativeenvironmental rewards such as ROCs due totheir high market value, rather than carboncredits. Since the savings cannot be countedtwice, this undermines any potential tradingmarket.
It is apparent that a separate methane marketdoes not represent a viable option for the UK, norwould methane trading work as the soleapproach to cover all sectors. However, tradingmethane certainly has potential for some sectors,as demonstrated by the successful trading in the
UK Emissions Trading Scheme (UK ETS) by the coaland gas industry.
The possibilities for trading vary betweensectors, as detailed below and summarised inTable 16.• Landfill. Methane is capturable, but does not
count as additional since capture is alreadyrequired for safety reasons and also covered atnew sites by the Landfill Directive. A reliablebaseline is difficult to define, partly due to thelack of data on landfill sites and partly due tothe change in levels of methane emissions thatoccurs naturally over time. Any electricitygenerated from the captured methane will beeligible for ROCs, removing the incentive totrade.
• Agriculture – livestock. Livestock emissions arediffuse, with no easy means of capture and noaccurate method for estimating a baseline. Assmall players, individual farmers would find ithard to compete effectively in a trading scheme– some form of aggregation would be necessarybut this would introduce further complexity.
• Agriculture – manure. With appropriatemanagement, emissions from manure arecapturable, although there is little datacurrently available to determine a baseline ofemissions. The methane captured would beadditional since there are no other policies inthis area, but the availability of ROCs mayundermine the potential for trading.
73 Chapter 9: Discussion and conclusions
Table 16: Potential for methane trading in each sector
Is methanecapturable & Reliable Is methane Policy quantifiable? baseline? additional? conflict? Trading?
Landfill Yes No No ROCs NoAgriculture– livestock No No Yes No No– manure Yes No Yes ROCs PossibleOil & gas rigs Yes Yes Yes No YesGas pipeline No No Some No PossibleCoal mines Yes No Yes No Yes

74 Chapter 9: Discussion and conclusions
• Oil & gas rigs. Methane is capturable, additionaland quantifiable with no policy conflicts,resulting in a high trading potential.
• Gas pipelines. In a sense, emissions frompipeline leaks are (re)captured by repairing theleak, since the methane is already capturedwithin the pipe, but these emissions reductionsare not easily quantified. For trading to bepossible, a reliable baseline, through improvedmonitoring, needs to be established to enablequantification. Only those emissions notcovered by Health and Safety legislation wouldcount as additional.
• Coal mines. Trading potential for this sector ishigh, capture of emissions being reasonablystraightforward and additional, with no policyconflicts. Methane from active mines has beensuccessfully traded. However, there is hugeuncertainty regarding emissions fromabandoned mines, which could double themarket size. Better quantification is requiredbefore any trading of these emissions cancommence.
Given the forthcoming closure of the UK ETS in2006, the future of methane trading is somewhatuncertain, awaiting the review of the EU ETS in2006. It is essential that methane is incorporatedinto the European scheme in 2008, given itsimportance as a greenhouse gas. Even limitedtrading should be encouraged because of thepotency of the gas. In addition, someconsideration needs be given to the two year gapfollowing the end of the UK ETS in 2006. The UKGovernment is faced with a choice of putting theprocess of methane reductions from trading onhold for this period or underpinning the savingsachieved to date through legislation. Any policiesmust ensure that the methane reductions canstill be classed as additional to allow trading ofthese emissions in the future.
Although the opportunities for methanetrading in the UK are limited, mainly due to thepresence of ROCs, there may be greater scope fortrading in other countries. Under the EU ETS, the
Joint Implementation and Clean DevelopmentMechanism of the Kyoto Protocol open up thepossibility of trading reductions secured throughprojects in other countries, which could helpboost the market in the UK.
Despite the fact that methane trading doesnot represent the ultimate solution in terms ofsingle coherent approach for reducing methaneemissions, it still has a role to play as part of asynergistic policy package. However, the future ofthe market is dependent on inclusion in the EUETS. Until this is certain, the potential of thispolicy option will be left hanging.
9.4 RecommendationsBased on the likely future emissions from eachsector and the effect of planned policies andmeasures, annual methane emissions areexpected to decrease by 16.5% by 2020.136
However, additional policy measures have thepotential to reduce this yet further, with a suite ofpolicies to address the different requirements ineach sector; these are illustrated in Table 17 anddiscussed on a sector by sector basis below.
LandfillReductions in methane emissions from landfillsites can be achieved by two routes: capturingany methane produced as a result of anaerobicdecomposition of biodegradable waste andreducing the amount of biodegradable waste sentto landfill in the first place, as laid out in the EULandfill Directive.
One of the key issues for this sector is dataquality. There is uncertainty about the exactnumber of landfill sites in the UK and extent ofcapture at many of these sites, particularly olderand closed sites. It could be that a significantsource of methane emissions is being overlooked.A detailed inventory of all landfill sites isessential, providing information on the capturetechnologies employed at each site to give anindication of where further reductions could bemade.
Methane trading isunlikely to be an optionfor reducing livestockemissions

75 Chapter 9: Discussion and conclusions
In modern landfills, 85% of the methane can becaptured25 although the capture rate could beincreased still further. Older landfill sites withless advanced capping technology have lowerrates of capture. If such sites are found to be asignificant source of emissions, investment will beneeded to find solutions to improve capture atthese sites. The prime economic policyinstrument for improved methane capture atpresent is eligibility for ROCs through thegeneration of electricity from landfill gas.
The success, or otherwise, of the LandfillDirective will depend on effective alternativemethods for the disposal of biodegradable waste.Whilst there is no lack of such options –composting, recycling, incineration – the mainobstacle appears to be their implementation. Anincrease in composting or recycling requiresindividuals to change their waste disposal habitsand, although composting and recycling rateshave increased, it is unclear whether these arecapable of increasing to the levels required by theDirective. Incineration is also unpopular amongstthe UK public, with health concerns about dioxinsand other emissions from waste incinerationplants. Furthermore, electricity generation fromincineration of waste does not qualify for ROCs.
Anaerobic digesters offer the best alternativeat present, particularly as part of a mechanical
biological separation scheme, with close to 100%methane capture and no atmospheric emissions.The gate fees for accepting the waste are a keyeconomic driver for this technology. In addition,electricity generated from the methane is eligiblefor the strong financial rewards of ROCs.However, in order to encourage the initial uptakeof this technology, it may be necessary to provideadditional support in the form of grants andsubsidies, since it is a relatively unproventechnology in the UK.
The effectiveness of the Landfill Directive inachieving significant reductions in landfillmethane emissions remains to be seen. There issome incompatibility with the UK RenewablesObligation, since a reduction in biodegradablewaste going to landfill will reduce theprofitability of methane capture and couldtheoretically make capture and use unviable.However, substantial amounts of methane will beproduced from the biodegradable waste alreadypresent in landfill for many years to come,minimising any potential conflict.
AgricultureThe agricultural sector is the largest source ofmethane within the UK, but the hardest one inwhich to achieve emissions reductions, reflectedin the lack of polices that target this source.
Table 17: Disparity of methane sources and appropriate mitigation measures
Collectable Non-collectable Possible measures
Landfill
Agricultural manuremanagement
Biogenic Divert from landfill
Societal trends
Agriculturelivestock
Coal mine methaneFossil fuel Carbon trading
Direct policy measures
Gas pipe leakage
Flare
Revenue streams:– use as heating fuel– generate electricity– ROCs or carbon trading
Possible measures Reduce at source
Carbon trading (if quantifiable)
Direct policy measures

76 Chapter 9: Discussion and conclusions
Livestock emissionsSome 90% of emissions are from ruminantmammals such as cows and sheep. These sourcesof methane are a multitude of mobile pointsources rendering capture of the methaneunfeasible. Reduction of methane at source istherefore the only sensible mitigation measure.However, the policy options available to achievethis are fraught with difficulty. Enforcing areduction in livestock numbers would alienate thefarming community whereas increasingproductivity or reducing emissions per animalthrough dietary adjustments or geneticengineering is likely to be unpopular amongst thepublic.
Some decrease in the number of animals mayoccur as a result of reforms to the EU CommonAgricultural Policy (CAP). The current societaltrends towards organic produce andvegetarianism may also help reduce livestocknumbers, but not by any significant amounts andthis is also an area that would be difficult tolegislate. Supporting moves towards moresustainable methods of farming could be ofbenefit over the longer term by reducing livestockdensities.
It seems that it may be necessary to accept acertain level of methane emissions from
agriculture if the UK is to retain a livestockfarming industry.
Manure managementOptions for reducing methane emissions fromanimal manure are more straightforward, themost favourable being the use of anaerobicdigesters. A strong economic driver is alreadyavailable through eligibility for ROCs. The mainfocus here needs to be on raising awarenessabout this technology amongst the farmingcommunity and encouraging its uptake throughgrants and subsidies and the formation offarming co-operatives with shared digesterfacilities.
Oil and gas industryNatural gas leakageOnce again, poor data quality is a key issue forthis sector. At present, estimates of methaneemissions from pipeline leaks are very poorlyquantified, with errors of ±40%. This representsone of the main barriers to trading at present,with a risk of trading apparent reductions due tostatistical error rather than ‘real’ savings.Improved monitoring and data collection arerequired to establish the extent of this problem.
Due to the relatively low price of gas, there islittle economic incentive to repair leaks andreduce emissions. Programmes such as the USA’sNatural Gas STAR programme help to reduceemissions through market-based activities thatbenefit both the industry and the environment.However, stronger measures are needed toachieve significant reductions, with Ofgemoverseeing tighter regulation on pipeline leakageand the setting of mandatory standards. Anysuch legislation would remove the possibility oftrading from this sector, but it is questionable asto whether the industry should be rewarded forcarrying out necessary repairs anyway.
Venting from rigsReducing methane emitted as a result of rigflushing is straightforward through flaring or
Strong regulation isrequired to reduce leakagefrom gas pipes
77 Chapter 9: Discussion and conclusions
sequestration of the captured methane. Theprimary economic incentive for achieving thesereductions to date has been through the tradingof methane on the UK ETS. This raises thequestion of what will happen once the UK ETS isclosed. Clearly, it is not desirable to havetechnologies ready to be implemented in the UK,yet no policy or financial drivers to encourage thisuntil methane can be traded on the EU ETS in2008. An interim policy measure is required toreward any greenhouse gas emission abatementthat occurs in the period to 2008. However, iftrading of these emissions is to continue in thefuture, any measures must ensure that themethane reductions can still be classed asadditional.
Coal mine methaneA major issue for this sector is emissions fromabandoned mines. Estimates of these emissionsvary by a factor of 10 and so could represent asignificant, but unrecognised, source of methaneemitting to the atmosphere. Reliable inventoryinformation and international agreement on howto classify methane from abandoned coal minesare a priority to put this source into perspectiveand assist in future policy decisions on its status.
Once a source is identified, coal mine methaneis straightforward to capture and therefore easilyquantified, making it an ideal candidate fortrading, as demonstrated by successful trading inthe UK ETS. Methane from both active andabandoned mines should be traded. The value ofcarbon credits should provide a sufficient driverfor investment in the capital equipment requiredto capture the coal mine methane. Without ROCs,there is currently little incentive to use thecaptured methane to generate electricity sinceflaring is the cheapest option and all that isrequired for trading (the trading valuedetermined by offsetting the methane savedagainst the carbon dioxide produced). Flaring isalso the method favoured by present policy, whichfocuses on the most cost-effective control ofemissions from active mines. Environmentally,
energy recovery is the preferred choice, but thisrequires more active support from theGovernment.
As with emissions from oil and gas rigs, oncethe UK ETS has closed, it is recommended thatinterim support policies are introduced to supportemissions reductions until methane trading isincorporated into the EU ETS. Once again, thesemeasures must ensure that any methanereductions can still be classed as additional iftrading is to occur in the future.
9.5 ConclusionsReductions in methane emissions represent arapid and cost-effective option for loweringgreenhouse gas emissions. It is essential thatthese reductions are realised now, beforeatmospheric concentrations of methane rise andits potency increases.
Although methane trading is at first sight ahighly attractive option for mitigating methaneemissions, in practice most methane generatingsectors are excluded due to other policyinstruments (no additionality), other economicdrivers (more attractive), small players (reducesliquidity) and poor quantification of emissions(introduction of hot air). Only coal mine methaneand emissions from oil and gas rigs are currentlyviable sectors for exploiting the methane tradingopportunity and this is dependent onincorporation into the European EmissionsTrading Scheme in 2008.
A synergistic package of polices is required ineach sector to secure the significant potentialreductions and in nearly all cases improved datacollection is necessary. Technologicaldevelopment and social and economic policy allhave an integrated role to play. Methaneabatement has been overlooked in the past, but itis a crucial component in mitigating climatechange and should be an early focus of anystrategy to reduce greenhouse gas emissions.

78 Glossary
Abandoned coal mines Mines which are no longer being mined for coalAbatement A reduction in the amount or intensity of emissionsActive coal mines Mines which are still operative and producing coal, either deep mines or
open castAdditionality A requirement that emissions reductions associated with a greenhouse
gas mitigation project must exceed those that would have occurred in theabsence of the project
Aerobic In the presence of, or requiring, oxygenAllowances The right to emit a quantity of a pollutant under an emissions trading
schemeAnaerobic In the absence of oxygenAnthropogenic Made by humans or resulting from human activityBaseline-and-credit system A market-based approach which allocates a pre-determined emissions
profile to each participant and allows trade in the unused portion of thatprofile
Bedrock The solid rock that underlies soil and other loose materialBiodegradable Material that can be broken down by micro-organisms into simpler
compounds Biogas A combustible gas created by the anaerobic decomposition of organic
material, composed primarily of methane, carbon dioxide and hydrogensulphide. This can be produced at landfill sites, wastewater treatmentfacilities and animal waste treatment facilities
Biogasification The breakdown of complex biological materials by anaerobic bacteria tomore useful forms of fuel: carbon dioxide and methane
Biogenic Produced by the action of living organisms or biological processesBiomass Plant-based materials that can be burned to produce energy or converted
into a gas and used for fuelBSE Bovine Spongiform Encephalopathy is a chronic progressive degenerative
disease affecting the central nervous system of adult cattle, also knownas Mad Cow Disease
Calorific value The heat produced by the complete combustion of a given quantity offuel under specific conditions, measured in calories. The calorific value ofhousehold waste is about one-third that of coal
Cap-and-trade system A market-based approach where a cap, or maximum limit, is set onemissions and sources covered by the system receive authorisations toemit in the form of emissions allowances, with the total amount ofallowances limited by the cap
Capping layer An impermeable layer of clay or artificial membrane near the surface of alandfill site forming a barrier between the contaminated material and theatmosphere. The cap is designed to keep water out (to prevent leachateformation) and also helps to capture landfill gas
Glossary

79 Glossary
Carbon credits An amount of carbon that has been mitigated by a project that can thenbe used as a tradable commodity to offset greenhouse gas emissions
Carbon cycle The exchange of carbon in various forms (carbon dioxide, carbonates,organic compounds etc.) between the atmosphere, ocean, terrestrialbiosphere and geological deposits
CDM The Clean Development Mechanism is a market mechanism defined inthe Kyoto Protocol (Article 12) as a project between a developed countryand a developing country that provides the latter with the financing andtechnology for sustainable development, and assists in achievingcompliance with its emission reduction commitments
Clear Skies Programme UK capital grant scheme for promoting renewable energy technologiesincluding solar thermal, biomass boilers and heat pumps
Climate change A long-term change in temperature, precipitation, wind and all otheraspects of the earth’s climate due to natural or human activity. Climatechange is defined by the United Nations Framework Convention onClimate Change as “a change of climate which is attributed directly orindirectly to human activity that alters the composition of the globalatmosphere and which is in addition to natural climate variabilityobserved over comparable time periods”
Co-firing The use of two or more different fuels (e.g. wood and coal)simultaneously in the combustion chamber of a power plant
Composting Biological decomposition of organic materials in the presence of oxygenby bacteria, fungi and other organisms into a soil-like product calledhumus
Condensate A light liquid hydrocarbon produced when hydrocarbon vapours arecooled
Digesta Intestinal contentsDigestate The solid residue produced in an anaerobic digester, similar to compost.
The digestate usually requires stabilisation by composting before asaleable product can be produced
Dioxins Highly toxic compounds that are a by-product of incineration of plastics.Also generated by bush fires, volcanoes and vehicle emissions
Direct emissions Greenhouse gas emissions by an entity from sources owned or controlledby that entity
Energy recovery The process of extracting useful energy from waste, typically electricity orheat (or both)
Enhanced greenhouse effect The increase in the natural greenhouse effect through increasedconcentrations of greenhouse gases as a result of human activities
Enteric fermentation A digestive process of some mammals by which carbohydrates are brokendown by micro-organisms into simple molecules to aid absorption intothe bloodstream

80 Glossary
Eutrophication The process by which water becomes enriched with plant nutrients, mostcommonly phosphates and nitrates. This promotes algae growth which,when it dies, can lead to the depletion of dissolved oxygen, killing fish andother aquatic organisms. While eutrophication is a natural, slow-agingprocess for a body of water, human activities can greatly accelerate theprocess
Feed-in tariffs A form of support for electricity generated from renewable sources.Typically a premium price is paid to generators of green electricity
Financial derivatives A risk-shifting agreement, the value of which is derived from the value ofan underlying asset. The underlying asset could be a physical commodity,an interest rate, a company’s stock, a stock index, a currency, or virtuallyany other tradable instrument upon which two parties can agree
Flange A device to connect a pipe to another pipe, a valve or other piece ofequipment, and maintain a seal
Foot and Mouth disease An acute contagious viral disease of cloven-footed animals (e.g. cattle,sheep, goats, pigs) marked by ulcers in the mouth and around the hoofs
Fossil fuel Naturally occurring carbon or hydrocarbon fuel (e.g. coal, natural gas andoil) formed by the decomposition of ancient animal and plant remainsformed over millions of years
Gate fee The fee, usually quoted in £ per tonne, for processing waste at atreatment and/or disposal facility
Global warming The rise in temperature of the earth’s surface due to the enhancedgreenhouse effect
Global Warming Potential A measure of the relative strengths of different greenhouse gases.Defined as the cumulative radiative forcing of the gas compared tocarbon dioxide over a specified time horizon (usually 100 years)
Grandfathering A method of centrally allocating emissions allowances, usually based onhistorical emissions
Greenhouse effect An increase in the earth’s temperature caused when the atmospheretransmits incoming solar radiation but blocks outgoing thermal radiation,primarily due to the presence of carbon dioxide and water vapour in theatmosphere
Greenhouse gas An atmospheric gas that has the ability to absorb infrared radiation,contributing to the greenhouse effect (e.g. water vapour, carbon dioxide,methane)
Heat exchange The transfer of energy between two substances at different temperatures,providing required heating or cooling
Heavy metals Metallic elements with high atomic weights that can damage livingthings at low concentrations and tend to accumulate in the food chain(e.g. mercury, chromium, cadmium, arsenic, and lead)
Hot air Emissions reductions against a target that occur without any dedicatedabatement actions (e.g. due to economic downturn or prior legislation)

81 Glossary
Hydrolysis Reaction of a chemical compound with waterHydroxyl radical A highly reactive molecule containing one oxygen and one hydrogen
atom responsible for the removal of many trace pollutants from theatmosphere
Indirect emissions Emissions that result from the activity of an entity but are produced by asource external to the entity. For example, emissions occur becausehouseholds use electricity, but the source of the emissions is a powerstation, not the house
JI Joint Implementation is a mechanism of the Kyoto Protocol where adeveloped country can receive carbon credits when it helps to financeprojects that reduce net emissions in another developed country(including countries with economies in transition)
Leachate A liquid that results from water collecting contaminants as it tricklesthrough wastes, agricultural pesticides or fertilizers and may result inhazardous substances entering surface water, groundwater or soil
Lifetime The approximate amount of time a gas is present in the atmospherebefore being removed from the atmosphere by conversion to anotherchemical compound or via a sink
Liquid market A market where buying and selling can be accomplished with ease due tothe presence of a large number of interested buyers and sellers preparedto trade substantial quantities at small price differences
Liquidity The ease with which an asset can be converted to cashMethanogenesis The production of methane and carbon dioxide by biological processes
carried out by single-celled micro-organisms called methanogens Methanogenic Methanogenic micro-organisms produce methane and carbon dioxide by
the fermentation of simple organic compounds or the oxidation ofhydrogen under anaerobic conditions
Methanotroph An aerobic bacterium with the ability to utilise methane as sole carbonand energy source
Mitigation Steps taken to avoid or minimise a negative environmental impact. Thismight include minimising, rectifying, reducing or compensating for theimpact
Montreal Protocol An international agreement to limit further damage to the ozone layer bydrastically reducing the production and consumption of ozone-depletingsubstances (e.g. chlorofluorocarbons, halons, carbon tetrachloride). Thetreaty was signed in 1987 and substantially amended in 1990
Natural Gas STAR Programme A USA voluntary initiative which aims to encourage natural gascompanies to adopt ‘best management practices’ that can profitablyreduce emissions of methane
Perturbation lifetime A measure of the lifetime of a gas that includes its influence on otheratmospheric species that occurs during its physical lifetime.

82 Glossary
Potency (of a greenhouse gas) The capacity of a gas to absorb and radiate heat energy over a specifiedperiod of time
Radiative forcing A change, over time, in the balance between incoming solar radiation andoutgoing infrared radiation, due to natural or anthropogenic causes.Positive radiative forcing warms the earth’s surface whilst negativeforcing cools
Recycling The series of activities by which waste materials are collected, sorted,processed and converted into raw materials for use in the manufacture ofnew products
Renewable energy Energy obtained from sources which are essentially inexhaustible.Renewable sources include hydroelectric power, wood (biomass),geothermal, wind, photovoltaic and some waste
Ruminant An animal that chews its cud, has even-toed hooves and a multi-chambered stomach (e.g. cattle, sheep, goats, deer)
Termite A soft-bodied ant-like insect which feeds on woodVolatile organic compounds Hydrocarbon based compounds that evaporate rapidly at ambient
temperatures. These chemicals are often used as solvents and many arehazardous air pollutants such as benzene
Wetlands Areas that are inundated or saturated by surface water or ground waterat a frequency and duration sufficient enough to support vegetationadapted for life in saturated soil conditions. Wetlands generally includeswamps, marshes, fens, bogs and similar areas

83 References
1. Houghton, J. T.; Ding, Y.; Griggs, D. J.; Noguer,M.; van der Lindin, P. J.; Dai, X.; Maskell, K. andJohnson, C. A., “Climate Change 2001: TheScientific Basis. Contribution of Working GroupI to the Third Assessment Report of theIntergovernmental Panel on Climate Change”,Cambridge University Press, Cambridge, UK,2001.
2. Houghton, J. T.; Meira Filho, L. G.; Callander, B.A.; Harris, N.; Kattenberg, A. and Maskell, K.,“Climate Change 1995 – The Science of ClimateChange”, University Press, Cambridge, 1996.
3. Reilly, J.; Prinn, R.; Fitzmaurice, J.; Jacoby, H.;Kicklighter, D.; Melillo, J.; Stone, P.; Sokolov, A.and Wang, C., “Multi-gas assessment of theKyoto Protocol”, Nature, 401, 1999.
4. de la Chesnaye, F.; Harvey, R.; Kruger, D. andLaitner, J. A., “Cost-effective Reductions of non-CO2 Greenhouse Gases”, Energy Policy, 29, 1325,2001.
5. Houghton, J. T.; Meira Filho, L. G.; Lim, B.;Treanton, K.; Mamaty, I.; Bonduki, Y.; Griggs, D.J. and Callender, B. A., “Revised 1996 IPCCGuidelines for National Greenhouse GasInventories”, IPCC/OECD/IEA, 1996.
6. Manne, A. S. and Richels, R. G., “An alternativeapproach to establishing trade-offs amonggreenhouse gases”, Nature, 410, 675, 2001.
7. Manne, A. S.; Mendelsohn, R. and Richels, R. G.,“MERGE – A model for evaluating regional andglobal effects of GHG reduction policies”,Energy Policy, 23, 17, 1995.
8. “Our Energy Future – Creating a Low CarbonEconomy”, DTI, 2003.
9. “UK International Priorities – The EnergyStrategy”, Foreign and Commonwealth Office,2004.
10. “UK’s Renewables Policy”, Restats., 2004. Citedfromwww.restats.org.uk/UK_renewable_policy.html
11. “3NC: The UK’s Third National Communicationunder the United Nations FrameworkConvention on Climate Change”, DEFRA, 2001.
12. El-Fadel, M.; Zeinati, M.; Ghaddar, N. andMexher, T., “Uncertainty in Estimating and
Mitigating Industrial related GHG Emissions”,Energy Policy, 29, 1031, 2001.
13. Lim, B.; Boileau, P.; Bonduki, Y.; van Amstel, A.R.; Janssen, L. H. J. M.; Olivier, J. G. J. and Kroeze,C., “Improving the Quality of NationalGreenhouse Gas Inventories”, EnvironmentalScience and Policy, 2, 335, 1999.
14. Fung, I. J.; John, J.; Lerner, J.; Matthews, E.;Prather, M.; Steele, L. P. and Fraser, P. J., “Three-Dimensional Model Synthesis of the GlobalMethane Cycle”, J. Geophys. Res., 96, 13033,1991.
15. Hein, R.; Crutzen, P. J. and Heinmann, M., “Ininverse modelling approach to investigate theglobal atmospheric methane cycle”, GlobalBiochem. Cycles, 11, 43, 1997.
16. Lelieveld, J.; Crutzen, P. J. and Dentener, F. J.,“Changing concentration lifetime and climateforcing of atmospheric methane”, Tellus, 50 B,128, 1998.
17. Houweling, S.; Kaminski, T.; Dentener, F. J.;Lelieveld, J. and Heimann, M., “Inversemodelling of methane sources and sinks usingthe adjoint of a global transport model”, J.Geophys. Res., 104, 26137, 1999.
18. Mosier, A. R.; Duxbury, J. M.; Freney, J. R.;Heinemeyer, O.; Minami, K. and Johnson, D. E.,“Mitigating agricultural emissions ofmethane”, Climate Change, 40, 39, 1998.
19. Olivier, J. G. J.; Bouwmann, A. F.; Berdowski, J. J.M.; Veldt, C.; Bloos, J. P. J.; Visschedijk, A. J. H.;van der Maas, C. W. M. and Zasndveld, P. Y. J.,“Sectoral emissions inventories of greenhousegases for 1990 on a per country basis as well ason 1x1”, Environmental Science and Policy, 2,2741, 1999.
20. Cao, M.; Gregson, K. and Marshall, S., “Globalmethane emission from wetland and itssensitivity to climate change”, AtmosphericEnvironment, 32, 3293, 1998.
21. Khalil, M. A. K., “Atmospheric Methane: Its RoleIn The Global Environment”, 2000.
22. Martius, C.; Fearnside, P. M.; Bandeira, A. G. andWassmann, R., “Deforestation and methanerelease from termites in Amazonia”,Atmospheric Environment, 31, 1997.
References

84 References
23. Matthews, R. and Wassmann, R., “Modellingthe Impacts of Climate Change and MethaneEmission Reductions on Rice Production: AReview”, European Journal of Agronomy, 1,2003.
24. Le Mer, J. and Roger, P., “Production, Oxidation,Emission and Consumption of Methane BySoils: A Review”, European Journal of SoilBiology, 37, 25, 2001.
25. “Waste Treatment and Disposal”, NationalAtmospheric Emissions Inventory. 2004. Citedfromhttp://www.aeat.co.uk/netcen/airqual/naei/annreport/annrep99/app1_211.html
26. “Options To Reduce Methane Emissions – FinalReport”, AEA Technology Environment, 1998.
27. Wuebbles, D. J. and Hayhoe, K., “AtmosphericMethane and Global Change”, Earth-ScienceReviews, 57, 177, 2002.
28. Lee, S. Y. and Holder, G. D., “Methane HydratesPotential As A Future Energy Source”, FuelProcess Technology, 71, 181, 2001.
29. Max, M. and Lowrie, A., “Oceanic MethaneHydrates: A Frontier Gas Resource”, Journal OfPetroleum Geology, 19, 41, 1996.
30. Thomas, D. J.; Zachos, J. C.; Bralower, T. J.;Thomas, E. and Bohaty, S., “Warming The FuelFor The Fire: Evidence For The ThermalDissociation Of Methane Hydrate During ThePaleocene-Eocene Thermal Maximum”,Geology, 30, 1067, 2002.
31. Open University. 2001. Cited from http://eeru-www.open.ac.uk/natta/natta-guide.html
32. Fawcett, T.; Hurst, A. and Boardman, B., “carbonuk”, ECI, University of Oxford, 2002.
33. “Methane from abandoned coal mines – asolution for controlling emissions”, DTI, 2004.
34. Warneck, P., “Chemistry of the NaturalAtmosphere”, Academic Press Inc. (London),London, 1988.
35. Coase, R. H., “The Problem of Social Cost”,Journal of Law and Economics, 3, 1, 1960.
36. Dales, J. H., “Pollution, property and prices: Anessay in policy-making and economics”,University of Toronto, 1968.
37. Lee, D., Manchester Metropolitan University,personal communication, 2004.
38. Kolstad, C., “Environmental Economics”, OxfordUniversity Press, Oxford, 2000.
39. Tietenberg, T., “Environmental and NaturalResource Economics”, Addison-WesleyEducational Publishers, Reading,Massachusetts, 1996.
40. Atkinson, T., “From concept to reality”,Environmental Finance, 3, 36, 2002.
41. Lecocq, F. and Capoor, K., “State and Trends ofthe Carbon Market 2003”, World Bank, 2003.
42. Tietenberg, T., “Emissions tradingprogrammes”, Ashgate, Aldershot, 2000.
43. van der Gaast, W., “European Emissions Trading2003 report on Oil and Gas”, Emissions Trading2003, Crown Plaza, Brussels, 2003.
44. “UK ETS Transaction Log”, DEFRA. Cited fromwww.defra.gov.uk/environment/climatechange/trading/reports/download/uketr_transactionlog.pdf
45. “UK Emissions Trading off to a flying start”,DEFRA. 2003. Cited fromhttp://www.defra.gov.uk/news/2003/030512a.htm
46. “Commentary on Preliminary 1st Yr results and2002 Transaction log”, DEFRA. 2003. Cited fromhttp://www.defra.gov.uk/environment/climatechange/trading/pdf/ets-commentary-yr1.pdf
47. Turner, G., “A Qualitative Study of the DirectEntry UK Emissions Trading Scheme”, EnvirosConsulting Ltd., 2003.
48. “Delay to pilot project entry route into the UKEmissions Trading Scheme.” DEFRA. 2003. Citedfromhttp://www.defra.gov.uk/environment/climatechange/trading/pilotprojects.htm
49. “EU parliament launches climate emissionstrading”, Planet Ark. 2003. Cited fromhttp://www.planetark.com/dailynewsstory.cfm/newsid/21371/story.htm
50. “EU CO2 market trades over 250,000 tonnes inone day”, Point Carbon. Cited fromhttp://www.pointcarbon.com/article.php?articleID=4750&categoryID=147
51. Sorrell, S. and Smith, A., “Policy additionalityfor UK emissions trading projects”, Science andTechnology Policy Research, 2002.

85 References
52. “Carbon Market Forecasting, Europe Weekly”,Point Carbon. 2002. Cited fromhttp://www.pointcarbon.com/wimages/1044699768_EU_Weekly_09_December_2002.pdf
53. Atkinson, T., Natsource, personalcommunication, 2003.
54. Blunt, J. and Lyall, D., Spectron, personalcommunication, 2003.
55. Radov, D. and Klevnäs, P., “Review of the Firstand Second Years of the UK Emissions TradingScheme”, DEFRA, 2004.
56. “Oversupply cripples UK emissions market”,ENDS Report, 2003.
57. “Audit office probes emissions trading scheme”,ENDS Report, 2003.
58. “Carbon Market Europe 15 August 2003”, PointCarbon. 2003. Cited fromhttp://www.pointcarbon.com/wimages/Carbon_Market_Europe_15_August_2003.pdf
59. Palmisano, J., “Managing Business RisksAssociated with Accelerated Climate Change”,Evolution Markets LLC, 2001.
60. O’Brien, P. and Vourc’h, A., “EncouragingEnvironmentally Sustainable Growth:Experience from OECD Countries”, OECD, 2001.
61. “Collaborating to build an internationalstandard for measuring and reporting businessgreenhouse gases”, WBCSD and WRI, 2002.
62. National Atmospheric Emissions Inventory.Cited fromhttp://www.naei.org.uk/reports.php
63. Baggott, S.; Brown, L.; Milne, R.; Murrells, T.;Passant, N. and Watterson, J., “UK GreenhouseGas Inventory 1990 to 2002: Annual Report forsubmission under the Framework Conventionon Climate Change”, AEA Technology, 2004.
64. Sage, P. W., “Methane From Abandoned CoalMines in the UK”, AEA Technology, 2001.
65. “E-Digest of Environmental Statistics”, DEFRA,2003. Cited from http://www.defra.gov.uk/environment/statistics/index.htm
66. Salway, A. G.; Murrells, T. P.; Milne, R. and Hidri,S., “Greenhouse Gas Inventories for England,Scotland, Wales and Northern Ireland: 1990,1995, 1998 to 2000”, AEA Technology, 2003.
67. Salway, A. G.; Murrells, T. P.; Milne, R. and Ellis,S., “UK Greenhouse Gas Inventory, 1990 to2000: Annual Report for Submission under theFramework Convention on Climate Change”,AEA Technology, 2002.
68. Salway, A. G.; Murrells, T. P.; Milne, R. and Ellis,S., “UK Greenhouse Gas Inventory, 1990 to2001: Annual Report for Submission under theFramework Convention on Climate Change”,AEA Technology, 2003.
69. Sykes, V. and Archer, G., “Projections of Non-CO2 Greenhouse Gas Emissions for the UK andConstituent Countries”, WS AtkinsEnvironment, 2000.
70. “The Waste Management Market ResearchReport”, AMA Research, 2003.
71. “The Competitiveness of the WasteManagement Industry”, DTI Energy Policy andAnalysis Unit, 1997.
72. “Waste Online: Your source of wasteinformation”, 2003. Cited fromhttp://www.wasteonline.org.uk/
73. “Waste and Recycling”, DEFRA, 2001.74. Redfern, A. and Lawrence, T., “Environment in
your pocket 2002”, DEFRA, 2002.75. Riemer, P., “Technologies For The Abatement Of
Methane Emissions”, IEA Greenhouse Gas R&DProgramme, 1999.
76. Ong, S. K., 2003. Cited fromhttp://www.public.iastate.edu/~skong/Courses/CE527/Lecture%20Notes/CE527%20-%20Lect6-Gas%20Prod-Stu.doc
77. Brown, K. A.; Smith, A.; Burnley, S. J.; Campbell,D. J. V.; King, K. and Milton, M. J. T., “MethaneEmissions from UK Landfills”, AEA TechnologyEnvironment, 1999.
78. “A safe and responsible waste managementoption”, Waste and Recycling Group, 2003.
79. “A study to estimate the disamenity costs oflandfill in Great Britain”, DEFRA, 2003.
80. “Making waste work: A strategy for sustainablewaste management in England and Wales”,Department of the Environment and WelshOffice, 1995.
81. Brodersen, J.; Juul, J. and Jacobsen, H., “Reviewof selected waste streams: sewage sludge,

86 References
construction and demolition waste, waste oils,waste from coal-fired power plants andbiodegradable municipal waste”, EEA, 2002.
82. “Limiting Landfill”, DETR, 1999.83. “Biodegradable waste strategy for Northern
Ireland”, Environment and Heritage Service,2003.
84. “EU Landfill Directive and Waste Strategy: FactSheet”, Friends of the Earth, 2002. Cited fromhttp://www.foe.co.uk/resource/factsheets/eu_landfill_directive.pdf
85. “Wise about Waste. The National WasteStrategy for Wales.” Welsh AssemblyGovernment, Environmental ProtectionDivision, 2002.
86. “Municipal Waste Management Survey2002/03”, DEFRA, 2004.
87. Powell, J., “The Development of a sustainableand effective waste management policy for theUK”, Centre for Social and Economic Researchon the Global Environment (CSERGE),University of East Anglia, 2002.
88. Georgeson, R., “Inquiry into the operation ofthe landfill tax. Memorandum submitted tothe Environment, Transport and RegionalAffairs Committee, Environment sub-committee”, Waste Watch. 1999. Cited fromwww.wastewatch.org.uk/policy/downloads/landtax.htm
89. “The Chancellor’s Theme: Building a Britain ofEconomic Strength and Social Justice”, Gardinerand Theobald. 2003. Cited fromhttp://www.gardiner.com/Costdata/images/Budget2003.pdf
90. “Annual Report and Accounts 2001/2”, HerMajesty Customs and Excise, 2002.
91. “Municipal Waste Management Statistics.Waste and Recycling Bulletin”, DEFRA. 2003.Cited fromhttp://www.defra.gov.uk/environment/statistics/wastats/bulletin/index.htm
92. “Review of UK Landfill Tax”, DEFRA, 2002.93. “Resource Productivity, Waste Minimisation and
the Landfill Tax”, DEFRA DTI, 2001.94. “Press Release: Recycling & Budget 2003:
Missed Opportunity”, Friends of the Earth.2003. Cited fromhttp://www.foe.co.uk/resource/press_releases/recycling_budget_2003_miss.html
95. “Environment Audit Committee: Pre-BudgetReport. Fourth Report of Session 2002-3.”House of Commons, 2002.
96. “Waste not, Want not. A Strategy for tacklingthe waste problem in England.” Strategy Unit,Cabinet Office, 2002.
97. “Waste Strategy 2000 for England and Wales”,DETR, 2000.
98. “Effects of Landfill Tax – Reduced Disposal ofInert Wastes to Landfill”, ECOTEC Research andConsulting, 2000.
99. “Municipal Waste Management 1995/6”, DETR,1997.
100. “Landfill Directive briefing paper”, DEFRA.2002. Cited fromhttp://www.defra.gov.uk/environment/waste/topics/landfill-dir/pdf/landfilldir.pdf
101. “An Introduction to Household WasteManagement”, DTI, 1998.
102. “Landfill, Landfill Gas”, EnvironmentalServices Association Ltd., 2002.
103. “Landfill: Information Sheet”, ResiduaLimited, 2000.
104. “The Renewables Obligation Order”, No. 914,2002.
105. Janes, M.; Achur, J.; Martyn, R.; Smithers, D.and Sarjantson, C., “Digest of UnitedKingdom Energy Statistics 2004”, DTI, 2004.
106. Barlaz, M. A.; Gabr, M. A.; Hossan, S.; Rooker,A. and Kjeldsen, P., “Closing Gaps in theRegulation of MSW Landfills: Defining the Endof the Post-Closure Monitoring Period and theFuture Stability of Leachate RecirculationLandfills”, Waste Tech 2001, San Diego, 2001.
107. Janes, M., personal communication, 2003.108. “NFFO Fact Sheet 11: Renewables Obligation
Status update”, DTI, 2002.109. Slater, R.; Frederickson, J. and Gilbert, E., “The
State of Composting 1999. Results of theComposting Association’s survey of UKcomposting and collection systems in 1999”,The Composting Association, 2001.

87 References
110. “Composting Doubles in Two Years”, ENDSReport, 347, 14, 2003.
111. “The Producer Responsibility Obligations(Packaging Waste) Regulations 1997”, No. 648,1997.
112. “Newsprint and the Environment”, TheNewspaper Society. Cited fromhttp://www.newspapersoc.org.uk/default.asp?cid=482
113. “Energy Trends”, DTI. 2004. Cited fromhttp://www.dti.gov.uk/energy/inform/energy_trends/jun_04.pdf
114. “Waste Management Paper No. 1 – A Reviewof Options: A memorandum providingguidance on the options available for wastetreatment and disposal”, Department of theEnvironment, 1992.
115. Petts, J., “Incineration as a WasteManagement Option. In Hester RE andHarrison RM (Eds.) Waste Incineration and theEnvironment”, Royal Society of Chemistry,1994.
116. “Digest of Environmental Statistics”, DEFRAand Welsh Assembly. 2003. Cited fromhttp://www.defra.gov.uk/environment/statistics/des/waste/download/xls/watb03.xls
117. Williams, P., “Waste Treatment and Disposal”,John Wiley and Sons, Chichester, 1998.
118. “Encyclopedia of the AtmosphericEnvironment: Sustainability, Waste Disposal”,Atmosphere, Climate & EnvironmentInformation Programme. 2000. Cited fromwww.doc.mmu.ac.uk/aric/eae/Sustainability/Older/Waste.html
119. Shanks, personal communication, 2003.120. “DEFRA gears up for launch of landfill trading
scheme”, ENDS, 344, 2003.121. Reay, D. S., “Methane Production and
Theoretical Consumption in UK LivestockProduction: Is a Realistic Balance Possible?”,Chemosphere – Global Change Science, 3,419, 2001.
122. “Agricultural Emissions”, NationalAtmospheric Emissions Inventory. 2004. Citedfrom http://www.aeat.co.uk/netcen/airqual/naei/annreport/annrep99/app1_212.html
123. Campling, R. C.; Freer, M. and Balch, C. C.,“Factors affecting the voluntary intake offood by cows. 2. The relationship between thevoluntary intake of roughages, the amount ofdigesta in the reticulo-rumen and the rate ofdisappearance of digesta from the alimentarytract”, British Journal of Nutrition, 15, 531,1961.
124. Dougherty, R. W.; Mullenaux, C. M. andAllison, M. J., “Physiology of Digestion in theRuminant”, Butterworth, London, 1965.
125. “Cow Power”, Evergreen Online. 2002. Citedfromhttp://www.cesul.org.uk/eg/egjunjul02.htm
126. The Times, 30 April 2004.127. “Common Agricultural Policy (CAP): from
creation to the present day. Reform of theCommon Agricultural Policy.” DEFRA. 2003.Cited fromhttp://www.defra.gov.uk/farm/capreform/
128. “Decoupling direct payments in the uk: somekey research findings”, DEFRA. 2003. Citedfromhttp://statistics.defra.gov.uk/esg/reports/decoupling/dcplgsummary.PDF
129. Moss, J.; McErlean, S.; Kostov, P.; Patton, M.;Westhoff, P. and Binfield, J., “Analysis of theimpact of decoupling on agriculture in theUK”, Department of Agricultural and FoodEconomics, Queen’s University Belfast andFood and Agricultural Policy ResearchInstitute, University of Missouri, 2002.
130. Revell, B. and Oglethorpe, D., “Decoupling andUK agriculture: An appraisal of the impact onthe livestock sector”, DEFRA, 2003.
131. “CAP reforms benefit farmers and consumers.Press release, Representation in the UnitedKingdom”, European Commission. 2003. Citedfromhttp://www.cec.org.uk/press/pr/pr03/pr0306.htm
132. Moore, S.; Freund, P.; Riemer, P. and Smith, A.,“Abatement of Methane Emissions”, IEAGreenhouse Gas R&D Programme, 1998.
133. “UKOOA Education Information Leaflets: FactSheet 4 – North Sea Oil – Some Questions

88 Glossary
Answered”, United Kingdom OffshoreOperators Association. 2002. Cited fromhttp://www.ukooa.co.uk/education/leaflets/sheet004.htm
134. Ferdinando, G., BP, personal communication,2004.
135. Meacher, M., “Commons Hansard WrittenAnswers text for Tuesday 3 Jun 2003”, TheUnited Kingdom Parliament, House ofCommons, 2003.
136. “Climate Change: The UK Programme”, DETR,UK, 2000.
137. “Emissions Trading”, BP Amoco. 2004. Citedfromhttp://www.bp.com/sectiongenericarticle.do?categoryId=2011563&contentId=2016953
138. “Internal Trading”, CO2e. 2002. Cited fromhttp://www.co2e.com/strategies/AdditionalInfo.asp?PageID=275
139. “The Natural Gas STAR Program”, US EPA.2003. Cited fromhttp://www.epa.gov/gasstar/pdf/booklet.pdf
140. Bibler, C. J.; Marshall, J. S. and Pilcher, R. C.,“Status of Worldwide Coal Mine MethaneEmissions and Use”, International Journal ofCoal Geology, 35, 283, 1998.
141. Sage, P. W., “Methane From Abandoned CoalMines in the UK”, AEA Technology, 2002.
142. “Environmental Benefits from CMM capture”,House of Commons Select Committee onEnvironmental Audit. 2002. Cited fromhttp://www.publications.parliament.uk/pa/cm200102/cmselect/cmenvaud/582/582ap04.htm
143. Burrell, R.; Kershaw, S.; Whitworth, K.; Guest,J.; Soffe, P.; Bouillé, A. and Johns, J., “Coal MineMethane – Review of the mechanisms forcontrol of emissions”, DTI, 2004.
144. “CMM operators condemn failings of DTIstudy”, ACCMO. 2004. Cited fromhttp://www.acmmo.org/PDF/cmmcondem.PDF
145. “Coal Mine and Coal Bed Methane”, The CoalAuthority. 2001. Cited fromhttp://www.coal.gov.uk/resources/CoalMineandbedmethane.cfm
146. “Coal Mine Methane Activity Within The UK”,The Coal Authority. 2004. Cited fromhttp://www.coal.gov.uk/resources/cleanercoaltechnologies/coalminemethaneukactivity.cfm
147. ACMMO, “Coal mine methane and coalfieldcommunity regeneration”, House ofCommons: Office of the Deputy PrimeMinister: Housing, Planning, LocalGovernment and the Regions Committee.2002. Cited fromhttp://www.publications.parliament.uk/pa/cm200203/cmselect/cmodpm/1169/1169we55.htm
148. “Ventilation Air Methane”, US EPA Coal BedMethane Outreach Program. 2004. Citedfromhttp://www.epa.gov/cmop/vam/whatisvam.html
149. “Assessment of the Worldwide MarketPotential for Oxidising Coal Mine VentilationAir Methane”, US EPA Coalbed MethaneOutreach Program, 2003.
150. “Alkane scraps methane mining plans”, PointCarbon. 2004. Cited fromhttp://www.pointcarbon.com/article.php?articleID=4581&categoryID=147
151. “Mixed Reception for Exemptions to ClimateChange Levy Green Fuel”, Daily Telegraph,18th April 2002.
152. “The Climate Change Levy (Electricity andGas) Regulations 2001”, No. 1136, 2001.
153. “Guidelines for the measurement andreporting of Emissions by direct participantsin the UK Emissions Trading Scheme”, DEFRA,2003.
154. “Impact of EU Landfill Directive and NationalStrategies on UK Greenhouse Gas Emissions”,Final Draft Report, ERM, July 2003.
155. “Methane Emissions from Landfill Sites in theUK”, Final Report, LQM Ltd, January 2003.
156. Gronow, J. personal communication, 2005.

89 Appendix 1
Tropospheric oxidationThe predominant mechanism for removal ofmethane from the earth’s atmosphere isoxidation within the troposphere by the hydroxyl(OH) radical. The hydroxyl radical is responsiblefor the breakdown and removal of a host of tracegases, including methane, and for this reason isknown as the ‘cleanser of the atmosphere’. Inessence, atmospheric OH effects a lowtemperature combustion of ‘fuels’, such asmethane and other hydrocarbon species, byoxidising CH4 to CO2, as would happen if methanewere burned.
The chemistry of methane in the troposphereis very simple as it only reacts with the hydroxylradical and no other species. Methane ismoderately chemically inert and even thereaction with OH is slow compared to otherrelated hydrocarbons. However, whilst thereaction of CH4 and OH is in itself simple, thenetwork of inter-related chain reactions makesthe bigger picture somewhat more complex. Theremoval of CH4 from the atmosphere isintrinsically tied up with the chemistry of otherspecies, notably the hydroxyl radical, carbonmonoxide (CO), ozone (O3) and oxides of nitrogen(NO & NO2, termed NOx). Carbon monoxide andthe nitrogen oxides are known as ‘indirect’greenhouse gases because, although they are notactive greenhouse gases in themselves, theystrongly affect the concentrations of the majorgreenhouse gases, such as CH4, by eitherincreasing their lifetimes or controlling O3 and OHconcentrations.
The process of tropospheric oxidation ofmethane is complex, with numerous feedbackloops, as shown in Figure 23. Methane reacts withhydroxyl to form the methyl radical (CH3) andwater. The methyl radical undergoes furtherreactions to form either methyl hydroperoxide(CH3OOH) or formaldehyde (HCHO). Both thesespecies are soluble in water vapour and can beremoved from the atmosphere as rain.
Formaldehyde can also decompose in light toproduce carbon monoxide (CO).
The slowest step of the reaction overall, andtherefore the step that governs the speed of theentire reaction scheme, is the initial reactionbetween CH4 and OH. The rate of removal ofmethane from the atmosphere is dependent onboth the concentration of methane in theatmosphere and the concentration of thehydroxyl radical. An increase in methaneconcentration results in an increased rate ofremoval from the atmosphere, assuming OHconcentration remains constant. However,because of feedbacks in the above reaction
Appendix 1: The atmospheric chemistry ofmethane
Figure 23: Oxidation of methane in thetroposphere

90 Appendix 1
scheme and other reactions, the OH concentrationdoes not remain constant.
The initial reaction between CH4 and OHremoves one OH radical from the atmosphere forevery CH4 oxidised. Further steps in the reactionsequence generate NO2, which can create OHradicals, and CO, which can remove them. Overall,the influence of CO is the more important and sothe reaction scheme results in a net removal ofOH radicals. An increase in CH4 concentration willtherefore remove OH from the atmosphere andthereby slow its own removal. This increases theatmospheric lifetime and subsequentenvironmental impact of CH4. With methaneemissions predicted to continue increasing, thelifetime of CH4 in the atmosphere and thereforeits Global Warming Potential (GWP) is predictedto increase over the coming years.
Role of the hydroxyl radicalThe lifetime of methane is strongly tied to thechemistry and abundance of the hydroxyl radical,OH. Whilst feedback loops in the oxidation of CH4
affect the concentration of OH in the atmosphere,the influence of the so-called indirect greenhousegases CO and NOx is much more pronounced. Thechemistry of these species and their influence onOH concentrations in the troposphere is a majorfactor in the rate of removal of CH4 from theatmosphere. Sources and sinks of the hydroxylradical are shown in Figure 24.
Ozone is the main precursor of the hydroxylradical and is the ultimate source of all oxidisingreactions in the troposphere. Approximately 10%of ozone in the atmosphere resides in thetroposphere, generated by the action of light onNO2 and molecular oxygen (O2), or transferredfrom the stratosphere. The relative importance ofthese two formation pathways is still a matter ofsome debate, although it is now generally agreedthat the two sources are approximately equal.27
Increased anthropogenic NOx emissions willincrease tropospheric ozone concentrations andtherefore reduce CH4 concentrations in thetroposphere, at the expense of air quality.
Depletion of the ozone layer in the stratospherewill reduce the amount of ozone transferred intothe troposphere but will also allow more lightthrough, thereby increasing O3 production in thetroposphere from NO2.
Ozone decomposes in light (and in doing soabsorbs harmful uv radiation) and splits intomolecular oxygen and an oxygen atom. Theoxygen atom is electronically excited and hencehighly reactive (denoted by O*). This species canabstract a hydrogen atom from water yieldingtwo hydroxyl radicals. It is important to note thatthis process requires light and so OHconcentration in the atmosphere shows daily,seasonal and spatial variations in concentration.The rate of hydroxyl production is also dependenton atmospheric water vapour concentration.
As well as the important role OH plays ininitiating oxidation chains that remove methanefrom the atmosphere, it similarly removes othervolatile organic compounds (VOCs) and nitrogendioxide from the atmosphere. Other trace
Figure 24: Sources and sinks of the hydroxylradical

91 Appendix 1
species, such as HO2, can also be removed byreaction with the OH radical. However, the mainreaction that affects the concentration of OH inthe atmosphere is the reaction with carbonmonoxide, CO. This reaction is much more rapidthan the reaction between CH4 and OH, and COconcentrations are comparatively high. Thispathway is a significant mechanism for reducingOH concentrations in the atmosphere andsubsequently reducing the rate of methaneremoval from the troposphere. Approximately50% of CO in the troposphere is derived fromoxidation of methane and other VOCs, so anincrease in methane concentration causes anincrease in CO concentration which will in turndecrease the rate at which OH removes methane.These feedback loops are accounted for in theperturbation lifetime of 12 years for CH4.However, increased anthropogenic productionrates of CO have the potential to throw thissystem out of balance.
Stratospheric oxidationSome of the methane present in the tropospherepasses into the stratosphere. Approximately 40Mt of CH4 are oxidised in the stratosphere,representing around 7% of all CH4 removal. Thechemistry of methane in the lower stratosphere isidentical to that in the troposphere, with OHradicals oxidising CH4 in the same manner.Indeed, oxidation of methane to CO2 and water isthe source of approximately 50% of stratosphericwater vapour.
In the upper stratosphere, methanedecomposition can be initiated in two other ways;by reaction with chlorine radicals or excitedoxygen atoms. Ultraviolet light, which has highintensities in the stratosphere, causes thedissociation of a carbon chlorine bond, releasing achlorine radical.
CH3Cl CH3 + Cl
The chlorine radical may then react withmethane forming a methyl radical and hydrogenchloride.
Cl CH4 CH3 + HCl
Alternatively, uv light also causes thedissociation of ozone to yield an oxygen moleculeand an electronically excited (highly reactive)oxygen atom (O*).
O3 O3 + O*
The excited oxygen atom can also initiate theoxidation of methane, yielding a methyl radicaland a hydroxyl radical.
O* CH3 + OH
The reaction of CH4 with either Cl or O* yields amethyl radical, which undergoes subsequentreactions to form CO2 and H2O in the samemanner as in the troposphere (Figure 23). Theonly difference between the chemistry ofmethane in the upper stratosphere compared tothe troposphere and lower stratosphere lies in thepossibility of different chain initiation steps thatdo not rely on the hydroxyl radical.
The main sources of chlorine radicals aremethyl chloride (CH3Cl), trichlorofluoromethane(CFCl3), dichlorodifluoromethane (CF2Cl2), carbontetrachloride (CCl4) and 1,1,1–trichloroethane(CH3CCl3). Of these, only methyl chloride is ofnatural origin, the others are all man-madecompounds. These CFCs are responsible for thethinning of the ozone layer in polar regions andemissions are now strictly controlled under theMontreal Protocol. However, these species arelong lived in the atmosphere and will continue toexist in relatively high concentrations over thecourse of the next century.
Uptake by soilsApproximately 30 Mt of CH4 are removed fromthe atmosphere annually through uptake by soils.Soils contain populations of methanotrophicbacteria that can oxidise methane. These bacteriaare of two sorts: those that carry out high affinityoxidation and those that carry out low affinityoxidation.
‘High affinity oxidation’ is where
Light
Light

92 Appendix 1
methanotrophic bacteria consume methane thatis in low concentrations, close to that of theatmosphere (<12ppm). It is this process that actsas an atmospheric sink for CH4 from the globalatmospheric burden. The bacteria favour uplandsoils, in particular forest soils. The bacteriaresponsible for high affinity oxidation processesremain largely unknown. It is known, however,that high ammonium concentrations in soils leadto a loss of methanotrophic bacteria and asubsequent reduction in the rate of methaneoxidation. The use of artificial fertiliserscontaining ammonia is therefore detrimental tothe uptake of CH4.
‘Low affinity oxidation’ occurs wheremethanotrophic bacteria operate under methaneconcentrations considerably higher than in theatmosphere. These bacteria exist in wetlands,paddy fields and landfill site caps where there arehigh methane concentrations due to the presenceof methanogenic bacteria. Low affinity oxidationdoes not remove CH4 from the atmosphere and isnot included in the value of 30 Mt CH4 taken upby soils annually. However, becausemethanotrophic bacteria working under lowaffinity oxidation conditions absorb up to 90% ofthe CH4 produced by methanogenic bacteria inthe same environment, they significantly reduceCH4 emissions from these sources. These bacteriaare also highly susceptible to anthropogenicinfluences on their habitat, like land and watermanagement, use of chemical fertilisers andpesticides and soil acidity. Changes in CH4
emissions from paddy fields and other wetlandsmay be due to changes in the balance betweenmethanogenic and methanotrophic bacteria inthe environment.
Increases in atmospheric CH4 concentrationsmay inhibit the microbial uptake of CH4 in soilsvia a process that couples soil methane andammonia. However, the effect is expected to besmall, since the global sink strength for microbialuptake of CH4 by soils is only 30 Mt/yr.

Notes

Notes

Notes

disclosing information for consumer choice.Refocus: International Renewable Energy.Elsevier Publishing, UK. March 2003.
Lane, K (2003) Electricity labelling in the EU.European Council for and Energy EfficientEconomy, June 2003, France.
Lane, K (2003) Various sections in Gestion de lademande d’energie – dans le cadre des efforts aaccomplir par la Belgique pour reduire sesemissions de gaz a effet de serre. Report for theMinistry of Economic Affairs, Belgium.Fraunhofer Institute for Systems and InnovationResearch FhG-ISE, Karlsruhe, Germany.
Boardman, B and Fawcett, T (2002) Competitionfor the poor. Liberalistation of electricity supplyand fuel poverty: lessons from Great Britain forNorthern Ireland. Environmental ChangeInstitute, University of Oxford. ISBN:1 874370 32 X.
Gottschalg, R, Jardine, CN, Rüther, R, Betts, TR,Conibeer, GJ, Close, J, Infield, DG, Kearney, MJ,Lam, KH, Lane, K, Pang, H and Tscharner, R(2002) Performance of Amorphous SiliconDouble Junction Photovoltaic Systems inDifferent Climatic Zones, 29th IEEE Conferencefor Photovoltaic Specialists, New Orleans.
Jardine, CN, Betts, TR, Gottschalg, R, Infield, DGand Lane, K (2002) Influence of Spectral Effectson the Performance of Multi-junctionAmorphous Silicon Cells, PV in EuropeConference and Exhibition, Rome, 2002.
Jardine, CN and Lane, K (2002) PV-Compare:Relative Performance of PhotovoltaicTechnologies in Northern and Southern Europe,PV in Europe Conference and Exhibition, Rome,2002.
Jardine, CN and Lane, K (2002), PV-Compare: 18month’s green electricity from Begbroke, UK,Environmental Change Institute, University ofOxford.
Lane, K (2002) Scenario analysis. Chapter 6 ofLabelling and other measures for heatingsystems in dwellings. Final report. SAVE contract4.1031/Z/99-283, BRE, UK.
Recent publications
Fawcett, T, Hurst, A, and Boardman, B (2002)Carbon UK. Environmental Change Institute,University of Oxford. ISBN 1 874370 1.
Boardman, B (2004) Starting on the road tosustainability. Environmentally SustainableBuildings: Challenges and Policies. BuildingResearch and Information (May-June 2004)32(3), pp. 264-268.
Boardman, B (2004) Achieving energy efficiencythrough product policy: the UK experience.Environmental Science and Policy, 7(3), pp. 165-176.
Boardman, B (2004) New directions for householdenergy efficiency: evidence from the UK. EnergyPolicy, 32 (17), pp. 1921-1933.
Lane, K, Ürge-Vorsatz, D and Ritter, H (2004)Electricity disclosure: will it transform markets?Proceedings of American Council for an EnergyEfficient Economy, 2004.
Boardman, B (2003) Reducing UK residentialcarbon emissions by 60%. Proceedings ofEuropean Council for an Energy EfficientEconomy, June 2003, France.
Boardman, B, Palmer, J, Lane, K et al (2003) 4CE –Consumer choice and carbon consciousness:Electricity disclosure in Europe. Final projectreport. Environmental Change Institute,University of Oxford. ECI research reportnumber 28, ISBN 1-8734370 360.
Brand, C and Preston, J (2003) Which technologyfor urban public transport? A review of systemperformance, costs and impacts. Proceedings ofthe Institution of Civil Engineers. TransportStudies Unit, University of Oxford.
Darby, S (2003) Making sense of energy advice.Proceedings of European Council for an Energy-Efficient Economy, June 2003, France.
Jardine, CN and Lane, K (2003) Photovoltaics in theUK: An Introductory Guide For New Customers.ECI Report 27, Environmental Change Institute,University of Oxford, 2003.
Lipp, J and Lane, K (2003) Labelling electricity: