
Methane Emission Factor Development for Natural Gas Processing
25
Methane Emission Factor Development for Natural Gas Processing Plant Compressors Second Draft Test Plan and Quality Assurance Project Plan Prepared for: Lisa Hanle United States Environmental Protection Agency 1200 Pennsylvania Avenue Washington D.C. 20460 Prepared by: URS Corporation 9400 Amberglen Boulevard Austin, TX 78729 The University of Texas at Austin Center for Energy and Environmental Resources 10100 Burnet Road Austin, TX 78758 March 31, 2009
Transcript of Methane Emission Factor Development for Natural Gas Processing

Methane Emission Factor Development for Natural Gas Processing Plant Compressors
Second Draft Test Plan and Quality Assurance Project Plan
Prepared for:
Lisa Hanle United States Environmental Protection Agency
1200 Pennsylvania Avenue Washington D.C. 20460
Prepared by:
URS Corporation 9400 Amberglen Boulevard
Austin, TX 78729
The University of Texas at Austin Center for Energy and Environmental Resources
10100 Burnet Road Austin, TX 78758
March 31, 2009

Table of Contents
Page 1.0 Problem Definition/Background.................................................................... 3 of 19 2.0 Project Description and Schedule .................................................................. 5 of 19 3.0 Quality Objectives and Criteria for Measurement Data ................................ 6 of 19 4.0 Special Training ............................................................................................. 7 of 19 5.0 Documents and Records ................................................................................ 7 of 19 6.0 Sampling Design............................................................................................ 8 of 19 7.0 Sampling and Analytical Methods............................................................... 12 of 19 8.0 Sample Handling and Custody..................................................................... 14 of 19 9.0 Quality Control ............................................................................................ 14 of 19 10.0 Instrument/Equipment Testing, Inspection and Maintenance ..................... 14 of 19 11.0 Instrument/Equipment Calibration and Frequency...................................... 15 of 19 12.0 Instrument/Acceptance of Supplies and Consumables ................................ 15 of 19 13.0 Non-direct Measurements............................................................................ 15 of 19 14.0 Data Management ........................................................................................ 15 of 19 15.0 Assessment and Response Action................................................................ 17 of 19 16.0 Reports to Management ............................................................................... 17 of 19 17.0 Data Review, Verification, and Validation.................................................. 17 of 19 18.0 Reconciling with User Requirements .......................................................... 18 of 19 19.0 Reference ..................................................................................................... 19 of 19
List of Tables 1-1 Priority List of Emission Sources for Development of Emission Factors ..... 4 of 19 6-1 Number of Natural Gas Processing Plants in the Lower 48 States in 1995 and 2004................................................................................................ 9 of 19 6-2 Comparison of Experimental Design with Proposed Mandatory Reporting Rule Requirements...................................................................... 11 of 19 14-1 Hi Flow Sampler Data Fields....................................................................... 16 of 19 17-1 Hi Flow Sampler Error Codes...................................................................... 18 of 19
Revision No. 1 Internal Review Draft Page 2 of 19 March 31, 2009

1.0 Problem Definition/Background The United States Environmental Protection Agency (EPA) Strategic Plan for 2006 –
2011 establishes a national goal of reducing greenhouse gas emissions by 160 million metric tons carbon equivalent by 2012 through voluntary climate protection programs. In order to identify the methods, programs, and/or initiatives to efficiently reduce greenhouse gas in accordance with this goal, a reliable and detailed inventory of greenhouse gases emitted by various industries and other source categories is needed.
The purpose of this study is to improve emission factors needed for more reliable
estimates of fugitive methane emissions from reciprocating and centrifugal compressors used at natural gas processing plants throughout the United States. Methane (CH4) is a greenhouse gas more than 20 times more powerful than carbon dioxide (CO2) at trapping heat in the Earth’s atmosphere over a 100-year period. Methane is also the major component of natural gas. About 18% of the U.S. anthropogenic methane emissions have been attributed to natural gas systems, the third highest source category total behind only landfills and enteric fermentation (EPA, 2009). Gas processing plant compressors account for a significant fraction of the U.S. natural gas industry methane emissions estimate and its uncertainty.
Existing published estimates of U.S. natural gas plant fugitive emissions (EPA, 2009) are
based on emission factors from a 1996 report published by the Gas Research Institute (GRI) and EPA (GRI and EPA, 1996). The purpose of the 1996 GRI/EPA study was a national scale assessment of natural gas industry methane emissions for 1992. As part of that effort, emissions factors and activity factors were developed for all known natural gas system sources of methane emissions, from the wellhead to and including the customer meter. Despite relatively large emission factor uncertainties for some source categories, and changes in technology and operating practices that have rendered several emission factors out-of-date, the 1996 GRI/EPA study remains the primary source of default emission factors used for estimating natural gas industry methane emissions on the national and facility scales (EPA, 2009; API, 2004).
The GRI/EPA emission factors and associated uncertainties for reciprocating and
centrifugal compressors used in natural gas processing plants are 4,090,000 ± 74% and 7,750,000 ± 39% standard cubic feet per compressor-year (scf/comp-yr), respectively, where the uncertainties are expressed as the 90% confidence interval around the mean. The emission factor uncertainties for gas processing plant compressors are not extraordinarily large compared with emission factor uncertainties for other methane sources; however, they are leading contributors to the overall uncertainty in methane emissions from U.S. natural gas systems. This is partly because a large fraction of the entire U.S. natural gas industry methane emissions is attributed to gas processing plant compressors and partly because the GRI/EPA compressor emission factors
Revision No. 1 Internal Review Draft Page 3 of 19 March 31, 2009
may not be representative of new pollution prevention measures (e.g., replacement of wet centrifugal compressor seals with dry seals and directed inspection and maintenance) that have been introduced and promoted through Natural GasStar and other programs.
The work described in this Test Plan/Quality Assurance Project Plan will be performed
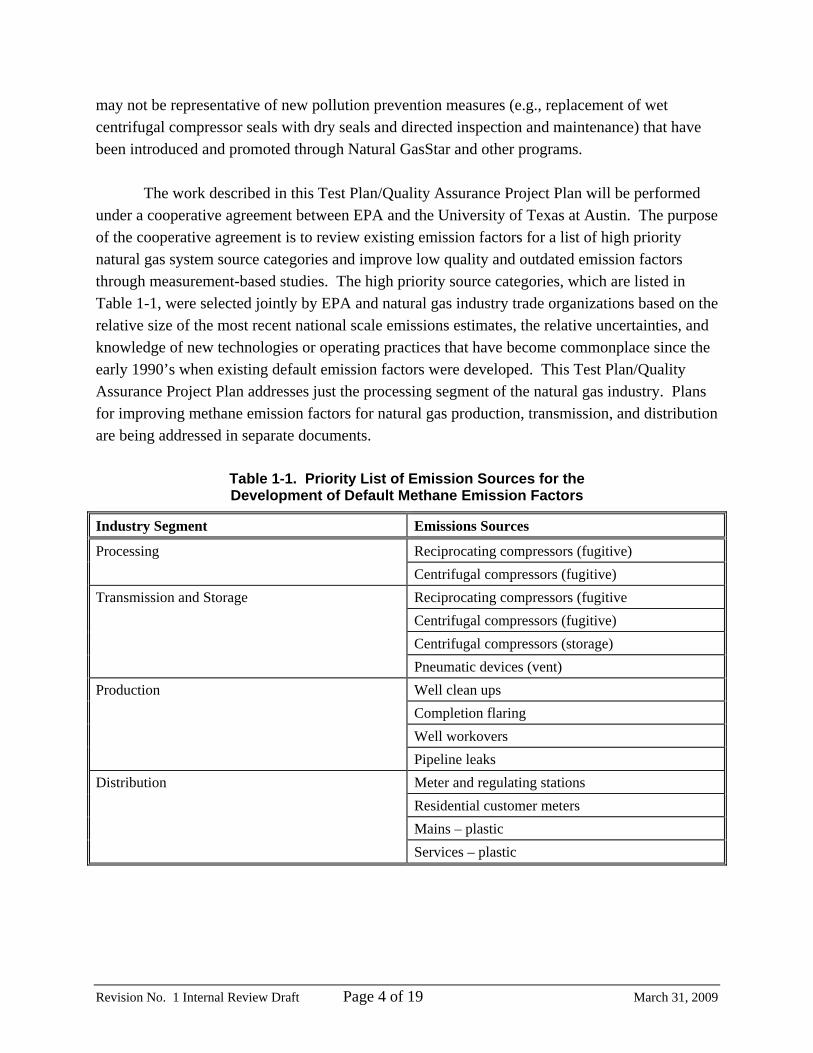
under a cooperative agreement between EPA and the University of Texas at Austin. The purpose of the cooperative agreement is to review existing emission factors for a list of high priority natural gas system source categories and improve low quality and outdated emission factors through measurement-based studies. The high priority source categories, which are listed in Table 1-1, were selected jointly by EPA and natural gas industry trade organizations based on the relative size of the most recent national scale emissions estimates, the relative uncertainties, and knowledge of new technologies or operating practices that have become commonplace since the early 1990’s when existing default emission factors were developed. This Test Plan/Quality Assurance Project Plan addresses just the processing segment of the natural gas industry. Plans for improving methane emission factors for natural gas production, transmission, and distribution are being addressed in separate documents.
Table 1-1. Priority List of Emission Sources for the Development of Default Methane Emission Factors
Industry Segment Emissions Sources
Reciprocating compressors (fugitive) Processing Centrifugal compressors (fugitive) Reciprocating compressors (fugitive Centrifugal compressors (fugitive) Centrifugal compressors (storage)
Transmission and Storage
Pneumatic devices (vent) Well clean ups Completion flaring Well workovers
Production
Pipeline leaks Meter and regulating stations Residential customer meters Mains – plastic
Distribution
Services – plastic
Revision No. 1 Internal Review Draft Page 4 of 19 March 31, 2009

2.0 Project Description and Schedule Fugitive methane emissions will be measured from reciprocating and centrifugal compressors at natural gas processing plants in the U.S. Compressor fugitive emissions include leaks from several different types of equipment components that are attached or in close proximity to compressors including compressor seals, open-ended blowdown lines, piping and tubing connectors and flanges, pressure relief valves, pneumatic starter open ended lines, instrument connections, cylinder valve covers, and fuel valves.
A High Flow sampler consisting of a variable rate induced flow sampling system, a dual catalytic oxidation/thermal conductivity detector, and hot wire anemometer will be used to measure methane fugitive leak rates. The High Flow sampler was developed for GRI as an efficient economical alternative to traditional fugitive emissions measurement approaches. It is handled and operated similar to a conventional EPA Method 21 leak screening device but quantifies fugitive leak rates about as well as the traditional EPA leak source bagging approach. Under optimum conditions, a High Flow sampler can measure and record 10 to 15 fugitive leaks per hour whereas traditional bagging approaches typically measure about two leaks per hour. High Flow samplers are commonly used at natural gas processing plants that are implementing directed inspection and maintenance programs. Leak rates that exceed the capacity of the High Flow sampler (e.g., emissions from some open ended lines and compressor seals routed to vents) will be measured using appropriately sized calibrated flow meters.
Field sampling is expected to take place during mid-2009. The specific number and locations of the test sites will depend on the funding allocated to this task and the pool of available test sites from which to choose. Voluntary partnerships with gas plant operating companies will be relied on for site access and permission to acquire the compressor fugitive leak rate measurements. Incentives to gas plant operators to participate in this study include anonymity, site-specific emission factors, and an early assessment of emissions prior to implementation of a federal mandatory reporting rule. Ideally, the pool of test sites will have:
• Reciprocating and centrifugal compressors; • Construction dates before and after 1996 (the year the GRI/EPA study was
published); • Wet and dry centrifugal compressor seals; • Compressors in operating, standby, and idle modes • Accessible open ended Blowdown and starter lines • Accessible compressor seal vents; • A mix of compressor manufacturers, models, sizes and ages; • Different approaches to leak detection and repair; and • Natural GasStar Partners and non-partners.
Revision No. 1 Internal Review Draft Page 5 of 19 March 31, 2009

3.0 Quality Objectives and Criteria for Measurement Data The objective of this study is to gather data for updating default emission factors used for
estimating methane fugitive emissions from natural gas processing plant compressors. Similar to the 1996 GRI/EPA study, the output from this project is intended to represent typical or average emission rates that are appropriate for supporting national or regional scale assessments when applied to the appropriate activity data. Desired outcomes of this study include a better understanding of the quantities of methane emissions from natural gas processing plant compressors, and ultimately, when compared with updated emissions data for other source categories, a better understanding of the opportunities for further emission reduction initiatives.
Interest also exists among representatives of the natural gas industry for greater emission
factor fidelity; so that future emission factors can be finely applied to compressors having unique sets of defined characteristics like type of seal, age, etc. This level of refinement of emission factors could lead to more accurate facility-level emissions estimates; however, the practical limitations of this study, which include budgetary and time constraints, might not support that degree of emission factor refinement.
The primary objective and the desired outcomes of this study will be met if: 1) The tested compressors compose a representative sample of the roughly 5000
reciprocating and centrifugal compressors installed at natural gas processing plants in the U.S.; taking account of relatively new technologies and operating/maintenance practices; operating, standby, and idle modes; a wide range of compressor installation dates; a wide range of horsepower ratings; different manufacturers; and different operating companies employing different approaches to leak detection and repair.
2) Uncertainties in the average emission factors derived from the measurement data are less than the uncertainties estimated for the 1996 default emission factors.
Specific measurement quality objectives include the following: • Accuracy – When calibrated and operated according to the manufacturer’s
instructions, leak rate determinations by the Hi Flow sampler should be accurate to ±10% of the reading.
• Precision – To achieve the accuracy objective, measurement precision should also be within 10%.
• Representativeness – Measurements should be obtained for a collection of gas processing plant compressors that reflect the mix of equipment, operating conditions, and maintenance practices that are current and common throughout the industry.
Revision No. 1 Internal Review Draft Page 6 of 19 March 31, 2009

• Comparability – Measurement data should be collected and reported using protocols and terminology that are consistent with the EPA March 2009 Greenhouse Gas Mandatory Reporting Rule Proposal.
• Completeness – The number of measurements should be large enough, considering the variability in the data set, such that uncertainties in the average emission factors are less than the respective uncertainties reported for the 1996 default emission factors.
4.0 Special Training No special training is required for this study; however, field technicians should be
familiar with calibrating, operating, and maintenance procedures for the Hi Flow Sampler. If a thermal imaging camera is used in the project to assist with leak detectio, field technicians may also need to be familiar with operating and maintenance procedures for the camera.
5.0 Documents and Records
The primary data package for this study will be a spreadsheet listing the following
parameters for each leak rate measurement. • Component identification number (assigned by field staff);
• Component leak rate;
• Date and time of measurement;
• Component type (e.g., compressor seal, OEL, PRV, etc.);
• Compressor type (reciprocating or centrifugal);
• Type of compressor seal (wet or dry for centrifugal compressors);
• Age of rod packing (reciprocating compressors);
• Compressor manufacturer and model;
• Compressor age;
• Operating mode (running, standby, or idle);
• Qualitative description of LDAR practices; and
• Gas plant identifier (encrypted for confidentiality).
The data package will also contain copies of field notes, maintenance logs, quality
control data, and instrument calibration records and a secondary spreadsheet containing the raw data from the High Flow sampler.
Revision No. 1 Internal Review Draft Page 7 of 19 March 31, 2009

6.0 Sampling Design Reciprocating and centrifugal compressor emissions will be measured at natural gas
processing plants selected randomly from a list of facilities where written authorization has been given by the owner/operator. Note that site selection in this manner will not be truly random as authorization will be voluntary and not expected to be given for 100 percent of the U.S. natural gas processing plant population. No systemic emissions biases are expected, however, between facilities that are open to participating in the study and those that are not.
According to recent estimates, more than 500 natural gas processing plants currently
operate in the U.S (Figure 6-1 and Table 6-1). About one-half the total number are located in Texas, Louisiana, and Oklahoma while a large fraction of the rest are in Wyoming, Colorado, and New Mexico. Ideally, emission rates would be measured at a randomly selected set of test sites large enough to represent the entire range of gas plant ages, processes, capacities, operating practices, geographic regions, and compressor characteristics.
Figure 6-1. Locations of Natural Gas Basins and Processing Plants in the Lower 48 States
Revision No. 1 Internal Review Draft Page 8 of 19 March 31, 2009
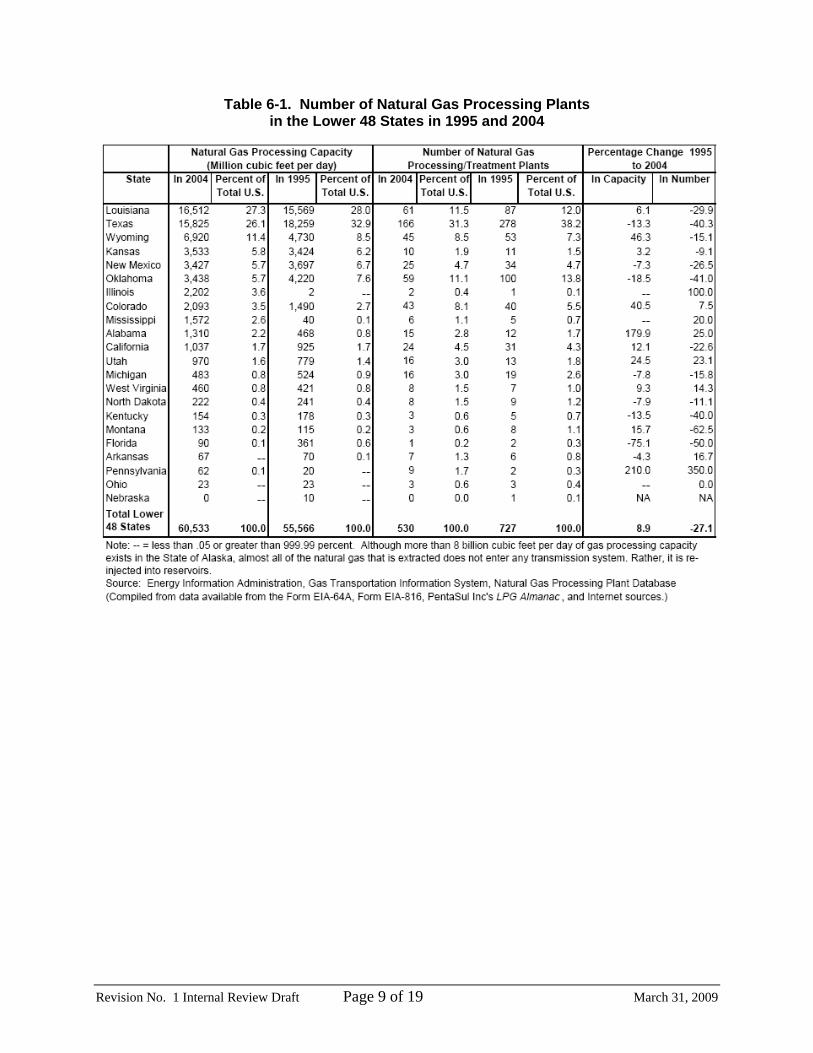
Table 6-1. Number of Natural Gas Processing Plants in the Lower 48 States in 1995 and 2004
Revision No. 1 Internal Review Draft Page 9 of 19 March 31, 2009

To test whether the set of host sites is indeed representative of the general population, gas plant owners/operators offering to participate in this study will be asked to provide a brief description of each candidate host facility including the age of the facility; location; throughput; numbers of reciprocating and centrifugal compressors; type of centrifugal compressor seals; compressor manufacturer, model, horsepower rating, and age; and whether a traditional LDAR or directed inspection and maintenance program is implemented at the site. If the set of randomly selected host sites is not reasonably representative of the entire candidate site population in terms of these characteristics, additional host sites may be drawn from the available pool to correct any bias.
The numbers of reciprocating and centrifugal compressors at gas processing plants are variable; however, 8 – 10 compressors per average site is assumed based on a U.S. gas processing industry total of about 5000 compressors. Fugitive emissions will be measured from all the compressors installed at each host site regardless of whether the compressor is running, on standby (idle but pressurized) or idle (depressurized). In fact, emission rate determinations for each mode and estimates of the time in mode are essential to estimating annual emission rates.
Emission rate determinations will be made for compressor seals and all other compressor
fugitive emissions; which are defined by the March 2009 proposed mandatory reporting rule as all components in close physical proximity to compressors where mechanical and thermal cycles may cause elevated emission rates, including but not limited to open-ended blowdown vent stacks (blowdown open ended lines), piping and tubing connectors and flanges, pressure relief valves, pneumatic starter open ended lines, instrument connections, cylinder valve covers, and fuel valves. The compressor fugitive components and respective leak rate measurement methods used in this study will be consistent with the EPA rule proposal requirements (Table 6-2); however, this emission factor development study is otherwise unrelated to the proposed regulation. Neither the resulting emission factors nor the site-specific measurement data obtained in this study should be assumed to substitute for the site-specific leak rate measurements called for in the EPA rule proposal.
Revision No. 1 Internal Review Draft Page 10 of 19 March 31, 2009

Table 6-2. Comparison of Experimental Design with Proposed Mandatory Reporting Rule Requirements
EPA GHG Mandatory Reporting Rule (March 2009 Proposal) This Study
Affected Facilities • Onshore natural gas processing • Onshore natural gas transmission • Underground natural gas storage
• Onshore natural gas processing
Greenhouse Gases • Methane • Carbon dioxide
• Methane
Sources Covered • Acid gas removal vent stacks • Blowdown vent stacks • Centrifugal compressor dry seals • Centrifugal compressor wet seals • Compressor fugitive emissions • Compressor wet seal degassing vents • Dehydrator vent stacks • Flare stacks • LNG import/export facility fugitives • Natural gas driven pneumatic pumps • Natural gas driven pneumatic manual
valve actuator devices • Natural gas driven pneumatic valve
bleed devices • Non-pneumatic pumps • Offshore platform pipeline fugitives • Open ended lines • Pump seals • Platform fugitives • Processing facility fugitive emissions • Reciprocating compressor rod packing • Storage station fugitive emissions • Storage wellhead fugitive emissions • Transmission station fugitive
emissions
• Centrifugal compressor dry seals • Centrifugal compressor wet seals • Compressor fugitive emissions • Compressor wet seal degassing vents • Reciprocating compressor rod
packing
Measurement Methods (fugitives only)
• High volume sampler • Calibrated bag • Rotometer • Hot wire anemometer • pitot tube
• High volume sampler • Hot wire anemometer • pitot tube
Fugitive Measurement Frequency
Annually Only once, for the project
Revision No. 1 Internal Review Draft Page 11 of 19 March 31, 2009

7.0 Sampling and Analytical Method Fugitive leak rates will be measured using a Hi Flow Sampler manufactured by Bacharach, Inc. except for leaks that exceed the Hi Flow Sampler capacity (14 m3/hr). For larger sources, for example, some open ended lines or fugitives routed to a common vent, leak rates will be measured using appropriately sized flow meters. The Hi Flow Sampler is portable, intrinsically safe, battery-powered instrument designed to determine the rate of gas leakage around various pipe fittings, valve packings, and compressor seals found in natural gas transmission, storage, and processing facilities. The instrument is packaged inside a backpack, thus leaving the operator’s hands free for climbing ladders or descending into manholes. The instrument is controlled by a handheld unit consisting of an LCD and a 4-key control pad, which is attached to the main unit via a 6 foot coiled cord.
A component’s leak rate is measured by sampling at a high flow rate so as to capture all the gas leaking from the component along with a certain amount of surrounding air. By accurately measuring the flow rate of the sampling stream and the natural gas concentration within that stream, the gas leak rate can be calculated using Equation 1. The instrument automatically compensates for the different specific gravity values of air and natural gas, thus assuring accurate flow rate calculations.
Leak = Flow x (Gas sample – Gas background) x 10–2 Eq. 1 Where:
Leak = Rate of gas leakage from source (cfm); Flow = Sample flow rate (cfm); Gas Sample = Concentration of gas from leak source (%); and Gas Background = Background gas concentration (%).
The gas sample is drawn into the main unit through a flexible 1.5 inch I.D. hose. Various attachments connected to the end of the sampling hose provide the means of capturing all the gas that is leaking from the component under test. The main unit consists of an intrinsically safe, high-flow blower that pulls air from around the component being tested through a flexible hose and into a gas manifold located inside the unit. The sample is first passed through a venturi restrictor where the measured pressure differential is used to calculate the sample’s actual flow rate. Next, a portion of the sample is drawn from the manifold and directed to a combustibles sensor that measures the sample’s methane concentration in the range of 0.05 to 100% gas by volume. A second identical
Revision No. 1 Internal Review Draft Page 12 of 19 March 31, 2009
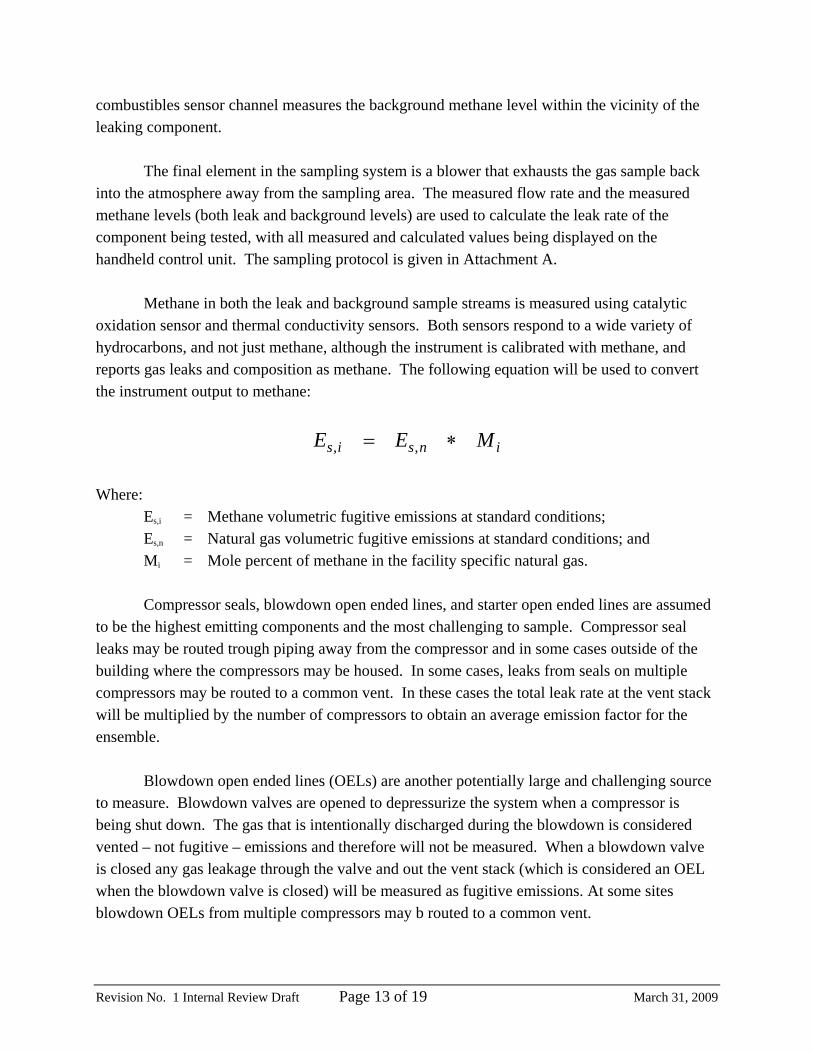
combustibles sensor channel measures the background methane level within the vicinity of the leaking component. The final element in the sampling system is a blower that exhausts the gas sample back into the atmosphere away from the sampling area. The measured flow rate and the measured methane levels (both leak and background levels) are used to calculate the leak rate of the component being tested, with all measured and calculated values being displayed on the handheld control unit. The sampling protocol is given in Attachment A. Methane in both the leak and background sample streams is measured using catalytic oxidation sensor and thermal conductivity sensors. Both sensors respond to a wide variety of hydrocarbons, and not just methane, although the instrument is calibrated with methane, and reports gas leaks and composition as methane. The following equation will be used to convert the instrument output to methane:
insis MEE ∗= ,,
Where:
Es,i = Methane volumetric fugitive emissions at standard conditions; Es,n = Natural gas volumetric fugitive emissions at standard conditions; and Mi = Mole percent of methane in the facility specific natural gas.
Compressor seals, blowdown open ended lines, and starter open ended lines are assumed
to be the highest emitting components and the most challenging to sample. Compressor seal leaks may be routed trough piping away from the compressor and in some cases outside of the building where the compressors may be housed. In some cases, leaks from seals on multiple compressors may be routed to a common vent. In these cases the total leak rate at the vent stack will be multiplied by the number of compressors to obtain an average emission factor for the ensemble.
Blowdown open ended lines (OELs) are another potentially large and challenging source
to measure. Blowdown valves are opened to depressurize the system when a compressor is being shut down. The gas that is intentionally discharged during the blowdown is considered vented – not fugitive – emissions and therefore will not be measured. When a blowdown valve is closed any gas leakage through the valve and out the vent stack (which is considered an OEL when the blowdown valve is closed) will be measured as fugitive emissions. At some sites blowdown OELs from multiple compressors may b routed to a common vent.
Revision No. 1 Internal Review Draft Page 13 of 19 March 31, 2009

Gas starter OELs are assumed to be the other of the three highest emitting components. Gas starter valves are opened to get the compressor engine spinning by using high pressure gas discharged to the atmosphere to spin a starter motor. When not in use, the OEL on the starter can be a large leak source.
8.0 Sample Handling and Custody
Sampling will be performed in situ and in real time. Therefore sample handling and custody procedures are not applicable. 9.0 Quality Control Methane background concentrations will be measured simultaneous with every leak test and subtracted from the main sample flow methane concentration. This is necessary to prevent background concentrations, which may be elevated by other nearby leaks, from influencing the leak rate determinations for individual components. The Hi Flow Sampler uses two detectors simultaneously to determine the background and the main sample flow concentration. One detector draws air flow from the main sample hose and the second detector draws air from a separate background probe. The background probe will be held near the leak being measured while the sample hose is held at the leak. To check if the instrument is capturing all the gas that is escaping from the leak source, two measurements will be performed at two different flow rates. The first measurement will be taken at the highest possible flow rate, followed by a second measurement at a flow rate that is approximately 70–80% of the first. If the two calculated leak rates are within 10% of each other, then it will be assumed that all gas has been captured during the test. Calibration checks of both the background and leak-gas detectors will be performed at the beginning and end of every day using a certified 2.5% methane gas standard. The Hi Flow Sampler has a built in feature to perform these checks. 10.0 Instrument/Equipment Testing, Inspection and Maintenance
Before the start of the field measurement program the Hi Flow Sampler will be inspected
and tested to verify that all plumbing connections are tight and that all the sampling, data acquisition, and quality control features are functioning as they should. Testing will include a check of the sampler’s maximum flow rate and accuracy of its flow meter using an independent,
Revision No. 1 Internal Review Draft Page 14 of 19 March 31, 2009

external flow meter. With a fully charged battery, the maximum flow rate should exceed 9 cubic feet per minute. A series of calibration checks will also be performed to test repeatability.
Internal filters that protect the instrument from contamination by dust and dirt will be
inspected weekly. The filters will be replaced when they appear contaminated. Gas sensors will be replaced when the instrument fails to calibrate. 11.0 Instrument/Equipment Calibration and Frequency
The high flow sampler will be calibrated at least once per week or whenever a single point check of the calibrated is outside the ±10% acceptability range. The calibration check will be performed using the vendor-supplied calibration kit with zero air and gas standards of 2.5% and 100% methane. The leak-gas and background gas detectors will both be calibrated at these concentrations using the menu-driven programmed procedure given in the Hi Flow Sampler operation and maintenance manual. 12.0 Inspection/Acceptance of Supplies and Consumables
The concentrations of calibration gas standards supplied with the instrument calibration kit will be independently verified by a University of Texas laboratory. No other supplies or consumables will require acceptance testing. 13.0 Non-direct Measurements
As part of the process for solicitation stakeholder involvement in this study, gas plant
operators will be queried about the availability of existing emissions test data that may be used to supplement the new measurement data acquired by this study. To be useful for developing new default emission factors, supplementary emission factor data must meet the quality objectives described in Section 3.0. 14.0 Data Management
Test data recorded by the Hi Flow sampler will be downloaded to a notebook computer at
the end of each day of sampling. The data will then be imported into a spreadsheet file or Microsoft Access database and a copy will be transmitted via email from the field staff to a central database maintained by the University of Texas at Austin. Each data record will consist of 24 fields, as listed in Table 14-1.
Revision No. 1 Internal Review Draft Page 15 of 19 March 31, 2009

Table 14-1. Hi Flow Sampler Data Fields
Field Label in Column Heading Description
1 Record# Test Record Number 2 Inst.Serial# Instrument’s Serial Number 3 Date#1(MM/DD/YY) Date (Measurement #1) 4 Time#1(HH:MM:SS) Time (Measurement #1) 5 Btry#1(V) Battery Voltage (Measurement #1) 6 Flow#1(cfm) Sample Flow Rate (Measurement #1) in cfm 7 Back#1(%) Background Gas Level (Measurement #1) in % 8 Leak#1(%) Sample Leak Rate (Measurement #1) in % 9 Leak#1(cfm) Leak Rate of Component Under Test (Measurement #1) in
10 Date#2(MM/DD/YY) Date (Measurement #2) 11 Time #2(HH:MM:SS) Time (Measurement #2) 12 Btry#2(V) Battery Voltage (Measurement #2) 13 Flow#2(cfm) Sample Flow Rate (Measurement #2) in cfm 14 Back#2(%) Background Gas Level (Measurement #2) in % 15 Leak#2(%) Sample Leak Rate (Measurement #2) in % 16 Leak#2(cfm) Leak Rate of Component Under Test (Measurement #2) in % 17 Leak#1-#2(%) Percent Difference Between Leak Measurements #1 and #2 18 Error Codes Error Codes identifying problems that occurred during the test 19 Barcode# Barcode Type (UPC, EAN, Code 128, Cadabar) 20 Barcode Symbology Barcode Number Scanned 21 GPS Latitude (deg) Latitude of Instrument in Degrees 22 GPS Longitude(deg) Longitude of Instrument in Degrees 23 GPS Altitude(ft) Altitude of Instrument in Meters 24 Test Description Test ID Information
Revision No. 1 Internal Review Draft Page 16 of 19 March 31, 2009

15.0 Assessment and Response Action An interim internal assessment of this study will be performed about midway through the
field testing (i.e., after 6 – 8 gas plants have been sampled) or sooner. The assessment will address the following questions:
• Are the measurement quality objectives for accuracy and precision being met?
• Are additional measurement methods needed to supplement the testing done with the Hi Flow Sampler?
• How well do the tested compressors represent the major segments of the U.S. gas plant compressor population?
• Does the uncertainty objective appear attainable, given the measured variances and the total number of compressor tests that are planned?
• Do the measurement results support a change to a stratified sampling design?
16.0 Reports to Management
A report on the interim assessment along with any needed response plans will be
delivered to the EPA Project Officer as part of a routine quarterly progress report.
17.0 Data Review, Verification, and Validation
The Hi Flow Sampler is programmed to automatically assign error codes when certain diagnostic checks fail. Data records flagged with any of the codes given in Table 17-1 will be rejected. All other test data collected in accordance with the sampling protocol given in Attachment A will be accepted.
Revision No. 1 Internal Review Draft Page 17 of 19 March 31, 2009

Table 17-1. Hi Flow Sampler Error Codes
Code Description
A Background gas sample pump blocked. B Leak gas sample pump blocked. C The background gas sensor needs calibrated at 2.50% and/or 100% CH4. D The leak gas sensor needs calibrated at 2.50% and/or 100% CH4. E The instrument failed to zero the background gas sensor during start F The instrument failed to zero the leak gas sensor during startup. G The user pressed the ESC key during start up before the sensors has a chance to zero H The leak rate measurement #1 – #2 calculation failed. I The measured background gas level was greater than the measured leak.
18.0 Reconciling with User Requirements The representativeness of the sampled compressors with respect to the general U.S. natural gas processing plant population will be assessed by comparing significant characteristics of the sampled compressors with the initial gas plant survey results.
The uncertainties in the average emission factors for reciprocating and centrifugal compressors will be estimated based on the 90% confidence interval. The estimated uncertainties will be compared with uncertainty estimates for the 1996 default factors to determine whether greater certainty has been achieved. Regardless of the outcome, additional stratification of the compressor population will be explored using Classification and Regression Tree (CART) analysis.
CART is a statistical procedure used for splitting a collection of data records into smaller
groups based on a set of independent (predictor) variables and how they separate comparatively high values from comparatively low values of a dependent (target) variable. The CART output is in the form of a decision tree with terminal nodes reflecting a distinct set of predictor variables and a unique distribution (mean and standard deviation) of the target variable. In this study CART will be used to split the emission factor dataset into subgroups based on various compressor characteristics that will be logged as supplementary data during the field tests. Average emission factors and 90% confidence intervals for each of the resulting terminal nodes will be calculated.
Revision No. 1 Internal Review Draft Page 18 of 19 March 31, 2009
Revision No. 1 Internal Review Draft Page 19 of 19 March 31, 2009
19.0 Reference (Harrison, 2007) M.R. Harrison, L.M. Campbell, T.M. Shires, and R.M. Cowgill, Methane
emissions from the natural gas industry, volume 2: technical report, EPA-600/R-96-080b, U.S. Environmental Protection Agency, Office of Research and Development, Washington, D.C. (June 1996).
ATTACHMENT A
High Flow Sampling Protocol1 Theory of Operations The high flow sampler was developed by Indaco Air Quality Services, Inc. for the Gas Research Institute to provide a method of measuring leak rates of natural gas from components such as valves, connectors, and open-ended lines. The sampler uses a high flow rate of air to capture the gas leaking from the component. Emissions are calculated as follows: QGas = Fsampler x (Cmain – Cbackground) (1) where: QGas = leak rate of natural gas from the leaking component (l/min), Fsampler = the sample flow rate of the high flow rate sampler (l/min), Cmain = the concentration of natural gas in the sample flow (percent), and Cback = the concentration of natural gas in the background near the component (percent). The background concentration must be subtracted from the main sample flow concentration because it may be elevated due to other leaks near the leak being measured. Two detectors are used simultaneously to determine the background and the main sample flow concentration. One detector draws air flow from the main sample hose and the second detector draws air from a separate background probe. The background probe is held near the leak being measured while the sample hose is held at the leak. This allows an accurate determination of the background concentration while the gas from leak is drawn into the sample hose. If the leaking gas is not drawn into the sample hose while the background concentration is measured, it will contribute to the background concentration and cause an inaccurate leak measurement. Two opposing factors influence the choice of sample flow rate for the system. Higher flow rates provide better leak capture. However, higher flow rates also reduce the sensitivity of the sampler and increase the chance of interference from nearby leaks. For instance, at a sample flow rate of 50 1/min, a methane leak of 100 ml/min would result in a concentration increase in the sample stream of 0.2%. A sample flow rate of 200 l/min at the same leak would result in a concentration increase in the sample stream of only 0.05%. When working in an area where a high background concentration is present, a smaller sample flow is usually used so that the larger net concentration increase is easier to quantify.
1 Provided by Milton W. Heath III
1

Batteries The sampler uses two air movers to provide suction for leak capture. The rating for each air mover is approximately 125 1/min, providing a maximum flowrate of 250 l/min. The air mover batteries can provide approximately six to eight hours of continuous use. It is important that the batteries be charged after each day of measurements. Although battery charging is dependent on the extent of battery use, as a safety net it is advisable to charge the battery overnight after each day of field measurements. The batteries can be unclipped from the air movers and connected to any 110V power outlet. The methane detectors and anemometer are powered by four alkaline AA batteries. When the methane detector batteries are drained to about ten percent of their capacity the display flashes “Lo” (low) between readings. If the batteries get very low, the display stays on “Lo”, and the batteries need to be replaced. To change batteries, slide out the battery cover at the base of the instrument. Please note to insert batteries with the correct polarity, as shown on the rear of the instrument. When the anemometer battery life falls below 15% the battery indicator (BAT) in the upper left corner of the display will blink on and off. This indicates a low battery condition and means you should install fresh batteries. Battery life for a fresh set of alkaline batteries is approximately 20 hours. Batteries are installed by loosening the screw in the battery access cover located on the back of the instrument. Cold temperatures may require more frequent battery changes in both the anemometer and methane detectors. Anemometer The flow velocity is measured by an intrinsically safe hot wire anemometer. The velocity read by the anemometer has been previously calibrated to correlate with the sample flow rate. Once the instrument has been turned on the current battery life will be displayed for five seconds. This number ranges from less than 0% for low batteries to something over 100% for a short time while the “surface charge” of new batteries burns off. After five seconds the instrument will display velocity in meters per second. Note: the BAT/VEL switch allows you to determine the remaining battery life without turning the unit off. The instrument has two velocity response settings. Slow response displays the average velocity measured during the past twelve seconds. This is a running average, so the display is updated once a second. The fast response mode
2

displays the average velocity during the last three seconds. During measurements the response mode should be placed in the FAST setting. Methane Detector The detectors used to measure the sample and background concentration are calibrated using mixtures of methane in air. These mixtures contain nominal concentrations of 1.0%, 2.5% and 100% methane. During calibration and leak measurements, the detectors should be set on the “% GAS” scale. For the background detector, the standards are introduced into the background probe using a tedlar bag filled with each standard and fit over the end of the probe. This allows the standard to be drawn into the system without changing the pressure of the system. The same approach is used to calibrate the detector for the main sample flow except that a three-way valve allows switching between the sample hose and a calibration port into which the standard is introduced. This allows calibration of the system without disconnecting the detector. The detector responses to the calibration gases are recorded in the field notebook. The three-way valve at the calibration port must be returned to the sample position prior to leak measurements. During leak measurements the methane detectors should be set on the “% GAS” scale. The instrument will display the concentration of gas in air in percent by volume. If the air is clean (contains no gas), the display should read zero. If it does not, switch to the position marked “AUTO ZERO”. After automatic adjustment of zero is complete (display shows “End”), return the switch to the “% GAS” position. NOTE: The instrument has a built in alarm, which is activated at present levels. The factory set alarm level for the “% GAS” scale is 1%. Filter A filter is present at the sampler hose inlet. It is important that the filter be checked to confirm that it has not become saturated with dirt, oil, paint and metal filings, etc. When it has, remove the old filter and insert a new one. Do not reverse the direction on an old filter and reuse it. Leak Measurements Before turning the sample air system on, the black grounding clip on the sampler hose should be attached to a surface that will provide a good ground. The hose is made of a static dissipating material and grounding this hose prevents the build up of static charges on the end of the hose, which might be caused by the air flow through the hose. If a static charge built up on the hose end, it could discharge as a spark when touched to a surface. Consequently, it is important to ground the sampler hose. Remember, painted surfaces usually do not allow good contact; therefore, do not provide a good ground, unless the paint is scraped through to the surface metal beneath it.
3

To assure complete capture of the leak at a component the hood attachment is used to block the wind movement near the leak location. The attachment does not need to provide an airtight seal, as with typical bag enclosure measurements. It is important that the background probe be connected to the leak enclosure attachment via the quick-connect coupling. This will ensure that the background probe measures the air before it passes over the leak and into the sample probe. For most component leaks the hood is sufficient for successful leak rate measurement. In some cases the component may be hard to enclose (i.e., too large or difficult to get to). In these situations the plastic wrap attachment should be used. The anti-static plastic wrap has Velcro® to insure good enclosure of the leak. Again, it is not necessary to provide an airtight seal around the leaking component. All that is required is a basic enclosure that shields the leak. Please ensure that the background tubing has been attached to the sampler hose via the quick-connect and is in a position to record the gas concentration in the air stream before it enters the enclosure. For leaking flanges, the crevice tool is used. A sheet of plastic wrap, duct tape, or fiberglass packing can be used to surround the flange and the crevice tool is pushed into the flange opening. For flanges, the background probe is held near an opening in the wrap surrounding the flange on the opposite side of the leak. When sampling the leak initially, it is common to initially observe a higher concentration followed by a lower steady state concentration. This occurs because a small cloud of gas surrounds the leak even if it has not been wrapped for a leak measurement. This cloud of gas is drawn into the sampler causing the higher initial readings. Once this gas is drawn away, the concentration reaches steady state. When using the sampler, the operator should look for the maximum steady sample concentration that results. This maximum steady sample concentration and the simultaneous background concentration are recorded on the data sheets along with the sample velocity. As discussed earlier, the sample velocity is a measure of the sample flow rate. Sample flow rate is adjusted by increasing or decreasing the number of air movers running at a given time. One or two air movers can be on during leak measurements. It is critical that the sample velocity be recorded for each measurement. If the actual sample velocity is not known, accurate leak rate calculations cannot be made. It is important to note that the response time of the anemometer measuring the sample velocity is faster than the detectors measuring the sample and background concentrations. If a change in the sampling flow rate is made, this will be indicated by the sample velocity display faster than the accompanying change in the sample concentration. Approximately 10 seconds is required after a significant velocity change before the displayed sample concentration is representative of the actual sample concentration. Because much of the delay and response time is in the detectors themselves, this timeframe should be sufficient for the case of either one or two air movers running. However, if the flow is restricted to less than one
4

half of the normal flow for one air mover, a longer time may be required before the sample concentration is representative. Leak Rate Calculation The sample velocity, background concentration, and sample concentration associated with each leak is entered into a spreadsheet which will calculate the leak rates. The calculation uses Equation (1), the correlation of sample velocity to sample flow rate, and corrections based on the calibration data. The equation used in the spreadsheet to calculate the leak rate is as follows:
A= Anemometer Velocity Reading (m/s) CS= Sample Concentration (%) CB= Background Concentration (%) ACE= Anemometer Calibration Exponent ACS= Anemometer Calibration Slope CSCS= Sample Concentration Calibration Slope CSCC= Sample Concentration Calibration Constant CBCS= Background Concentration Calibration Slope CBCC= Background Concentration Calibration Constant Since the anemometer is originally calibrated in clean air, the left hand side bracketed term accounts for the presence of methane in the air stream. The factors ACE and ACS correlate the anemometer sample velocity to a sample flow rate in liters per minute The right hand bracketed terms account for any calibration corrections that need to be made to the sample and the background methane detectors. During any field measurement campaign, measurement replicates are necessary as a quality assurance check. The leak replicates are presented in the final spreadsheet and are represented as measurements recorded using one and two air movers. There are four possible scenarios to each replicate measurement: Results using the two air movers are considerably larger than those recorded using one air mover. In this situation, typically found with larger leaks, one air mover fails to provide complete leak capture. Hence, the use of two air movers and the subsequently higher sample flow rate entrains the entire leak into the sample flow stream; Results using both one and two air movers are similar, indicating complete leak capture under both sampling conditions;
5

6
Results using one air mover are slightly higher than the results from the use of two air movers. This situation stems from the methane detector having a % GAS scale that spans from zero to 5% in increments of 0.05%, and in steps of 1% from 5 to 100%. Hence, if the detector is recording a concentration of 6%, with one air mover running, it is possible that the concentration could be anything between 5.5 and 6.5%. With the use of two air movers, the resulting concentration dilution pulls the reported concentration below 5%, where better scale resolution is present. Although the results from the one and two air movers are still typically within 20% of each other, the leak rate calculation based on the two-air mover result provides a better definition of the actual leak. Conversely at low concentrations (0.1 to 0.3%), the use of one air mover is recommended. Using two air movers will dilute the leak, and since the methane detector has a minimum scale of 0.05%, any leak in the 0.05% and 0.1% concentration region could produce reported leaks rates that vary by 100%. To negate the limitations imposed by the scale increments, the use of one air mover will lift the concentration to a level where it will not be subject to such percentage variations. The largest emissions we have observed at compressor stations have been from open ended lines (4" to 12" I.D.) that are used as vents for blow down valves. The largest leaks from these vents occur when compressors are blown down and the blow down valve is open, allowing leaks across the suction and discharge block valves to vent through the blow down line. Under these conditions, we have measured leaks as large as 160 scfm of natural gas. To make measurements on leaks of this magnitude, we have fabricated calibrated bags of anti-static plastic of various sizes with a special neck to fit over vent openings. This allows a low-pressure drop measurement of vented systems that may not tolerate significant backpressure. The use of these “Vent-Bags” has been calibrated in our laboratory against rotameter measurements and been found accurate to within ±10%. References CMA, 1989. Improving Air Quality: Guidance for Estimating Fugitive Emissions from Equipment. Chemical Manufacturer's Association, Washington, DC 20037. Webb, M., and P. Martino, 1992. Fugitive Hydrocarbon Emissions from Petroleum Production Operations. Presented at the 85th Annual Meeting of the Air and Waste Management Association, Paper No. 92-66.11. DatabaseID=575D2827212025332A235320|ContactID=50475F3720204F20455B5E20|