Meteorology & Intro to Models - Web.nmsu.eduweb.nmsu.edu/~dwdubois/07_lecture_CEE452.pdf · •...
30
CEE 452/652 Week 4, Lecture 1 – Meteorology & Intro to Models Dr. Dave DuBois Division of Atmospheric Sciences, Desert Research Institute
Transcript of Meteorology & Intro to Models - Web.nmsu.eduweb.nmsu.edu/~dwdubois/07_lecture_CEE452.pdf · •...

CEE 452/652
Week 4, Lecture 1 –Meteorology & Intro to
ModelsDr. Dave DuBois
Division of Atmospheric Sciences, Desert Research Institute

2
Today’s topics
• Read ch 19 and 20, hold off on 19.5 until next week
• Quiz review• Homework review• Slope flows• Wind profiles• Plumes• Modeling (if not today then Thursday)

3
Quiz #2 Review
• Remember NSR is New Source Review and PSD = Prevention of Significant Deterioration. – PSD means you can’t pollute really clean air
“up” to the air quality standard. Clean air must stay clean!
• NAAQS = National Ambient Air Quality Standards
• NSPS = New Source Performance Standards

4
National Ambient Air Quality StandardsPollutant NAAQS Averaging Time Exceedances
CO 9 ppm 8 hr 1/yr 35 ppm 1 hr 1/yr
SO2 0.14 ppm 24 hr 10.03 ppm 1 yr 0
NO2 0.053 ppm 1 yr 0
O3 0.08 ppm 8 hr max/day 3-yr avg of 4th high
PM10 150 µg/m3 24 hr 3-yr avg of 2nd high
PM2.5 35 µg/m3 24 hr 98th percentile of 24hr average averaged over 3 yr
15 µg/m3 3 yr 0/3 yr
TSP Pb 1.5 µg/m3 1/4 yr 0/quarter

5
Homework #1
Common mistakes:• TF = 1.8TC + 32• TC = (TF - 32)/1.8 = (5/9)TF – 17.78• TK = TC + 273.15• 1 ppb = 0.001 ppm• 1 ppm = 1000 ppb• 1 ppt = 1000 ppb

6
Homework #1
Types of Mineral particles in soil dust:• Quartz (SiO2)• Calcite (CaCO3)• Feldspars-50% of rocks (KAlSi3O8)• Hematite (Fe2O3)• Gypsum (CaSO4-2H2O)• Kaolinite (Al4Si4O10(OH)8) - clay

7
Homework #1For example some of the most abundant elements in ag soil is Al, Si and Fe
elements

8
Homework #2
• Gas scattering: dominates during clear conditions
• Gas absorption: dominates near NO2sources
• Aerosol scattering: dominates during high RH, high levels of secondary particles (NH4NO3, (NH4)2SO4), dusty locations
• Aerosol absorption: dominates when near combustion sources (fires, diesels)

9
Plume FumigationDuring breakup of radiation inversion
Earlier there is an inversion that is slowly destroyed by solar heating (blue). When the unstable mass of air from the heated ground reaches the plume, it mixes it to the ground, often at high concentration, producing a short-term fumigation.

10
Mixing Height or Mixed Layer• Mixing heights represent the top of the layer
through which relatively vigorous mixing will take place
• It is usually the depth of the unstable layer• Pollutants released at ground level will be
dispersed in this well mixed layer, the lower the mixing height the higher the resultant pollutant concentration
• Lower at night than during the day• Lower in the winter than in the summer• Typical values, few 10s of m to several km• Also called Mixing Depth or Atmospheric
Boundary Layer (ABL)

11
Example Mixing Height• The height above the ground at which the
dry adiabatic extension of the morning minimum surface temperature plus 5 °C intercepts the vertical temperature profile measured at 1200 UTC
Min + 5

12
Mixing Height Examples
5 am today 11 am today

13
Upslope-down slope flows

14
Urban Heat Island Effects

15
Urban Heat Island Effects
95°Pavement
100°Shadow in pavement
78°grass
84°trees

16
Valley Flows
Downslopeflow
Downslopeflow
Drainage flow
Occurs at night

17
Windrose

18
Power Law
For air pollution work, z1 usually at 10 meters above the ground

19
Power Law Measurements

20
Sea-land Breeze

21
Role of Meteorology in Atmospheric Processes

22
Plume Rise

23
Building Downwash

24
Building Wake Effects

25
Turbulence
Atmospheric Rotors and Mountain Waves in the lee of the Sierra Nevada
Can see these also in lee of Spring Mtns
Important for aviation
from Vanda Grubišić, Desert Research Institute
26
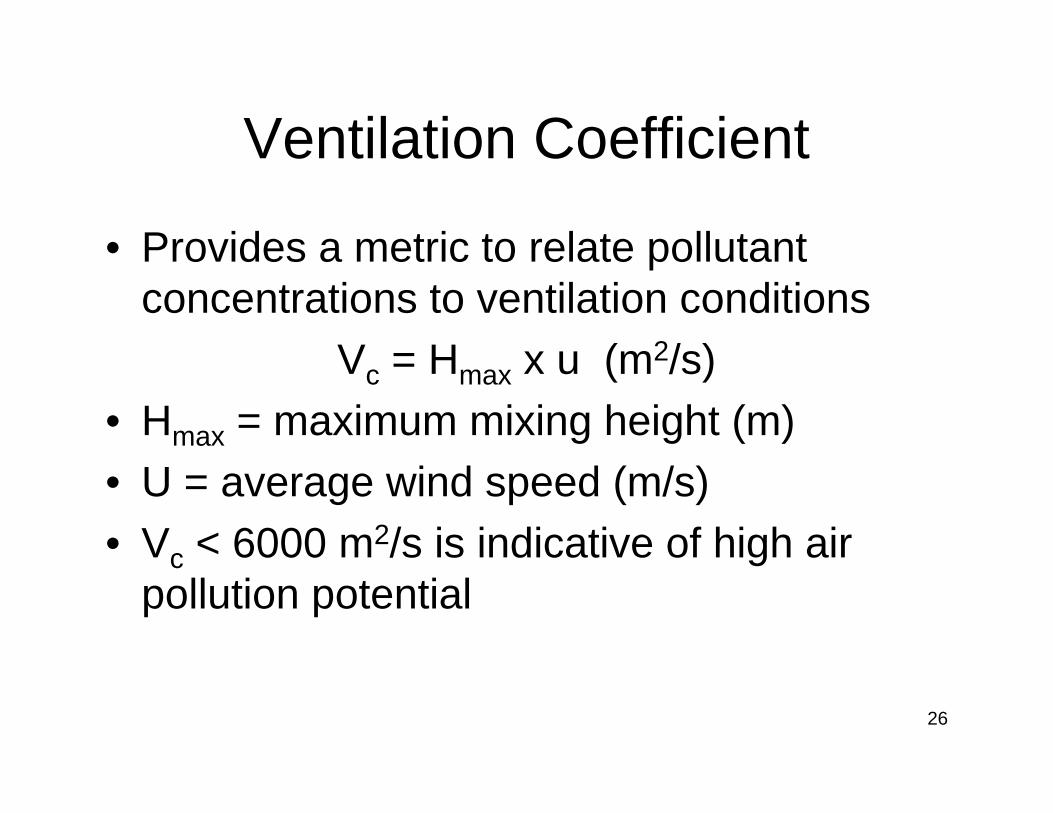
Ventilation Coefficient
• Provides a metric to relate pollutant concentrations to ventilation conditions
Vc = Hmax x u (m2/s)• Hmax = maximum mixing height (m)• U = average wind speed (m/s)• Vc < 6000 m2/s is indicative of high air
pollution potential

27
Ventilation Coefficient
Today at 5amShows Vcbetween 0 and 235 m2/s over most of west

28
Why Model?To find the answer to:
– What is the contribution of source A to the concentration of pollutants at site B?
– What is the most cost effective strategy for reducing pollutant concentrations below the NAAQS?
– What will be the effect on air quality of the addition or the reduction of a specific air pollutant emission flux?
– Where should one place a future source to minimize its environmental impact?
– What will be the air quality tomorrow or the next?

29
Positive Attributes of Modeling• Allows us to predict impacts of a source before
building it• Can predict concentrations at any location
– Impossible to measure at all places• Much less expensive than measurements
– Book says 1000x more expensive• Only practical way to isolate the impacts from a
single source from a group• Can isolate individual chemical or physical
processes not attainable in measurements• Reproducible

30
Complications to Modeling• To account for complexities of the atmosphere,
there often needs to be many variables and inputs to model– May not know appropriate values to all of the inputs
• Easy to misapply models– Ok to interpolate but not extrapolate
• Models must be validated with measurements– Easy to trust answers because it always gives a #
• Difficult to assign uncertainty to outputs• Get lots of information from model—how to look at
results– Most of time there is not just one answer
• How to deal with competing models