
METEOROLOGY: CLIMATE 2006 Division B Event. METEOROLOGY: CLIMATE Climate is the third topic in the...
80
METEOROLOGY: CLIMATE 2006 Division B Event
-
Upload
tina-lattin -
Category
Documents
-
view
216 -
download
0
Transcript of METEOROLOGY: CLIMATE 2006 Division B Event. METEOROLOGY: CLIMATE Climate is the third topic in the...

METEOROLOGY: CLIMATE
2006 Division B Event

METEOROLOGY: CLIMATE
Climate is the third topic in the B-Division Meteorology Event of the Science Olym-piad. Topics rotate annually so a typical middle/junior high school participant may receive a comprehensive course of in-struction spread over a three-year period.
Sequence:1. Everyday Weather (2007)2. Severe Storms (2008)3. Climate (2006)

METEOROLOGY: CLIMATE
Event Description: This event emphasizes the use of process skills within designated meteorological topics. Skills to be address-ed and evaluated may include, but are not limited to, generating inferences, making predictions, problem solving, observing, formulating and evaluating hypotheses, and analyzing and interpreting data.

METEOROLOGY: CLIMATE
The goal of this presentation is to provide a basic introduction to the various topics included in the Meteorology: Climate Event Rules. An attempt has been made to follow the sequence as they appear in the Event Rules.

Weather vs. Climate
Weather: the state of the atmosphere at a particular location or moment in time
Climate: the average or typical state of the weather at a particular location or time of year

Weather vs. Climate
The nature of both weather and climate are expressed in terms of the same elements. The most important of these are:1. Air temperature2. Humidity3. Type and amount of cloudiness4. Type and amount of precipitation5. Air pressure6. Wind speed and direction

Natural Climatic Variability
Natural climatic variability refers to naturally occurring factors that affect global temperatures. These include, but are not limited to:
1. Volcanic eruptions
2. Variations in the Sun’s energy output
3. Milankovich Cycles4. Natural variations in concentrations of
CO2

1. Volcanic Eruptions
Volcanic eruptions may impact global climate.
1. Reduces the amount of solar radiation that reaches the Earth's surface
2. Lowers temperatures in the troposphere
3. Changes atmospheric circulation patterns
2. Variations in the Sun’s Energy Output
Satellite measurements indicate that the Sun's output may vary by as much as 0.1% over an 18 month period. A variation of only 1 % would cause average global temperature to change by 1 degree Celsius.

3. Milankovich Cycles
Milankovich identified three cyclical changes that he believed might be relevant to climate change:1. Orbital eccentricity – 100,000 year cycle2. Tilt – 42,000 year cycle3. Precession – 25,800 year cycle
To support his hypothesis, Milankovich deter-mined the dates when these variations had combined to minimize and maximize solar radiation over hundreds of thousands of years. The dates coincided with the ice ages.

4. Natural variationsin Concentrations of CO2Natural variations in the concentration of
carbon dioxide occur because of changes in global mean temperature. 1. When global temperatures are warm, there is a net movement of carbon dioxide from the oceans to the atmosphere. 2. When global temperatures are cool, there is a net movement of carbon dioxide from the atmosphere to the oceans.

Köppen Classification System
The Köppen Classification System is the most widely used system for classifying world climates.
This system is based on the limits of certain plant associations.
The original system recognized five major climate types, labeled A through E, run-ning in broad bands from equator to poles.

Major Climate Regions
A - Tropical Moist Climates: all months have average temperatures above 18˚ Celsius
B - Dry Climates: have very little precipitation during most of the year
C - Moist Mid-latitude Climates with mild winters D - Moist Mid-Latitude Climates with cold wintersE - Polar Climates: have extremely cold winters
and summers

Factors that Influence Climate
1. Latitude – solar radiation
2. Air masses
3. Location of high and low pressure systems
4. Heat exchange from ocean currents
5. Location of mountain barriers
6. Pattern of prevailing winds (monsoons)
7. Distribution of land and sea
8. Altitude

Earth’s Atmosphere: CompositionLutgens and Tarbuck, The Atmosphere, 8th edition
Chemical Composition Today - Nitrogen (N2)- 78%, Oxygen (O2)- 21%, Carbon Dioxide (CO2) - 0.03 %, plus other miscellaneous gases (H2O for one).

Earth’s Atmosphere: StructureLutgens and Tarbuck (The Atmosphere, 8th edition)

Earth’s Atmosphere: StructureLutgens and Tarbuck (The Atmosphere, 8th edition)

Earth’s “First” Atmosphere
Composition - probably H2 and He These gases are relatively rare on Earth
compared to other places in the universe and were probably lost to space early in Earth's history (insufficient gravity to hold lighter gases & lack of a differentiated core)
Once the core differentiated, the heavier gases could be retained

Earth’s “Second” Atmosphere
Gases produced were probably similar to those created by modern volcanoes (H2O, CO2, SO2, CO, S2, Cl2, N2, H2) and NH3 (ammonia) and CH4 (methane)
No free O2 at this time (not found in volcanic gases)
As Earth cooled, H2O produced by out-gassing could exist as liquid in the Early Archean Eon, allowing oceans to form.

Earth’s Atmosphere:Addition of Oxygen
Throughout the Archean Eon (4.0 – 2.5 bya) there was little to no free oxygen. What little oxygen that was produced by cyanobacteria was most likely consumed by the weathering process.
Once rocks at the surface were sufficiently oxidized, more oxygen became available for release to the atmosphere.

Earth’s Atmosphere:Addition of Oxygen
The amount of free O2 rose from 1 - 10 % during the Proterozoic Eon of Precambrian time (2.5 to 0.542 bya). Cyanobacteria is responsible for releasing most of this oxygen into the atmosphere.
The amount of O2 in the atmosphere has increased with time.
Present levels of O2 were probably not achieved until ~400 Mya.

Solar Radiation

Solar Radiation(Oklahoma Climatological Society)
When averaged globally and annually, only 51% of the solar radiation striking the earth and its atmosphere is absorbed at the surface.
Reflection significantly affects the solar radiation that reaches the ground, as the sun's rays could be reflected off of air molecules (termed scattering), clouds or the ground itself.

Ocean Currents
An ocean current is any continuous flow of water along a definite path in the ocean. The flow may occur at the surface or far beneath it.
The flow may be vertical or parallel to the surface.

Ocean Currents
Current flow affects temperatures, biotic systems, and climate.
Currents carry enormous amounts of warm water away from the equator and return equal amounts of cold water.
Circulation of these water masses may be categorized as either wind driven or thermohaline.

Ocean Currents
Wind driven circulation is set into motion by moving air masses, with the motion being confined primarily to horizontal movement in the upper waters of the oceans.

Ocean Currents
The term thermohaline is derived from “thermo” for temperature plus “haline” for salt.
Thermohaline currents are driven by differences in the density of seawater at different locations.
Thermohaline currents have a significant vertical component and account for the thorough mixing of the deep masses of ocean water.

Three-Cell Circulation Model
The "three cell" circulation model refers to the very general, global pattern of winds.
1. Hadley cells are thermally direct cells.
2. Ferrel cells are indirect cells formed from air motions initiated by adjacent cells.
3. Polar cells are thermally direct cells formed by cold temperatures near the poles.

Three-Cell Circulation Model

Three-Cell Model: Hadley Cell
The pressure cells between the equator and 30°N and 30°S are known as Hadley Cells, named for George Hadley who suggested their existence in 1735.
These cells transport heat from the equator to the colder temperate and polar regions.
Pressure and winds associated with Hadley cells are close approximations of real world surface conditions, but are not representative of upper air motions.

Three-Cell Model: Polar Cell
Air in polar cells becomes very dense due to extremely cool temperatures. This results in sinking motions indicative of high pressure.
Air moving toward the equator is deflected by the Coriolis effect creating the polar easterlies in both hemispheres.

Three-Cell Model: Ferrel Cell
The Ferrel Cell forms at the mid-latitudes of a rotating planet to balance the transport by the Hadley and polar cells.
At the surface, the Ferrel Cells form the southwesterly prevailing westerlies.
The Ferrel Cells and Hadley Cells meet at the horse latitudes.

Semipermanent Pressure Cells
Two globes are shown on the following slide: an imaginary uniform Earth with idealized zonal (continuous) pressure belts on the left and a “real” Earth illustrating semi-permanent high and low pressure belts on the right.
The latter is semi-permanent because of variations in strength or position throughout the year.
Images appearing on the following page courtesy of
Hungarian Meteorological Service, Budapest

Pressure Cells

Semipermanent Pressure Cells
The belts are “semi-permanent” because
1. Earth’s surface is not uniform. There is uneven heating due to land/water contrasts.
2. The wind flow itself can become unstable and generate “eddies.”
3. The sun doesn’t remain directly over the equator, but moves from 23.5˚N to 23.5˚S and back over the course of a year.

Non El Niño Conditions
Normally, strong trade winds blow from the east along the equator, pushing warm water into the Pacific Ocean. This permits an upwelling of cold waters along the S. American coast transporting nutrients to the surface and attracting fish.

El Niño Conditions
An El Nino condition results from weakened trade winds in the western Pacific Ocean near Indonesia, allowing piled-up warm water to flow toward South America. This pile-up prevents cool ocean waters from upwelling, upsetting the food chain.

Southern Oscillation
The Southern Oscillation is the see-saw pattern of reversing surface air pressure between the eastern and western tropical Pacific. When the surface pressure is high in the eastern tropical Pacific, it is low in the western tropical Pacific, and vice-versa.
Because the ocean warming and pressure reversals are, for the most part, simultaneous, scientists call this phenomenon the El Niño/ Southern Oscillation, or ENSO for short.

Paleoclimates of Earth’s History:Younger Dryas Cold Period
Warming at the end of the last ice age ~15,000 years ago melted the ice sheets over North America resulting in an increase in freshwater input to the North Atlantic.
This reduced the saltiness of seawater, preventing it from sinking, and therefore decreased deep water circulation.

Paleoclimates of Earth’s History:Younger Dryas Cold Period
Evidence indicates that the reduction in the saltiness of seawater resulted in the shutdown of thermohaline circulation, caused the Gulf Stream to move southward, and reduced heat transport to Northern Europe.

Paleoclimates of Earth’s History:Younger Dryas Cold Period
This interrupted the warming trend at the end of the last Ice Age. Ice core and deep sea sediment records indicate that temperatures in northwest Europe fell by 5˚ Celsius in just a few decades returning the North Atlantic region to Ice Age conditions.

Paleoclimates of Earth’s History:Midieval Warm Period
The Medieval Warm Period was an unusually warm period during the European Medieval period, lasting from about the10th century to about the 14th century.
The Vikings took advantage of ice-free seas to colonize Greenland and other outlying lands of the far north.
The period was followed by the Little Ice Age, a period of cooling that lasted until the 19th century when the current period of global warming began.

Paleoclimates of Earth’s History:Little Ice Age
The Little Ice Age lasted from about A.D. 1550 to about A.D. 1850 in Europe, North America, and Asia.
This period was marked by rapid expan-sion of mountain glaciers, especially in the Alps, Norway, Ireland, and Alaska.
There were three maxima, beginning about 1650, about 1770, and 1850, each separated by slight warming intervals.

Climate Mini-Lab Activities
The remaining slides provide activities similar to those participants might
anticipate. Source: State of New York Earth Science Regents Exams.

Climate Mini-Lab Activities
Record your responses on a piece of scratch paper. Work with your partner! Correct responses are provided after
each question.

Sample Climate Activity 1
Which diagram best illustrates how air rising over a mountain produces precipitation?

Sample Climate Activity 1
Which diagram best illustrates how air rising over a mountain produces precipitation?
The correct response is 2.

Sample Climate Activity 2
At approximately what latitude do the hottest January temperatures occur?

Sample Climate Activity 2
At approximately what latitude do the hottest January temperatures occur?
~ 20 Degrees South (+/- 8 Degrees)

Sample Climate Activity 2
There is a smaller temperature change in the Southern Hemisphere from January through July than in the Northern Hemisphere. Explain why the Southern Hemisphere’s larger ocean-water surface causes this smaller temperature change.

Sample Climate Activity 2
Water has a higher specific heat than the land.
or
Water takes a longer time to heat up and cool down than does land.
Sample Climate Activity 3
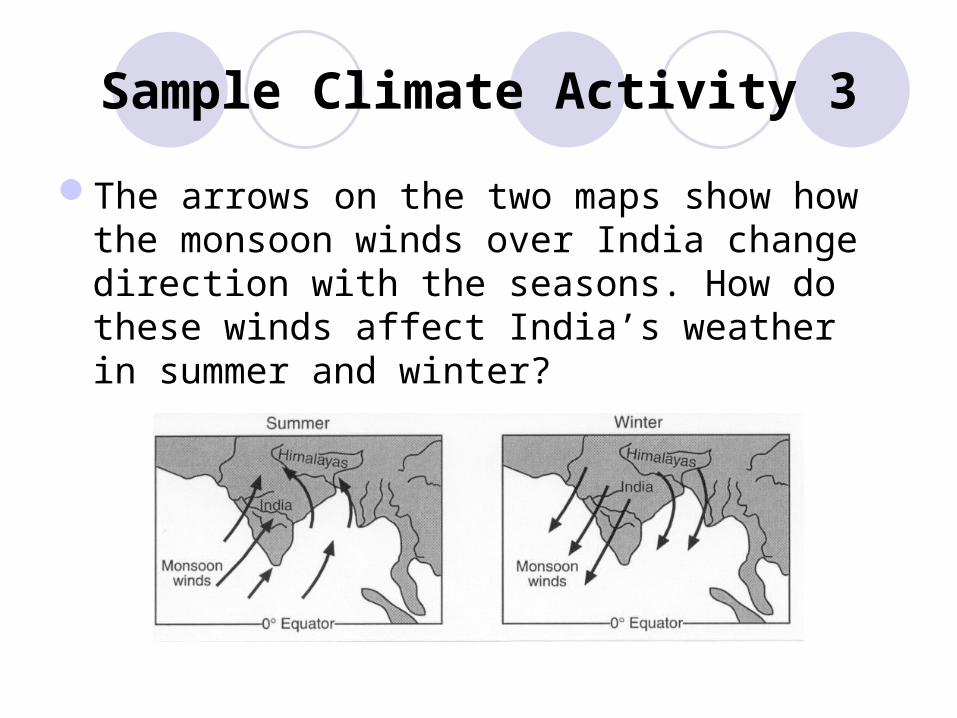
The arrows on the two maps show how the monsoon winds over India change direction with the seasons. How do these winds affect India’s weather in summer and winter?

Sample Climate Activity 3
1.Summer is cooler and less humid than winter.
2.Summer is warmer and more humid than winter.
3.Winter is warmer and less humid than summer.
4.Winter is cooler and more humid than summer.

Sample Climate Activity 3
1.Summer is cooler and less humid than winter.
2.Summer is warmer and more humid than winter.
3.Winter is warmer and less humid than summer.
4.Winter is cooler and more humid than summer.

Sample Climate Activity 4
What changes can be expected to occur at 45˚ N over the next several days?
The duration of insolation will (increase; decrease). Temperature will (increase; decrease).

Sample Climate Activity 4
What changes can be expected to occur at 45˚ N over the next several days?
The duration of insolation will (increase; decrease). Temperature will (increase; decrease).

Sample Climate Activity 5
These cross-sections represent the Pacific Ocean and the atmosphere near the Equator during normal weather and during El Niño conditions.

Sample Climate Activity 5
Sea surface tempera-tures are labeled and trade-wind directions are shown with arrows. Cloud build-up indicates regions of frequent T-storm activity. Change from sea level is shown at the side of each diagram.

Sample Climate Activity 5
Choose the terms that describe sea surface temperatures during El Niño conditions.
The sea surface temperatures are (warmer; cooler) than normal, and Pacific trade winds are from the (east; west).

Sample Climate Activity 5
Choose the terms that describe sea surface temperatures during El Niño conditions.
The sea surface temperatures are (warmer; cooler) than normal, and Pacific trade winds are from the (east; west).

Sample Climate Activity 5
During El Niño conditions, T-storms increase in the E. Pacific because warm, moist air is:(less or more dense)(sinking or rising)(compressing or expanding)(warming or cooling)

Sample Climate Activity 5
During El Niño conditions, T-storms increase in the E. Pacific because warm, moist air is:(less or more dense)(sinking or rising)(compressing or expanding)(warming or cooling)

Sample Climate Activity 5
Compared to normal conditions, the shift of the trade winds caus-ed sea levels during El Niño conditions to:(decrease/increase) at Australia and (decrease/increase) at South America.

Sample Climate Activity 5
Compared to normal conditions, the shift of the trade winds caus-ed sea levels during El Niño conditions to:(decrease; increase) at Australia and (decrease; increase) at South America.

Sample Climate Activity 5
The development of El Niño conditions over this region of the Pacific has caused:
a. changes in world precipitation patterns.
b. the reversal of Earth’s seasons.
c. increased worldwide volcanic activity.
d. decreased ozone levels in the atmosphere.

Sample Climate Activity 5
The development of El Nino conditions over this region of the Pacific has caused:
a. changes in world precipitation patterns.
b. the reversal of Earth’s seasons.
c. increased worldwide volcanic activity.
d. decreased ozone levels in the atmosphere.

Sample Climate Activity 6
The cross sections show different patterns of air movement in Earth’s atmosphere. Air tempera-tures at Earth’s surface are indicated in each cross section. Which cross section shows the most likely pattern of air movement?

Sample Climate Activity 6
The cross sections show different patterns of air movement in Earth’s atmosphere. Air tempera-tures at Earth’s surface are indicated in each cross section. Which cross section shows the most likely pattern of air movement? No. 2

Sample Climate Activity 6
This diagram illustrates the planetary wind and moisture belts in Earth’s Northern Hemisphere.

Sample Climate Activity 6
The climate at 90 degrees north latitude is dry because air at that location is usually
1. warm and rising.
2. warm and sinking.
3. cool and rising.
4. cool and sinking.

Sample Climate Activity 6
The climate at 90 degrees north latitude is dry because air at that location is usually
1. warm and rising.
2. warm and sinking.
3. cool and rising.
4. cool and sinking.

Sample Climate Activity 6
The paths of the surface planetary winds are curved due to Earth’s
1. revolution.
2. rotation.
3. circumference.
4. size.

Sample Climate Activity 6
The paths of the surface planetary winds are curved due to Earth’s
1. revolution.
2. rotation.
3. circumference.
4. size.

Sample Climate Activity 6
Approximately how far above sea level is the tropopause located?
1. 12 miles
2. 12 kilometers
3. 60 miles
4. 60 kilometers

Sample Climate Activity 6
Approximately how far above sea level is the tropopause located?
1. 12 miles
2. 12 kilometers
3. 60 miles
4. 60 kilometers

Sample Climate Activity 7
Describe two changes that occur to the warm, moist air between points 1 and 2 that would cause cloud formation.

Sample Climate Activity 7
Describe two changes that occur to the warm, moist air between points 1 and 2 that would cause cloud formation. Possible responses:air rises; air expands; air cools; temperature reaches the dew point; water vapor condenses

Recommended resource: Earth’s Atmosphere and Its Seasons
TASA’s new comprehensive Climate CD addresses a majority of the
concepts covered in the NSO ‘06 “Climate” Event. See next slide.

Resource: Earth’s Atmosphere and Its Seasons
For a complete description of this newly released instructional CD, price,
and order information, visit http://www.otherworlds-edu.com or

Resource: Earth’s Atmosphere and Its Seasons
… send a check or school PO for $59.00 + $5.00 shipping/handling fee
to: Other Worlds Ed Ent, PO Box 6193, Woodland Park, CO 80866-6193


