Metal–silicate partitioning and constraints on core ...mcdonoug/documents/geochemistry... ·...
16
Metal–silicate partitioning and constraints on core composition and oxygen fugacity during Earth accretion Alexandre Corgne a,b, * , Shantanu Keshav a,c , Bernard J. Wood b , William F. McDonough d , Yingwei Fei a a Geophysical Laboratory, Carnegie Institution of Washington, Washington, DC 20015, USA b GEMOC, Macquarie University, North Ryde, NSW 2109, Australia c Bayerisches Geoinstitut, Universita ¨ t Bayreuth, D-95440 Bayreuth, Germany d Department of Geology, University of Maryland, College Park, MD 20742, USA Received 17 April 2007; accepted in revised form 5 October 2007; available online 13 October 2007 Abstract We present the results of new partitioning experiments between metal and silicate melts for a series of elements normally regarded as refractory lithophile and moderately siderophile and volatile. These include Si, Ti, Ni, Cr, Mn, Ga, Nb, Ta, Cu and Zn. Our new data obtained at 3.6 and 7.7 GPa and between 2123 and 2473 K are combined with literature data to param- eterize the individual effects of oxygen fugacity, temperature, pressure and composition on partitioning. We find that Ni, Cu and Zn become less siderophile with increasing temperature. In contrast, Mn, Cr, Si, Ta, Nb, Ga and Ti become more sid- erophile with increasing temperature, with the highly charged cations (Nb, Ta, Si and Ti) being the most sensitive to variations of temperature. We also find that Ni, Cr, Nb, Ta and Ga become less siderophile with increasing pressure, while Mn becomes more siderophile with increasing pressure. Pressure effects on the partitioning of Si, Ti, Cu and Zn appear to be negligible, as are the effects of silicate melt composition on the partitioning of divalent cations. From the derived parameterization, we pre- dict that the silicate Earth abundances of the elements mentioned above are best explained if core formation in a magma ocean took place under increasing conditions of oxygen fugacity, starting from moderately reduced conditions and finishing at the current mantle–core equilibrium value. Ó 2007 Elsevier Ltd. All rights reserved. 1. INTRODUCTION High-pressure metal–silicate partitioning experiments demonstrate that the mantle contents of some moderately siderophile elements (Ni, Co, P, W, Mo, V) are consistent with core–mantle equilibration at high pressures and high temperatures (e.g. Walker et al., 1993; Hillgren et al., 1994; Thibault and Walter, 1995; Li and Agee, 1996; Right- er and Drake, 1997; Chabot and Agee, 2003; Wade and Wood, 2005). This conclusion is one of the bases for the magma ocean theory, in which molten core materials segre- gate through a largely molten silicate mantle. To constrain further such theory, one should ask whether these condi- tions of core formation are consistent with the mantle con- tents of other elements. For example, the mantle contents of highly siderophile elements (Au, Re, PGEs) may be too elevated to be explained by simple core–mantle equili- bration in a magma ocean, and may, instead, indicate the accretion of a late veneer of chondritic material to the man- tle after core formation (e.g. Holzheid et al., 2000; Ertel et al., 2006). However, the ‘late veneer’ model is under de- bate with other reports reaching opposite conclusions (Righter and Drake, 1997; Danielson et al., 2005; Cottrell and Walker, 2006). In addition to pressure and tempera- ture, composition is a key factor that can affect element dis- tribution during core formation. In particular, the degree of oxidation of the planetary building materials, which de- pends on composition, has been shown to be a critical 0016-7037/$ - see front matter Ó 2007 Elsevier Ltd. All rights reserved. doi:10.1016/j.gca.2007.10.006 * Corresponding author. Fax: +61 2 9850 6904. E-mail address: [email protected] (A. Corgne). www.elsevier.com/locate/gca Available online at www.sciencedirect.com Geochimica et Cosmochimica Acta 72 (2008) 574–589
-
Upload
vuongthien -
Category
Documents
-
view
216 -
download
0
Transcript of Metal–silicate partitioning and constraints on core ...mcdonoug/documents/geochemistry... ·...

Available online at www.sciencedirect.com
www.elsevier.com/locate/gca
Geochimica et Cosmochimica Acta 72 (2008) 574–589
Metal–silicate partitioning and constraints on corecomposition and oxygen fugacity during Earth accretion
Alexandre Corgne a,b,*, Shantanu Keshav a,c, Bernard J. Wood b,William F. McDonough d, Yingwei Fei a
a Geophysical Laboratory, Carnegie Institution of Washington, Washington, DC 20015, USAb GEMOC, Macquarie University, North Ryde, NSW 2109, Australia
c Bayerisches Geoinstitut, Universitat Bayreuth, D-95440 Bayreuth, Germanyd Department of Geology, University of Maryland, College Park, MD 20742, USA
Received 17 April 2007; accepted in revised form 5 October 2007; available online 13 October 2007
Abstract
We present the results of new partitioning experiments between metal and silicate melts for a series of elements normallyregarded as refractory lithophile and moderately siderophile and volatile. These include Si, Ti, Ni, Cr, Mn, Ga, Nb, Ta, Cuand Zn. Our new data obtained at 3.6 and 7.7 GPa and between 2123 and 2473 K are combined with literature data to param-eterize the individual effects of oxygen fugacity, temperature, pressure and composition on partitioning. We find that Ni, Cuand Zn become less siderophile with increasing temperature. In contrast, Mn, Cr, Si, Ta, Nb, Ga and Ti become more sid-erophile with increasing temperature, with the highly charged cations (Nb, Ta, Si and Ti) being the most sensitive to variationsof temperature. We also find that Ni, Cr, Nb, Ta and Ga become less siderophile with increasing pressure, while Mn becomesmore siderophile with increasing pressure. Pressure effects on the partitioning of Si, Ti, Cu and Zn appear to be negligible, asare the effects of silicate melt composition on the partitioning of divalent cations. From the derived parameterization, we pre-dict that the silicate Earth abundances of the elements mentioned above are best explained if core formation in a magmaocean took place under increasing conditions of oxygen fugacity, starting from moderately reduced conditions and finishingat the current mantle–core equilibrium value.� 2007 Elsevier Ltd. All rights reserved.
1. INTRODUCTION
High-pressure metal–silicate partitioning experimentsdemonstrate that the mantle contents of some moderatelysiderophile elements (Ni, Co, P, W, Mo, V) are consistentwith core–mantle equilibration at high pressures and hightemperatures (e.g. Walker et al., 1993; Hillgren et al.,1994; Thibault and Walter, 1995; Li and Agee, 1996; Right-er and Drake, 1997; Chabot and Agee, 2003; Wade andWood, 2005). This conclusion is one of the bases for themagma ocean theory, in which molten core materials segre-gate through a largely molten silicate mantle. To constrain
0016-7037/$ - see front matter � 2007 Elsevier Ltd. All rights reserved.
doi:10.1016/j.gca.2007.10.006
* Corresponding author. Fax: +61 2 9850 6904.E-mail address: [email protected] (A. Corgne).
further such theory, one should ask whether these condi-tions of core formation are consistent with the mantle con-tents of other elements. For example, the mantle contentsof highly siderophile elements (Au, Re, PGEs) may betoo elevated to be explained by simple core–mantle equili-bration in a magma ocean, and may, instead, indicate theaccretion of a late veneer of chondritic material to the man-tle after core formation (e.g. Holzheid et al., 2000; Ertelet al., 2006). However, the ‘late veneer’ model is under de-bate with other reports reaching opposite conclusions(Righter and Drake, 1997; Danielson et al., 2005; Cottrelland Walker, 2006). In addition to pressure and tempera-ture, composition is a key factor that can affect element dis-tribution during core formation. In particular, the degree ofoxidation of the planetary building materials, which de-pends on composition, has been shown to be a critical

Table 1Nominal compositions of the starting materials (in wt%)
SM-1 SM-2
O 32.02 30.23Mg 15.28 15.04Fe 28.77 29.22Si 16.56 18.25Al 1.36 1.34Ca 1.46 1.43Ti 0.39 0.39Ni 1.58 1.56Mn 0.16 0.16Cr 0.46 0.45Ga 0.20 0.19Nb 0.20 0.19Ta 0.20 0.19Sc 0.20 0.19Nd 0.20 0.19Sm 0.20 0.19Lu 0.20 0.19Hf 0.20 0.19Th 0.20 0.19U 0.20 0.19
Total 100.00 100.00
Metal–silicate partitioning and conditions of core formation 575
parameter. Since models have often called for an increase ofoxygen fugacity (fo2, a measure of the oxidation state) dur-ing planetary accretion and core formation (e.g. Wanke,1981; O’Neill, 1991; Wade and Wood, 2005), it is importantto constrain the effect of oxygen fugacity on partitioning.
Here, we report new metal–silicate partitioning data at3.6 and 7.7 GPa and between 2123 and 2473 K for elementsnormally regarded as moderately volatile (Mn, Cr, Ga, Cuand Zn) and refractory lithophile (Nb, Ta, Ti, Sc, Lu, Hf,U, Th, Sm and Nd). The latter are generally assumed tobe present entirely in the silicate Earth, whereas a more sig-nificant proportion of the former probably entered the core.Of the moderately volatile elements Ga is typically sidero-phile (it is a classifying element for iron meteorites), whileMn, Cr and Zn are both oxyphile and siderophile, depend-ing on oxygen fugacity, and Cu has chalcophile, siderophileand oxyphile tendencies. Mantle depletions of all of theselatter elements relative to their abundance in CI chondritesmay also indicate loss by volatilization (or incomplete con-densation) prior to and during planetary accretion (e.g.Walter et al., 2000).
This contribution builds upon and tests further the mod-el of Wade and Wood (2005) for a progressively oxidizingEarth during accretion. Our new data are combined withliterature data to parameterize, following the thermody-namic methodology described by Wade and Wood (2005),the individual effects of composition, pressure, temperatureand fo2 on partitioning and provide some answers to thefollowing questions:
(1) What is the range of composition–pressure–tempera-ture–fo2 conditions under which core formation in amagma ocean is compatible with the known mantlecontents of these elements?
(2) What constraints do these conditions (particularlyoxygen fugacity) place on the trace element budgetof the core?
(3) Are the depletions of Ga, Cr, Zn and Mn in the man-tle due to their volatility or, alternatively, a combina-tion of this and sequestration into the core?
2. METHODS
Partitioning experiments between metal and silicatemelts were performed on two synthetic compositions pre-pared from high-purity oxides, carbonates and metals. Fol-lowing the work of Thibault and Walter (1995), the relativeproportions of Si, Al, Ca, Mg, Fe and Ni in the first com-position (SM-1) were chosen to resemble that of CI-chon-drite (Wasson and Kallemeyn, 1988). The relativeabundances of metal Fe and Fe2O3 were such that, aftermelting, the amount of FeO in the silicate melt is close toprimitive mantle value. This imposes that SM-1 is largelydepleted in O when compared with CI-chondrite (32 and41 wt%, respectively). To assess the effect of oxygen fugac-ity on partitioning, a more reduced starting material (SM-2)was also prepared. Compared to SM-1, SM-2 is enriched inSi and Fe and depleted in O (Table 1), and resembles moreE-chondrite composition (Wasson and Kallemeyn, 1988).
To prepare the two starting materials, the required propor-tions of dried SiO2, Al2O3, MgO and CaO (as CaCO3) werefirst mixed, then slowly decarbonated in air from 600 to1000 �C. Minor and trace elements were added as AASsolutions (�3000 ppm each of Nb, Ta, Ga, Sc, U, Th, Lu,Hf, Sm and Nd) and high-purity oxides (�6000 ppm Ti,�7000 ppm Cr, �2500 ppm Mn) to the silicate mixture.This mixture was then denitrified in air at 800 �C for 2 h.The appropriate amounts of Ni (�1.6 wt%), Fe, Fe2O3
and Fe83Si17 were then added to split portions of the silicatemixture. In SM-1, Fe was added as Fe metal (�26 wt%) andFe2O3 (�4.4 wt%), while, in SM-2, Fe was added as Fe me-tal (�10.6 wt%) and Fe83Si17 (�21.4 wt%). The startingpowders were homogenized under ethanol, finally dried at100 �C for 24 h, and stored in a desiccator to minimizewater content. Final (nominal) concentrations of the twostarting compositions are reported in Table 1.
Experiments were carried out at 3.6 ± 0.2 and7.7 ± 0.3 GPa and between 2123 and 2473 K using multi-anvil presses at the Geophysical Laboratory. We followedthe same experimental procedure as Corgne et al. (2007).The reader is referred to that study and Table 2 for addi-tional experimental details. As done in previous metal–sili-cate partitioning studies (e.g. Thibault and Walter, 1995;Corgne et al., 2007), we kept run durations relatively shortto minimize metal infiltration into the graphite capsules.Furthermore, Thibault and Walter (1995) have shown thatrun durations as short as a few tens of seconds were suffi-cient to approach chemical equilibrium in this type ofexperiment. This point is discussed further in Section 3.2.We were unable to collect partitioning data from multi-an-vil runs performed at pressures above 7.7 GPa. As observedby Thibault and Walter (1995), capsule transformation todiamond at these conditions induced rapid liquid metaldispersion within the capsule. Metal blobs remaining in
Table 2Experimental detailsa
Run Composition P (GPa) T (K) t (s) DIWb DIWc nbo/td
PL-169 SM-1 3.6 2123 100 �0.8 �2.0 2.1PL-185 SM-1 3.6 2273 100 �0.9 �2.0 2.1PR-369 SM-1 3.6 2473 100 �1.1 �2.1 2.1PR-373 SM-1 7.7 2273 100 �0.6 �1.9 2.2PR-376 SM-2 3.6 2273 20 �3.2 �4.4 1.8PR-383 SM-2 3.6 2273 100 �3.1 �4.4 1.7PR-375 SM-2 3.6 2273 600 �3.0 �4.2 1.7PR-368 SM-2 3.6 2473 100 �3.1 �4.4 1.8PR-365 SM-2 7.7 2273 110 �3.2 �4.4 1.7
a Notations: P, pressure; T, temperature; t, run duration.b Oxygen fugacity relative to the iron–wustite buffer calculated using csilicate
FeO ¼ 3 and cmetalFe ¼ 0:8 (see text for details).
c Oxygen fugacity relative to the iron–wustite buffer calculated assuming ideal mixing behaviour (for comparison).d nbo/t: molar ratio of non-bridging oxygen to tetrahedrally coordinated cations calculated assuming all Fe as Fe2+.
576 A. Corgne et al. / Geochimica et Cosmochimica Acta 72 (2008) 574–589
contact with silicate melt were unfortunately too small(<10 lm) to measure their trace element contents.
Major and minor element contents of the experimentalcharges were measured using the 5-spectrometer JEOL8900 electron probe micro-analyzer (EPMA) at the Geophys-ical Laboratory. We used a series of silicate, oxide and metalstandards and conditions of 30 nA beam current and 15 kVaccelerating voltage. Analyses were made with a defocusedbeam (10–30 lm diameter) to average the compositions ofthe fine-grained quench phases that composed metal and sil-icate phases. Analyses were reduced using a ZAF correctionroutine. After removal of the carbon coating, carbon con-tents in metal were measured using a PC-2 crystal on theCAMECA SX100 microprobe at GEMOC. A calibrationcurve for the C Ka line intensity was established using syn-thetic standards containing 0.0, 0.39, 0.57, 0.87, 5.3 wt% car-bon (NIST steel standards and two in-house standards) and anatural cohenite from the Canyon Diablo meteorite (6.7 wt%carbon). The following relation was derived: C Ka line inten-sity (cps/s/nA) = 7.0 * C content (wt%) + 3.3. The system-atic analysis of standards after each unknown sampleconfirmed the reproducibility of the calibration. Analyticalconditions were 15 kV accelerating voltage and 20 nA beamcurrent for a beam diameter of 5–10 lm.
Minor and trace element contents were measured usingLA-ICPMS microprobes at the University of Maryland(UMD) and at GEMOC. These analyses were performedwith Nd:YAG New Wave Research laser systems (UMD:213 nm wavelength, 6–10 Hz frequency, 4–6 J/cm2 power;GEMOC: 266 nm, 5 Hz, 5.5 J/cm2) coupled to magneticsector ICP mass spectrometer (Finnigan Element 2,UMD) or a quadrupole mass spectrometer (Agilent7500S, GEMOC). The ablation cells were flushed with Heto enhance sensitivity. Laser ablation was operated in spotand line sampling mode with a beam diameter between 30and 100 lm depending on phase morphology. Backgroundgas blanks were measured on all masses for 30–60 s beforelaser ablation. Total laser firing time ranged between 30 and120 s. The reference NIST 610 glass was used as calibrationstandard for both metal and silicate phases. Selected time-resolved spectra were processed using a modified versionof LAMTRACE (UMD) and GLITTER (GEMOC) to ap-ply background subtraction and calculate absolute element
abundances. Variations in ablation yields were corrected byreference to Mn and Ni concentrations measured byEPMA, respectively, for the silicate and the metal. Mini-mum detection limits are calculated on the basis of threestandard deviations above the background count rate(99% confidence). The use of a platinum cone for theICPMS at GEMOC rather than the more common Ni cone(as used in UMD) allowed us to measure low Ni concentra-tions in the silicate melts, with detection limits reachingsub-ppm levels. Repeat analyses of the NIST 610 standardshow that the analytical uncertainties are better than ±3%for all measured elements. Accuracy was assessed by com-paring observed and published contents of secondary sili-cate and steel standards (BCR-2G, NIST 661). Availableobserved/published content ratios show that accuracy iswithin ±10% or better for all elements except for Nb(15%) and Ta (18%) in metal. Duplicate analyses usuallyshow excellent agreement between data from the EPMAand both LA-ICPMS microprobes. However, for a reasonthat remains unclear to us, Nb and Ta measurements atUMD were inconsistent with results from the other twotechniques and mass balance considerations. These UMDdata were not used.
3. RESULTS
3.1. Phase morphology and major element composition
All samples contain blebs of molten alloy up to 200 lmacross and surrounded by quench silicate melt (Fig. 1), thelatter constituting approximately 70% of the experimentalcharge. EPMA profiles and LA-ICPMS time-resolved spec-tra across the metal alloy and silicate phases suggest thatboth phases are compositionally homogeneous, hence thatequilibrium conditions are approached. The main composi-tional features of the metal and silicate phases are as fol-lows. At relatively low oxygen fugacity (SM-2composition), the alloy contains about 82 wt% Fe, 5 wt%Ni, 10 wt% Si, 1–2 wt% C and significant amounts of Cr,Mn, Nb, Ta, Ga and Ti (Table 3). In contrast, at higheroxygen fugacity (SM-1), the alloy is essentially made ofabout 90 wt% Fe, 5 wt% Ni and 5 wt% C. At low oxygenfugacity, the silicate melt contains significantly less Fe,

Fig. 1. Back-scattered electron images of run products showing typical phase morphologies and dimensions. (a) Products of run PL185(starting composition SM-1) with magnified views of (b) the molten silicate and (c) the molten metal. (d) Detailed view of the quench textureof the molten metal in run PR365 (starting composition SM-2). As shown in these images, metal and silicate liquids did not quench to a singlephase. The silicate melt, which developed similar texture with both SM-1 and SM-2 starting compositions upon quenching, is composed of amixture of dendritic quench crystals and possibly interstitial glass (see b). Two quench textures are observed for the metal depending on thestarting compositions. In runs performed using SM-2, the metal quenched as two phases, one (light grey) being slightly more enriched in Siand Ni and slightly more depleted in Cr and C than the other one (dark grey) (see d). Metal liquids in runs performed using SM-1 exhibit amore subtle quench texture than in runs using SM-2, with dendrites of Fe-rich alloys only visible at very high contrast (see c).
Table 3Average metal compositions
PL-169 PL-185 PR-369 PR-373 PR-376 PR-383 PR-375 PR-368 PR-365
EPMA N = 9a N = 11 N = 10 N = 10 N = 10 N = 13 N = 10 N = 11 N = 12Fe (wt%) 89.72 (19)b 89.52 (6) 88.45 (28) 87.28 (22) 82.19 (30) 81.80 (13) 82.24 (22) 82.45 (15) 82.79 (61)Ni 5.66 (10) 5.21 (17) 3.77 (8) 5.22 (10) 4.63 (9) 5.14 (5) 4.25 (6) 4.38 (8) 4.25 (24)Si 0.036 (2) 0.036 (16) 0.039 (2) 0.025 (1) 9.03 (20) 9.54 (12) 9.92 (21) 9.70 (22) 9.25 (29)Mn <0.01c <0.01 0.020 (2) <0.01 0.22 (2) 0.22 (1) 0.23 (1) 0.24 (1) 0.27 (4)Cr 0.26 (3) 0.44 (2) 0.66 (2) 0.42 (2) 1.11 (5) 1.14 (3) 1.09 (4) 1.09 (5) 1.20 (7)Ti <0.006 <0.006 <0.006 <0.006 0.11 (1) 0.10 (1) 0.09 (1) 0.09 (1) 0.07 (1)Ga 0.40 (2) 0.35 (2) 0.40 (3) 0.27 (2) 0.45 (1) 0.48 (1) 0.50 (2) 0.47 (1) 0.43 (2)Nb 0.013 (6) 0.047 (18) 0.12 (1) 0.043 (16) 0.50 (6) 0.57 (8) 0.31 (3) 0.43 (5) 0.41 (4)Ta <0.028 <0.028 <0.028 <0.028 0.39 (5) 0.38 (5) 0.21 (4) 0.34 (5) 0.32 (4)O 0.21 (1) 0.18 (1) 0.18 (1) 0.17 (1) 0.22 (4) 0.21 (1) 0.19 (1) 0.22 (1) 0.21 (1)C 5.0 (5) 4.7 (2) 4.3 (4) 6.1 (3) 1.7 (5) 1.6 (3) 1.9 (4) 2.0 (1) 1.4 (5)Total 101.2 100.4 99.3 99.5 100.5 101.2 101.2 101.4 100.6
LA-ICPMSd N = 4 N = 3 N = 4 N = 4 N = 4 N = 4 N = 4 N = 3 N = 3Ti (ppm) <10 <10 <10 <10 1273 (58) 1199 (61) 1265(67) 1452 (91) 957 (56)Cr 2714 (80) 3970 (128) 6247 (205) 3631 (122) 11635 (378) 11310 (366) 11403 (371) 11421 (375) 13619 (650)Mn 35 (1) 88 (3) 174 (6) 79 (3) 2272 (74) 2289 (76) 2589 (87) 2739 (93) 2815 (97)Ga 4036 (157) 4073 (135) 4197 (143) 2867 (101) 4970 (175) 5106(183) 5450 (199) 5080 (189) 5016 (191)Nb 76 (2) 449(15) 1043 (35) 296 (10) 4351 (203) 4854 (238) 2955(150) 4441 (234) 4140 (228)Ta 24 (1) 40 (1) 58 (2) 51 (2) 3678 (194) 3689 (206) 2213 (128) 3714 (224) 4063 (256)Cu 69 (3) 92 (3) 14 (1) 59 (2) 336 (11) 248 (8) 150 (5) 239 (8) 329 (11)Zn 14 (1) 5.3 (1) 20 (1) 9 (1) 54 (2) 58 (2) 55 (2) 48 (2) 41(2)
a Number of EPMA and LA-ICPMS analyses.b Values in parentheses are two standard errors for EPMA and one standard error for LA-ICPMS in terms of least digits cited.c Contents below detection limit.d LA-ICPMS data presented here are from measurements made at GEMOC. LA-ICPMS measurements made at UMD show that Sc, Nd,
Sm, Lu, Hf, Th and U have concentrations in the alloy below detection limits (<ppm level).
Metal–silicate partitioning and conditions of core formation 577
Ni, Cr, Ga, Nb and Ta, but it is slightly more enriched in Oand Si. A complete summary of element concentrations ofalloy and silicate phases is given in Tables 3 and 4, respec-tively. Resulting molar metal–silicate partition coefficients(D�M, with D�M ¼ mol% concentration of M in liquid me-tal/mol% concentration of MOn/2 in silicate melt) are givenin Table 5. Molar partition coefficients rather than weight
partition coefficients were used in this study to characterizeelement partitioning between metal and silicate.
3.2. Time series
Experiments were performed at 3.6 GPa and 2273 K onthe SM-2 starting composition to test the observations
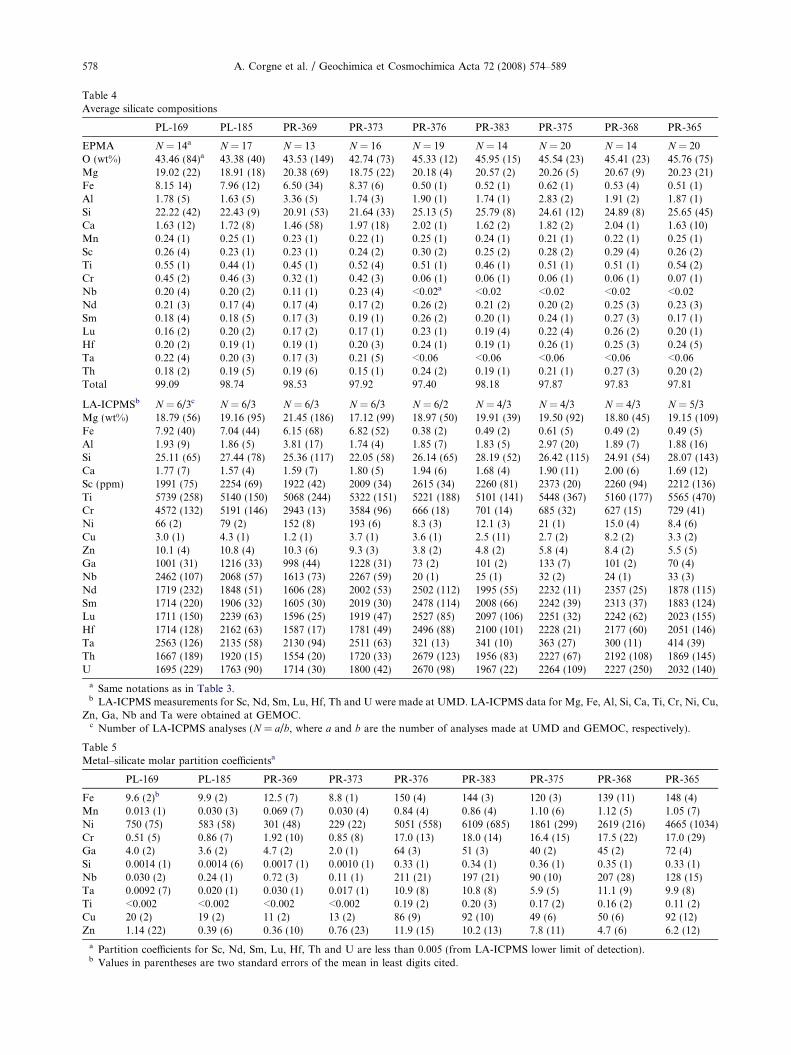
Table 4Average silicate compositions
PL-169 PL-185 PR-369 PR-373 PR-376 PR-383 PR-375 PR-368 PR-365
EPMA N = 14a N = 17 N = 13 N = 16 N = 19 N = 14 N = 20 N = 14 N = 20O (wt%) 43.46 (84)a 43.38 (40) 43.53 (149) 42.74 (73) 45.33 (12) 45.95 (15) 45.54 (23) 45.41 (23) 45.76 (75)Mg 19.02 (22) 18.91 (18) 20.38 (69) 18.75 (22) 20.18 (4) 20.57 (2) 20.26 (5) 20.67 (9) 20.23 (21)Fe 8.15 14) 7.96 (12) 6.50 (34) 8.37 (6) 0.50 (1) 0.52 (1) 0.62 (1) 0.53 (4) 0.51 (1)Al 1.78 (5) 1.63 (5) 3.36 (5) 1.74 (3) 1.90 (1) 1.74 (1) 2.83 (2) 1.91 (2) 1.87 (1)Si 22.22 (42) 22.43 (9) 20.91 (53) 21.64 (33) 25.13 (5) 25.79 (8) 24.61 (12) 24.89 (8) 25.65 (45)Ca 1.63 (12) 1.72 (8) 1.46 (58) 1.97 (18) 2.02 (1) 1.62 (2) 1.82 (2) 2.04 (1) 1.63 (10)Mn 0.24 (1) 0.25 (1) 0.23 (1) 0.22 (1) 0.25 (1) 0.24 (1) 0.21 (1) 0.22 (1) 0.25 (1)Sc 0.26 (4) 0.23 (1) 0.23 (1) 0.24 (2) 0.30 (2) 0.25 (2) 0.28 (2) 0.29 (4) 0.26 (2)Ti 0.55 (1) 0.44 (1) 0.45 (1) 0.52 (4) 0.51 (1) 0.46 (1) 0.51 (1) 0.51 (1) 0.54 (2)Cr 0.45 (2) 0.46 (3) 0.32 (1) 0.42 (3) 0.06 (1) 0.06 (1) 0.06 (1) 0.06 (1) 0.07 (1)Nb 0.20 (4) 0.20 (2) 0.11 (1) 0.23 (4) <0.02a <0.02 <0.02 <0.02 <0.02Nd 0.21 (3) 0.17 (4) 0.17 (4) 0.17 (2) 0.26 (2) 0.21 (2) 0.20 (2) 0.25 (3) 0.23 (3)Sm 0.18 (4) 0.18 (5) 0.17 (3) 0.19 (1) 0.26 (2) 0.20 (1) 0.24 (1) 0.27 (3) 0.17 (1)Lu 0.16 (2) 0.20 (2) 0.17 (2) 0.17 (1) 0.23 (1) 0.19 (4) 0.22 (4) 0.26 (2) 0.20 (1)Hf 0.20 (2) 0.19 (1) 0.19 (1) 0.20 (3) 0.24 (1) 0.19 (1) 0.26 (1) 0.25 (3) 0.24 (5)Ta 0.22 (4) 0.20 (3) 0.17 (3) 0.21 (5) <0.06 <0.06 <0.06 <0.06 <0.06Th 0.18 (2) 0.19 (5) 0.19 (6) 0.15 (1) 0.24 (2) 0.19 (1) 0.21 (1) 0.27 (3) 0.20 (2)Total 99.09 98.74 98.53 97.92 97.40 98.18 97.87 97.83 97.81
LA-ICPMSb N = 6/3c N = 6/3 N = 6/3 N = 6/3 N = 6/2 N = 4/3 N = 4/3 N = 4/3 N = 5/3Mg (wt%) 18.79 (56) 19.16 (95) 21.45 (186) 17.12 (99) 18.97 (50) 19.91 (39) 19.50 (92) 18.80 (45) 19.15 (109)Fe 7.92 (40) 7.04 (44) 6.15 (68) 6.82 (52) 0.38 (2) 0.49 (2) 0.61 (5) 0.49 (2) 0.49 (5)Al 1.93 (9) 1.86 (5) 3.81 (17) 1.74 (4) 1.85 (7) 1.83 (5) 2.97 (20) 1.89 (7) 1.88 (16)Si 25.11 (65) 27.44 (78) 25.36 (117) 22.05 (58) 26.14 (65) 28.19 (52) 26.42 (115) 24.91 (54) 28.07 (143)Ca 1.77 (7) 1.57 (4) 1.59 (7) 1.80 (5) 1.94 (6) 1.68 (4) 1.90 (11) 2.00 (6) 1.69 (12)Sc (ppm) 1991 (75) 2254 (69) 1922 (42) 2009 (34) 2615 (34) 2260 (81) 2373 (20) 2260 (94) 2212 (136)Ti 5739 (258) 5140 (150) 5068 (244) 5322 (151) 5221 (188) 5101 (141) 5448 (367) 5160 (177) 5565 (470)Cr 4572 (132) 5191 (146) 2943 (13) 3584 (96) 666 (18) 701 (14) 685 (32) 627 (15) 729 (41)Ni 66 (2) 79 (2) 152 (8) 193 (6) 8.3 (3) 12.1 (3) 21 (1) 15.0 (4) 8.4 (6)Cu 3.0 (1) 4.3 (1) 1.2 (1) 3.7 (1) 3.6 (1) 2.5 (11) 2.7 (2) 8.2 (2) 3.3 (2)Zn 10.1 (4) 10.8 (4) 10.3 (6) 9.3 (3) 3.8 (2) 4.8 (2) 5.8 (4) 8.4 (2) 5.5 (5)Ga 1001 (31) 1216 (33) 998 (44) 1228 (31) 73 (2) 101 (2) 133 (7) 101 (2) 70 (4)Nb 2462 (107) 2068 (57) 1613 (73) 2267 (59) 20 (1) 25 (1) 32 (2) 24 (1) 33 (3)Nd 1719 (232) 1848 (51) 1606 (28) 2002 (53) 2502 (112) 1995 (55) 2232 (11) 2357 (25) 1878 (115)Sm 1714 (220) 1906 (32) 1605 (30) 2019 (30) 2478 (114) 2008 (66) 2242 (39) 2313 (37) 1883 (124)Lu 1711 (150) 2239 (63) 1596 (25) 1919 (47) 2527 (85) 2097 (106) 2251 (32) 2242 (62) 2023 (155)Hf 1714 (128) 2162 (63) 1587 (17) 1781 (49) 2496 (88) 2100 (101) 2228 (21) 2177 (60) 2051 (146)Ta 2563 (126) 2135 (58) 2130 (94) 2511 (63) 321 (13) 341 (10) 363 (27) 300 (11) 414 (39)Th 1667 (189) 1920 (15) 1554 (20) 1720 (33) 2679 (123) 1956 (83) 2227 (67) 2192 (108) 1869 (145)U 1695 (229) 1763 (90) 1714 (30) 1800 (42) 2670 (98) 1967 (22) 2264 (109) 2227 (250) 2032 (140)
a Same notations as in Table 3.b LA-ICPMS measurements for Sc, Nd, Sm, Lu, Hf, Th and U were made at UMD. LA-ICPMS data for Mg, Fe, Al, Si, Ca, Ti, Cr, Ni, Cu,
Zn, Ga, Nb and Ta were obtained at GEMOC.c Number of LA-ICPMS analyses (N = a/b, where a and b are the number of analyses made at UMD and GEMOC, respectively).
Table 5Metal–silicate molar partition coefficientsa
PL-169 PL-185 PR-369 PR-373 PR-376 PR-383 PR-375 PR-368 PR-365
Fe 9.6 (2)b 9.9 (2) 12.5 (7) 8.8 (1) 150 (4) 144 (3) 120 (3) 139 (11) 148 (4)Mn 0.013 (1) 0.030 (3) 0.069 (7) 0.030 (4) 0.84 (4) 0.86 (4) 1.10 (6) 1.12 (5) 1.05 (7)Ni 750 (75) 583 (58) 301 (48) 229 (22) 5051 (558) 6109 (685) 1861 (299) 2619 (216) 4665 (1034)Cr 0.51 (5) 0.86 (7) 1.92 (10) 0.85 (8) 17.0 (13) 18.0 (14) 16.4 (15) 17.5 (22) 17.0 (29)Ga 4.0 (2) 3.6 (2) 4.7 (2) 2.0 (1) 64 (3) 51 (3) 40 (2) 45 (2) 72 (4)Si 0.0014 (1) 0.0014 (6) 0.0017 (1) 0.0010 (1) 0.33 (1) 0.34 (1) 0.36 (1) 0.35 (1) 0.33 (1)Nb 0.030 (2) 0.24 (1) 0.72 (3) 0.11 (1) 211 (21) 197 (21) 90 (10) 207 (28) 128 (15)Ta 0.0092 (7) 0.020 (1) 0.030 (1) 0.017 (1) 10.9 (8) 10.8 (8) 5.9 (5) 11.1 (9) 9.9 (8)Ti <0.002 <0.002 <0.002 <0.002 0.19 (2) 0.20 (3) 0.17 (2) 0.16 (2) 0.11 (2)Cu 20 (2) 19 (2) 11 (2) 13 (2) 86 (9) 92 (10) 49 (6) 50 (6) 92 (12)Zn 1.14 (22) 0.39 (6) 0.36 (10) 0.76 (23) 11.9 (15) 10.2 (13) 7.8 (11) 4.7 (6) 6.2 (12)
a Partition coefficients for Sc, Nd, Sm, Lu, Hf, Th and U are less than 0.005 (from LA-ICPMS lower limit of detection).b Values in parentheses are two standard errors of the mean in least digits cited.
578 A. Corgne et al. / Geochimica et Cosmochimica Acta 72 (2008) 574–589

Fig. 2. Variations of molar partition coefficients (DM*) as a
function of run duration. The three experiments were performedat 3.6 GPa and 2273 K using the SM-2 composition as startingmaterial. Error bars are within the size of symbols. Note that thepartition coefficients of some elements (except Ti, Si, Cr, Fe, Mn)decrease as the run duration reaches �600 s. As discussed in thetext, this is likely due to metal infiltration in the graphite capsules.
Metal–silicate partitioning and conditions of core formation 579
made by Thibault and Walter (1995) on similar partitioningexperiments. These authors found that runs as short as 5–300 s were sufficient to approach chemical equilibrium. Inlonger runs, they observed that a large portion of the metalinfiltrated the C-capsule. Our time series consisted of threeexperiments run at 20, 100 and 600 s, respectively. The twoshortest experiments did not show any significant metalinfiltration as opposed to the third one. Partition coeffi-cients for these three experiments are reported in Fig. 2. Re-sults show that partition coefficients remain almostidentical within the first 100 s of experiment. As the runduration is increased to 600 s, partition coefficients for Ni,Nb, Cu, Ga, Zn and Ta decrease by up to a factor of 2 whileD�Mn increases slightly. Our observations confirm the inter-pretation made by Thibault and Walter (1995) that metalinfiltration in the C-capsule leads to partitioning values thatare not representative of equilibrium. As metal infiltrationprogresses, the bulk composition of the system is continu-ously changing, resulting in a disequilibrium between alloyand silicate. Therefore, run durations for the remainingexperiments were kept short (�100 s) to minimize metalinfiltration and generate partition coefficients most repre-sentative of equilibrium conditions.
3.3. Partitioning of refractory lithophile elements
One objective of this study was to test whether elementsnormally regarded as refractory lithophile retain theirstrongly lithophile behaviour at low oxygen fugacity. Thisis the case for Sc, Nd, Sm, Lu, Hf, Th and U, for whichLA-ICPMS measurements show that their concentrationsin the metal alloy are below detection limits (sub-ppm level)even under strongly reducing conditions. Correspondingpartition coefficients are <0.005, an upper bound limit con-sistent with the absence of these elements in the core. Ourresult for U is in good agreement with the recent data ofWheeler et al. (2006) and Malavergne et al. (2007) whofound DU values to lie below 0.001 for S-free metal at oxy-
gen fugacity above IW-4. In contrast to U, Th, Hf and largetrivalent cations, Nb and Ta have measurable contents inthe molten metal using both starting materials, with thehighest contents for the more reduced composition (SM-2). Furthermore, measurable contents of Ti were detectedat low oxygen fugacity. The partitioning behaviour ob-served for Nb, Ta and Ti is consistent with the results fromprevious experimental studies (e.g. Kilburn and Wood,1997; Gessmann and Rubie, 1998; Wade and Wood,2001; Wade and Wood, 2005). We discuss this further inthe next sections.
3.4. Dependence on oxygen fugacity
Metal–silicate partitioning is known to be a function ofoxygen fugacity (e.g. Schmitt et al., 1989). To understandelement distribution between the core and silicate Earthduring core formation, it is therefore crucial to determinethe effect of oxygen fugacity on partitioning. In theory, oxy-gen fugacity can be calculated from the Fe and FeO contentof the alloy and silicate phase, respectively (e.g. Drakeet al., 1989). Relative to the iron–wustite equilibrium, theoxygen fugacity is given by:
DIW ¼ 2 log asilicateFeO =ametal
Fe
� �ð1Þ
where asilicateFeO and ametal
Fe are the activities of FeO in the sili-cate melt and Fe in the molten metal, respectively. Activitycan be calculated from activity coefficient (c) and mole frac-tion (x) according to the relation aphase
M ¼ cphaseM � xphase
M . Itfollows:
DIW ¼ 2 log xsilicateFeO =xmetal
Fe
� �þ 2 log csilicate
FeO =cmetalFe
� �ð2Þ
As discussed later in Section 4, it is possible to calculate me-tal activity coefficient using the interaction parameter ap-proach and the methodology of Ma (2001) (see Eq. (11)).The values of cmetal
Fe derived following this method clusteraround 0.8, that is, tending towards small negative devia-tions from ideality. In contrast, published csilicate
FeO values usu-ally indicate positive deviations from ideal mixingbehaviour. Holzheid et al. (1997) observed that csilicate
FeO isessentially independent of temperature, oxygen fugacityand FeO content (at least to �12 wt%) and lies around1.7 ± 0.2. However, these authors found that c silicate
FeO valuesare slightly larger with more elevated MgO contents(>20 wt%). For similar silicate liquid composition thanthe one of this study (�30 wt% MgO), Asahara et al.(2004) reported a ratio of FeO activity coefficient ratio be-tween silicate liquid and magnesiowustite of �1.5. Com-bined with the value of �2 for the activity coefficient ofFeO in magnesiowustite derived by Kilburn and Wood(1997) for MgO-rich silicate liquids, the value of csilicate
FeO
can be estimated to be close to �3. This result is in goodagreement with measurements made in MgO-rich slags inequilibrium with molten iron (Liu et al., 2001 and refer-ences therein) and with measurements by mass-spectrome-try in the FeO–MgO–SiO2 system at high temperatures(Plante et al., 1992). Applying Eq. (2) with csilicate
FeO andcmetal
Fe values of 3 and �0.8, respectively, indicates that theoxygen fugacity varies between �3.2 log units below theIW buffer (using SM-2) and �0.8 log units below the IW
580 A. Corgne et al. / Geochimica et Cosmochimica Acta 72 (2008) 574–589
buffer (using SM-1) (Table 2). These values are 0.25 log unitbelow or 0.35 log unit above the values that would be de-rived if we use csilicate
FeO values of 4 or 2, respectively. In otherwords, taking the reasonable assumption thatcsilicate
FeO ¼ 3� 1 leads to an uncertainty in oxygen fugacityof �0:25
0:35 log unit. Given Holzheid et al. (1997) observations,csilicate
FeO is likely to have about the same value in all of ourruns. The main variables in our experiments (FeO content(0.6–11 wt%), temperature) have been shown not to affectcsilicate
FeO . This means that, even if csilicateFeO is not well known,
the relative difference of oxygen fugacity conditions be-tween runs performed using SM-1 and those performedusing SM-2 remains approximately constant (�2.4 logunit). Finally, if we approximate activities by assumingideal mixing behaviour (i.e. cphase
M ¼ 1), the oxygen fugacityconditions would appear more reduced ranging betweenIW-4.4 and IW-2 (Table 2).
The partitioning of element M of valence v betweenmetal and silicate can be expressed according to theequation:
Mmetal þ v2
O2 ¼MOsilicatev ð3Þ
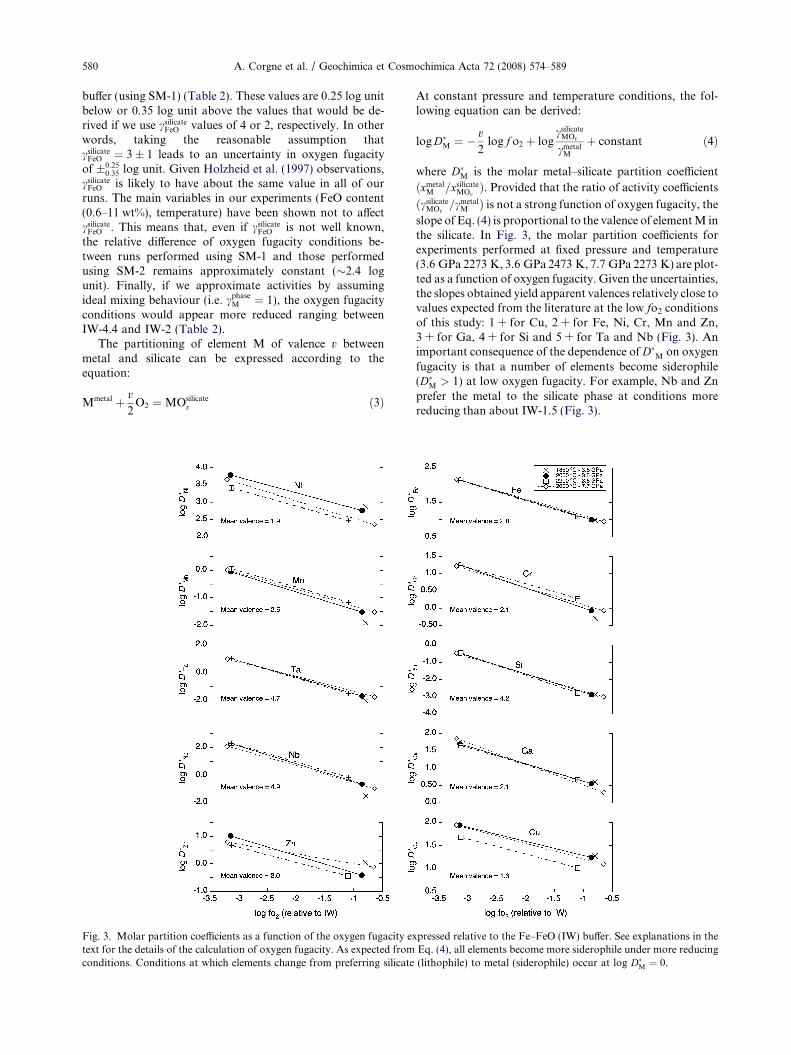
Fig. 3. Molar partition coefficients as a function of the oxygen fugacity extext for the details of the calculation of oxygen fugacity. As expected fromconditions. Conditions at which elements change from preferring silicate
At constant pressure and temperature conditions, the fol-lowing equation can be derived:
log D�M ¼ �v2
log f o2 þ logcsilicate
MOv
cmetalM
þ constant ð4Þ
where D�M is the molar metal–silicate partition coefficient
ðxmetalM =xsilicate
MOvÞ. Provided that the ratio of activity coefficients
ðcsilicateMOv
=cmetalM Þ is not a strong function of oxygen fugacity, the
slope of Eq. (4) is proportional to the valence of element M inthe silicate. In Fig. 3, the molar partition coefficients forexperiments performed at fixed pressure and temperature(3.6 GPa 2273 K, 3.6 GPa 2473 K, 7.7 GPa 2273 K) are plot-ted as a function of oxygen fugacity. Given the uncertainties,the slopes obtained yield apparent valences relatively close tovalues expected from the literature at the low fo2 conditionsof this study: 1 + for Cu, 2 + for Fe, Ni, Cr, Mn and Zn,3 + for Ga, 4 + for Si and 5 + for Ta and Nb (Fig. 3). Animportant consequence of the dependence of D�M on oxygenfugacity is that a number of elements become siderophile(D�M > 1) at low oxygen fugacity. For example, Nb and Znprefer the metal to the silicate phase at conditions morereducing than about IW-1.5 (Fig. 3).
pressed relative to the Fe–FeO (IW) buffer. See explanations in theEq. (4), all elements become more siderophile under more reducing(lithophile) to metal (siderophile) occur at log D�M ¼ 0.
Metal–silicate partitioning and conditions of core formation 581
3.5. Effects of pressure and temperature
Fig. 3 also allows us to have some insights into the po-tential effects of temperature and pressure on metal–silicatepartitioning. Partition coefficients of all elements investi-gated except Ni are not significantly affected by an increaseof pressure from 3.6 to 7.7 GPa at fixed temperature(2273 K). However, our data confirm that Ni become lesssiderophile at higher pressure and higher temperature, inagreement with the work of Thibault and Walter (1995)and Li and Agee (1996, 2001). An increase of temperaturefrom 2123 to 2473 K at 3.6 GPa appears to have no signif-icant effect on the partition coefficients of Ga, Si and Fe.Although some of the data are scattered, we find that over-all D�Ni, D�Zn and D�Cu decrease with increasing temperature,while D�Mn, D�Nb, D�Cr and D�Ta increase with increasing tem-perature. These observations are consistent with previousresults by Gessmann and Rubie (1998) and Chabot andAgee (2003) who observed that Cr and Mn become moresiderophile at higher temperature with no sizeable effectof pressure. Unfortunately, Ni, Mn and Cr are the only ele-ments among the elements of interest in this study for whichthe effects of pressure and temperature on partitioning havebeen carefully investigated. Therefore, in Section 4, wecombine our data with data from the literature obtainedon a wide range of pressure and temperature conditionsto constrain further the relative contribution of pressureand temperature on the metal–silicate partitioning of allthe elements of interest.
3.6. Compositional effects
It has been shown that metal composition, in particularits C and S contents, could affect the partitioning of a numberof elements (e.g. Chabot and Agee, 2003; Wade and Wood,2005). For example, Chabot and Agee (2003) found thatthe liquid metal–liquid silicate partition coefficients of V,Cr and Mn increase with increasing C content of the liquidmetal, in agreement with metallurgical data (e.g. The JapanSociety for the Promotion of Science and The NineteenthCommittee on Steelmaking, 1988). Thus, the larger carbonmetal contents in our high fo2 runs should favour the parti-tioning of elements with a chemical affinity for carbon (Mn,Cr, V, Nb, Ta and Ti according to metallurgical data). Sim-ilarly, other parameters such as the Si metal content may playa significant role and should therefore be accounted for tocharacterize accurately metal–silicate partitioning.
There is also experimental evidence that varying silicatecomposition can affect substantially metal–silicate parti-tioning. Although Fe, Ni, Cr and Mn are little affected,highly charged cations appear to be more sensitive to sili-cate melt composition (e.g. Walter and Thibault, 1995;Holzheid et al., 1997; Jana and Walker, 1997; Jaeger andDrake, 2000; O’Neill and Eggins, 2002; Chabot and Agee,2003). As discussed by Jaeger and Drake (2000), Ga is mod-erately affected by a change of silicate composition, with Gabecoming less siderophile in more depolymerized melt(higher nbo/t). At present, the influence of melt compositionon the partitioning of Nb, Ta, Si and Ti is not properly con-strained, but dependencies similar to the ones observed for
other highly charged cations are expected for these ele-ments. The compositional variations in metal (e.g. C andSi) and silicate (e.g. Fe and Si) between our runs at lowand high oxygen fugacity may generate some of the smallscatter observed in terms of element valence, pressure andtemperature effects discussed in the previous sections.
In the following section, we present a thermodynamicapproach that allows us to take account of and correctfor the effects of both silicate and metal compositions onpartitioning.
4. PARAMETERIZATION
Rather than using partition coefficients to parameterizemetal–silicate partitioning as done in several previous stud-ies (e.g. Righter and Drake, 1997; Li and Agee, 2001; Cha-bot and Agee, 2003), we opted for a parameterizationinvolving the molar exchange coefficient K M
D similar to theone recently undertaken by Wade and Wood (2005). Theadvantage of using KM
D rather than D�M is that when consid-ering the former we do not need to know explicitly the oxy-gen fugacity. As shown hereafter, we only need to know thevalence of the element of interest in the silicate melt. In con-trast to previous parameterizations, Wade and Wood(2005) took explicitly into account the effect of metal com-position on partitioning using metallurgical data and, usingKM
D , isolated the effect of oxygen fugacity from the effects ofother parameters. We modified slightly their approach, asdetailed below.
The partitioning of element M of valence v between metaland silicate can be described as an exchange reaction involv-ing Fe, FeO and the oxidized and reduced components of M:
MOv=2silicate
þ v2
Fe
metal
¼ v2
FeO
silicate
þ Mmetal
ð5Þ
The equilibrium constant for reaction (5) is defined asfollows:
Ka ¼asilicate
FeO
� �v=2 � ametalM
� �ametal
Feð Þv=2 � ametalMOv=2
� � ð6Þ
Taking logarithms and rearranging using mole fractions (x)and activity coefficients (c) yields:
log Ka ¼ logxsilicate
FeO
� �v=2 � xmetalM
� �xmetal
Feð Þv=2 � xsilicateMOv=2
� �6664
7775þ logcmetal
M
� �cmetal
Feð Þv=2
þ logcsilicate
FeO
� �v=2
csilicateMOv=2
� � ð7Þ
By definition (e.g. O’Neill, 1992), the exchange coefficientKM
D is:
KMD ¼
xsilicateFeO
� �v=2 � xmetalM
� �xmetal
Feð Þv=2 � xsilicateMOv=2
� � ¼ D�M �xsilicate
FeO
xmetalFe
� �v=2
ð8Þ
It follows:
log Ka ¼ log KMD þ log
cmetalM
� �cmetal
Feð Þv=2þ log
csilicateFeO
� �v=2
csilicateMOv=2
� � ð9Þ

582 A. Corgne et al. / Geochimica et Cosmochimica Acta 72 (2008) 574–589
Following Wade and Wood (2005), we assume that theoxide activity coefficients are not a strong function of sili-cate melt composition, hence that the third term remainsapproximately constant. From this, we expressed theapparent equilibrium constant Kapp:
log Kapp ¼ log KMD þ log
cmetalM
� �cmetal
Feð Þv=2
� log Ka þ constant ð10Þ
Like Wade and Wood (2005), we calculated metal activitycoefficients using the interaction parameter approach andthe method described by Ma (2001). The following equa-tions were used:
ln cFe ¼XN
i¼2
eiiðxi þ lnð1� xiÞÞ �
XN�1
j¼2
XN
k¼jþ1
ekj xjxk
� 1þ lnð1� xjÞxj
þ lnð1� xkÞxk
� �þXN
i¼2
XN
k¼2ðk 6¼iÞ
eki xixk
� 1þ lnð1� xkÞxk
� 1
1� xi
� �þ 1
2
XN�1
j¼2
XN
k¼jþ1
ekj x2
j x2k
� 1
1� xjþ 1
1� xk� 1
� ��XN
i¼2
XN
k¼2ðk 6¼iÞ
eki x2
i x2k
� 1
1� xiþ 1
1� xkþ xi
2ð1� xiÞ2� 1
!ð11Þ
and
ln ci ¼ ln cFe þ ln c0i � ei
i lnð1� xiÞ
�XN
j¼2ðj6¼iÞej
i xj 1þ lnð1� xjÞxj
� 1
1� xi
� �
þXN
j¼2ðj6¼iÞej
i x2j xi
1
1� xiþ 1
1� xjþ xi
2ð1� xiÞ2� 1
!
ð12Þwhere cFe and ci are the activity coefficients of Fe and solutei, respectively, in the molten alloy (made up of N constitu-ents) at the temperature of interest. c0
i is the activity coeffi-cient of solute i when it is infinitely dilute in pure liquid Fe.
Table 6Metal activity coefficients calculated using the interaction parameter app
cFe cNi cCu cSi
PL-169 0.79 0.66 6.9 0.0046PL-185 0.82 0.69 6.1 0.0065PR-369 0.85 0.72 5.4 0.0096PR-373 0.72 0.63 5.8 0.0068PR-376 0.79 0.71 8.4 0.031PR-383 0.78 0.70 8.5 0.033PR-375 0.76 0.70 8.6 0.034PR-368 0.78 0.72 7.2 0.044PR-365 0.80 0.72 8.6 0.029
a Because of relatively large uncertainties, cTi and cZn were not calcula
The interaction parameters eji refer to the measured effects
of component i on the activity of component j in the alloyand are dependent on the mole fraction of i (xi) and themole fraction of j (xj). These parameters are tabulated inthe Steelmaking Data Sourcebook (The Japan Society forthe Promotion of Science and The Nineteenth Committeeon Steelmaking, 1988). Since most of the ej
i and c0i values
were obtained at the reference temperature of 1873 K(T�), we extrapolated them to higher temperatures usingthe following relationships suggested in the SteelmakingData Sourcebook:
ln c0i ðT Þ ¼
T 0
Tln c0
i ðT 0Þ ð13Þ
and
eji ðT Þ ¼
T 0
Tej
iðT 0Þ ð14Þ
In the calculation of activity coefficients cFe and ci, interac-tions between the following elements were accounted for: C,O, Si, P, S, Ti, V, Cr, Mn, Co, Ni, Ga, Ge, Zr, Nb, Mo, Hf,Ta, W, Re and Cu. When not available, the ej
i interactionparameter was assumed to be negligible. When not pro-vided, the metal C content of C-bearing literature experi-ments was estimated by difference. Metal activitycoefficients for this study calculated following the interac-tion parameter approach detailed here are given in Table6 for the reader to get a better appreciation of the effectsof trace element activity on partitioning. In Eq. (10), the ex-change coefficients KM
D were directly calculated from themetal and silicate molar compositions.
In Fig. 4, values of Kapp calculated from equation (10) areplotted as a function of reciprocal temperature for all traceelements considered in this study. As observed by Wadeand Wood (2005), we find that log Kapp for low-pressure datafrom this study and the literature defined trends that parallel1 bar free-energy data. Such agreement therefore supportsthe assumption of nearly constant activity coefficient ratioin silicate melts. To some extent, this observation appearsto be also valid for highly charged cations, although the re-sults are less striking due to a limited number of data.
The advantage of using exchange coefficients KMD for the
parameterization rather than molar partition coefficientsD�M is that the former is not dependent on oxygen fugacity
roacha
cMn cCr cGa cNb cTa
0.87 0.63 1.30 0.10 0.0230.91 0.67 1.27 0.12 0.0310.95 0.72 1.25 0.15 0.0420.78 0.56 1.27 0.10 0.0250.60 0.71 0.92 0.13 1.450.57 0.70 0.90 0.13 1.840.56 0.69 0.90 0.12 1.980.59 0.71 0.92 0.14 1.660.61 0.73 0.91 0.13 1.77
ted using the interaction parameter approach.

Fig. 4. Apparent equilibrium constant (Kapp) shown as a function of reciprocal temperature (1000/T) for experimental runs from this studyand the literature. Data were recalculated for nbo/t of 2.7 as estimated for the primitive mantle. Solid lines are 1 bar free energy data fromBarin et al. (1989). Dashed lines correspond to the best-fit equation at fixed pressure and for nbo/t of 2.7. Note that there is no significantpressure effect on the metal–silicate partitioning of Si, Ti, Zn and Cu (see values of c coefficient and corresponding standard deviations inTable 7). References are: C99, Capobianco et al. (1993); JD00, Jaeger and Drake (2000); H07, Holzheid et al. (2007); JW97, Jana and Walker(1997); WW05, Wade and Wood (2005); KW97, Kilburn and Wood (1997); WW01, Wade and Wood (2001); M07, Malavergne et al. (2007);M06, Mann et al. (2006); TW95, Thibault and Walter (1995); GR08, Gessmann and Rubie (1998); CA03, Chabot and Agee (2003); H94-96,Hillgren et al. (1994, 1996); LA96-01, Li and Agee (1996, 2001); O97, Ohtani et al. (1997); I93-95-98, Ito et al. (1993, 1995, 1998); BJ03,Bouhifd and Jephcoat (2003).
Metal–silicate partitioning and conditions of core formation 583
at constant pressure and temperature (assuming a constantratio of activity coefficients in the silicate melt). Variationsin KM
D and Kapp should therefore reflect only the effects ofpressure, temperature and composition on partitioning.To constrain the relative contribution of pressure, temper-ature and composition, the apparent equilibrium constantwas expressed as a function of these variables using anequation of the form:
log Kapp ¼ aþ bTþ c � P
Tþ d � nbo=t ð15Þ
where a, b, c and d are regression constants, T the temper-ature in K, P the pressure in GPa, and nbo/t the molar ratio
of non-bridging oxygens to tetrahedral cations in the sili-cate melt. By considering an equation of the form of Eq.(15), we assume that the volume change of the exchangereaction (5) is constant. In comparison to the work of Wadeand Wood (2005), we added an empirical term (nbo/t) totake some account of the potential effect of silicate meltcomposition on partitioning of highly charged cations. Asdiscussed by O’Neill and Eggins (2002), the use of universalmelt descriptor such as nbo/t is not ideal and considerationof the activity of individual oxide components in the silicatemelt should be a better way forward. However, it is not pos-sible at present to follow this approach. Consideration ofthe concentration of individual oxide components rather
584 A. Corgne et al. / Geochimica et Cosmochimica Acta 72 (2008) 574–589
than the nbo/t parameter does not lead to significantimprovement in the parameterization (e.g. Righter andDrake, 1999). Although not a rigorous approach, we choseto keep the nbo/t term in the parameterization since it im-proves slightly fits to Kapp.
Following Wade and Wood (2005), regression coefficientb was estimated for all elements except Cr from 1 bar freeenergy data. The remaining coefficients (a, c and d) were ob-tained by linear regression. Since there are no thermody-namic data available for solid or liquid CrO, it was notpossible to determine the temperature dependence of theequilibrium constant of the Fe–Cr exchange reaction.Therefore, we treated all four coefficients as unknown forthe multiple linear regression of the Cr data. Furthermore,when calculating Kapp, we made the assumption that Cr wasonly present as Cr2+ in the silicate melt. This is likely to bethe case at conditions below the IW buffer (Berry andO’Neill, 2004). Similarly, we assumed that Mn2+, Ni2+,Cu+, Si4+, Ti4+, Nb5+, Ta5+, Ga3+ and Zn2+ were the solespecies present over the range of oxygen fugacity consid-ered in this contribution. Literature data (in agreement withthis work) show that these valence states are dominant atthe relatively reduced conditions investigated here. We ig-nored the metal activity coefficient of the trace (cmetal
M Þ whenregressing data for Zn and Ti because this term could not becalculated with sufficient precision from metallurgical data.Values of regression coefficients a, b, c and d and corre-sponding uncertainties are given in Table 7.
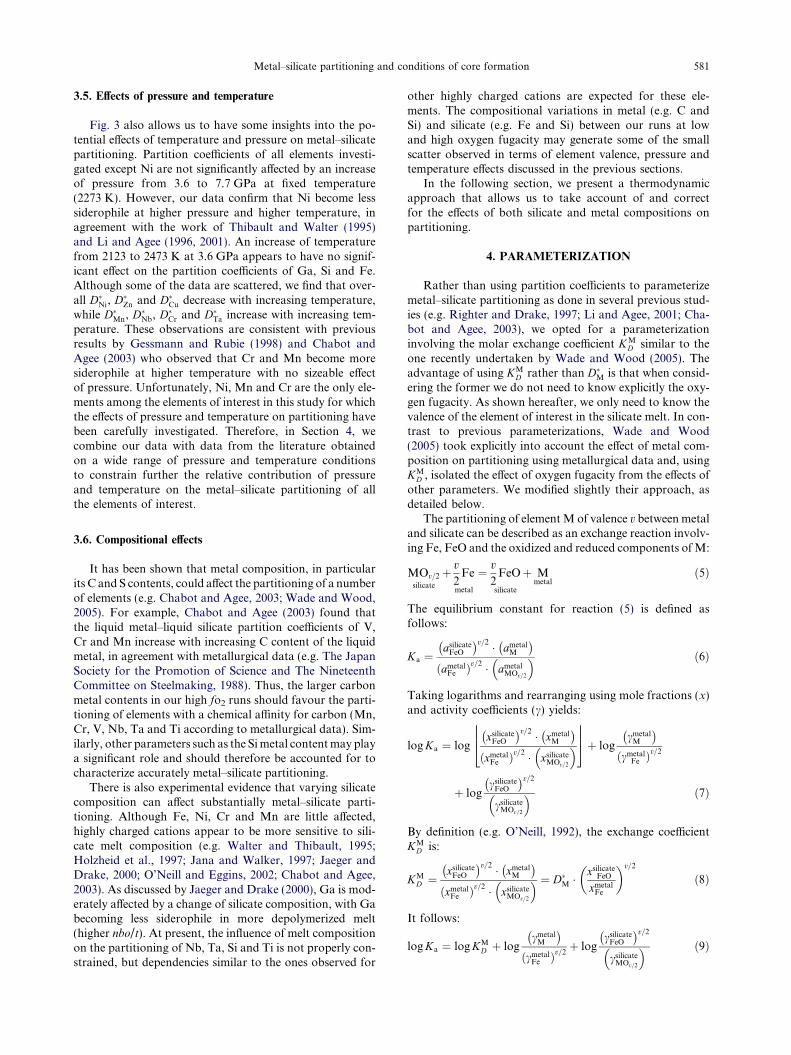
As shown in Fig. 4, temperature contributes signifi-cantly to the partitioning of a number of trace elements.Values of Kapp increase (Mn, Cr, Si, Ta, Nb, Ga, Ti) or de-crease (Ni, Cu, Zn) with increasing temperature, in agree-ment with the observations reported in Section 3.5 formolar partition coefficients. Highly charged cations (Nb,Ta, Si and Ti) are the elements with partitioning the mostsensitive to variations of temperature (i.e. with largest va-lue for b, Table 7). Kapp values for Ni, Cr, Nb, Ta andGa decrease with increasing pressure, while Kapp for Mnincreases slightly with increasing pressure. Application ofthe F-test shows that the pressure term (c) for Si, Ti, Cu
Table 7Multiple linear regression coefficients of Eq. (15)
na Valenceb a b c d
Mn 71 2+ �0.02 �5600 38 (6)c 0.036 (10)Ni 81 2+ 0.50 3100 �78 (5) �0.073 (15)Cr 65 2+ 0.09 �2845 (461) �20 (10) 0.000 (13)Ga 35 3+ 3.50 �4800 �126 (36) �0.97 (15)Si 50 4+ 2.97 �21800 �11 (33) �0.24 (11)Nb 21 5+ 4.09 �15500 �166 (31) �0.75 (16)Ta 18 5+ 7.74 �20000 �264 (81) �1.69 (53)Tid 18 4+ 3.46 �19000 �42 (52) �0.11 (16)Cu 14 1+ 0.30 2300 �37 (45) 0.14 (17)Znd 13 2+ �1.11 600 �23 (102) �0.21 (24)
a Number of experimental data used for the regression.b Valence assumed for the regression.c Values in parentheses are one standard deviation in least digits
cited.d Activity coefficients of Ti and Zn in the metal were not
considered for the regression (see text).
and Zn is not significant at the 95% confidence level. Uncer-tainties on the pressure term are relatively large for these ele-ments (Table 7). As expected from the results of O’Neilland Eggins (2002), divalent cations (Mn, Ni, Cr and Zn)do not show significant dependence on silicate composition(small d). We also found that the nbo/t term (d) was insig-nificant for Cu and Ti at the 95% confidence interval. Fromcharge and size consideration, we would expect regressioncoefficients b, c and d to be similar for both Nb and Ta.This is what we obtained (with larger uncertainties forTa). Derived regression coefficients for Mn, Si and Ni arein general agreement with those of Wade and Wood(2005). Slight differences are due to the use of a differentset of data and the addition of the nbo/t term to theparameterization.
5. IMPLICATIONS FOR CORE FORMATION AND
CORE COMPOSITION
The parameterization allows us to model the geochem-ical consequences of core segregation during planetaryaccretion in a magma ocean. By combining Eqs. (8),(10) and (15), the molar partition coefficient of elementM, D�M, can be expressed as a function of its controllingfactors (composition, oxygen fugacity, pressure andtemperature):
log D�M ¼ aþ bTþ c � P
Tþ d � nbo=t � v
2log
xsilicateFeO
xmetalFe
� �
� logcmetal
M
� �cmetal
Feð Þv=2ð16Þ
Taking the reasonable assumption that cmetalFe is 1 (Raoult’s
Law) and rearranging for nbo/t value of 2.7 as estimated forprimitive mantle composition, we obtain the followingrelationship:
log D�M ¼ a0 þ bTþ c � P
T� v
2log
xsilicateFeO
xmetalFe
� �� logðcmetal
M Þ ð17Þ
where a0 = a + 2.7 Æ d. Eq. (17) was used to calculate theevolution of elemental core-silicate Earth concentrationratio during continuous core segregation. We calculatedc metal
M at the relevant temperature using Eq. (13) and datatabulated in the Steelmaking Data Sourcebook (The Ja-pan Society for the Promotion of Science and The Nine-teenth Committee on Steelmaking, 1988). The Earth wasaccreted in 1% steps and the pressure of equilibration inthe magma ocean was fixed at 40% of the value at thecore–mantle boundary. This leads to a mean pressure ofaccretion of �31 GPa. Equilibration temperatures werechosen on the peridotite liquidus, which was estimatedfrom the data of Trønnes and Frost (2002) and Zerret al. (1998). This leads to a mean temperature of accre-tion of �2900 K. It should be mentioned that uncertain-ties of ±100 K on the mean temperature of accretiondoes not change the conclusions of this study. In our cal-culation, we estimated the core to constitute 32 vol% ofthe Earth. Results shown in Fig. 5 take account of ±1runcertainty on the regression.

Fig. 5. Models of continuous core segregation during accretion in a deep magma ocean. Three oxygen fugacity paths are considered hereusing three different profiles for the Fe content of the silicate Earth (FeSE). For each fo2 path, we took account of ±1r uncertainty on theregression coefficients (Table 7) to predict the range of core/silicate Earth concentration ratios. Triangles show upper (.) and lower (m) limitsof final bulk D values required to match expected concentrations in the silicate Earth and bulk Earth. Required ranges of D values werecalculated from estimates of bulk Earth and bulk silicate Earth given by Allegre et al. (1995), Allegre et al. (2001), McDonough (2003),Munker et al. (2003) and Palme and O’Neill (2003) and references therein. We find that predicted bulk D values best match required values ifcore formation took place under moderately increasing conditions of oxygen fugacity (path broadly similar to the 1.0–6.3 wt% FeSE path). Seediscussion in text.
Metal–silicate partitioning and conditions of core formation 585
Three fo2 paths were modeled by varying the Fe contentof the silicate melt. In one case, the Fe content of the mantlewas fixed at its current value (6.3 wt%). This means that thefo2 is kept constant during core formation at about IW-1/-2(depending on the value chosen for csilicate
FeO Þ. In two addi-tional cases, conditions become progressively oxidizingstarting from fairly reduced conditions, respectively withinitial Fe mantle content of 0.1 and 1.0 wt%. These contentscorrespond to conditions of oxygen fugacity about 4 and 2log units below the current mantle–core equilibrium value(i.e. near IW-5/-6 and IW-3/-4, respectively). As discussedby Wade and Wood (2005), perovskite precipitation amongother processes may have resulted in progressive mantle oxi-dation. Considering this process as the source of oxidationduring accretion, oxygen fugacity was kept constant forthe first 10% of accretion (since perovskite is not yet stable),
and then gradually increased to reach current core–mantleequilibrium value at the end of accretion.
5.1. Nickel
The partitioning behaviour of nickel is the best con-strained. Its bulk core/silicate Earth partition coefficient isalso narrowly bracketed (24–28). We used this relativelytight constraint to determine a suitable depth of equilibra-tion, hence the mean pressure and mean temperature duringaccretion. The appropriate equilibration depth was found tocorrespond to 40 ± 5% of the depth of the core–mantleboundary. It should be noted that this value is independentof the conditions of oxygen fugacity. Furthermore, variationof the relative depth of the magma ocean within the 40 ± 5%range does not affect the conclusions reached below.
586 A. Corgne et al. / Geochimica et Cosmochimica Acta 72 (2008) 574–589
5.2. Chromium, copper, manganese and silicon
As shown in Fig. 5, the bulk core-silicate Earth partitioncoefficients we predict for Mn, Cr, Si and Cu are all inagreement with expected values whatever the fo2 path thatis considered. Although not shown here, it is important tomention that similar conclusions can be reached for Crwhether we assume a valence of 2+ or 3+. It is interestingto note that derived DMn values for the three fo2 pathsrange between 0.4 and 1.4, as opposed to the 0.2–2.5 rangederived from the bulk Earth (800–1390 ppm) and silicateEarth (1045–1160 ppm) estimates of Allegre et al. (2001),Palme and O’Neill (2003) and McDonough (2003). Sinceit is likely that fo2 conditions envisaged here encompassthe actual conditions during core formation, we can con-strain further the Mn budget of the planet. Assuming thatthe silicate Earth contains 1100 ppm of Mn, we derive acore Mn content of 440–1540 ppm and a bulk Earth Mncontent of 890–1240 ppm. The range of modeled bulkDCu lies between 8 and 85 and is almost independent ofthe chosen fo2 path. This compares to expected DCu be-tween 4 and 10. Our modeling, which predicts relativelyhigh core/silicate Earth ratio for Cu (8–10), is this consis-tent with the low silicate Earth estimate (�20 ppm) ofPalme and O’Neill (2003) (as opposed to �30 ppm esti-mated by McDonough, 2003). A bulk DCu of 8–10 wouldlead to a core Cu content of �160 ppm, i.e. �25% morethan proposed by McDonough (2003).
5.3. Niobium and tantalum
The Nb and Ta budget of the silicate Earth has been thesubject of considerable debate in recent years (e.g. McDon-ough, 1991; Rudnick et al., 2000; Wade and Wood, 2001;Munker et al., 2003; Schmidt et al., 2004). It has beenshown that all the major reservoirs of the silicate Earth dis-play subchondritic Nb/Ta ratios (e.g. Rudnick et al., 2000;Munker et al., 2003), with recent estimates for the bulk sil-icate Earth between 14 and 14.7, as opposed to 17.4 and19.9 for the bulk Earth (Munker et al., 2003; Palme andO’Neill, 2003). Mass balance considerations therefore re-quire an unsampled reservoir with superchondritic Nb/Ta.It has been suggested that subducted oceanic crust in thelower mantle could be the missing reservoir (Kamber andCollerson, 2000; Rudnick et al., 2000), and hence, the bulksilicate Earth Nb/Ta ratio may therefore be chondritic asrecently put forward by McDonough (2003). However, arecent experimental study (Schmidt et al., 2004) concludedthat the superchondritic Nb/Ta ratio of subducted oceaniccrust would be too low and would require an unrealisticallylarge volume of basaltic crust to balance the remaining sub-chondritic reservoirs of the silicate Earth. Munker et al.(2003) also suggested that this reservoir was unlikely tobe significant since HIMU ocean island basalts, whichshould tap this reservoir, have subchondritic Nb/Ta ratios(�16). As an alternative, it has been suggested that the sil-icate Earth has subchondritic Nb/Ta ratio as a consequenceof preferential extraction of Nb relative to Ta into the core.Wade and Wood (2001) provided experimental argumentsin favour of this hypothesis. Using the Nb/Ta ratios deter-
mined by Munker et al. (2003) for the silicate Earth and thebulk Earth and taking account of the corresponding uncer-tainties, bulk DNb and DTa should lie within 0.5–1.4 and0.2–0.6, respectively. Less extreme values from Palme andO’Neill (2003) lead to a range of 0.2–0.7 for DNb and arange of 0.1–0.4 for DTa.
For core formation at constant oxygen fugacity(6.3 wt% Fe in the mantle), our predicted upper limit forDNb is 0.09, which is below the expected range (0.2–1.4)from the data of Munker et al. (2003) and Palme andO’Neill (2003). With 6.3 wt% Fe in the primitive mantle,we predict an upper limit for DTa (0.26) that falls withinthe expected range (0.1–0.6). However, if we assume thatthe core has a superchondritic Nb/Ta ratio between 23and 32 as required to balance the bulk Earth and bulk sil-icate Earth (Munker et al., 2003; Palme and O’Neill,2003), DTa should be lower than 0.05, i.e. below the ex-pected range. In contrast to the path at constant fo2, pathswith progressively increasing oxygen fugacity (from 0.1/1.0to 6.3 wt% Fe) lead to Nb and Ta concentrations in thecore and mantle that are consistent with expected values(Fig. 5). Therefore, these predictions for Nb and Ta allowexclusively a scenario of core formation under relativelyreduced initial conditions, not under constant oxygenfugacity near IW-1/-2. Given the dependence of Nb andTa partitioning on temperature, the latter would requireequilibrium temperatures during accretion that are wellin excess of the estimated peridotite liquidus, which isphysically impossible.
5.4. Gallium
Ga plots almost directly on the volatility trend definedby the most lithophile volatile elements like Li, Na andRb (see Fig. 6 of McDonough, 2003). In comparison withNa, which has almost the same condensation temperature(Wasson, 1985; Lodders, 2003), Ga has a BSE/CI-chondritenormalized ratio that is about 10–20% (±10%) lower(McDonough and Sun, 1995; McDonough, 2003; Palmeand O’Neill, 2003). This implies that a minor fraction ofthe Ga budget (0–30%) is in the core and that Ga depletionin the silicate Earth relative to chondrite is mostly due toloss by volatilization prior to accretion. For the upperbound of 30% Ga in the core, the corresponding DGa is0.43. Our results suggest that the lowest fo2 path consideredhere (0.1–6.3 wt% Fe) leads to bulk DGa values (0.53–3.5)higher than the expected range (0–0.4). The other two fo2
paths can reproduce adequately the expected range of bulkDGa with the best fit being obtained at constant fo2 (0.1–2).The intermediate fo2 path leads to larger DGa between 0.34and 3.2, which overlap slightly the expected range (Fig. 5).
5.5. Zinc
Zn also plots on the volatility trend, but a direct com-parison with fluorine (F), which has essentially the samecondensation temperature, is out of place given the uncer-tainty on the silicate Earth content of F (15–25 ppm;McDonough, 2003; Palme and O’Neill, 2003). Zn contentis much better constrained in the silicate Earth (�55 ppm;

Metal–silicate partitioning and conditions of core formation 587
McDonough, 2003; Palme and O’Neill, 2003) than it is inthe bulk Earth. McDonough (2003) derived a content of�40 ppm for the bulk Earth, based on the assumption thatZn is not present in the core. Allegre et al. (2001) estimatedthe Earth to contain 24 ± 2 ppm of Zn. If correct, this lattervalue would imply that the silicate Earth content of 55 ppmis overestimated. Considering the silicate Earth contentfrom McDonough (2003) and Palme and O’Neill (2003)as appropriate and taking account of uncertainties, onecan envisage that the core may contain up to �30 ppm ofZn. This corresponds to an upper limit of 0.6 for DZn. Asshown in Fig. 5, a range of DZn between 0 and 0.6 can bematched within uncertainty by the three fo2 paths consid-ered here.
5.6. Titanium
Ti is normally regarded as a refractory lithophile ele-ment. Hence, the core is not expected to contain any signif-icant amount of Ti. Our predictions remain relativelytentative at present owing to large uncertainties on the ef-fect of pressure and composition (Table 7). The sole conclu-sion that can be reached is that for core formation under fo2
conditions of the current core–mantle equilibrium (6.3 wt%Fe) shows that DTi should be at least 0.01 (Fig. 5). Thiscompares with a minimum DTi of 0.025 for the 0.1–6.3 wt% Fe path. In other words, the core should containat least 0.5% of the Earth’s Ti (>13 ppm).
6. SUMMARY AND CONCLUSIONS
In summary, it is possible to fit the predicted D valuesfrom our model with the expected values for Ni, Mn, Cr,Si, Nb, Ta, Cu, Zn and Ga provided that core segregationtook place under oxidizing conditions starting from moder-ately reduced and finishing at the current mantle–core equi-librium value. Although not shown here, such conditionswould be also consistent with the silicate Earth depletionsin V, Co, P and W using the parameterization given by Wadeand Wood (2005). We show, that if initial fo2 conditions werehighly reducing (for example for 0.1–6.3 wt% Fe), the silicateEarth depletion in Ga would be more pronounced than ob-served. Conversely, if fo2 conditions were kept relatively oxi-dized near the current core–mantle equilibrium value, Nband Ta contents in the silicate Earth would exceed the ob-served values. Using a more complete set of elements, weconfirm the conclusions reached by Wade and Wood(2005) that oxygen fugacity should have increased duringaccretion. Finally, our results suggest that in addition to vol-atilization, core formation would contribute to the depletionof Ga, Cr, Mn and Zn in the silicate Earth.
As shown by the conclusions reached in this contribu-tion, the new way of parameterizing partitioning data initi-ated by Wade and Wood (2005) and further developed hereis a potentially powerful tool to understand the geochemicalimplications of core formation in a magma ocean. Addi-tional high-pressure and high-temperature experiments areneeded to improve the present parameterization, particu-larly for Si, Ga, Ta, Ti, Cu and Zn for which uncertaintiesare the largest. In addition to refine our understanding of
core formation, these new data will eventually help quantifythe trace element composition of the core and place tighterconstraints on the light element budget of the core.
ACKNOWLEDGMENTS
We thank Ute Mann and Astrid Holzheid for permitting us touse their preliminary experimental data, and Nachiketa Rai for dis-cussions. We are also grateful to Richard Ash, Suzy Elhlou, ChrisHadidiacos and Norman Pearson for technical assistance. Wethank Julien Siebert, Michael Walter and an anonymous reviewerfor comments that helped clarify the manuscript. The CarnegieInstitution of Washington (Postdoctoral Fellowships to A.C. andS.K.), the NASA (Cosmochemistry Grant NNG04GG09G toYF) and the NSF (Grant EAR0337621 to W.F.M.) supported thiswork. Research at Macquarie University is supported by ARCgrants FF0456999 and DP066453 to B.J.W. Funding for the GE-MOC LA-ICPMS and EPMA probes comes from ARC LIEFand DEST Systemic Infrastructure Grants, Macquarie Universityand industry. This is contribution No. 495 from the ARC GEMOCNational Key Centre (www.es.mq.edu.au/GEMOC).
REFERENCES
Allegre C. J., Poirier J.-P., Humler E. and Hofmann A. W. (1995)The chemical composition of the Earth. Earth Planet. Sci. Lett.
134, 515–526.
Allegre C., Manhes G. and Lewin E. (2001) Chemical compositionof the Earth and the volatility control on planetary genetics.Earth Planet. Sci. Lett. 185, 49–69.
Asahara Y., Kubo T. and Kondo T. (2004) Phase relations of acarbonaceous chondrite at lower mantle conditions. Phys.
Earth Planet. Inter. 143-144, 421–432.
Barin I., Sauert F., Schultze-Rhonhof E. and Sheng W. S. (1989)Thermochemical Data of Pure Substances, Part I and Part II.CH Verlagsgesellschaft, Weinheim, Germany.
Berry A. J. and O’Neill H. S. C. (2004) A XANES determination ofthe oxidation state of chromium in silicate glasses. Am. Mineral.
89, 790–798.
Bouhifd M. A. and Jephcoat A. P. (2003) The effect of pressure onpartitioning of Ni and Co between silicate and iron-rich metalliquids: a diamond-anvil cell study. Earth Planet. Sci. Lett. 209,
245–255.
Capobianco C. J., Jones J. H. and Drake M. J. (1993) Metal–silicate thermochemistry at high temperature: magma oceansand the excess siderophile element’’ problem of the Earth’supper mantle. J. Geophys. Res. 98, 5433–5443.
Chabot N. L. and Agee C. B. (2003) Core formation in the Earthand Moon: new experimental constraints from V, Cr, and Mn.Geochim. Cosmochim. Acta 67, 2077–2091.
Corgne A., Keshav S., McDonough W. F. and Fei Y. (2007) Howmuch potassium is in the core? New insights from partitioningexperiments. Earth Planet. Sci. Lett. 256, 567–576.
Cottrell E. and Walker D. (2006) Constraints on core formationfrom Pt partitioning in mafic silicate liquids at high tempera-tures. Geochim. Cosmochim. Acta 70, 1565–1580.
Danielson, L., Sharp, T. and Hervig, R. L. (2005) Implications forcore formation of the Earth from high pressure-temperature Aupartitioning experiments. Lunar and Planetary Science Confer-ence XXXVI, Lunar Planet. Inst., Houston. #1955 (abstr.).
Drake M. J., Newsom H. E. and Capobianco C. J. (1989) V, Crand Mn in the Earth, Moon, EPB, and SPB and the origin ofthe Moon: Experimental studies. Geochim. Cosmochim. Acta
53, 2101–2111.
588 A. Corgne et al. / Geochimica et Cosmochimica Acta 72 (2008) 574–589
Ertel W., Walter M. J., Drake M. J. and Sylvester P. J. (2006)Experimental study of platinum solubility in silicate melt to14 GPa and 2273 K: Implications for accretion and coreformation in Earth. Geochim. Cosmochim. Acta 70, 2591–2602.
Gessmann C. K. and Rubie D. C. (1998) The effect of temperatureon the partitioning of nickel, cobalt, manganese, chromium,and vanadium at 9 GPa and constraints on formation of theEarth’s core. Geochim. Cosmochim. Acta 62, 867–882.
Hillgren V. J., Drake M. J. and Rubie D. C. (1994) High-pressureand high-temperature experiments on core–mantle segregationin the accreting Earth. Science 264, 1442–1445.
Hillgren V. J., Drake M. J. and Rubie D. C. (1996) High pressureand high temperature metal–silicate partitioning of siderophileelements: the importance of silicate liquid composition. Geo-
chim. Cosmochim. Acta 60, 2257–2263.
Holzheid A., Palme H. and Chakraborty S. (1997) The activitiesof NiO, CoO and FeO in silicate melts. Chem. Geol. 139,
21–38.
Holzheid A., Sylvester P., O’Neill H. S. C., Rubie D. C. and PalmeH. (2000) Evidence for a late chondritic veneer in the Earth’smantle from high-pressure partitioning of palladium andplatinum. Nature 406, 396–399.
Holzheid A., Kegler Ph., Frost D., Rubie D.C. and Palme H.(2007) Partitioning behaviour of Copper and Germanium:implications for terrestrial core formation scenarios. Lunar andPlanetary Science Conference XXXVIII, Lunar Planet. Inst.,Houston. #2090 (abstr.).
Ito E., Katsura T. and Suzuki T. (1998) Metal/silicate partitioningof Mn, Co, and Ni at high-pressures and high temperatures andimplications for core formation in a deep magma ocean. InProperties of Earth and Planetary Materials at High Pressure
and Temperature (ed. M. H. Manghnani), pp. 215–225. Geo-
physical Monograph 101. American Geophysical Union.
Ito E., Morooka K. and Ujike O. (1993) Dissolution of K in molteniron at high pressure and temperature. Geophys. Res. Lett. 20,
1651–1654.
Ito E., Morooka K., Ujike O. and Katsura T. (1995) Reactionbetween molten iron and silicate melts at high pressure:Implications for the chemical evolution of the Earth’s core. J.
Geophys. Res. 100, 5901–5910.
Jaeger W. L. and Drake M. J. (2000) Metal–silicate partitioning ofCo, Ga, and W: dependence on silicate melt composition.Geochim. Cosmochim. Acta 64, 3887–3895.
Jana D. and Walker D. (1997) The influence of silicate meltcomposition on distribution of siderophile elements amongmetal and silicate liquids. Earth Planet. Sci. Lett. 150, 463–472.
Kamber B. S. and Collerson K. D. (2000) Role of ‘hidden’ deeplysubducted slabs in mantle depletion. Chem. Geol. 166, 241–254.
Kilburn M. R. and Wood B. J. (1997) Metal–silicate partitioningand the incompatibility of S and Si during core formation.Earth Planet. Sci. Lett. 152, 139–148.
Li J. and Agee C. B. (1996) Geochemistry of core–mantledifferentiation at high pressure. Nature 381, 686–689.
Li J. and Agee C. B. (2001) The effect of pressure, temperature,oxygen fugacity and composition on partitioning of nickel andcobalt between liquid Fe–Ni–S alloy and liquid silicate:implications for the earth’s core formation. Geochim. Cosmo-
chim. Acta 65, 1821–1832.
Liu S.-H., Fruehan R. J., Morales A. and Ozturk B. (2001)Measurement of FeO activity and solubility of MgO in smeltingslags. Metall. Mater. Trans. B 32, 31–36.
Lodders K. (2003) Solar system abundances and condensationtemperatures of the elements. Astrophys. J. 591, 1220–1247.
Ma Z. (2001) Thermodynamic description for concentrated metal-lic solutions using interaction parameters. Metall. Mater. Trans.
B 32, 87–103.
Malavergne V., Tarrida M., Combes R., Bureau H., Jones J. andSchwandt C. (2007) New high-pressure and high-temperaturemetal/silicate partitioning of U and Pb: Implications for thecores of the Earth and Mars. Geochim. Cosmochim. Acta 71,
2637–2655.
Mann, U., Frost, D. J., Rubie, D. C., Shearer, C. K. and Agee,C.B. (2006) Is silicon a light component in the Earth’s core?Constraints from liquid metal–liquid silicate partitioning ofsome lithophile elements. Lunar and Planetary Science Con-ference XXXVII, Lunar Planet. Inst., Houston. #1161 (abstr.).
McDonough W. F. (1991) Partial melting of subducted oceaniccrust and isolation of its residual eclogitic lithology. Phil. Trans.
R. Soc. A 335, 407–418.
McDonough, W. F. (2003) Compositional model for the Earth’score. In: (ed. R.W. Carlson) The Mantle and Core, Treatise onGeochemistry, vol. 2 (eds. H. Holland and K.K. Turekian).Elsevier–Pergamon, Oxford. pp. 547–568.
McDonough W. F. and Sun S.-S. (1995) The composition of theEarth. Chem. Geol. 120, 223–253.
Munker C., Pfander J. A., Weyer S., Buchl A., Kleine T. andMezger K. (2003) Evolution of planetary cores and theEarth–Moon system from Nb/Ta systematics. Science 301,
84–87.
O’Neill H. S. C. (1991) The origin of the moon and the earlyhistory of the earth–A chemical model. Part 2: the earth.Geochim. Cosmochim. Acta 55, 1159–1172.
O’Neill H. S. C. (1992) Siderophile elements and the Earth’sformation. Science 257, 1281–1285.
O’Neill H. S. C. and Eggins S. M. (2002) The effect of meltcomposition on trace element partitioning: an experimentalinvestigation of the activity coefficients of FeO, NiO, CoO,MoO2 and MoO3 in silicate melts. Chem. Geol. 186, 151–181.
Ohtani E., Yurimoto H. and Seto S. (1997) Element partitioningbetween metallic liquid, silicate liquid, and lower-mantleminerals: implications for core formation of the Earth. Phys.
Earth Planet. Inter. 100, 97–114.
Palme, H. and O’Neill, H. S. C. (2003) Cosmochemical estimates ofmantle composition. In The Mantle and Core (ed. R.W.Carlson), Treatise on Geochemistry, vol. 2 (eds. H. Hollandand K. K. Turekian). Elsevier–Pergamon, Oxford. pp. 1–38.
Plante E. R., Hastie J. W. and Kowalska M. (1992) Activity of FeOin the FeO–MgO–SiO2 system determined by high temperaturemass spectrometry. ISIJ International 32, 1276–1279.
Righter K. and Drake M. J. (1997) Metal–silicate equilibrium in ahomogeously accreting earth: new results for Re. Earth Planet.
Sci. Lett. 146, 541–553.
Righter K. and Drake M. J. (1999) Effect of water on metal–silicatepartitioning of siderophile elements: a high pressure andtemperature terrestrial magma ocean and core formation. Earth
Planet. Sci. Lett. 171, 383–399.
Rudnick R. L., Barth M., Horn I. and McDonough W. F. (2000)Rutile-bearing refractory eclogites: missing link between con-tinents and depleted mantle. Science 287, 278–281.
Schmidt M. W., Dardon A., Chazot G. and Vannucci R. (2004)The dependence of Nb and Ta rutile-melt partitioning on meltcomposition and Nb/Ta fractionation during subduction pro-cesses. Earth Planet. Sci. Lett. 226, 415–432.
Schmitt W., Palme H. and Wanke H. (1989) Experimentaldetermination of metal/silicate partition coefficients for P,Co, Ni, Cu, Ga, Ge, Mo, and W some implications for theearly evolution of the Earth. Geochim. Cosmochim. Acta 53,
173–185.
The Japan Society for the Promotion of Science and TheNineteenth Committee on Steelmaking (1988) Part 2: Recom-mended values of activity and activity coefficients, and inter-action parameters of elements in iron alloys. In Steelmaking

Metal–silicate partitioning and conditions of core formation 589
Data Sourcebook. Gordon and Breach Science Publishers, NewYork. pp. 273–297.
Thibault Y. and Walter M. J. (1995) The influence of pressure andtemperature on the metal–silicate partition coefficients of nickeland cobalt in a model C1 chondrite and implications for metalsegregation in a deep magma ocean. Geochim. Cosmochim. Acta
59, 991–1002.
Trønnes R. G. and Frost D. J. (2002) Peridotite melting andmineral-melt partitioning of major and minor elements at 22–24.5 GPa. Earth Planet. Sci. Lett. 197, 117–131.
Wade J. and Wood B. J. (2001) The Earth’s ‘missing’ niobium maybe in the core. Nature 409, 75–78.
Wade J. and Wood B. J. (2005) Core formation and the oxidationstate of the Earth. Earth Planet. Sci. Lett. 236, 78–95.
Walker D., Norby L. and Jones J. H. (1993) Superheating effects onmetal–silicate partitioning of siderophile elements. Science 262,
1858–1861.
Walter M. J., Newsom H. E., Ertel W. and Holzheid A. (2000)Siderophile elements in the Earth and Moon: metal–silicatepartitioning and implications for core formation. In Origin of
the Earth and Moon (eds. R. M. Canup and K. Righter).University of Arizona Press, Tucson, pp. 265–289.
Walter M. J. and Thibault Y. (1995) Partitioning of tungsten andmolybdenum between metallic liquid and silicate melt. Science
270, 1186–1189.
Wanke H. (1981) Constitution of the terrestrial planets. Phil.
Trans. R. Soc. A 303, 287–302.
Wasson J. T. (1985) Meteorites: Their Record of Early Solar-system
History. W.H. Freeman and Company, New York.Wasson J. T. and Kallemeyn G. W. (1988) Compositions of
chondrites. Phil. Trans. R. Soc. A 325, 535–544.
Wheeler K. T., Walker D., Fei Y., Minarik W. G. and McDonoughW. F. (2006) Experimental partitioning of uranium betweenliquid iron sulfide and liquid silicate: Implications for radioac-tivity in the Earth’s core. Geochim. Cosmochim. Acta 70, 1537–
1547.
Zerr A., Diegeler A. and Boehler R. (1998) Solidus of the Earth’sdeep mantle. Science 281, 243–246.
Associate editor: F.J. Ryerson