Metallographic Analysis of SKB MiniCan Experiment 3Tänd ett lager: P, R eller TR. Metallographic...
40
Svensk Kärnbränslehantering AB Swedish Nuclear Fuel and Waste Management Co Box 250, SE-101 24 Stockholm Phone +46 8 459 84 00 R-13-35 Metallographic Analysis of SKB MiniCan Experiment 3 Nicholas Smart, Simon Rose, David Nixon, Andrew Rance AMEC November 2013
Transcript of Metallographic Analysis of SKB MiniCan Experiment 3Tänd ett lager: P, R eller TR. Metallographic...

Svensk Kärnbränslehantering ABSwedish Nuclear Fueland Waste Management Co
Box 250, SE-101 24 Stockholm Phone +46 8 459 84 00
R-13-35
Metallographic Analysis of SKB MiniCan Experiment 3
Nicholas Smart, Simon Rose, David Nixon, Andrew Rance AMEC
November 2013

Tänd ett lager: P, R eller TR.
Metallographic Analysis of SKB MiniCan Experiment 3
Nicholas Smart, Simon Rose, David Nixon, Andrew Rance AMEC
November 2013
ISSN 1402-3091
SKB R-13-35
ID 1403402
This report concerns a study which was conducted for SKB. The conclusions and viewpoints presented in the report are those of the authors. SKB may draw modified conclusions, based on additional literature sources and/or expert opinions.
A pdf version of this document can be downloaded from www.skb.se.

SKB R-13-35 3
Executive Summary
To ensure the safe encapsulation of spent nuclear fuel rods for geological disposal, SKB of Sweden is considering the use of a copper-iron canister, which consists of an outer copper canister and a cast iron insert (the KBS-3 concept). For a number of years, an experimental study has been carried out to investigate a range of corrosion issues associated with the canister, including the possibility of expansion of the outer copper canister as a result of the anaerobic corrosion of the cast iron insert. This study consists of a series of experiments in SKB’s Äspö Hard Rock Laboratory (HRL) using inactive model canisters, in which leaks were deliberately introduced into the outer copper canister while surrounded by bentonite, with the aim of obtaining information about the internal corrosion evolution of the internal environment. The experiments use five small-scale model canisters (300 mm long × 150 mm diameter) that simulate the main features of the SKB canister design (hence the project name, ‘MiniCan’). The main aim of the work is to examine how corrosion of the cast iron insert will evolve if a leak is present in the outer copper canister, but a number of additional sensors, electrodes and corrosion test pieces were also included in the experimental design. Each of these canisters has been monitored remotely using electrochemical methods to provide data about corrosion potentials and corrosion rates as a function of time.
In 2011, one of the experiments (Experiment 3) was removed for analysis and an extensive suite of analytical techniques was used to assess the nature of corrosion of the canister, including Raman spectroscopy, electron microscopy and X-ray diffraction amongst others. These results are reported separately. In addition to the analytical techniques used previously to assess the effects of corrosion on the canister, further metallurgical analysis has been conducted on selected components to investi-gate the extent of any corrosion of the canister materials and to identify any possible microstructural features of interest. This report describes the metallurgical procedures that were applied and presents the findings obtained. The main conclusions from the analysis are as follows:
1. There was no evidence for localised corrosion of any of the copper MiniCan components or stress corrosion test specimens examined, but a black surface film was visible on most surfaces, in agreement with previous analysis of specimens from the MiniCan experiment.
2. No increase in corrosion susceptibility was observed in the electron beam weld areas, although some porosity in the weld material was observed.

SKB R-13-35 5
Contents
1 Introduction 7
2 Experimental 92.1 Details of sample handling 92.2 Details of analytical techniques 10
3 Results 113.1 U bend specimens 11
3.1.1 U-bend specimen 1 (near support cage) 113.1.2 U-bend specimen 2 (near borehole flange) 11
3.2 Wedge open load (WOL) specimens 173.2.1 WOL specimen 1 (near borehole flange) 173.2.2 WOL specimen 2 (near support cage) 17
3.3 Canister wall specimens 283.4 Weld specimens 35
4 Discussion 41
5 Conclusions 43
References 45

SKB R-13-35 7
1 Introduction
To ensure the safe encapsulation of spent nuclear fuel rods for geological disposal, SKB of Sweden is considering the use of a copper-iron canister, which consists of an outer copper canister and a cast iron insert (the KBS-3 concept). For a number of years, an experimental study has been carried out to investigate a range of corrosion issues associated with the canister, including the possibility of expansion of the outer copper canister as a result of the anaerobic corrosion of the cast iron insert. This study consists of a series of experiments in SKB’s Äspö Hard Rock Laboratory (HRL) using inactive model canisters, in which leaks were deliberately introduced into the outer copper canister while surrounded by bentonite, with the aim of obtaining information about the internal corrosion evolution of the internal environment.
The experiments use five small-scale model canisters (300 mm long × 150 mm diameter) that simu-late the main features of the SKB canister design (hence the project name, ‘MiniCan’). The main aim of the work is to examine how corrosion of the cast iron insert will evolve if a leak is present in the outer copper canister. In 2011, one of the experiments (Experiment 3) was removed for analysis and an extensive suite of analytical techniques was used to assess the nature of corrosion of the canister, for which the details are provided by Smart et al. (2012).
In addition to the analytical techniques used to assess the canister previously, metallurgical analysis has now been conducted on particular components of the canister to further investigate any corrosion of the canister material and any microstructural features of interest in the parent metal. The results from this metallographic investigation are presented in the current report. The primary aim of the metallurgical analysis was to determine the following:
• Hasanylocalisedcorrosionoccurredonanyoftheexposedsurfaces(e.g.pitting,stresscorrosioncracking, intergranular corrosion)?
• Ifso,whatisthedepth,andmorphologyofattack?
• Howdoesanyattackcorrespondwithanymicrostructuralfeaturesinthecopper?

SKB R-13-35 9
2 Experimental
2.1 Details of sample handlingExperiment 3 was removed from the borehole and dismantled in August 2011. The details of the approach taken to dismantle and section the canister are discussed in detail by Smart et al. (2012). After the canister was dismantled, most component parts were stored in a dry inert atmosphere by packaging them under dry nitrogen in a glovebox inside heat-sealed plastic, but the SCC specimens were stored inside plastic boxes containing deaerated groundwater that came with the MiniCan experiment when it was returned from Sweden (i.e. they were stored wet); some oxygen ingress is likely to have occurred during the storage period because they were sealed in plastic boxes, inside thermally-sealed nitrogen-filled plastic bags that were probably not completely impermeable to air over the long period (i.e. several months), during which they were in storage. The following specimens were selected for metallurgical analysis:
• U-bendspecimen1(locatednearsupportcage).
• U-bendspecimen2(locatednearboreholeflange).
• WedgeOpenLoaded(WOL)specimen1(locatednearboreholeflange).
• WOLspecimen2(locatednearsupportcage).
• Twocanisterwallspecimens(specimens1and2).
• Oneweldspecimenthatwascutfromthebottomweldofthemodelcanister(specimen3).
• Twoweldspecimensthatwerecutfromthetopweldofthemodelcanister(specimens4and5).
U-bend specimens were installed in the MiniCan experiment to assess the potential for stress corro-sion cracking occurring as a result of elastic and plastic strains from a smooth surface along the bend (Sedriks 1990, ASTM G30-97(2009)). The WOL specimens were used to investigate the susceptibil-ity to stress corrosion from a pre-crack. Prior to installation in the MiniCan experiment the WOL specimens were fatigue pre-cracked to a nominal length of 1.5 mm, but no additional loading was applied to the specimens. The locations of the U-bend and WOL specimens in the MiniCan experi-ment are illustrated in Figure 2-1. Note that the U-bend and WOL specimens were mounted directly in borehole water outside of the experimental support cage and were not therefore exposed to the groundwater that had been conditioned by the presence of the bentonite in the annulus of Experiment 3, whereas the samples cut from the MiniCan were inside the support cage and were thus exposed directly to the conditioned groundwater.
Welding of metals is well known to produce areas that are more susceptible to corrosion than the parent metal due to processes such as phase transformations and stress induced by thermal expan-sion. The fabrication and welding processes for the production of the copper canisters results in una-voidable grain growth in the welded regions (Gubner et al. 2006). The grain growth and formation of new grain boundaries tend to have an increased concentration of impurities which may cause the grain boundaries to become anodic and therefore influence the type and extent of corrosion at these regions. Therefore, the weld areas of the canister were analysed to assess the possibility of enhanced corrosion in the weld regions. In addition, canister wall specimens were analysed by preparing cross-sections to determine whether any localised corrosion of the surface had occurred in these regions.
All metallurgical analysis was conducted by AMEC at the facilities in Risley, UK. Metallurgical Bakelite was used to mount the specimens to facilitate microscopic assessment. A succession of grades of silicon carbide paper from 120–2500 grit was used with an automated grinder polisher to remove any deformation caused as a result of the initial sectioning and grinding. Specimens werethenpolishedwithadiamondcompoundwithaparticlesizeof6μmfollowedbydiamondcompoundwithaparticlesizeof1μmtogiveascratch-freemirrorfinishsuitableforexamination.
Where specimens were etched to highlight metallurgical features, a solution of 25 ml NH4OH (SG 88), 25 ml deionised water and 25–50 ml H2O2 (3%) was used as the etching solution (Vander Voort 1984). The lower concentration of H2O2 was used for 20 seconds to provide a grain boundary etch.

10 SKB R-13-35
Figure 2-1. Location of U-bend and WOL specimens in MiniCan borehole relative to the position of the support cage containing the MiniCan experiment and the borehole flange.
2.2 Details of analytical techniquesAll specimens where examined optically with an Alicona Infinite Focus 3D Microscope, using a 2.5 times magnification, prior to any metallurgical treatment. Using this instrument, a large number of images were collected and automatically merged to produce an in-focus image of the whole speci-men.
The Alicona microscope is able to image the surface by moving the sample in the x, y and z axes. A series of images were taken at known vertical (z axis) positions at each horizontal location. It was then possible to filter out image pixels which were out of focus and combine the images to produce a 3D model and image of the surface that includes accurate locations of each point in all three axes. The Alicona analysis package allows the operator to select areas of the image and to run contour anal-yses through areas of interest, so profiling the surface. This technique allows a large number of areas to be profiled in a relatively short time and produces a large amount of data more cost-effectively than traditional techniques such as metallographic sectioning. It is also a non-destructive technique that preserves the surface for further imaging.
Optical examination was carried out on the un-etched specimens using an Olympus BX51M metal-lurgical microscope and PC image capture system to identify any regions of interest in the surfaces of the specimens. All etched specimens (i.e. welds, walls and WOLs) were also imaged using the Alicona Microscope to give a view of the whole specimen.
Scanning Electron Microscopy (SEM) was also conducted on a small number of samples to offer a more detailed analysis of the general surface of the canister and also to investigate locations where any features that may have been associated with corrosion were observed. The SEM examination was carried out using an FEI Quanta 200F system with a field emission source. It was operated in high vacuum mode at a 20KeV accelerating voltage and standard imaging conditions.
An Energy Dispersive X-ray analyser (EDX) was coupled with the SEM. This instrument analyses the characteristic X-rays produced by the interaction between the primary electron beam and the sample. The technique performs a compositional analysis through identifying all elements present with atomic numbers of 5 (boron) and greater, with a detection limit of approximately 0.1 weight %. The measurements are semi-quantitative. A SiLi energy dispersive x-ray analyzer that was interfaced with an EDXA Genesis Energy Dispersive Spectroscopy System software package was used for the analysis.

SKB R-13-35 11
3 Results
3.1 U bend specimens3.1.1 U-bend specimen 1 (near support cage)Optical microscope images of specimen U-bend 1, which were obtained using the Alicona microscope, are shown in Figure 3-1. Previous XPS analyses (Smart et al. 2012) showed that the black layer on the surface was predominantly composed of copper, oxygen and carbon, with a trace of sulphur. No specific features associated with localised corrosion were observed in the images obtained using the Alicona microscope or the optical microscope for the U-bend located near the support cage on the inner surface of the U-bend (Figure 3-2 and Figure 3-3), or the outer surface of the U-bend (Figure 3-4 to Figure 3-6).
3.1.2 U-bend specimen 2 (near borehole flange)The microscopic analysis conducted on the U-bend specimen located near the borehole flange (U-bend 2) using the Alicona optical microscope (Figure 3-7) shows the presence of a black flaky deposit. These images do not show any indications of stress corrosion cracking or pitting corrosion on the outer surface of the U-bend, although some surface roughening is evident. No localised cor-rosion was observed on the inside surface of the U-bend when a cross-section was taken (Figure 3-8 and Figure 3-9). In contrast to the inside of the U-bend, some evidence of surface roughening is observed in the cross-section of the outside surface of the U-bend (Figure 3-10 and Figure 3-11). It is probable that this surface roughening developed when the specimens were manufactured and is due to the mechanical deformation introduced into the surface when the copper sheet was bent into the U-shape, rather than being due to any localised corrosion. It is known that mechanical deformation results in slippage along certain crystallographic planes (shear bands), which manifests itself at surfaces as a roughened finish (Rollason 1973, Chapter 7, Kaneko et al. 2010).
Figure 3-1. Photograph of curved surface of U-bend specimen 1 (near support cage) prior to metal-lographic analysis.

12 SKB R-13-35
Figure 3-3. Optical micrograph of the inside cross-section of U-bend specimen 1 (near support cage).
Figure 3-2. Optical micrograph of cross-section through the inside surface of U-bend specimen 1 (near support cage).

SKB R-13-35 13
Figure 3-4. Optical micrograph of the outside cross-section of U-bend specimen 1 (near support cage).
Figure 3-5. Optical micrograph of the outside cross-section of U-bend specimen 1 (near support cage) at higher magnification.

14 SKB R-13-35
Figure 3-7. Optical micrographs of U-bend specimen 2 (near borehole flange) produced using Alicona 3D microscope across curved surface of the U-bend.
Figure 3-6. Optical micrograph of the outside cross-section of U-bend specimen 1 (near support cage).

SKB R-13-35 15
Figure 3-8. Optical micrograph of the inside cross-section of U-bend specimen 2 (near borehole flange)
Figure 3-9. Optical micrograph of the inside cross-section of U-bend specimen 2 (near borehole flange).

16 SKB R-13-35
Figure 3-10. Optical micrograph of the outside cross-section of U-bend specimen 2 (near borehole flange).
Figure 3-11. Optical micrograph of the outside cross-section of U-bend specimen 2 (near borehole flange), highlighting areas of surface roughness.

SKB R-13-35 17
Figure 3-12. Optical micrograph of face 1 of WOL specimen 1 (near borehole flange) produced using Alicona 3D microscope.
3.2 Wedge open load (WOL) specimens3.2.1 WOL specimen 1 (near borehole flange)The 3D images obtained using the Alicona microscope are shown in Figure 3-12 and Figure 3-13, and the optical micrographs of a cross section through the pre-crack region are shown in Figure 3-14 to Figure 3-18. SEM images of the same cross-section are shown in Figure 3-19 to Figure 3-21. None of the images show any significant crack growth beyond the initial nominal 1.5 mm long pre-crack.
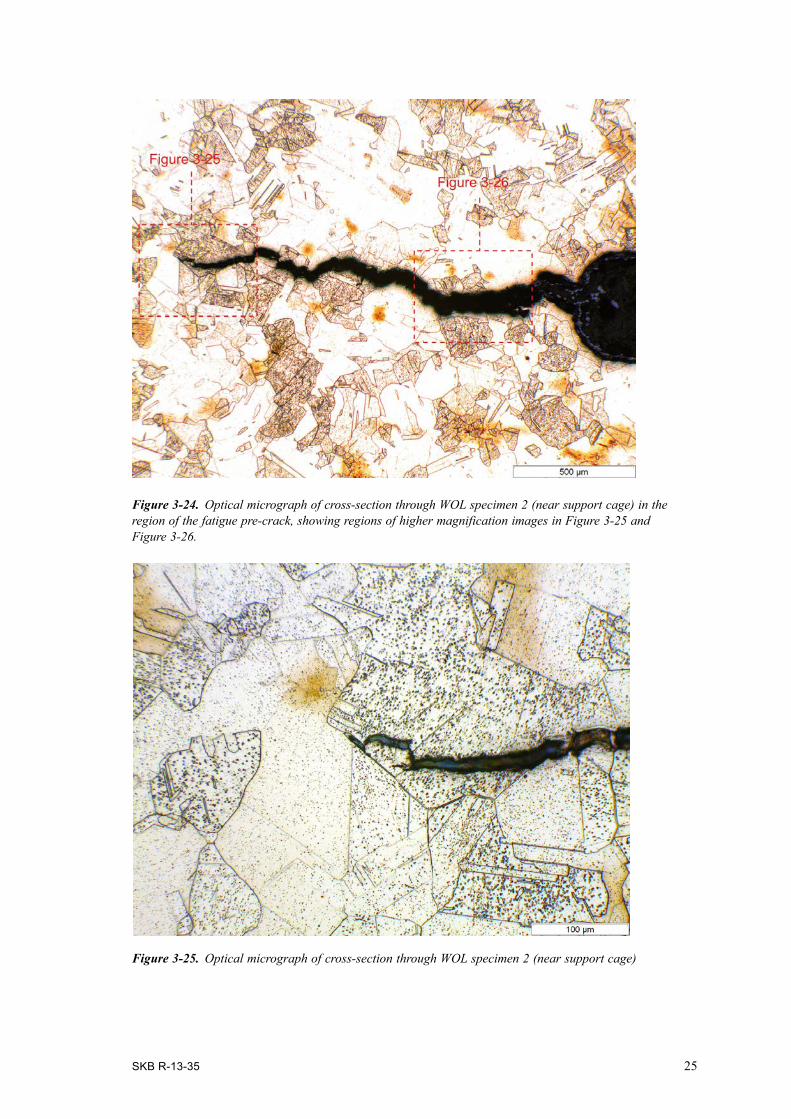
3.2.2 WOL specimen 2 (near support cage)Images of the two faces of WOL specimen 2, which was located near the support cage, taken using the Alicona microscope are shown in Figure 3-22 and Figure 3-23. No significant cracking can be observed beyond the 1.5 mm crack pre-crack in these images. Optical microscope images of the region of the pre-crack are shown in Figure 3-24 to Figure 3-26 and SEM images of the same region are shown in Figure 3-27 and Figure 3-28. It is not possible to distinguish any increase in crack length compared to the initial fatigue pre-crack.

18 SKB R-13-35
Figure 3-14. Optical micrograph of cross-section through WOL specimen 1 (near borehole flange).
Figure 3-13. Optical micrograph of face 2 of WOL specimen 1 (near borehole flange) produced using Alicona 3D microscope

SKB R-13-35 19
Figure 3-15. Optical micrograph of cross-section through WOL specimen 1 (near borehole flange).
Figure 3-16. Optical micrograph of cross-section through WOL specimen 1 (near borehole flange).

20 SKB R-13-35
Figure 3-17. Optical micrograph of cross-section through WOL specimen 1 (near borehole flange).
Figure 3-18. Optical micrograph of cross-section through WOL specimen 1 (near borehole flange).

SKB R-13-35 21
Figure 3-19. SEM micrographs of cross-section through WOL specimen 1 (near borehole flange).

22 SKB R-13-35
Figure 3-20. SEM micrographs of cross-section through WOL specimen 1 (near borehole flange).

SKB R-13-35 23
Figure 3-21. SEM micrographs of cross-section through WOL specimen 1 (near borehole flange).

24 SKB R-13-35
Figure 3-22. Optical micrograph of face 1 of WOL specimen 2 (near support cage) produced using Alicona 3D microscope.
Figure 3-23. Optical micrograph of face 2 of WOL specimen 2 (near support cage) produced using Alicona 3D microscope.
SKB R-13-35 25
Figure 3-24. Optical micrograph of cross-section through WOL specimen 2 (near support cage) in the region of the fatigue pre-crack, showing regions of higher magnification images in Figure 3-25 and Figure 3-26.
Figure 3-25. Optical micrograph of cross-section through WOL specimen 2 (near support cage)

26 SKB R-13-35
Figure 3-26. Optical micrograph of cross-section through WOL specimen 2 (near support cage)

SKB R-13-35 27
Figure 3-27. SEM micrographs of cross-section through WOL specimen 2 (near support cage).

28 SKB R-13-35
3.3 Canister wall specimensTwo specimens measuring approximately 1 cm square were cut from about half way up the height of the canister (Figure 3-29) at approximately 120° angular separation. They were examined using the Alicona microscope and mounted and polished to examine whether any localised attack of the inner or outer surfaces had occurred. The inner and outer surfaces were also examined using SEM/EDX.
The Alicona micrographs of the interior and exterior surfaces of can wall specimens 1 and 2 (Figure 3-30 to Figure 3-33) show the heterogeneous nature of the inner surfaces compared to the relatively homogenous nature of the external surfaces. No localised corrosion was visible, although the presence of a uniform surface corrosion product film is clear. A metallurgical cross-section through can wall specimens 1 and 2 are shown in Figure 3-34 and Figure 3-35 respectively. They show that there were no indications of localised corrosion on either the inner or outer surfaces of these specimens.
Scanning electron images of the inner and outer surfaces of canister wall specimen 2 are shown in Figure 3-36 to Figure 3-40. They show the presence of a surface deposit, but no indications of localised corrosion. EDX analysis of the cut copper metal surface (Figure 3-41) shows, as expected, that it is composed of pure copper (minor alloying elements such as phosphorus would not have been detected at very low concentrations in the EDX analysis). EDX analysis of the inner surface (Figure 3-42) of the can wall illustrates that the major elements present on the copper surface were carbon, oxygen, chlorine and iron with traces of magnesium, aluminium, silicon, sulphur and cal-cium. This EDX spectrum is similar to those reported previously for the inner surface of the canister (Smart et al. 2012).
Figure 3-28. SEM micrographs of cross-section through WOL specimen 2 (near support cage).

SKB R-13-35 29
Figure 3-29. Specimens 1 and 2, which were cut from approximately half way up the wall of the canister.
Figure 3-30. Optical micrograph of the inside surface of wall specimen 1 from the model canister produced using the Alicona 3D microscope.

30 SKB R-13-35
Figure 3-31. Optical micrograph of the outside surface of wall specimen 1 from the model canister produced using Alicona 3D microscope.
Figure 3-32. Optical micrograph of the inside surface of wall specimen 2 from the model canister produced using Alicona 3D microscope.

SKB R-13-35 31
Figure 3-33. Optical micrograph of the outside surface of wall specimen 2 from the model canister produced using Alicona 3D microscope.
Figure 3-34. Optical micrograph of cross-section through wall specimen 1 of the model canister. The top edge of the image is the outside surface of the canister and the lower edge is the inner surface of the canister.

32 SKB R-13-35
Figure 3-35. Optical micrograph of cross-section through wall specimen 2 of the model canister. The top edge of the image is the inner surface of the canister and the lower edge is the outer surface of the canister.
Figure 3-36. SEM of the inside surface of the canister (wall specimen 2).

SKB R-13-35 33
Figure 3-37. SEM of the inside surface of the canister (wall specimen 2).
Figure 3-38. SEM of the inside surface of the canister (wall specimen 2).

34 SKB R-13-35
Figure 3-39. SEM of the inside surface of the canister (wall specimen 2).
Figure 3-40. SEM of the inside surface of the canister (wall specimen 2).

SKB R-13-35 35
Figure 3-41. EDX analysis of the cut face of the canister wall (i.e. parent metal, wall specimen 2).
Figure 3-42. EDX analysis of the inside surface of the canister (wall specimen 2).
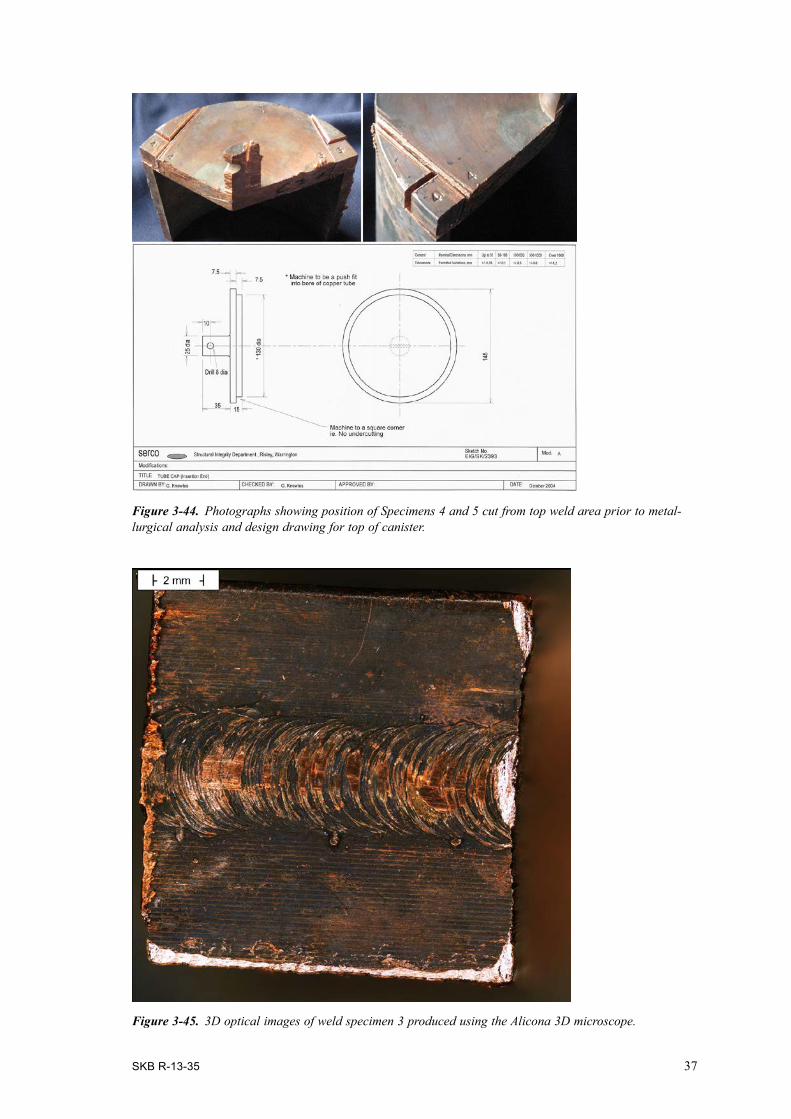
3.4 Weld specimensFigure 3-43 shows the position of the weld specimen cut from the bottom of the canister (Specimen 3) and Figure 3-44 shows the position of the specimen cut from the base of the canister (Specimen 4 and 5). The 3D optical microscopy images for the weld specimens prior to cross-sectioning for the weld specimens taken from the bottom of the canister (Figure 3-45) and top of the canister (Figure 3-46 and Figure 3-47) do not show any indications of localised corrosion attack, but do show the clear presence of a black surface film.
The weld samples were mounted and polished. Images of cross-sections through the weld at the top (Figure 3-48 and Figure 3-49) and bottom of the canister (Figure 3-50) show no indications of localised corrosion. Substantial porosity is visible in the weld at the top of the canister (Figure 3-48 and Figure 3-49). Similarly, no localised corrosion features were observed in the cross-sections for the weld at the bottom of the canister (weld specimen 3, Figure 3-50). Some porosity was also present in this weld. There appear to be different degrees of porosity, depending on the location of the electron-beam weld.

36 SKB R-13-35
Figure 3-43. Photograph showing position of Specimen 3 cut from bottom weld area prior to metallurgical analysis and design drawing for base of canister.
SKB R-13-35 37
Figure 3-44. Photographs showing position of Specimens 4 and 5 cut from top weld area prior to metal-lurgical analysis and design drawing for top of canister.
Figure 3-45. 3D optical images of weld specimen 3 produced using the Alicona 3D microscope.

38 SKB R-13-35
Figure 3-46. 3D optical images of weld specimen 4 produced using the Alicona 3D microscope.
Figure 3-47. 3D optical micrographs of weld specimen 5 produced using the Alicona 3D microscope.

SKB R-13-35 39
Figure 3-48. Optical micrograph of weld specimen 4 cross-section located at the top left of the model canister produced using the Alicona 3D microscope (see Figure 45 for details of specimen orientation).
Figure 3-49. Optical micrograph of weld specimen 5 cross-section produced using the Alicona 3D microscope (see Figure 45 for details of specimen orientation).

40 SKB R-13-35
Figure 3-50. Optical micrographs of cross-section of weld specimen 3 produced using the Alicona 3D microscope (see Figure 44 for details of specimen orientation).

SKB R-13-35 41
4 Discussion
All the samples examined were covered with a black corrosion product layer, but there was no evidence of localised corrosion of any of the samples analysed, with the possible exception of the outer surface of the U-bend sited near the borehole, which exhibited some shallow pit-like depres-sions. However, these features were probably due to surface roughening caused by deformation of the metal when the U-bends were manufactured rather than localised corrosion. No crack growth was observed in the pre-cracked WOL specimens, but it should be noted that no external load was applied to these specimens and the only stresses present would have been residual stresses stemming from the pre-cracking process. The U-bend specimens represent a severe test of stress corrosion cracking susceptibility and no indications of cracking were observed.
No indications of localised corrosion of the copper canister were observed in either the main body of the canister or in the weld areas. This result is in agreement with the observations reported in Smart et al. (2012). It is also in agreement with laboratory investigations of the susceptibility of simulated weld material to intergranular corrosion (Fennell et al. 2001), in which no enhanced corrosion at grain boundaries was observed in artificial bentonite-equilibrated groundwater with a high concen-tration of chloride (20,000 mgl–1).

SKB R-13-35 43
5 Conclusions
The main conclusions from the metallographic analysis of the various specimens taken from the MiniCan experiment are as follows:
1. There was no evidence for localised corrosion of any of the copper MiniCan components or stress corrosion test specimens examined, but a black surface film was visible on most surfaces, in agreement with previous analysis of specimens from the MiniCan experiment.
2. No increase in corrosion susceptibility was observed in the electron beam weld areas, although some porosity in the weld material was noted.

SKB R-13-35 45
References
SKB’s (Svensk Kärnbränslehantering AB) publications can be found at www.skb.se/publications.
ASTM G30-97, 2009. Standard practice for making and using U-Bend stress corrosion test speci-mens. West Conshohocken, PA: ASTM International.
Fennell P A H, Graham A J, Smart N R, Sofield C J, 2001. Grain boundary corrosion of copper canister material. SKB TR-01-09, Svensk Kärnbränslehantering AB.
Gubner R, Andersson U, Linder M, Nazarov A, Taxén C, 2006. Grain boundary corrosion of copper canister weld material. SKB TR-06-01, Svensk Kärnbränslehantering AB.
Kaneko H, Hirose K, Sato K, Tanaka N, Kanamori H, Mihara K, Eguchi T, 2010. Development of a Cu-Ni-Si copper alloy strip for narrow pitch connectors. Furukawa Review 38. Available at: http://www.furukawa.co.jp/review/fr038/fr38_01.pdf
Rollason E C, 1973. Metallurgy for engineers. London: Arnold.
Sedriks A J, 1990. Stress corrosion cracking test methods. Houston, TX: National Association of Corrosion Engineers. (Corrosion testing made easy 1)
Smart N R, Rance A P, Reddy B, Fennell P A H, Winsley R J, 2012. Analysis of SKB MiniCan. Experiment 3. SKB TR-12-09, Svensk Kärnbränslehantering AB.
Vander Voort G F, 1984. Metallography: principles and practices. Materials Park, OH: ASM International.