
Metal Complexes of 1-Substituted-3-Hidroxyueeas
57
Western Michigan University Western Michigan University ScholarWorks at WMU ScholarWorks at WMU Master's Theses Graduate College 4-1967 Metal Complexes of 1-Substituted-3-Hidroxyueeas Metal Complexes of 1-Substituted-3-Hidroxyueeas James C. Dabrowiak Follow this and additional works at: https://scholarworks.wmich.edu/masters_theses Part of the Analytical Chemistry Commons Recommended Citation Recommended Citation Dabrowiak, James C., "Metal Complexes of 1-Substituted-3-Hidroxyueeas" (1967). Master's Theses. 3244. https://scholarworks.wmich.edu/masters_theses/3244 This Masters Thesis-Open Access is brought to you for free and open access by the Graduate College at ScholarWorks at WMU. It has been accepted for inclusion in Master's Theses by an authorized administrator of ScholarWorks at WMU. For more information, please contact [email protected].
Transcript of Metal Complexes of 1-Substituted-3-Hidroxyueeas
Western Michigan University Western Michigan University
ScholarWorks at WMU ScholarWorks at WMU
Master's Theses Graduate College
4-1967
Metal Complexes of 1-Substituted-3-Hidroxyueeas Metal Complexes of 1-Substituted-3-Hidroxyueeas
James C. Dabrowiak
Follow this and additional works at: https://scholarworks.wmich.edu/masters_theses
Part of the Analytical Chemistry Commons
Recommended Citation Recommended Citation Dabrowiak, James C., "Metal Complexes of 1-Substituted-3-Hidroxyueeas" (1967). Master's Theses. 3244. https://scholarworks.wmich.edu/masters_theses/3244
This Masters Thesis-Open Access is brought to you for free and open access by the Graduate College at ScholarWorks at WMU. It has been accepted for inclusion in Master's Theses by an authorized administrator of ScholarWorks at WMU. For more information, please contact [email protected].

METAL COMPLEXES OF 1-SUBSTITUTED-3-HIDROXYUEEAS
byJames C. Dabrowiak
A Thesis Submitted to the
Faculty of the School of Graduate Studies in partial fulfillment
of theDegree of Master of Arts
Western Michigan University Kalamazoo, Michigan
April 1967
Reproduced with permission of the copyright owner. Further reproduction prohibited without permission.

ACKNOWLEDGEMENTS
The author wishes to express his sincere appreciation to Dr. Donald Brown for his guidance in the course of the investigation. Further acknowledgement is extended to Dr. Robert Harmon and Dr. H. Dale Warren for their selfless assistance throughout the project.
The work was supported by the National Institutes of Health.
James Chester Dabrowiak
Reproduced with permission of the copyright owner. Further reproduction prohibited without permission.

MASTER'S THESIS M-1165
DABROWIAK, James C.METAL COMPLEXES OF l-SUBSTITUTED-3-HYDROXY- UREAS.
Western Michigan University, M*A., 1967 Chemistry, analytical
University Microfilm s, Inc., Ann Arbor, Michigan
Reproduced with permission of the copyright owner. Further reproduction prohibited without permission.

TABLE OP CONTENTS
PAGEINTRODUCTION........................ 1HISTORICAL...................................... 2EXPERIMENTAL .................................... 7
Preparation of Compounds. Table I .......... 9General Procedures ....................... 1^
RESULTS AND DISCUSSION .......................... 19The Potentlometric Method.................... 19Spectrophotometric Methods .................. 23Coordination Site in Complexes.............. 37Table II. Infrared Absorption Maxima . . . . 4lTable III. Ultraviolet, Visible and Near-
infrared Absorption........................ ^3S U MMARY.....................................APPENDIX....................................... ^5BIBLIOGRAPHY .................................... 50VITA........................................... 52
iii
Reproduced with permission of the copyright owner. Further reproduction prohibited without permission.

INTBODUCTION
The purpose of the investigation was to prepare several 1-substituted-3-hydroxyureas and measure the stability constants of any metal complexes they formed.A few of the complexes would be examined in detail to determine the coordination site, or sites, in the substituted hydroxyurea molecule. Finally, the synthesized compounds were to be sent to the Cancer Chemotherapy National Service Center to be tested for their antileukemic activity to determine if a correlation between stability constants and activity existed.
1
Reproduced with permission of the copyright owner. Further reproduction prohibited without permission.

HISTORICAL
Hydroxyurea (HU) was first prepared by Dresler and Stein1 in 1869 reacting hydroxylammonium nitrate with potassium cyanate in an aqueous solution.
They reported that the new compound showed reducing properties that were characteristic of hydroxylamine. Both silver nitrate and mercurous oxide were reduced by an aqueous solution of the compound to give the free metals and an “ammonia like11 gas. They also mentioned that HU formed a deep blue complex with ferric chloride, and that the color faded slowly upon standing.
Francesconi and Parrozzani3 later showed that two isomers of HU were formed when the reaction used by Dresler and Stein was employed. One form melted at 130° and the other at 72°. The authors suggested that the two compounds were geometrical isomers.
In 1927, Hurd and Spence3 found that HU did not undergo a Lossen rearrangement to isocyanate and concluded that the structure should be:
The problem of structure was finally solved using infrared spectrophotometry by Runti and Deghenghi4 and later confirmed by Kofod6 and was found to be the following:
H0NH3+ + 0CN“ ^ C H 4N202 (hydroxyurea)
H0-C-NHs
syn form m.p. 130°
anti form m.p. 72°
H0-C-NH0HIINH
2
Reproduced with permission of the copyright owner. Further reproduction prohibited without permission.

3-NHOH
m.p. 1^0° (I)
m.p. 72° (II)
The higher melting isomer showed an absorption in its infrared spectrum at 2800 cm” 1 which was absent for the lower melting isomer. This absorption was attributed to the N-OH (hydrogen-bonded) group present in structure (I) and not in (II). Exner® produced chemical evidence of the structure of hydroxyurea (I) and isohydroxyurea (II) by their reaction with benzoic anhydride. The higher melting isomer was readily oxidized to give gaseous products, but (II) was not oxidized under the same conditions.
A potentiometric titration of an aqueous solution of HU showed it to be weakly acidic with a pK& = 10.6 .7 If the solution was allowed to stand at room temperature for 5 hr at pH = 10.6 and then titrated with standard hydro
chloric acid, some decomposition of the HU was observed.An acid titration of HU in aqueous solution showed that it had no detectable basic properties. Isohydroxyurea (pK& = 2.3) exhibited only weakly basic properties. Kofod7 compared titration curves of HU and methoxyurea under the same conditions, and concluded that the acidic character of the former was due to the -NHOH portion of the molecule which was not present in the latter. Methoxyurea has only weakly acidic properties.
The stabilities of HU and isohydroxyurea to heat as well as pH extremes were studied by Kofod.® He concluded that the lower melting isomer was the less stable of the two. An alkaline aqueous solution, or neutral solution of isohydroxyurea when heated to 100° was rapidly converted to the higher melting isomer. The decomposition of HU at ̂
Reproduced with permission of the copyright owner. Further reproduction prohibited without permission.

100° was slower in neutral solution than in acidic and alkaline solutions, and gave products which Kofod was unable to identify using paper-partition chromatography.An aqueous solution (1$) of HU was heated to 100° and after 20 hr of heating, the HU spot was still discernible using paper-partition chromatography.
Evidence is also available that HU is not stable to oxidating agents such as hydrogen peroxide. Fishbein, Winter, and Davidson8 reported that 85% of the HU in a neutral aqueous solution was oxidized after 30 mln by 8 x 10“1M hydrogen peroxide. They also reported no decomposition of HU after standing for 30 min at pH = 1^ or at pH = 1 for 180 min.
Boyland and Nery10 examined the stability of HU in acidic, neutral, and.basic solutions and found decomposition to take place at all the pH’s studied. The rate of the decomposition reaction was found to be first order and the following products were proposed.
0NH3-C-NHOH *-H0CN + NHs0H
The t^yg’s first-order rate constants for the decomposition in aqueous solution at different pH’s at 25° were given.
Decomposition of HUpH k(sec“l) H/Z0 .8 l.b x lb"6 137 hr7.5 1.5 * 10"6 128 hr
12.8 9.6 x 10"5 2 hr
To determine the concentration of HU in the rate study sodium amminoprusside, Na3[Fe(CH)sHH3] was reacted with HU,
Reproduced with permission of the copyright owner. Further reproduction prohibited without permission.

and the concentration of the resulting complex was determined speetrophotometrically. The complex Na3 (Pe(CN)BCH4Nab̂ ) had an absorption maximum, m =3,800. The absorbance of the complex measured at ^65 m# decreased with time.
1.0
©OC2 0.5uoCO
<
2010Time (min)
In I96311 HD was found very active against mouse leukemia L1210 in a routine Cancer Chemotherapy National Service Center screening test. When patients with myelogenous leukemia were placed on HD therapy, aceto- hydroxamic acid was identified in their blood. It was then proposed12 that the drug was hydrolized producing hydroxylamine which then cleaved thioesters, such as acetyl-coenzyme A.
NHs-jJ-NHOH + 2H20--^-NH20H + NH4+ + HC0S"0
NH20H + CH3-C-S-C0A ^CHs-^-NHOH + HS-CoA0 0
A second theory13 suggested that hydroxyurea caused fragmentation of isolated DNA and induced chromosomal abnormalities In mammalian cells. The mechanism proposed
Reproduced with permission of the copyright owner. Further reproduction prohibited without permission.

6was as follows:
(oxidation)hydroxyurea ■5*- nitroxyl radical (HON=)
2(H0N=) 5*-hyponitrous acid (HON=NOH)
Hyponitrous acid, like hydroxylamine and other related compounds, causes cleavage of the main chain of cellular DNA.
A series of related compounds14 were studied and It was found that the essential structural requirement for activity seemed to he the (-CONHOH) hydroxamic acid group.HU was the most active hut dihydroxyurea and hydroxyurethane showed some activity.
0honh- L nhoh
dihydroxyureai-NHOH
0IIhonh-c-o-c 3h shydroxyurethane
Reproduced with permission of the copyright owner. Further reproduction prohibited without permission.

EXPERIMENTAL
All of the infrared spectra were obtained on a Beckman IR-8 Recording Spectrophotometer using a nujol mull. The absorbance measurements and spectra in the region 200-1000 m// were determined on a Cary-1^ Recording Spectrophotometer using 1 cm quartz cells. A Varian A-60 Proton Magnetic Resonance Spectrometer was used in the identification of the synthesized compounds. Deuterated dimethyl sulfoxide, with tetramethyl silane as an internal standard, was employed as a solvent for all of the compounds. A Sargent pH-Stat was used to examine the decomposition rate at basic pH’s. Melting points were taken in capillary tubes in a stirred silicone oil bath and were corrected. The elemental analyses were determined by Galbriath Laboratories, Inc., Knoxville, Tennessee. Water used for all of the experiments was distilled and deionized by passing it first through Dowex 50W (H+ form) and then through IRA-4-00 (0H“ form) ion exchange resins. Metal perchlorate solutions were standardized by passing 4 ml of the solution through IR-120 (H+ form) cation exchange resin and then titrating the perchloric acid that formed with standard sodium hydroxide to a phenolphthalein end point.
The potentiometric titrations were performed using a Beckman Research pH Meter. The titration cell was a 175 ml beaker sealed inside a 400 ml beaker, which served as a water jacket. For the titrations at 25°» the water was kept within t 0.1° of this temperature by a constant temperature bath. For the titrations at 0.8°, ice water from a large Dewar flask was pumped through the water jacket holding the temperature in the cell at 0.8° t 0.1° as long as an adequate supply of ice was present in the
7
Reproduced with permission of the copyright owner. Further reproduction prohibited without permission.

Dewar, The titration vessel was purged with nitrogen gas before and during the titrations. The thermometer used was graduated to the tenth of a degree and standardized against a National Bureau of Standards thermometer.
The conductometric titrations were performed using a dip type cell and a Serfass Conductance Bridge Hodel RC-M15• Titrations at 25° were performed in water and absolute ethyl alcohol, using the constant temperature apparatus described above.
Reproduced with permission of the copyright owner. Further reproduction prohibited without permission.
Reproduced
with perm
ission of the
copyright ow
ner. Further
reproduction prohibited
without
permission.
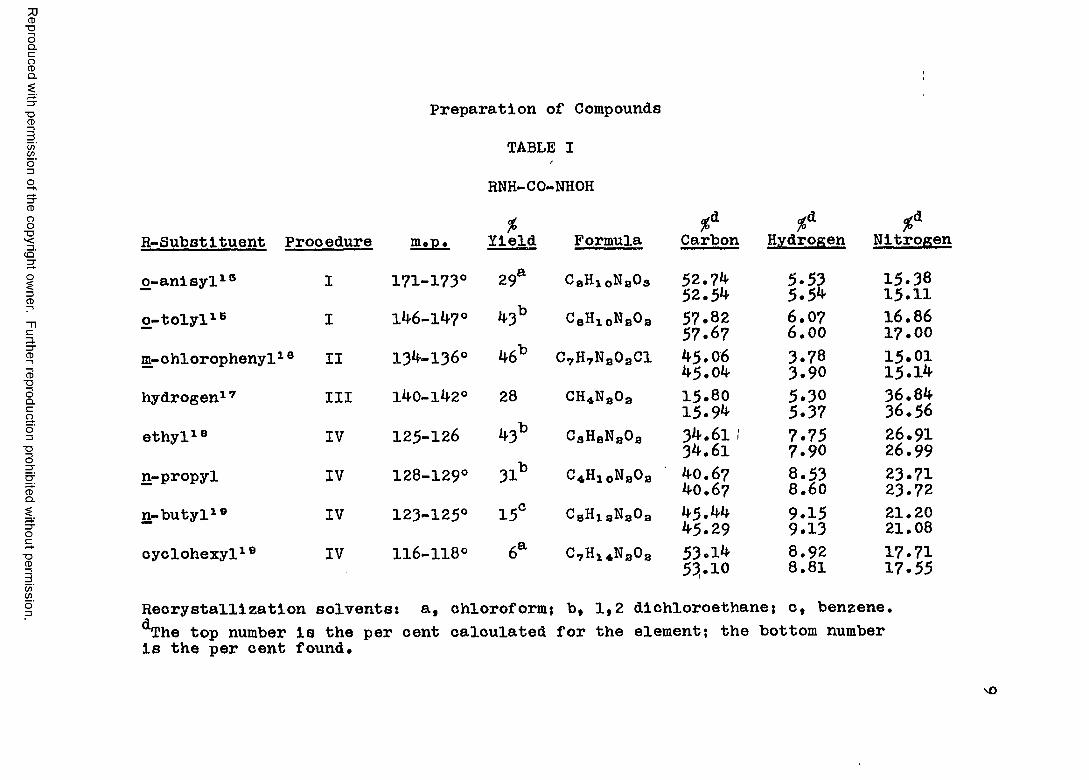
Preparation of Compounds
TABLE IjRNH-CO-NHOH% %A %A %A
R-Substituent Procedure m.t>. Yield Formula Carbon Hydrogen Nitrogen
o-anisyl18 I 171-173° 29a CgHj. oNgOa 52.74 52.5**
5.535.5^
15.3815.11
o-tolyl18 I 146-147° 43b C8HloN80a 57.8257.67
6.076.0016 .8617.00
m-ohlorophenyl18 II 134-136° 46b C7H7Na0aCl 45.0645.04
3.783.90
15 .0115.1^
hydrogen17 III 140-142° 28 CH*Na0a 15.8015.9^
5.305.37
36.8436.56
ethyl18 IV 125-126 43b CgHaNa0a 34.61 134.61 7.757.90 26.91
26.99n-propyl IV 128-129° 31b C4H10NaOa 40.67
40.678.538.60 23.7123.72
n-butyl19 IV 123-125° 15° C8HiaNa0a 45.44^5.29
9.159.1321.2021.08
cyclohexyl19 IV 116-118° 6a C7H1*Na0a 53.1** 53.108.928.81 17.71
17.55Recrystallization solvents: a, chloroform: b, 1,2 dichloroethane; c, benzene.^he top number is the per cent calculated for the element; the bottom number is the per cent found.
10
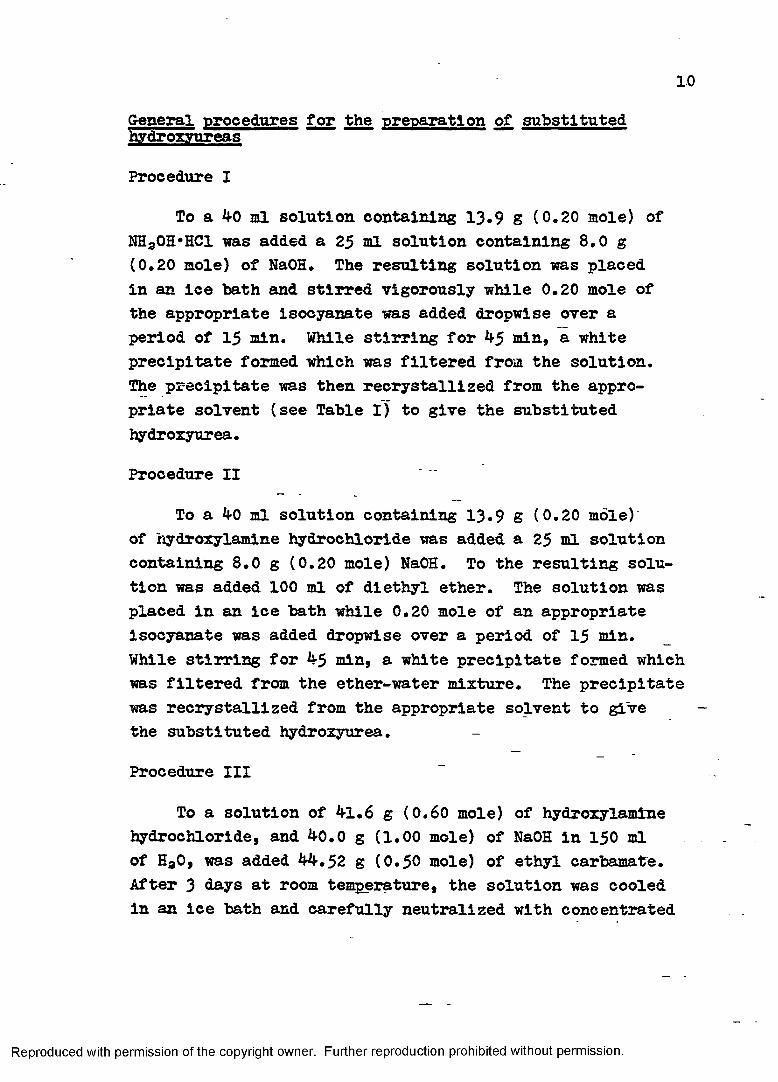
General procedures for the preparation of substituted hydroxyureas
Procedure I
To a 40 ml solution containing 13 .9 g (0.20 mole) of NH30E*HC1 was added a 25 ml solution containing 8.0 g (0.20 mole) of NaOE. The resulting solution was placed in an ice hath and stirred vigorously while 0.20 mole of the appropriate isocyanate was added dropwise over a period of 15 min. While stirring for 45 min, a white precipitate formed which was filtered from the solution.The precipitate was then recrystallized from the appropriate solvent (see Table I) to give the substituted hydroxyurea.
Procedure II
To a 40 ml solution containing 13.9 g (0.20 mole) of hydroxylamlne hydrochloride was added a 25 ml solution containing 8.0 g (0.20 mole) NaOH. To the resulting solution was added 100 ml of diethyl ether. The solution was placed in an ice bath while 0.20 mole of an appropriate isocyanate was added dropwise over a period of 15 min.While stirring for 45 min, a white precipitate formed which was filtered from the ether-water mixture. The precipitate was recrystallized from the appropriate solvent to give the substituted hydroxyurea.
Procedure III
To a solution of 41.6 g (0.60 mole) of hydroxylamine hydrochloride, and 40.0 g (1.00 mole) of NaOH in 150 ml of Ha0, was added 44.52 g (0.50 mole) of ethyl carbamate. After 3 days at room temperature, the solution was cooled in an ice bath and carefully neutralized with concentrated
Reproduced with permission of the copyright owner. Further reproduction prohibited without permission.

11HC1. The solution was then evaporated to dryness under reduced pressure as rapidly as possible at a temperature not above 50-60°. The residue was then recrystallized twice from absolute ethyl alcohol to give 13.1 g (28$) of hydroxyurea. The melting point was 140-142° (dec).
Procedure IV
To hydroxylamine hydrochloride, 27.8 g (0.40 mole), in 40 ml of solution was added 50 ml of a solution containing 16.0 g (0.4C mole) of NaOH. -The resulting solution was then placed in a 500 ml flask and 100 ml of diethyl ether was added. The appropriate isocyanate (0740 mole) was added dropwise with vigorous stirring over a period of 15 min. After”45 min of stirring in an ice bath, the aqueous layer was evaporated to dryness at reduced pressure (25-35°)* and the saline residue was washed with acetone. The acetone solution was then evaporated -to dryness, producing a material which was then recrystallized from the appropriate solvent to yield the substituted hydroxyurea.
Preparation of complexes
Iron(III) Chloride-EHU Complex
Twenty-five ml of a solution containing 2.018 g of FeCl3#6H20 was added to an equal volume of a 3*3 ^ 10“iM - solution of 1-ethyl-3-hydroxyurea (EHU), and the solvent was quickly evaporated off at reduced pressure (20-25°). The resulting oil was dissolved in ethyl acetate and a white residue was filtered off. The ethyl acetate was then evaporated off at reduced pressure to produce -a, dark green oil which was washed once with anhydrous ether. An infrared spectrum was immediately recorded.
Reproduced with permission of the copyright owner. Further reproduction prohibited without permission.
12Iron(III) Chior1de-HU Complex
When 25 ml of a 7 .06 x 10"2M solution of FeCl3»6H30 was added to an equal volume of an alcoholic solution of 7.06 x 10”3M HU, a blue solution resulted. Immediately after mixing, the solvent was evaporated off at reduced pressure at room temperature to reveal a dark blue oil.The complex was taken up with approximately 2 ml of absolute alcohol, the residue was filtered off, and the alcohol-complex solution was evaporated to an oil at reduced pressure (20-25°). This procedure, when carried out twice, produced a dark green oil which was relatively free of unreacted HU. An infrared spectrum was immediately determined.
Copper(II) Perchlorate-HU Complex
When 25 ml of an absolute alcohol solution containing 2.97 g of Cu(C104)2»6H20 was added to an alcohol solution of HU, 0.62 g in 25 ml of solvent, an olive green precipitate appeared. The precipitate was filtered off and washed twice with 20 ml of absolute ethanol to yield about 1 g of bis(hydroxyurea)copper(II) perchlorate, Cu(HU)3(C104)3. Calculated % C = 5.81, % H = 1.9^, % N = 13*53* found % C = 6.11, % H = 2.1k, % N = 1^.19.
Preparation of deuterated compounds
Deuterated EHU
About 0.01 g of EHU was dissolved in 1.0 ml of deutero- ethanol (98^ C3H50D in D30) and allowed to stand 1 hr. The solvent was evaporated off at reduced pressure (20-25°) to produce EHU-(D3). An infrared spectrum was immediately determined.
Reproduced with permission of the copyright owner. Further reproduction prohibited without permission.

13Deuterated HU
About 0.01 g of HU was dissolved in 2.5 ml of deuteroethanol and the solution was allowed to stand for 30 min. The solvent was evaporated off at reduced pressure at room temperature to produce HU-(D4). An infrared spectrum was determined of the compound.
Deuterated Iron(III) Chloride-EHU Complex
To a 0.5 ml deuteroethanol solution of PeCl3»6H30 (1 x 10“ 3 mole in 0.5 ml) was added 1 x 10"3 mole of EHU in 0.3 ml of deuteroethanol. The solvent was immediately evaporated off at reduced pressure to produce an oil, which was taken up in 1 ml of anhydrous ethyl acetate. The residue was filtered off and the ethyl acetate solution was evaporated to a dark green oil at reduced pressure (20-25°). The complex was dissolved in 0.5 ml of deuteroethanol and allowed to stand for 15 min before removing the solvent at reduced pressure (20-25°) and determing an infrared spectrum on the resulting oil.
Reproduced with permission of the copyright owner. Further reproduction prohibited without permission.

General Procedures
Reactions between EHU and various metal Ions/
To 0.5 ml of 1 x 10” solutions of the following metal perchlorates, Mn++, Sr**, V0++, Nl++, Cu++, Zn++, Co**, Cr***, Mg**, and Fe*** was added 5 ml of a 1 x 10"3M aqueous solution of EHU. After noting the color change, about 5 ml of a pH = 8.00 sodium phosphate buffer was added to each solution.
Gaseous products of the reaction between iron(III) chloride and EHU
Fifteen ml of an aqueous solution containing 0.7662 g of EHU was added to an equal volume of FeCl3#6Ha0 (2.0557 g) in H20. The gas that evolved from the blue solution was bubbled through 10 ml of cold (0-5°) diethyl ether using a gas dispersion tube. Five minutes after mixing, the reaction vessel was heated to 50° for 10 min, producing a nearly colorless solution. An infrared spectrum of the ether solution was determined using 0.1 mm NaCl cavity cells.
Analysis of lron(III)-HU solution for iron(II)
Fifty ml of 2 x 10"3M aqueous solutions of HU and FeCl3 were purged with nitrogen gas 0.5 hr before mixing 25 ml of each in a nitrogen filled 50 ml volumetric flask. The flask was sealed and allowed to stand at room temperature for 2 weeks after which it was examined for the concentration of iron(II) ion. To 2 ml of the reaction solution was added 10 ml of a 0.1# 1,10- phenantholine solution, and the resulting red solution was allowed to stand for 30 min. The concentration of [Fe(o-phen)3**], - 1»1 * 10* 1/mole-cm, was thenmeasured spectrophotometrically.
Reproduced with permission of the copyright owner. Further reproduction prohibited without permission.

15Potentiometrlc titrations
Base Titrations
Fifty ml of freshly prepared aqueous solutions(1 x 10”2M) of HU and EHU were titrated with 0.0985NNaOH at 25° and 0.8°. The pH meter was standardizedat pH’s of 10.1*0 and 11.00 at 25°, and at 10.18 and10.78 at 0.8° with a NaHC03 buffer. A computer program20was used to calculate the average pKa and standards>deviation from the measured pH values and the volume of titrant added.
Decomposition at Basic pH’s
Eight-25 ml portions of a freshly prepared aqueous solution of EHU (1 x 10"2M) were examined for decomposition at 25° and 0.8° at pH’s of 10.0, 10.5* 11.0, and11.5 using a pH-Stat. The instrument was standardized at the same pH’s as were used for the base titration standardization. Sodium hydroxide (0.0985N) was the titrant.
Acid Titrations
Fifty ml of a freshly prepared aqueous solution of EHU (1 x 10”3M) was titrated with 0.0912N HC1 at 25°. the pH meter was standardized at pH’s of l*.00 and 7*00 with Sargent buffers. The average pK_ and standardCLdeviation were calculated with a computer program similar to the one described for the base titrations.
Spectrophotometrlc methods
pK_ of 1-(o-anisyl)-3-hydroxyureaSi ^
Ultraviolet spectra (200-1*00 m#) were determined for
Reproduced with permission of the copyright owner. Further reproduction prohibited without permission.
16a 1 x 10" 4M aqueous solution of l-( o-anisyl)-3-hydroxyurea at pH*s of 1, 6, and 13. The pH was adjusted by adding small amounts of concentrated HC1 or 1.0N NaOH to 25 ml of the stock solution immediately before obtaining the spectra.
Continuous Variation Method Applied to the Iron(III)-HU Complex in Water
Aqueous solutions (250 ml) of 2 x 10"aM FeCl3 and HU were prepared and proper amounts of each were added to ten- 25 ml volumetric flasks to give the following mole fractions of ligand: 0,08, 0.20, 0.28, 0.^0, 0.^8, 0.52,0.60, 0.72, 0.80, and 0.92. The solutions were mixed immediately prior to determining the absorbance at 560 m//. See figure 1.
Stability of Iron(III)-HU and SHU Complexes in Ethanol
Absolute ethanol solutions (1.2 x 10"?M-) of HU, EHU, and FeCls•6Ha0 were mixed such that the ligand to metal ratio in each solution was 1:1. The absorbances of the Fe-EHU and Fe-HU complexes as a function of time were recorded at 610 m^and 595 &// respectively (figure 2).
To eight-25 ml volumetric flasks were added 1 x 10“3M alcoholic solutions of FeCl3#6H30 and EHU such that the following mole fractions of ligand were produced: 0.0^,0.08, 0.12, 0.16, 0.8^, 0.88, 0.92, O.96. Each solution was mixed immediately before recording the absorbance at 610 m//. A second reading of the absorbance was taken1.5 hr later. See figure 3*
Iron(III)-EHU Complex in Ethanol
Continuous variation methodTo sixteen-25 ml volumetric flasks were added
Reproduced with permission of the copyright owner. Further reproduction prohibited without permission.

appropriate amounts of 1 x 10"3M absolute ethanol solutions of EHU and FeCl3«6Ha0 such that the following mole fractions of ligand, 0.04, 0.08, 0.12, 0.16, 0 .20, 0.28, 0.40, 0.48, 0.52, 0.60, 0.72, 0.80, 0.84, 0.88, and 0.92 were produced. Each solution was prepared Just prior to the measurement of the absorbance at 610 my. See figure 4.
Molar ratio method
To twelve-25 ml volumetric flasks was added an appropriate amount of a 5 x 10“3M alcoholic solution of EHU and enough absolute ethanol to bring the total volume to 22 ml. Just prior to the absorbance measurement at 610 my, 3 ml of a standard FeCl3*6Ha0 absolute alcohol solution was added such that the iron(III) concentration in each flask was 6 x 10"4M. The ratios of EHU to iron(III) in the flasks were 0, 0.13, 0.25, 0.37* 0.50,1.00, 2.00, 3.00, 4.00, 5*00, 6.00, and: 8.00. A plot of- absorbance versus the molar ratio of ligand was made (figure 5).
Conductometric titrations
An aqueous solution (100 ml) of 7*2 x 10”4M FeCl3 was titrated with a 1.02 x 10”8M EHU solution at 25°.The bridge current was supplied at 60 cycles/sec.
One hundred ml of a 5 x 10"3M EHU absolute ethanol solution was titrated with a 1.88 x 10"2M alcoholic solution of FeCl3*6H20 at 25°. The frequency of the bridge current was 1000 cycles/sec. See figure 7(A).
An alcoholic solution of 1 x 10"3M EHU (75 ml) was titrated with a 1 x 10"3M alcoholic solution of FeCl3*6Ha0 at 25°• The bridge current was supplied at 1000 cycles/sec. See figure 7(B).
Reproduced with permission of the copyright owner. Further reproduction prohibited without permission.

Iron(III)-HU Complex in Ethanol
To twelve-2$ ml volumetric flasks was added an appropriate amount of a 5*45 x 10”3M absolute alcohol solution of HU and enough ethanol to bring the total volume to 22 ml. Just prior to the absorbance measurement of each solution at 600 m#, 3 El of a 5 x 10"3M alcoholic solution of FeCla^HaO was added. The following ratios of HU to iron(III) were produced: 0, 0.13,0.25, 0.37, 0.50, 1.00, 2.00, 3.00, 4.00, 5.00, 6.00, and 8.00. Figure 8 is a plot of absorbance versus the molar ratio of ligand.
Copper(II)-EHU Complex
Continuous variation method in ethanol
To fourteen-25 ml volumetric flasks were added amounts of 8 .78 x 10“3M alcoholic solutions of EHU and Cu(C104)3*6H20 such that the following mole fractions of ligand, 0, 0.04, 0.12, 0.20, 0.28, 0.40, 0.48, 0.52,0.60, 0.72, 0.80, 0.88, 0.96, and 1.00 were produced. The absorbance measurements were made at 376 m/y immediately,1.5 hr, and 20 hr after mixing the ligand and metal solutions. See figure 9.
Conductometric titration in water
One hundred ml of a 1.07 x 10"3M aqueous solution of Cu(C104)2 was titrated with 1.02 x 10“SM EHU at 25°(figure 10). The frequency of the bridge current was 60 cycles/sec.
Reproduced with permission of the copyright owner. Further reproduction prohibited without permission.

RESULTS AND DISCUSSION
The Potentiometric Method
If the hydroxyureas complexed with metal ions such that the pH of the solution would he altered as the result of coordination, the stability constant of the complex could be determined by a potentiometric titration. For example, suppose the following reaction takes place
M+ + LH + H+
By measuring the amount of H+ released and having aknowledge of the vS.a of the ligand, LH, and the amount + "of metal ion, M , originally put into the system, it is possible to measure the over all formation constant Kf.
_ (ML)(H+)Kf (M+)(LH)
To calculate the absolute stability constant of the complex formed, the acid and/or basic properties of the ligand must be measured.
LH -c— -^H* + L“
Ka =(H+)(L~)(LH)
(L“) (HL)
19
Reproduced with permission of the copyright owner. Further reproduction prohibited without permission.

20(ML)
(M+)(L~)Kst
whereK - the acid dissociation constant aKgt = absolute stability constant
Acidic pKQ
Of the synthesized compounds, only the “aliphatic- substituted" hydroxyureas have sufficient water solubility to use potentiometric titrations to determine the acidic and basic properties accurately.31 To decide if this method would produce acceptable values of the pKa*s, EHU was chosen as a representative compound for the titrations.
Substituted hydroxyureas have one acidic proton and at least one basic site.
To evaluate the pK& associated with the acidic site, an aqueous solution of EHU was titrated with sodium hydroxide. A computer program20 was then used to calculate the pK from the measured pH values and volumeof titrant added. The program was constructed so that a value for the pK& was calculated for each point on the titration curve. The average pK_ and the standard deviation were then calculated from these values. Examination of the data for the base titration of EHU at 25° revealed a downward trend in the pK *s calculated
EL
for each point in the titration (see appendix). Ideally
R-N-C-N-OH
basic
Reproduced with permission of the copyright owner. Further reproduction prohibited without permission.

21
these values should have a random distribution to produce an acceptable average value of the pK& . The standard deviation produced was 0.17, which was considerably above the acceptable maximum value of 0 .06 for this method.31 Decomposition of the sample during the titration to products with pKa*s lower than that of EHU could explain the trend observed in the calculated pK&*s. Decomposition under basic conditions has been previously noted.8*10
In order to examine the decomposition rate at basic pH*s, a Sargent pH-Stat was used. A plot of volume of base added versus time at pH = 11.5 was linear for 7 min, after which time titrant was no longer added. The same experiment performed at 0.8° using the same EHU solution required 56 min for the addition of base to cease. It was apparent that decomposition of EHU was taking place and that the rate was about 8 times greater at 25° than at 0.8°. A value for the rate constant from this data would be impossible to obtain without knowledge of the acidic and/or basic properties of the decomposition products. Furthermore, it was learned that as the pH was increased from 10.0 to11.5* the time required for complete decomposition decreased.
To examine the effects of the lower temperature on the calculated pK_, a freshly prepared aqueous solution ofclEHU was titrated with standard sodium hydroxide at 0.8°.It was apparent from the calculated pKa values that a significant amount of decomposition was still taking place (see appendix). A solution of EHU, which was allowed to stand for several days at room temperature before running on the pH-Stat at 0.8° showed no uptake of base. However, the same solution produced a blue complex when aqueous iron(III) chloride was added, indicating that some EHU was present.
Base titrations of the other "aliphatic-substituted" hydroxyureas indicated from the Targe standard deviation values that decomposition was taking place.
Reproduced with permission of the copyright owner. Further reproduction prohibited without permission.

Basic pKQ
A plot of pH versus volume of hydrochloric acid added for water alone and then for a i r 10”3M solution of EHU, showed the two curves to be nearly coincident, suggesting that the compound has only very weakly basic properties.
Reproduced with permission of the copyright owner. Further reproduction prohibited without permission.
r
23Speetrophotometrib Methods
•pKa determination
An ultraviolet spectrum of l-(o-anisyl)-3- hydroxyurea in aqueous solution showed several absorption bands. If one of the absorptions could be attributed to the electronic transitions associated with the carbonyl group, the pK_ of the compound could£Lbe determined. By varying the pH and measuring theabsorbance due the carbonyl chromophore in the unprotonatedand the protonated forms of the acid, the dissociationconstant can be calculated. However, no change in anyof the absorption bands of the substituted hydroxyureaswas observed at pH extremes of 1 and 13, which would benecessary for the pK_ calculation. Furthermore, when8>the ultraviolet spectrum of EHU was determined, no absorbance was observedTin the region 200-^00 m//. It was then concluded that the absorptions in the ultraviolet region for 1-(o-an!syl)-3-hydroxyurea were due to chromophores in the molecule other than the hydroxyurea portion of the compound.
Iron(III) chloride complex of HU and EHU
At this point it appeared that it would be difficult to get a good value for the pK *s of the substituted
Sihydroxyureas, so the effort was shifted to finding out more about the reactions between them and certain metal ions.
When an aqueous solution of EHU was added to solutions of the following metal perchlorates, manganese(II), strontium(II), vanadyl, nickel(II), copper(II), zinc(II), cobalt(II), chromium(III), and magnesium(II), such that the ligand-to-metal ratio was 1:1, no color change was
Reproduced with permission of the copyright owner. Further reproduction prohibited without permission.

noted even when the pH was increased from pH = 2-h to pH = 8. However, the reaction between EHU and iron(III) perchlorate produced a very intense bine solution which upon standing, rapidly faded to a nearly colorless solution with the evolution of gas. A similar color was produced when iron(III) chloride was added to a solution of HU, but the color did not fade as rapidly upon standing as in the previous case. When aqueous solutions of each of the other substituted hydroxyureas were mixed with aqueous iron(III) chloride, the blue color that was initially formed faded to a nearly colorless solution in a matter of minutes.
The gases evolved from the reaction between iron(III) chloride and EHU were dissolved in diethyl ether and showed absorptions in the infrared region at 2335 cm”1,2280 cm"1, 2220 cm”1, and 665 cm”1. The first is the asymmetric stretching mode and the last is a rocking mode of carbon dioxide. The absorptions at 2280 cm” 1 and 2220 cm” 1 correspond to the isocyanate stretching vibration of ethyl isocyanate and the N=N stretching mode of nitrous oxide respectively. It appears that the hydroxyureas are involved in an oxidation-reduction reaction, producing nitrous oxide and reducing the metal ion.
When a 1:1 iron(III) chloride-HU solution was allowed to stand for 2 weeks, it was found that 72^ of the iron(III) had been reduced to iron(II) by hydroxyurea.
Iron(III)-HU complex in water
The iron(III)-HU system appeared- to exhibit enough stability in water that it was possible to determine the ligand-to-metal ratio of the complex using the continuous variation method.22 If the sum, C^, of the
Reproduced with permission of the copyright owner. Further reproduction prohibited without permission.

total analytical concentration of the completing agent, CL, and the metal ion concentration, CM, is held constant and only their ratio varied, then
A plot of the absorbance of the solution versus the mole fraction of ligand shows a maximum. If the extreme linear portions are extrapolated until they cross, the mole fraction at the point of intersection gives the formula of the complex.
* °-3 -o56u 0.2 - oCOp<0.1 -
0.5 1.00 XFig. 1. Continuous variation plot of iron(III)-HU complex in water. X = CL/CT.
The plot obtained for the iron(III)-HU complex suggested that the ligand-to-metal ratio in the complex was 1:1. Such a plot for any of the other water- soluble "alphati c-substituted" hydroxyureas would have been impossible due to the rapid drop in absorbance after formation of the complex.
Reproduced with permission of the copyright owner. Further reproduction prohibited without permission.

Stability of iron(III)-HU and EHU complexes in ethanol
When a solution of iron(III) chloride hexahydrate in absolute ethyl alcohol was added to an alcohol solution of EHU so that the ratio of ligand to metal was 1:1, a blue solution was produced, the absorbance of which was relatively constant.
©o%§0. 2aJO<
-e-
20Time (min.)
Fig. 2. Stability of iron(III)-HU and EHU complexes in ethanol. A = Fe-EHU,1:1, O = Fe-HU, 1:1.
The iron(III)-HU complex was found to be more resistant to decomposition than the iron(III)-EHU complex.
An experiment involving the iron(III)-EHU complex in ethanol demonstrated that when an excess of the metal ion was present, the blue color faded at a rapid rate.
Reproduced with permission of the copyright owner. Further reproduction prohibited without permission.

27
100
©o
O< O
o©bo O O °o O
0 0.5X 1.0
Fig. 3» Effect of excess iron(III) on the stability of the iron(III)-EHU complex in ethanol. X = CL/CT#
If the amount of iron(III) is in large excess, the per cent change in absorbance is greater than when the ligand is in excess. The same was true of HU, only the per cent changes were not as great. When large amounts of an alcoholic ferric chloride solution was added to alcoholic solutions of the other substituted hydroxyureas, the blue color which was initially formed was observed to fade to a colorless solution with the evolution of gas over a period of a few minutes.
Iron(III)-EHU complex in ethanol
Continuous Variation Method
A continuous variation experiment on the iron(III)-EHU complex in absolute ethanol showed that the ligand-to- metal ratio in the complex was 1:1. The absorbance was measured immediately after mixing the solution.
Reproduced with permission of the copyright owner. Further reproduction prohibited without permission.

28
0.6
©8 o . *ioco.a^ 0.2
oo o
1.00.5o XFig. 4. Continuous variation plot of iron(III)-EHU complex in ethanol.x = c L / c T .
The intersection of the two extrapolated portions of the plot corresponded to a mole fraction of 0.55 which is equal to a ligand to metal ratio of 1:0.82.It can he seen that the left side of the curve bisects the abscissa at a value of X = 0.02, but the right side passes through the X = 1.0 point. Since the left side of the triangle corresponds to an excess amount of iron(III), more rapid decomposition is taking place in this region than in the solutions with excess ligand.
It is possible to calculate a stability constant22 of the complex using the continuous variation method, if certain conditions are met, namely,
(1) if only one complex species is formed(2) the only equilibrum involved in the system
is the following:
M + nL—I n
Reproduced with permission of the copyright owner. Further reproduction prohibited without permission.

29For a 1 :1 complex the ratio of the true absorbance to the extrapolated absorbance is the mole fraction of the complex actually formed.
A/A = m'extp Csince
and
where
M + L — ■ — ML
s = _ U t L*st CM)(L)
, WKrtJZ______________________________ _
Kst - (C„ - (A/A^plCl^ - A/Ae%tp)C)
C = total analytical concentration of the metal or ligand which ever is the limiting concentration at the point in question.
C„ = total analytical concentration of the metal, w= total analytical concentration of the ligand.
Kst - stability constant.
Calculation of the stability constant at mole fractions of EHU at 0.^8, 0.52, 0.40, 0.72 gave values of 3.50 x 10³, 2.96 x 10³, 2.30 x 10³, and 3.O6 x 103 respectively. The average stability constant was 2.96+0.55 z 10s or log K . = 3S u
Molar Hatio Method
The molar ratio method87 applied to the iron(III)-EHU complex in absolute alcohol gave conclusions similar to those observed from the continuous variation plot.
Reproduced with permission of the copyright owner. Further reproduction prohibited without permission.

30
0.6©sSoS■£§ o.fr <
0.2
Molar Eatlo of LigandPig. 5. Molar ratio plot of iron(III)-EHU complex in ethanol.Calculation of the stability constant using the
same formula described earlier for the continuous variation method gave values of 7.20 x 10s, 3«68 x 103,2.73 3: 103, and 2.^5 x 10³ for points corresponding to molar ratios of 0.50, 1 .00, 2.00, and 3*00 respectively. The average value was ^.00^2.80 x 10³ or log = 3*60, which was in fairly good agreement with the previous value of 3 *^7 «
Slope Ratio Method
Since the stability constant of the complex is small, the slope ratio method28 was used to confirm the formula of the complex. This method involves only solutions containing a large excess of metal or ligand and is applicable when only one complex is formed. The first and last four solutions used for the continuous variation method were plotted in the following manner:
Reproduced with permission of the copyright owner. Further reproduction prohibited without permission.

31
0.3
©§ 0.2uoHP< 0.1
0 1.0 2.0Concentration of Species Not in Excess (x 10”4M)Fig. 6. Slope ratio plot of iron(III)-EHU complex in ethanol.
The fact that the two curves do not lie on top of one another and that curve (B) corresponding to excess iron(III) is lower, again is evidence for more rapid decomposition in the presence of excess lron(III). The fact that the points do not fall exactly on the linear plot but fDim a curve gives supporting evidence for a weak complex being formed. Since ligand and metal are present in large excess, the following is true for the complex MgLg.
Slope of curve with iron(III) in excess.A ab CL~ s " L
whereA = absorbance.CT = analytical concentration of ligand.Lb = cell length.a = absorptivity of the complex.ST = slope of curve.
Reproduced with permission of the copyright owner. Further reproduction prohibited without permission.

32Slope of curve with EHU in excess
A ab CM ~ H "
whereCjj = analytical concentration of metal.
The formula of the complex can then be determined from the ratio of the slopes.
SM S
The ratio was found to be 1:0.84 and the absorptivity at 610 m^was 1 .0 x 103 l/mole-cm.
Conductometric Method
In an effort to confirm that the complex formed was 1:1 , a conductometric titration83 was carried out in water at 25° • However, a plot of conductance versus volume of EHU added produced only a scattering of points. Ideally the end point in a conductometric titration is easily observable because of the difference in ionic conductance of the reactants and the products. This would cause a change in slope of the plot of conductance versus volume of titrant added at the point where ligand and metal ion are in the combining ratios.
A titration of EHU with iron(III) chloride hexahydrate using absolute ethanol as a solvent also gave disappointing results.
Reproduced with permission of the copyright owner. Further reproduction prohibited without permission

33
2:1
©12H
1:1
168 20120Volume of PeCl3 added(ml)
Fig. 7. Conductometric titration of EHU with iron(III) chloride in ethanol. The ligand-to- metal ratios are given.
No distinct break in curve (A) could be observed for the region of excess EHU to a 1 :1 ratio of EHU to iron(III). Titration (B) showed no significant change in the conductance at a ligand-to-metal ratio of 1:1 .
Iron(III)-HU complex in ethanol
The molar ratio method applied to the iron(III)-HU complex showed only a 1:1 complex being formed. The stability constant as calculated at molar ratios of ligand of 0.50, 1 .00, 2.00, and 3»00 was bA6tl.63 x 103
or log Kgt = 3.65.
Reproduced with permission of the copyright owner. Further reproduction prohibited without permission.

0 2 ̂ 6 8 10 Molar Batio of Ligand
Pig. 8. Molar ratio plot of iron(III)-HU complex In ethanol.
A value of 1.2 x 10"3 1/mole-cm was obtained for the molar extinction coefficient at 600 m// as calculated from the stability constant.
Conner(II)-EBP complex
Continuous Variation Method
When alcoholic solutions of copper(II) perchlorate and EHU were mixed such that the ratio of ligand-to-metal ion concentration was 1:1 and = $ x 10"2M, an olive- green material immediately precipitated from the solution. The material was not soluble in most of the common organic solvents, but was soluble in strong acids such as dilute hydrochloric and dilute sulfuric acid. If the total concentration was an order of magnitude lower, no precipitate was observed to form in the greenish-yellow solution.
Reproduced with permission of the copyright owner. Further reproduction prohibited without permission.

The continuous variation method applied to the copper(II) perchlorate EHU system in absolute ethanol gave disappointing results.
0.8
S«ota3 0.*
0.2
0.5X 1.0
Pig. 9« Continuous variation plot of the copper(II)-EHU complex in ethanol. X = C / c T .O = immediately after mixing ligand and metal,a = 1 .5 hr after mixing,v = 20 hr after mixing.
Curve (O) gave a value of X = 0.65s which corresponds to a ligand-to-metal ratio of 2:1. One and a half hr after mixing, the ligand-to-metal ratio was about 3:1 ; 20 hr after mixing, X was equal to 0.55. After standing for 3 days, an olive-green flocculent precipitate formed in all of the solutions.
An aqueous solution of copper(II) perchlorate with a 20 fold molar excess of EHU had no absorption in the 200-1000 m// region which would be useful for any of the spectrophotometric. methods.
Reproduced with permission of the copyright owner. Further reproduction prohibited without permission.

y\(x
10 mho)
36Conductometric Titration
Conductometric titration of the copper(II)-EHU system in water at 25° suggested that both 1 :1 and 2:1 complexes may be forming.
2:1
12.21:1
o o
203 12Volume of EHU added (ml)
Fig. 10. Conductometric titration of copper(II)-EHU system in water at 25°<> The ligand-to-metal ratios are given.
The conductance value could only be read to three significant figures, with the third figure being plotted in the graph. However, it does appear that in the titration at the 1 :1 and 2:1 ligand-to-metal ratios, a small but real change in conductance is observed.
Reproduced with permission of the copyright owner. Further reproduction prohibited without permission.
Coordination Site in Complexes
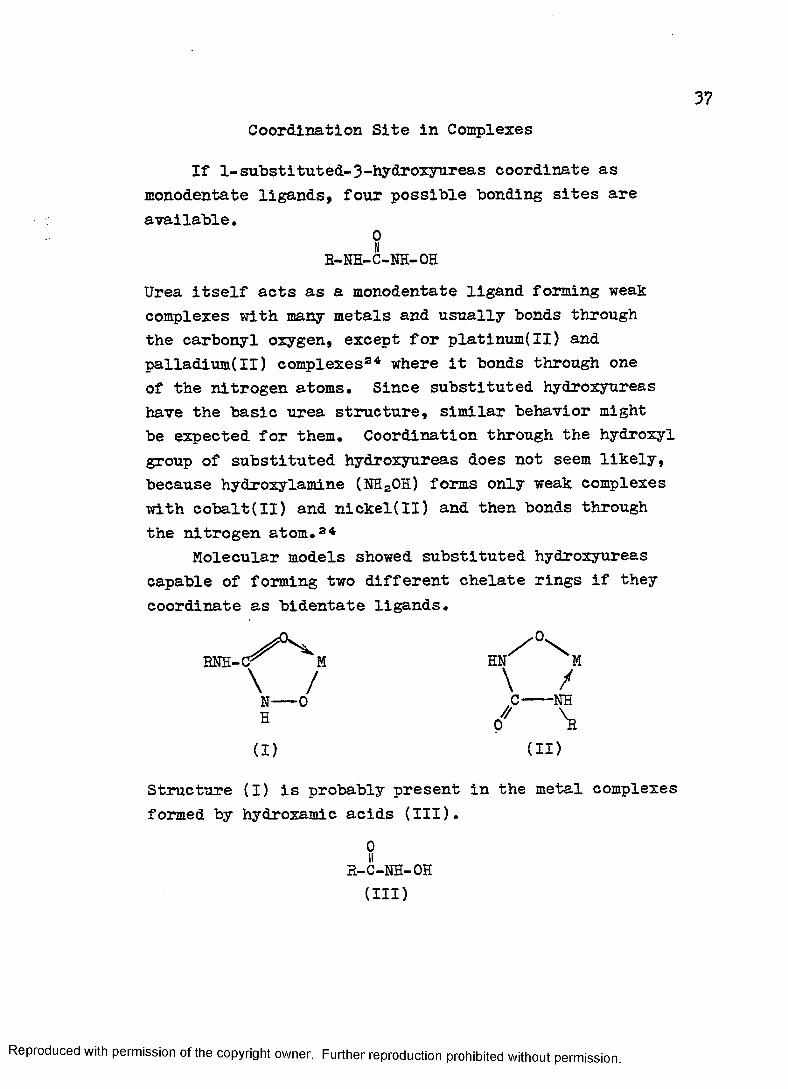
If 1-substituted-3-hydroxyureas coordinate as monodentate ligands, four possible bonding sites are available.
0IIB-NH-C-NH-OHUrea itself acts as a monodentate ligand forming weak complexes with many metals and usually bonds through the carbonyl oxygen, except for platinum(II) and palladium(II) complexes34 where it bonds through one of the nitrogen atoms. Since substituted hydroxyureas have the basic urea structure, similar behavior might be expected for them. Coordination through the hydroxyl group of substituted hydroxyureas does not seem likely, because hydroxylamine (NH2OH) forms only weak complexes with cobalt(II) and nickel(II) and then bonds through the nitrogen atom. 34
Molecular models showed substituted hydroxyureas capable of forming two different chelate rings if they coordinate as bidentate ligands.
ENH-C^ M HN M\ / \ /N 0 .C--- NHP7/ \
(i) (i d
Structure (I) is probably present in the metal complexes formed by hydroxamic acids (III).
0IIb-c-nh-oh(III)
Reproduced with permission of the copyright owner. Further reproduction prohibited without permission.

3.8
In any case coordination involving either form (I) or(II) should cause an oxygen-hydrogen "bond to be broken.The formation of a four-membered ring would not be likely for steric reasons.
Infrared spectra of the complexes
If substituted hydroxyureas coordinate through the carbonyl oxygen atom, a shift to lower wave numbers should be observed for the stretching vibration of the coordinated carbonyl group35 compared to that of the uncoordinated molecule.
C=0-^MThe metal Ion withdraws electron density from the double bond and thereby increases the single bond character of the C=0 group.
The donor atom in hexakis(urea)iron(III) perchlorate, (Fe(CH4N20 )^ (C104)3, has been shown by Infrared absorption data35 to be the carbonyl oxygen. The stretching vibration of the coordinated carbonyl group occurred at 1625 cm” 1 compared to 1683 cm” 1 for the uncoordinated group. This was a shift of approximately 55 cm” 1 to lower frequency. The N-H stretching vibration of the coordinated urea occurred at a slightly higher frequency than in the uncoordinated compound.
An infrared spectrum of HU in nujol produced absorption bands in the 6/y region at 16*1-0 cm” 1 and 1585 cm”1. When HU was deuterated using deuteroethanol, the absorption band at 1585 cm” 1 decreased in intensity while the band at 16*1-0 cm" 1 was unaffected, thereby proving the higher frequency absorption to be the C=0 stretching vibration. The other band, 1585 cm"1, is probably an N-H bending mode.
Reproduced with permission of the copyright owner. Further reproduction prohibited without permission.

The carbonyl group In the complex bis(hydroxyurea)_ copper(II) perchlorate [Cu(HU)3] (C104) 3 Is a coordination site. In the complex the absorption band with the highest frequency in the 6/y region appears at 1615 cm”1. This represents a shift of the C=0 absorption band to lower energy of at least 25 cm"1. The infrared bands at 3^20 cm" 1 and 3320 cm"1, probably N-H stretching vibrations, are shifted to higher frequency in the complex (see table II). The band due to the hydrogen-bonded 0-H group is absent in the spectrum of the complex.
If the ligand is coordinated through the carbonyl group as the evidence suggests, _the hydroxyl-oxygen atom must be the other coordination site if a five- membered chelate ring is to be formed (I, p.37). This could be confirmed by the absence of an 0-H stretching vibration in the spectrum of the complex. However, identification of the 0-H band using deuterium exchange is difficult. Simply deuterating the ligand by dissolving it in a suitable solvent would replace all of the hydrogen with deuterium not just the hydroxyl proton
The fact that the absorption due to the hydrogen- bonded 0-H group is not present in the complex is not evidence for a five-membered chelate ring being formed.
Since hydroxamic acids exhibit hydrogen bonding of the type illustrated in (IV), it is likely that the same type exists in substituted hydroxyureas. Therefore,HU could coordinate as a monodentate ligand through the carbonyl group and break the hydrogen bond.
E(IV)
Reproduced with permission of the copyright owner. Further reproduction prohibited without permission.

The carbonyl absorption band for EHU was assigned using deuterium exchange and found to occur at 1625 cm”1.In the iron(III) complex this band was observed to shift to lower wavelength by at least 25 cm”1, indicating that the carbonyl oxygen is the donor atom. The disappearance of the hydrogen-bonded 0-H group was also,evident from the spectrum of the complex. An attempt was made to identify the C=0 absorption band in the complex by reacting deuterated EHU with iron(III) chloride hexahydrate in deuteroethanol. An infrared spectrum of the resulting complex showed very little deuterium in the ligand. The complex was redissolved in deuteroethanol and heated on a steam cone for 5 min. An infrared spectrum showed that still no exchange had taken place.
The interpretation of the infrared spectrum of the iron(III)-HU complex is more difficult. The absorption with the largest frequency in the 6,//region was 1635 cm”1. If this is the carbonyl absorption band in the complex, then essentially no shift occurred upon complexation.The infrared spectrum revealed that the hydrogen bonded 0-H group is absent in the complex and the N-H stretching vibrations are shifted to higher frequencies. If the coordination involved the nitrogen atoms, a shift to lower frequency should be observed for the N-H stretching vibrations due to the electron withdrawing properties of the metal.
Reproduced with permission of the copyright owner. Further reproduction prohibited without permission.

TABLE IIInfrared Absorption Maxima in Cm”1
Fe(III)-HU Fe(III)-EHU HU EHU fCu(HU)ol (C10A)a Complex Complex
3^20 m 3*KL0 s 31*80 8 31*60 m 31*00 s3320 s 3200 s 3350 s 3350 s 3220 s3250 sh 2800bw 3220 m 3270 sh 2980 m28l0bm 1625 s 1615 s 1635 s 291*0 m161*0 s 1570 s 1560 s 1560 s 2880 m1585 s 11*50 s 11*50 m 1500 w
j1600 s
ll*80 m 1360 w 1090 m 1375 w 1570 sll*00 m 1320 w 1070 m 1270 w li*i*5 w1100 m 1280 w 975 w 1100 m 1380 w1090 sh 1150 m 1035 w 1355 w970 w 1090 w 1280 w
1065 m 111*5 m! 980 w 1065 w890 w
a Abbreviations* s, strong* m, medium* w, weak* sh, shoulder. Spectrum determined In fluorolube mull.

Ultraviolet, visible, and near-Infrared spectra
An attempt was made to learn more about the environment around the iron(III) atom In the HU and EHU complexes by examining the region 200-1000 uy/(table III). The hexakis(urea)iron(III) perchlorate In water produced a weak band at 810 m# which is probably a d-d band. It was hoped that a similar band could be identified for the substituted hydroxyurea complexes so a comparison between the compounds could be made. However, the d-d absorption bands for the complexes are obscured by a very intense charge transfer band making it impossible to observe the weaker bands. Usually charge transfer bands occur in the ultraviolet region. But if the ligand is a good reducing agent, they can be observed at higher wavelength.26
Reproduced with permission of the copyright owner. Further reproduction prohibited without permission.

Reproduced
with perm
ission of the
copyright ow
ner. Further
reproduction prohibited
without
permission.
TABLE III
Ultraviolet, Visible, and Near-infrared Absorptions(200-1000 m )
Compound Solventa
FeCls waterethanol
260242, 7.7
Fe(CH4Na0)a(C104 ) 3 waterethanol
' 299, 251,
1.36.3
Fe(III)-HU complex waterethanol
334 j 307,
5603.0
Fe(III)-EHU complex waterethanol
560315, 2.4
Cu(«U)a(C104 ) 8 ethanol 376
vAbsorptions
x 103» 324, 4.4 x 10³; 364, 5 .1 x 103
x 103} 810, 4.0 x 10” 1X 10³s 352, 2 .3 x 10s
x 103; 600, 1 .2 x 10s
x 103; 610, 1 .0 x 103
a The samples were 1 x 10”a- 1 x 10”3M solutions in deionized distilled water and absolute ethanol with the pure solvent as a reference.^ The first number is the wavelength of the absorption in millimicrons followed by the molar absorptivity.
•£-VjO
i

SUMMABI
It has been shown that it is difficult to determinethe pK *s of 1-substitut ed-3-hydroxyureas potentiometri- 8>cally because of their rapid decomposition in base. An evaluation of the pK *s spectrophotometrically was impos-
Sisible because the aliphatic-substituted compounds had no absorption in the region 200-1000 m#. No colored complexes were observed to form with a variety of transition and non>-transition metals with EHU in aqueous solution. The compounds HU and EHU act as reducing agents in the presence of iron(III), giving iron(II) and nitrous oxide as products. Both HU and EHU formed a 1:1 complex in ethanol with iron(III) which slowly decomposed. The stability constants of the complexes were determined spectrophotometrically, and found to be pKg£ = -3*60 and pKg^ = -3*65 for the EHU and HU complexes respectively. A conductometric titration suggested that HU forms a 1:1 and 2:1 complex with copper(II) in water. Infrared data show that the 2:1 copper(II)-EHU and the 1:1 iron(III)-EHU complexes are coordinated through the carbonyl oxygen atom.
Reproduced with permission of the copyright owner. Further reproduction prohibited without permission.
APPENDIX
The procedure used for the calculation of the pK& from a potentiometric titration is described by Albert and Serjeant.31 The method involved the determination of the ratio of the protonated species, LH, to the unprotonated species, L“. This ratio was then corrected for the hydroxyl ion concentration at the recorded pH and the log of this ratio was taken. Prom this value and the experimentally determined value for the pH, the pK_ was calculated for each point on the titration curve using the following equation:
pK = pH + log(LH/L“)Cl
The pK_ values for each point on the curve were averaged and the standard deviation calculated. A computer program30 was used for the calculations.
Reproduced with permission of the copyright owner. Further reproduction prohibited without permission.
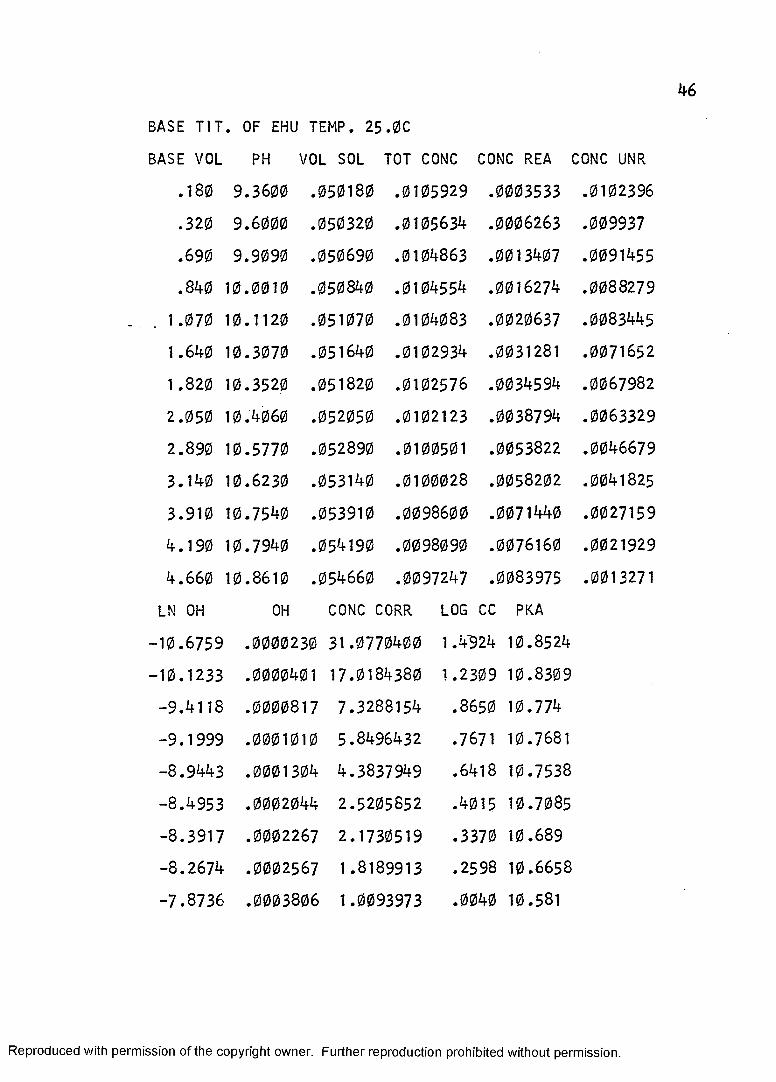
BASE T IT . OF EHU TEMP. 2 5 .0C
ASE VOL PH VOL SOL TOT CONC CONC REA CONC UNR
.180 9.3600 .050180 .0105929 .0003533 .0102396
.320 9.6000 .050320 .0105634 .0006263 .009937
.690 9.9090 .050690 .0104863 .0013407 .0091455
.840 10.0010 .050840 .0104554 .0016274 .0088279
1.070 10.1120 .051070 .0104083 .0020637 .0083445
1.640 10.3070 .051640 .0102934 .0031281 .0071652
1.820 10.3520 .051820 .0102576 .0034594 .0067982
2.050 10.4060 .052050 .0102123 .0038794 .0063329
2.890 10.5770 .052890 .0100501 .0053822 .0046679
3.140 10.6230 .053140 .0100028 .0058202 .0041825
3.910 10.7540 .053910 .0098600 .0071440 .0027159
4.190 10.7940 .054190 .0098090 .0076160 .0021929
4.660 10.8610 .054660 .0097247 .0083975 .0013271
LN OH OH CONC CORR LOG CC PKA
10.6759 .0000230 31.0770400 1.4"924 10.8524
10.1233 .0000401 17.0184380 1.2309 10.8309
-9 .4 1 1 8 .0000817 7.3288154 .8650 10.774
-9 .1 9 9 9 .0001010 5.8496432 .7671 10.7681
-8 .9 4 4 3 .0001304 4.3837949 .6418 10.7538
-8 .4 9 5 3 .0002044 2.5205852 .4015 10.7085
-8 .3 9 1 7 .0002267 2.1730519 .3370 10.689
-8 .2 6 7 4 .0002567 1.8189913 .2598 10.6658
-7 .8 7 3 6 .0003806 1.0093973 .0040 10.581
Reproduced with permission of the copyright owner. Further reproduction prohibited without permission.

LN OH OH CONC CORR LOG CC PKA
-7 .7 6 7 7 .0004231 .8533704 — .0688 10.5541
-7 .4661 .0005721 .5003289 - .3 0 0 7 10.4532
-7 .3 7 4 0 .0006273 .4035530 - .3 9 4 0 10.3999
-7 .2 1 9 7 .0007319 .2686236 - .5 7 0 8 10.2901
AVERAGE PKA = 10.64( .1 7 )
Reproduced with permission of the copyright owner. Further reproduction prohibited without permission.

BASE T IT . OF EHU TEMP. 0.8C
BASE VOL PH VOL SOL TOT CONC CONC REA CONC UNR
.200 9.5330 .050200 .0092435 .0003864 .0088571
.420 9.8270 .050420 .0092032 .0008080 .0083952
.600 9.9800 .050600 .0091705 .0011501 .0080203
.800 10.0920 .050800 .0091344 .0015275 .0076068
1.005 10.1680 .051005 .0090977 .0019112 .0071864
1.260 10.2600 .051260 .0090524 .0023843 .0066681
1.510 10.3380 .051510 .0090085 .0028435 .0061649
1.700 10.3740 .051700 .0089754 .0031895 .0057858
1.900 10.4100 .051900 .0089408 .0035510 .0053897
2 .000 10.4220 .052000 .0089236 .0037307 .0051928
2 .210 10.4620 .052210 .0088877 .0041059 .0047818
2 .400 10.5050 .052400 .0088555 .0044427 .0044127
2.600 10.5500 .052600 .0088218 .0047946 .0040271
LN OH OH CONC CORR LOG CC PKA
-1 2 .3 8 4 4 .0000041 23.1807320 1.3651 10.8981
-1 1 .7 0 7 4 .0000082 10.5072290 1.0214 10.8484
-11 .3551 .0000117 7.0549927 .8484 10.8284
-1 1 .0 9 73 .0000151 5.0396599
-1 0 .9 2 2 3 .0000180 3.8053821
-1 0 .7 1 0 4 .0000223 2.8325262
-1 0 .5 3 0 8 .0000266 2.1981069
- 1 0 .4 4 7 9 .0000290 1.8398252
-10 .3 6 50 .0000315 1.5403326
.7024 10.7944
.5803 10.7483
.4521 10.7121
.3420 10.68
.2647 10.6387
.1876 10.5976
Reproduced with permission of the copyright owner. Further reproduction prohibited without permission.

LN OH
-10.337**
-1 0 .2 4 5 3
-1 0 .1 4 6 3
-1 0 .0 4 2 7
OH CONC CORR LOG CC PKA
.0000323 1.4128514 .1500 10.572
.0000355 1.1835050 .0731 10.5351
.0000392 1.0110018 .0047 10.5097
.0000435 .8567684 - .0 671 10.4828
AVERAGE PKA = 10 .68( . 13)
Reproduced with permission of the copyright owner. Further reproduction prohibited without permission.

BIBLIOGRAPHY
1. W. Dresler and H. Stein, Ann,, 150. 242 (1869).2. L, Francesconi and A. Parrozzani, Gazz. Chim. ital.,
(2), 21, II, 334 (1901).3. C. Hurd and L. Spence, J, Am. Chem. Soc., 4£, 266
(1927).4. C. Bunti and H. Deghenghi, Ann. Frlestinl. 22-23.
sez. 2a, 9 (1952-53).5. H. Kofod, Acta Chem. Scand.. 11. 1276 (1957).6. 0. Exner, Chem. LIsty.. 50. 2025 (1956).7. H. Kofod, Acta Chem. Scand.. 8, 494 (1954).8. H. Kofod, Acta Chem. Scand.. £ 1575 (1955).9. W. Fishbein, F. Winter, and J. Davidson, J. Biol. Chem.
240. 2402 (1965).1 0 . E. Boyland and R. Nery, J. Chem. Soc., 3 5 0 ( 1966c ) .
11. B. Stearns, K. Losee, and J. Bernstein, J. Med. Pharm.Chem.. 6(2), 201 (1963).
12. W. Fishbein and P. Carbone, Science. 142. 1069 (1963).13. A. Bendich, E. Borenfretmd, G. Komgold, and M. Krim,
J. Natl. Cancer Inst.. £2, 667 (1964).14. R. Adamson, Proc. Soc. Exptl. Biol. Med.. 112(2), 456
(1965).15. Allied Chem. Corp., (by E. Gilbert and E. Rumanowski),
Fr. 1.320.068. C.A. 59:9886g.16. Badlsche Anilin - Soda-Fabrik A.-G.-, (by Gustav
Steinbrunn), Ger. 1.127.344. C.A. 48:974lg.17. R. Deghenghi, "Organic Synthesis," M. Newman, Editor,
John Wiley & Sons, Inc., New York, 40, 60 (i960).18. Olin Mathieson Chemical Corp., Brit. 930.844. C.A.
60:2790b.5 0
Reproduced with permission of the copyright owner. Further reproduction prohibited without permission.
51
19. Badische Anilin - SocLa-Fabrik A.-G.-, (by Gustav Steinbrunn), Ger. 1.131.655. C.A. 57:13628e.
20. E. Nipe, M.A. Thesis, Western Michigan University (1966).21. A. Albert and E. Serjeant, "ionization Constants of
Acids and Bases,9 John Wiley & Sons, Inc., New York,12, 30 (1962).
22. C. Reilley and D. Sawyer, "Experiments for Instrumental Methods,” McGraw-Hill Book Co., Inc., New York, 1?6 (1961).
23. H. Willard, L. Merritt, and J. Dean, "instrumental Methods of Analysis," D. Van Nostrand Co., Inc., Princeton, N.J., 3rd, 568 (1958).
24. K. Jorgensen, "inorganic Complexes," Academic Press,New York, 77, 104 (1963)-
25. E. Penland, C. Mizushima, J. Quagliano, J. Am. Chem.Soc., ££, 1575 (1957).
26. F. Basolo and E. Pearson, "Mechanisms of Inorganic Reactions,1' John Wiley & Sons, Inc., New York, 3 6 8 (1965).
27. J. Yoe and A. Jones, Ind. and Eng. Chem.. Anal. Ed.,16, 111 (1944).
28. A. Harvey and D. Manning, J. Am. Chem. Soc.. 72. 4488 (1950).
Reproduced with permission of the copyright owner. Further reproduction prohibited without permission.

VITA
The author was b o m on April 11, 19^2 in South Bend, Indiana. He attended St. Joseph’s High School graduating in i960. After earning a Bachelor of Science Degree from Purdue University in 1965> he enrolled in graduate studies at Western Michigan University. The author is a member of the American Chemical Society.
52
Reproduced with permission of the copyright owner. Further reproduction prohibited without permission.


![Review Metal Complexes of Biologically Important … · Review Metal Complexes of Biologically Important Ligands, CLXXII [1]. Metal Ions and Metal Complexes as Protective Groups of](https://static.fdocuments.us/doc/165x107/5b7bd4387f8b9a70138b62d2/review-metal-complexes-of-biologically-important-review-metal-complexes-of-biologically.jpg)
