Metadata on SDGs Indicator 11.6.1 Indicator category Tier II
13
Metadata on SDGs Indicator 11.6.1 Indicator category: Tier II Goal 11: Make cities and human settlements inclusive, safe, resilient and sustainable Target 11.6: By 2030, reduce the adverse per capita environmental impact of cities, including by paying special attention to air quality and municipal and other waste management Indicator 11.6.1: Proportion of urban solid waste regularly collected and with adequate final discharge out of total urban solid waste generated, by cities LAST REVIEWED: MARCH 2018
Transcript of Metadata on SDGs Indicator 11.6.1 Indicator category Tier II

Metadata on SDGs Indicator 11.6.1
Indicator category: Tier II
Goal 11: Make cities and human settlements inclusive, safe, resilient and sustainable
Target 11.6: By 2030, reduce the adverse per capita environmental impact of cities, including by paying special attention to air quality and municipal and other waste management
Indicator 11.6.1: Proportion of urban solid waste regularly collected and with adequate final discharge out of total urban solid waste generated, by cities
LAST REVIEWED: MARCH 2018

Metadata on SDG Indicator 11.6.1
Page 2
1. Concepts and definitions
1.1 Definition:
Proportion of municipal solid waste regularly collected
and with adequate treatment and disposal out of total
municipal solid waste generated
The goal of this indicator is to generate data on the
proportion of municipal solid waste regularly collected
and that is adequately treated and disposed out of all the
total municipal waste generated by the city.
1.2 Rationale:
Urban households and businesses produce substantial
amounts of solid waste that must be collected regularly,
recycled or treated and disposed properly in order to
maintain healthy and sanitary living conditions. Many
cities are increasingly facing solid waste management
challenges due to rapid urbanization, lack of technical and
financial capacity or low policy priority. As urbanization
and population growth will continue, it is expected that
municipal solid waste generation will double by 2025. In
addition, the higher the income level of a city, the greater
the amount of the solid waste produced. Therefore, the
economic growth to be experienced in the developing
and emerging countries will pose greater challenges in
solid waste management to local governments in the next
decades.
The environmental impacts of uncollected waste in a
city are significant. Uncollected solid waste can end up
in drains leading to the blockage of drainage systems
and cause unsanitary conditions that have a direct health
impact on residents. Open burning of uncollected waste
produces pollutants that are highly damaging locally and
globally. Vectors such as mosquitoes usually breed in
blocked drainages and blocked drainages contribute to
flooding. In 2015, the Global Waste Management Outlook
estimated that at least 2 billion people do not have access
to regular waste collection . This is particularly worse in
informal settlements and the UN-Habitat’s report Solid
Waste Management in World Cities published in 2010
estimated only 5% of waste in squatter areas is regularly
collected .
Even when solid waste is collected, it is not uncommon
that recycling and treatment facilities or landfill sites
are not operated in an environmental sound manner,
especially when lacking a pollution control system.
Particularly in developing countries lacking technical and
financial capacity, open dumping or uncontrolled landfill
is the common way of disposal. Leachate generated in
dumping sites pollutes surface and groundwater. Frequent
fire and explosions caused by the high temperature
inside the accumulated waste is a source of air pollution.
Composting and recycling facilities and incineration plants
lacking pollution control systems are one of the largest
pollution sources. Open dumpsites are major sources of
greenhouse gasses (GHG) emission in urban settings, and
if the situation follows the business as usual together with
the rapid urbanization, dumpsites will account for 8-10% of
the global anthropogenic GHG emission by 2025.
Improper waste management accelerates poverty and
social exclusion. In an open dumpsite, waste pickers or
scavengers are regularly collecting recyclables without
any protection measures. They are exposed to extreme
health threats and it is estimated that 20% of these
waste pickers are children missing school. The frequent
explosion or landslides in open dumpsites often kill these
waste pickers. It is also not unusual that gangs or cartels
are involved in these informal recycling activities or open
dumpsites operations.
Plastics and other waste material along ocean shore © nationalgeographic.com

Metadata on SDG Indicator 11.6.1
Page 3
Garbage collection in a city © rusustain.files.wordpress.com
and resource management. Moreover, a regular solid
waste management strategy is a clear indicator of the
effectiveness of a municipal administration. Good waste
governance that is inclusive, financially sustainable and
based on sound institutions is one of the key challenges
of the 21st century, and one of the key responsibilities of a
city government.
Many developing and transitional countries and cities have
an active informal sector and micro-enterprise recycling,
reuse and repair; which often help them achieve higher
recycling and recovery rates comparable to those in the
west. This results in savings on the waste management
budget for the cities. There is a major opportunity for the
city to build on these existing recycling systems, reduce
some unsustainable practices and enhance them to
protect and develop people’s livelihoods, and to further
reduce the city costs/expenditures for managing the
residual wastes. The formal and informal sectors need
to work together, for the benefit of both. Promoting this
indicator also can help formalization of the informal sector
in the process of increasing the portion of ‘solid waste
with adequate discharge’.
The indicator 11.6.1 is the quotient of municipal solid waste
regularly collected and with adequate treatment and
disposal divided by total municipal solid waste generation
of a city. This can effectively address the key aspects in
the waste stream from generation to disposal. Municipal
solid waste management is generally the mandate of sub-
national or local governments and has four stages: waste
generation; waste collection and transport; recycling
and treatment; and disposal. In these four stages,
environmentally sound ways of management and operation
are essential to reduce the adverse impacts of wastes to
cities. Also, the environmentally sound management of
solid waste contributes to the formalization of informal
sector and improves waste pickers lives in many cases.
For example, the improvement of solid waste disposal
operation through upgrading open dump-sites to sanitary
landfills creates jobs in waste separation or landfill site
operation. This can empower waste pickers who currently
work under extreme conditions.
The indicator 11.6.1 will also promote Integrated Solid
Waste Management (ISWM). An integrated solid waste
management system is strongly connected to three
dimensions: urban environmental health, the environment

Metadata on SDG Indicator 11.6.1
Page 4
The indicator 11.6.1 has strong linkages to other SDG
indicators such as 6.3 (proportion of wastewater safely
treated), 12.4.2 (Hazardous waste generated per capita
and proportion of hazardous waste treated and by type of
treatment) and 12.5 (National recycling rate). It is important
to harness synergies and manage potential conflicts
or trade-offs both within and between the indicators.
This will require collaboration across institutions that
are traditionally structured in silos that focus on specific
sectors. New ways of collaborative working in partnerships
with either informal or formal mechanisms are needed to
facilitate collaboration such that policy makers, managers
and experts with different responsibilities are able to
harness the synergies between goals and targets. This
will be a major challenge in implementation of the 2030
Agenda.
1.3 Concepts:
It will be necessary to define the following components to
compute the proportion of municipal solid waste regularly
collected with adequate treatment and disposal out of all
the total municipal solid waste generated by the city.
Municipal Solid Waste is waste generated by households,
and waste of a similar nature generated by commercial
and business establishments, industrial and agricultural
premises, institutions such as schools and hospitals, public
spaces such as parks and streets and construction sites.
Generally, it is non-hazardous wastes composed of food
waste, garden waste, paper and cardboard, wood, textiles,
nappies (disposable diapers), rubber and leather, plastics,
metal, glass, and refuse such as ash, dirt and dust. Sewage
sludge and faecal sludge is also included in the category
of municipal solid waste, but it excludes wastewater. This
will be the monitoring scope of the indicator.
Regularly Collected Municipal Solid Waste refers to
municipal solid waste that is routinely collected from
specific addresses or designated collection points. Waste
collection is conducted directly by municipal authorities
or private contractors licensed/commissioned by
municipal authorities with a regular schedule of the day
of the week and time of collection. In some cases, private
waste collection companies have contracts with clients
individually and provide collection services.
Uncollected Municipal Solid Waste refers to waste
generated in a city but uncollected due to the lack of
collection services. In many cities, informal settlements
areas do not have access to this basic service. The amount
of uncollected waste can be estimated by waste generation
per capita in the city multiplied by the population which
does not have access to the solid waste collection service.
Total Municipal Solid Waste Generated by the City is sum
of municipal solid waste, or the sum of regularly collected
municipal solid waste and uncollected municipal solid
waste.
Municipal Solid Waste with Adequate Final Treatment and Disposal refers to the total municipal solid waste destined
for treatment or disposal facilities that at least reached
an intermediate level of control. The level of adequacy for
a particular facility can be assessed using the qualitative
criteria including 1) degree of control over waste reception
and general site management; 2) degree of control over
waste treatment and disposal and 3) degree of monitoring
and verification of environmental control. A score of at
least 10 on each criterion is the threshold required to be
considered as ‘adequate final treatment and disposal.
2. Method of Computation
The numerator of this indicator is ‘municipal solid waste regularly collected with adequate final treatment and disposal’ and the denominator is ‘total municipal solid waste generated by the city’.
=Total municipal solid waste generated by the city
×100 x
Municipal solid waste regularly collected with adequate final treatment and disposal[ ]
Multiplication of the municipal solid waste generation
per capita and population of the city can estimate total
municipal solid waste generated by the city. When
the municipal solid waste generation per capita is not
available, surveys to collect data on daily waste generation
in households and other premises (e.g. restaurants, hotels,
hospitals, schools, etc.) should be conducted. Since the
waste generation can differ according to the seasons, the
survey should be conducted at least two times a year to
estimate the municipal solid waste generation per capita.

Metadata on SDG Indicator 11.6.1
Page 5
Municipal solid waste regularly collected with adequate
final treatment and disposal is estimated through
qualitative judgement of the degree of environmental
control of facilities where the city’s municipal waste is
collected and transported. The judgement of environmental
control can be conducted in line with the criteria below.
Another important thing is to deduct residue amount from
treatment facilities to avoid double count.
All the treatment and disposal facilities that receive
municipal solid waste of the city are checked against the
criteria above and scored. Facilities that are scored above
10 for all the criteria are accounted as facilities that can
deliver ‘adequate treatment and disposal’. Therefore, the
amount of municipal solid waste received by the facilities
that has capacity of delivering ‘adequate treatment and
disposal’ is accounted as the amount of Municipal solid
waste regularly collected with adequate final treatment
and disposal.
Degree of control over waste reception and handling at each site. This criterion should be applied to all treatment and disposal sites, whatever the specific process being used
Factors affecting the assessment include:
• Vehicular access to the site (high level of control: hard surfaced access roads of adequate width and load-bearing capacity, kept clean and free of mud)
• Traffic management (high level of control: any queues for site access kept short in time and contained within the site; little impact of traffic on neighbours).
• Site security (high level of control: site fenced; no unauthorised site access; gates locked when site closed).
• Waste reception and record keeping (high level of control: reception office; staffed during all opening hours; all vehicles logged and loads checked; weighbridge installed and all weights logged). Note that the procedures for monitoring the records thus collected are assessed under (3).
• Waste unloading (high level of control: waste directed to a designated area; unloading supervised by site staff).
• Control over nuisance (high level of control: successful control of windblown litter, flies, vermin, birds and of ‘mud’ leaving the site on vehicle tyres)
• Control of fires (high level of control: no routine burning of wastes; no ‘wild’ fires; active fire prevention and emergency response systems in place in case of accidental fire)
a. No control
b. Low level of control
c. Medium level of control
d. Medium/High level of control
e. High level of control
0 is scored
5
10
15
20
Degree of control over both the waste treatment and disposal process in use at each site and over any potential emissions.
This criterion covers both the presence of the necessary technologies, and the operating procedures for their proper use.
The nature of controls required will depend on both the process employed and on the potential emissions. As an example, the table below provides guidance on how the general principles can be applied to land disposal and thermal treatment (using the specific example of mass-burn incineration).
For biological treatment, the detail will vary with the type of process (e.g. windrow composting, in-vessel composting, anaerobic digestion). However, in all cases a ‘high level’ of control would imply a high degree of control over: the incoming waste (to avoid hazardous waste or contrary materials); processing temperature to ensure pathogen destruction; retention time in the process; mixing in the process (including turning of windrows); atmospheric emissions including odours and bio aerosols; and leachate collection and treatment.
Similar principles can be applied to other facilities, including mechanical-biological treatment (MBT) plants, advanced thermal treatment and new technologies for valorisation of organic waste in developing countries. In each case, the user may use the following scoring tables as a ‘best judgment’ guideline for scoring.
Where a fuel is being made from waste to be burnt elsewhere, then the assessment should include the process and emission controls at the user facilities.
Table 1: Criteria to be used in evaluating waste collection mechanisms and disposal.

Metadata on SDG Indicator 11.6.1
Page 6
Degree of monitoring and verification of environmental controls (Includes the existence and regular implementation of: robust environmental permitting/ licensing procedures; regular record keeping, monitoring and verification carried out by the facility itself; AND monitoring, inspection and verification by an independent regulatory body)
The environmental monitoring programme and process control record keeping required will be specific to the type of facility.
• All sites must comply with the federal/national/local environmental legislation, have conducted an Environmental Impact Assessment (EIA) where necessary, have obtained the most recent permit/license and kept it up-to-date.
• Permitting processes should be supportive of initiatives that improve environmental performance of the system. A lower score should be assigned if permitting processes for improved facilities have been unduly long and complex, while existing facilities continued to operate with much lower levels of (or no) environmental control.
• For all sites it should include incoming waste volumes, weights and categories; at least occasional monitoring of waste composition and relevant properties; control of ‘nuisance’ (including windblown litter, flies, vermin, birds and ‘mud’ leaving the site on vehicle tyres); and control of odour, site fires, and emission of potential greenhouse gases (particularly methane and nitrous oxides, as well as carbon dioxide).
• For all land disposal: ground and surface water.
• For engineered and sanitary landfills: leachate and landfill gas management.
• For thermal treatment: moisture content and calorific value of incoming wastes; temperature, residence time, emissions to air (including those of nitrogen oxides (NO), sulphur dioxide (SO2), hydrogen chloride (HCl), heavy metals and dioxins), effluent treatment and disposal, and the quantities and management methods of both fly ash and bottom ash.
• For biological treatment: input waste controls (to protect both the process and the product quality); process control (temperature, residence time, mixing); product quality control; emissions controls; and greenhouse gas controls (particularly methane and nitrous oxides).
a. No compliance
b. Low compliance
c. Medium Compliance
d. Medium/High compliance
e. High compliance
0 is scored
5
10
15
20
Level of Control Score Land disposal Thermal treatment
a. None 0 Uncontrolled dumping–no controls Uncontrolled burning lacking most ‘control’ functions
b.Low (Semi-controlled facility)
5Site staffed; waste placed in designated area; some site equipment
Site staffed; some containment and management of combustion process; basic operating procedures to control nuisance
c.Medium (Controlled facility)
10Waste compacted using site equipment; waste covered (at least irregularly)
Emission controls to capture particulates; trained staff follow set operating procedures; equipment properly maintained; ash properly managed
d.Medium/high (Engineered facility)
15
Engineered landfill site: use daily cover material; some level of leachate containment and treatment; collection of landfill gas
High levels of engineering and process control over residence time, turbulence and temperature; emission controls to capture acid gases and capture dioxins; active management of flyash.
e.High (State-of-the-art facility)
20
Fully functional sanitary landfill site: properly sited and designed; leachate containment (naturally consolidated clay on the site or constructed liner); leachate & gas collection; gas flaring and/or utilization; final cover; post closure plan
Built to and operating in compliance with international best practice including eg. EU or other similarly stringent stack and GHG emission criteria Flyash managed as a hazardous waste using best appropriate technology.
Table 2: Score card for treatment and disposal facilities

Metadata on SDG Indicator 11.6.1
Page 7
3. Comments and limitations
Collection of data for the indicator is not infeasible but
it will require training and capacity development. The
data on total municipal solid waste generation is globally
available although the precision of data is disputable.
In general, developed countries have solid waste data
collection systems but most of the middle and low-income
countries do not have data. In these countries and cities,
household surveys and other complimentary surveys
can be conducted for the estimation of municipal waste
generation per capita.
However, one of the key challenges of data precision
in the middle to low income countries is the lack of
accurate population data in their jurisdiction, particularly
regarding slums, where usually no waste collection service
is available. In addition, collection of data such as the
amount of waste adequately treated and disposed will be
a challenge for many national and local governments. The
judgement on the adequacy of treatment and disposal of
all the waste management facilities, including composting,
recycling, incineration facilities in a city, requires high
level of technical capacity and large investment in human
resources.
Considering the various situations on waste data
availability in different countries, it would be better to
have different methods to collect data from countries.
For OECD or developed countries that already have data,
distributing and collecting questionnaires to national
officials from responsible ministries such as ministry of
environment or urban development would be sufficient to
collect legitimate data. For middle to low income countries
without legitimate data, baseline surveys by waste
management professionals together with monitoring
capacity development will be necessary.
4. Disaggregation:
Data for this indicator can be disaggregated at the city
and town levels.
• Disaggregation by location (intra-urban)
• Disaggregation by source of waste generation e.g.
residential, industrial, office, etc.
• Disaggregation by type of final treatment and disposal
5. Data Sources
5.1 Municipal Solid Waste Generation Per Capita
For countries and cities that have the data already, data
can be collected through questionnaires. For countries
and cities that do not have the data, a household survey
to identify daily waste generation should be done, at least
two times a year in different seasons. In the household
survey, liner bags would be distributed to each household
to be surveyed and the household head asked to put 7
days of waste generated. The liner bags would then be
collected and weighed. Determination of the households
to be surveyed should be based on the income levels.
Municipal waste from other sources such as markets,
restaurants, hotels, schools, etc. should also be measured.
5.2 Population in the City
• Population census
5.3 Municipal Solid Waste Regularly Collected with Adequate Final Treatment and Disposal
Survey on the qualitative judgement of waste treatment
and facility as well as daily amount of waste received by
the facilities is required. The sheet below can be utilised.

Metadata on SDG Indicator 11.6.1
Page 8
6. Data Availability
6.1 Description:
The existing global waste data collection system includes
the UNSD/UN Environment Questionnaire on Environment
Statistics (waste statistics), the OECD/Eurostat
Questionnaire on Waste Statistics and UN-Habitat’s City
Prosperity Index (CPI). The existing data collection system
provides many necessary statistics for calculation of this
indicator. Nevertheless, further work remains to be done
to provide all of the basic statistics necessary for the
indicators.
The UNSD/UN Environment Questionnaire on Environment
Statistics covers the non-OECD/Eurostat countries while
the OECD/ Eurostat Questionnaire covers the remaining
countries. They both include statistics on waste generated
at the national level, municipal waste collected and treated
at the national level, the composition of municipal waste,
and the generation and treatment of hazardous waste.
In addition, the UNSD/UN Environment Questionnaire on
Environment Statistics includes municipal waste collected
and treated at the city level and currently there are data for
168 cities. Some waste data are being collected at the city
level by UN-Habitat and UN Environment and published in
reports such as the Status of Solid Waste Management in
the World Cities (2010) by UN-Habitat and Global Waste
Management Outlook (2015) by UN Environment.
These reports include solid waste data such as total
waste generation, collection coverage and percentage of
waste by treatment and disposal types, which have been
collected in 39 cities.
6.2 Time series:
The indicator can be updated annually or biennially
depending on the data source stated above.
7. Data collection and data release calendar
The data can be released annually, and the monitoring of
the indicator can be repeated at annual intervals, allowing
for several (15) reporting points until the year 2030. The
initial data is planned for release at the city level in April
2018. Thereafter annual releases of data will be undertaken
every month of April.
Treatment facility name
Degree of control score
Process employed
Type of waste
Amount of solid waste
received
Amount of sewage
sludge
Amount of residue
Where residue is exported
(1)
(t) (t) (t)(2)
(3)
(1)
(t) (t) (t)(2)
(3)
Survey Sheet Example for Recycling and Treatment Facilities
Landfill sites name
Landfill type Operation start yearDegree of
control scoreAmount of MSW
receivedAmount of sewage
sludge received
(1)
(t) (t)(2)
(3)
(1)
(t) (t)(2)
(3)
Survey Sheet Example for Disposal Facilities

Metadata on SDG Indicator 11.6.1
Page 9
8. Data compilers
Name: UN-Habitat, National statistical agencies and city
management teams.
National statistical agencies and city management teams
will lead the compilation and reporting at the national
level. Global and regional reporting will be done by UN-
Habitat. The collection of the data is possible through the
collaboration of international institutions (UN-Habitat, UN
Environment, The World Bank, AfDB, IDB, EBRD and ADB)
and bilateral donors (JICA, GDZ, etc.). Conducting surveys
and capacity development on data collection systems will
be required.
9. Indicator revision suggestion based on the Expert Group Meeting
In January 2017, UN Habitat organized an expert group
meeting for the indicator 11.6.1 refinement inviting waste
management experts worldwide. As a result, the revision
of terminology both in the target and indicator was
proposed as follows:
1. Change of the terminology from ‘urban solid waste’ to ‘municipal solid waste’ in the indicator
In the EGM held on January 2017, many experts expressed
that the monitoring scope should focus on ‘municipal
solid waste’ because this has clear and internationally
agreed definition both theoretically and practically. On the
other hand, there is no internationally agreed definition
for ‘urban solid waste’ and this will invite confusion in
the monitoring at the city and country level. From the
point of practicality of monitoring implementation, it was
suggested that focusing on the clearly defined concept is
important.
The other indicator 12.4.2 already addresses solid waste
other than municipal solid waste such as hazardous and
industrial waste, therefore:
2. Change of the terminology from ‘discharge’ to ‘treatment and disposal’ in the indicator
Many experts agreed ‘discharge’ is a terminology in the
wastewater treatment field, hence should be changed to
‘treatment and disposal’ to clearly capture the solid waste
management issues.
Polluted water and a small garbage dump in Mumbai, India © picdn.net.
Metadata on SDG Indicator 11.6.1
Page 10
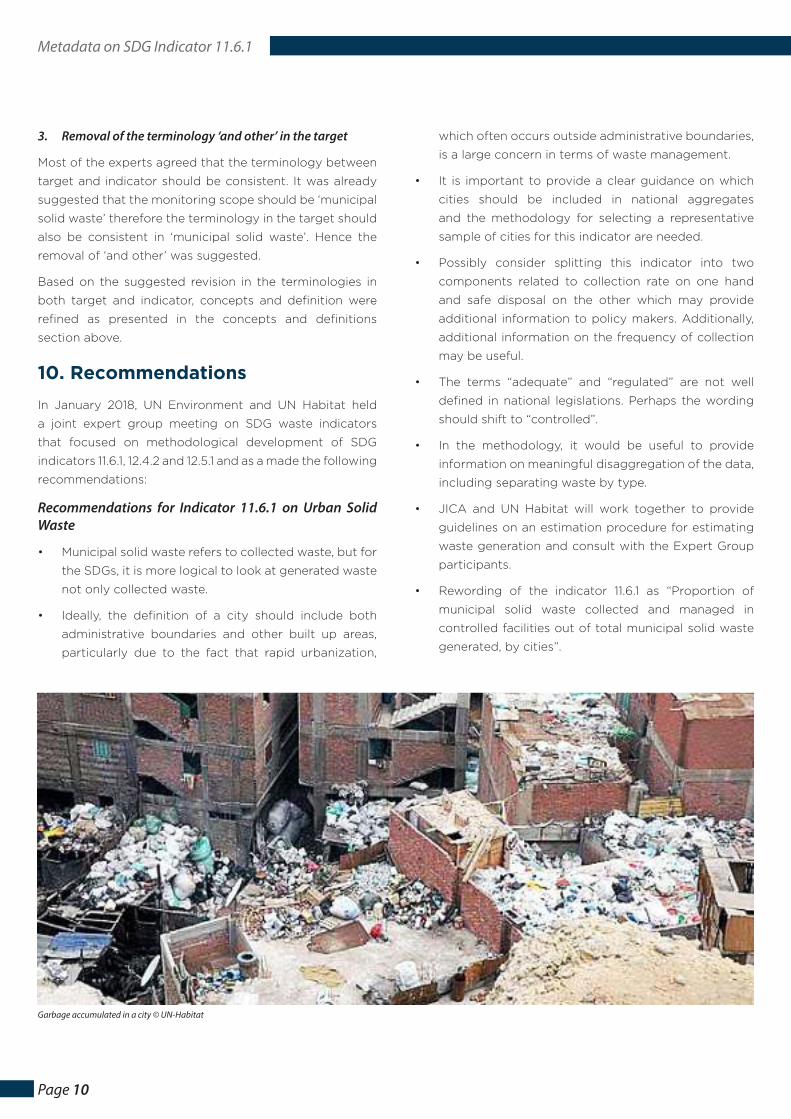
Garbage accumulated in a city © UN-Habitat
3. Removal of the terminology ‘and other’ in the target
Most of the experts agreed that the terminology between
target and indicator should be consistent. It was already
suggested that the monitoring scope should be ‘municipal
solid waste’ therefore the terminology in the target should
also be consistent in ‘municipal solid waste’. Hence the
removal of ‘and other’ was suggested.
Based on the suggested revision in the terminologies in
both target and indicator, concepts and definition were
refined as presented in the concepts and definitions
section above.
10. Recommendations
In January 2018, UN Environment and UN Habitat held
a joint expert group meeting on SDG waste indicators
that focused on methodological development of SDG
indicators 11.6.1, 12.4.2 and 12.5.1 and as a made the following
recommendations:
Recommendations for Indicator 11.6.1 on Urban Solid Waste
• Municipal solid waste refers to collected waste, but for
the SDGs, it is more logical to look at generated waste
not only collected waste.
• Ideally, the definition of a city should include both
administrative boundaries and other built up areas,
particularly due to the fact that rapid urbanization,
which often occurs outside administrative boundaries,
is a large concern in terms of waste management.
• It is important to provide a clear guidance on which
cities should be included in national aggregates
and the methodology for selecting a representative
sample of cities for this indicator are needed.
• Possibly consider splitting this indicator into two
components related to collection rate on one hand
and safe disposal on the other which may provide
additional information to policy makers. Additionally,
additional information on the frequency of collection
may be useful.
• The terms “adequate” and “regulated” are not well
defined in national legislations. Perhaps the wording
should shift to “controlled”.
• In the methodology, it would be useful to provide
information on meaningful disaggregation of the data,
including separating waste by type.
• JICA and UN Habitat will work together to provide
guidelines on an estimation procedure for estimating
waste generation and consult with the Expert Group
participants.
• Rewording of the indicator 11.6.1 as “Proportion of
municipal solid waste collected and managed in
controlled facilities out of total municipal solid waste
generated, by cities”.

Metadata on SDG Indicator 11.6.1
Page 11
Recommendations for the 3 indicators (11.6.1, 12.4.2 and 12.5.1)
1. Harmonization and comparability
• Harmonization in the measuring approach for 11.6.1 on
urban solid waste, 12.4.2 on hazardous waste and 12.5.1
on recycling. Additionally, the indicators should also
be considered in the broader context of the SDGs in
terms of using harmonized language and definitions to
the extent possible. It was agreed to exclude mineral
wastes from all denominators.
• All indicators should provide a phased approach
which will provide guidance for countries and cities
with little expertise in monitoring waste to start
developing a waste monitoring system, while at the
same time providing guidance for those wishing to
move up the ladder in terms of improving existing
waste monitoring systems.
• The importance of maintaining a consistent time
series for the purpose of analysis must be considered
and mitigated when introducing methodological
improvements.
2. Calculating generated waste and filling data gaps
• For all three waste indicators, the denominator should
be based on waste generated, where ‘generated’ is
defined not by collection but by an estimate of how
much waste is produced during the time frame being
considered.
• UN Habitat and OECD each have definitions but
none are true reflections of municipal boundaries
in the context of waste management and thus this
area needs more work. Additionally, city data for all
indicators would massively increase the reporting
burden thus there is a need to consider either just
national data or using the national sample of cities
approach developed by UN Habitat.
• The global reporting for all three indicators should
include country and city data which is supplemented
by modeled or estimated data. The methodology
should provide transparent guidance for countries on
estimation methodologies. Additionally, it is beneficial
to utilize academic and other experts to fill data gaps
with estimates.
• A material flow approach was recommended as a
method for capturing waste generation, waste flows
and circular economy in a single statistical framework.
The material flow account would also provide benefits
in terms of linking the waste related indicators to
the other SDG indicators on domestic material
consumption (under SDG target 8.4 and 12.2).
Irregular garbage collection in a city © tribuneindia.com

Metadata on SDG Indicator 11.6.1
Page 12
11. References
1. UN-Habitat (2009) Urban Indicators Guidelines,
Monitoring the Habitat Agenda and the Millennium
Development Goals-Slums Target. United Nations
Human Settlements Programme, Nairobi.
2. UN-Habitat, (2010) Collection of Municipal Solid
Waste in Developing Countries. United Nations Hu-
man Settlements Programme Nairobi.
3. United Nations (1997). Glossary of Environment Sta-
tistics, Studies in Methods, Series F, No. 67, New York.
4. World Bank (2012). What a Waste: A Global Review
of Solid Waste Management. Urban Development
Series Knowledge Papers.
5. World Bank, Urban Solid Waste Management Glos-
sary http://web.worldbank.org/WBSITE/EXTERNAL/
TOPICS/EXTURBANDEVELOPMENT/EXTUSWM/0,,-
contentMDK:20241717~pagePK:148956~piP-
K:216618~theSitePK:463841,00.html#m Accessed on
30 May 2016
6. UN-Habitat (2010). Solid Waste management in the
World Cities Water and Sanitation in the World’s Cit-
ies 2010, Earthscan, London, ISBN 978-1-84971-169-2
http://mirror.unhabitat.org/pmss/listItemDetails.aspx-
?publicationID=2918 Accessed on 30 May 2016
7. US EPA (1992). Decision-Makers Guide to Solid Waste
Management. Report No. 530-R-95-023, Second Edi-
tion, Office of Solid Waste and Emergency Response,
US Environmental Protection Agency.
8. United Nations Sustainable Development Knowledge
Platformhttp://Www.Un.Org/Esa/Sustdev/Natlinfo/
Indicators/Methodology_Sheets/Consumption_Pro-
duction/Waste_Treatment_Disposal.Pdf, Accessed on
30 May 2016
9. United Nations Country Classification http://www.
un.org/en/development/desa/policy/wesp/wesp_cur-
rent/2014wesp_country_classification.pdf Accessed
on 31 May 2016
10. International Solid Waste Management Association
(2015) Roadmap to Closing Waste Dumpsites The
World’s Most Polluted Places
11. http://www.iswa.org/fileadmin/galleries/About%20
ISWA/ISWA_Roadmap_Report.pdf Accessed on 26
November, 2016
12. Wilson et al-Wasteaware ISWM indicators -
doi10.1016j.wasman.2014.10.006 - January 2015
13. Wilson_et_al_Supplementary_information_
Wasteaware_ISWM_Benchmark_Indicators_User_
Manual_Online
14. United Nations Statistics Division, UNSD Environmen-
tal Indicators, https://unstats.un.org/unsd/envstats/
qindicators (Accessed on 9 April 2018)
15. United Nations Statistics Division, Questionnaire on
Environment Statistics, https://unstats.un.org/unsd/
envstats/questionnaire (Accessed on 9 April 2018)
12. Related indicators
6.3.1: Proportion of wastewater safely treated
12.3:Global food loss index
12.4.2: Hazardous waste generated per capita and
proportion of hazardous waste treated and by type of
treatment
12.5.1: National recycling rate

Metadata on SDG Indicator 11.6.1
Page 13
United nations human settlements program
P.O. Box, 30030, Nairobi, 00100 Kenya.
For any inquiry, kindly contact
Robert Ndugwa: [email protected]
Chief, Global Urban Observatory Unit
Research and Capacity Development Branch
UN-Habitat
www.unhabitat.org