Metabolomics relative quantitation with mass spectrometry
18
Spectroscopy 22 (2008) 327–343 327 DOI 10.3233/SPE-2008-0361 IOS Press Metabolomics relative quantitation with mass spectrometry using chemical derivatization and isotope labeling Grace O’Maille a,∗ , Eden P. Go a,∗ , Linh Hoang a , Elizabeth J. Want a , Colin Smith a , Paul O’Maille b , Anders Nordström a , Hirotoshi Morita a , Chuan Qin a , Wilasinee Uritboonthai a , Junefredo Apon a , Richard Moore c , James Garrett c and Gary Siuzdak a,∗∗ a The Center for Mass Spectrometry and Department of Molecular Biology, The Scripps Research Institute, La Jolla, CA 92037, USA b Jack H. Skirball Center for Chemical Biology and Proteomics, The Salk Institute for Biological Studies, La Jolla, CA 92037, USA c Becton Dickinson, Sparks, MD 21152, USA Abstract. Comprehensive detection and quantitation of metabolites from a biological source constitute the major challenges of current metabolomics research. Two chemical derivatization methodologies, butylation and amination, were applied to human serum for ionization enhancement of a broad spectrum of metabolite classes, including steroids and amino acids. LC-ESI-MS analysis of the derivatized serum samples provided a significant signal elevation across the total ion chromatogram to over a 100-fold increase in ionization efficiency. It was also demonstrated that derivatization combined with isotopically labeled reagents facilitated the relative quantitation of derivatized metabolites from individual as well as pooled samples. Keywords: Metabolomics, human plasma, isotope labeling, quantitation, mass spectrometry 1. Introduction The challenge of generating a global metabolite profile for discerning biochemical pathways, interac- tions or identifying markers [1–8] comes from the diversity of endogenous metabolites. Unlike proteins and nucleic acids, metabolites include a plethora of molecular species such as simple amino acids, nu- cleic acids, steroids, carbohydrates and lipids, of which some are difficult to analyze with current electro- spray ionization mass spectrometry methods [9]. Among the requirements for a comprehensive profiling approach is that it should impose little analyte discrimination and allow for quantitative analysis, both of which are currently impossible to achieve. For example, gas chromatography mass spectrometry (GC- MS) is still the most extensively used for metabolite profiling [10–12], yet is limited to nonpolar and volatile molecules. A partial solution to this limitation is the use of chemical derivatization prior to GC-MS analysis [13]. Standard GC-MS derivatization schemes often involve the replacement of labile * These authors contributed equally to this work. ** Corresponding author: E-mail: [email protected]. 0712-4813/08/$17.00 © 2008 – IOS Press and the authors. All rights reserved
Transcript of Metabolomics relative quantitation with mass spectrometry

Spectroscopy 22 (2008) 327–343 327DOI 10.3233/SPE-2008-0361IOS Press
Metabolomics relative quantitation with massspectrometry using chemical derivatizationand isotope labeling
Grace O’Maille a,∗, Eden P. Goa,∗, Linh Hoang a, Elizabeth J. Want a, Colin Smith a,Paul O’Maille b, Anders Nordström a, Hirotoshi Morita a, Chuan Qin a,Wilasinee Uritboonthai a, Junefredo Apon a, Richard Moore c,James Garrett c and Gary Siuzdak a,∗∗
a The Center for Mass Spectrometry and Department of Molecular Biology, The Scripps ResearchInstitute, La Jolla, CA 92037, USAb Jack H. Skirball Center for Chemical Biology and Proteomics, The Salk Institutefor Biological Studies, La Jolla, CA 92037, USAc Becton Dickinson, Sparks, MD 21152, USA
Abstract. Comprehensive detection and quantitation of metabolites from a biological source constitute the major challenges ofcurrent metabolomics research. Two chemical derivatization methodologies, butylation and amination, were applied to humanserum for ionization enhancement of a broad spectrum of metabolite classes, including steroids and amino acids. LC-ESI-MSanalysis of the derivatized serum samples provided a significant signal elevation across the total ion chromatogram to overa 100-fold increase in ionization efficiency. It was also demonstrated that derivatization combined with isotopically labeledreagents facilitated the relative quantitation of derivatized metabolites from individual as well as pooled samples.
Keywords: Metabolomics, human plasma, isotope labeling, quantitation, mass spectrometry
1. Introduction
The challenge of generating a global metabolite profile for discerning biochemical pathways, interac-tions or identifying markers [1–8] comes from the diversity of endogenous metabolites. Unlike proteinsand nucleic acids, metabolites include a plethora of molecular species such as simple amino acids, nu-cleic acids, steroids, carbohydrates and lipids, of which some are difficult to analyze with current electro-spray ionization mass spectrometry methods [9]. Among the requirements for a comprehensive profilingapproach is that it should impose little analyte discrimination and allow for quantitative analysis, both ofwhich are currently impossible to achieve. For example, gas chromatography mass spectrometry (GC-MS) is still the most extensively used for metabolite profiling [10–12], yet is limited to nonpolar andvolatile molecules. A partial solution to this limitation is the use of chemical derivatization prior toGC-MS analysis [13]. Standard GC-MS derivatization schemes often involve the replacement of labile
*These authors contributed equally to this work.**Corresponding author: E-mail: [email protected].
0712-4813/08/$17.00 © 2008 – IOS Press and the authors. All rights reserved

328 G. O’Maille et al. / Metabolomics relative quantitation with mass spectrometry
hydrogens with trimethylsilyl (TMS) groups, introducing an additional 72 Da for each hydrogen re-placed. Unfortunately, the respective increase in mass through derivatization often places the modifiedmolecule above the typical range useful for GC-MS [14], therefore, limiting the utility of GC-MS forendogenous metabolite profiling.
Liquid chromatography electrospray ionization mass spectrometry (LC-ESI-MS) offers a viable alter-native to GC-MS for both polar and higher molecular weight metabolites [15]. LC-ESI-MS for metabo-lite profiling investigations was initially explored by Tolstikov and Fiehn [16], and further investigatedwith micro-LC-ESI-MS [6,16–19], nano-ESI-MS [5,20–22], UPLC ESI-MS (ultra high pressure liquidchromatography) [23,24], as well as ESI alone with direct infusion [25–27]. However, a wide range ofnonpolar compounds, compounds with only weakly acidic or basic groups and a wide range of naturalcompounds such as terpenes, sugars, alcohols, aromatic compounds and vitamins, which are not de-tected without derivatization or display poor sensitivity with ESI [28–30]. To address this shortcoming,several strategies for chemical derivatization of analytes prior to ESI-MS to improve the sensitivity ofanalytes have been developed by a number of research groups [28–45]. Recently, the use of chemicalderivatization with isotope labeling has been reported to measure the quantitative metabolite differencesbetween metabolome samples [43,45].
The rationale for implementing derivatization as part of an LC-ESI-MS metabolomics effort is to en-able more comprehensive coverage of the metabolome. Another important aspect of a metabolomicsinvestigation is to be able to perform relative metabolite quantitation between the different sets of sam-ples investigated. A simple approach presented by Wang et al. demonstrated that without the use ofisotopic labeling or spiked standards, single value normalization and counting generated a median coef-ficient of variation of 23.8% [22]. In another study, analytical reproducibility from 2 to 12% for selectedmetabolites was achieved by Fiehn et al. through the addition of stable isotope labeled standards prior toanalysis [11]. The same approach was also used by Jonsson et al. for normalization of raw data in order tocompensate for differences in recovery and injection volumes [46]. While stable isotope techniques haveproven to be reliable, they suffer from the requirement of a labeled standard. Additionally, stable isotopestandards are very expensive, imposing further constraints on this approach. An alternative approach isto employ relative quantitation as developed by Mashego et al. [47] in monitoring the metabolite levelchanges in yeast. In their study, cells were grown in 13C labeled media, thereby obtaining a stable iso-tope labeled metabolome to which an aliquot could be added, and co-extracted with yeast cells grownin 12C media. With this strategy, stable isotope labeled analogues of 80% of the glycolytic metaboliteswere observed. Similar strategies have been employed in subsequent studies with yeast [48,49] and plantcell culture [50].
While growing the system in labeled media is perhaps one of the best approaches to monitor metabolicchanges, unfortunately, it is not always possible. For quantitative proteomics, the use of isotope-codedaffinity tags (ICAT) [51] has gained popularity. The ICAT approach involves labeling one of the twosamples with an affinity tagged molecule and the other sample with a stable isotope labeled analogue ofthe same tag. The samples are subsequently pooled and subject to proteolysis and affinity purificationbefore LC-ESI-MS/MS analysis. The relative intensity of any labeled peptide to its stable isotope labeledcounterpart will reveal the relative concentration of the particular protein.
In this manuscript, we present the development and application of derivatization with unlabeled andstable isotope labeled reagents for LC-ESI-MS analysis of human plasma metabolite extracts. Amongthe objectives are: (1) to broaden the detection of metabolites through the use of derivatization, therebyenhancing the predictive capacity of the data [38], and (2) to relatively quantitate without the addition ofstable isotope labeled standards [39,40].

G. O’Maille et al. / Metabolomics relative quantitation with mass spectrometry 329
Since carboxylic and hydroxyl groups are common functional groups in metabolites, we chose toproceed with two well established derivatization procedures, namely butylation [42] for carboxyl groupsand amination [44] for hydroxyl groups, in this proof of concept study. To achieve relative quantitation,isotopically labeled forms of the reagents were synthesized. This derivatization strategy was also appliedto the metabolomics study of a set of clinical samples of sepsis, which is one of the leading causes ofdeath in the intensive care unit [52]. The LC-ESI-MS data of plasma obtained from patients with sepsiswere compared to the data of a control set of plasma obtained from patients with systemic inflammatoryresponse syndrome (SIRS) [52–54]. The LC-ESI-MS data were obtained for underivatized as well asderivatized plasma metabolites, and were subsequently analyzed by XCMS, an in-house LC-MS dataanalysis software for non-linear retention time correction and alignment of LC-ESI-MS data [55].
2. Experimental section
2.1. Reagents and chemicals
Phenylalanine, citrulline, oxidized glutathione, cholesterol, succinic anhydride, dimethylaminoetha-nol, 1,1′-carbonyldiimidazole, and butanol were obtained from Sigma Chemical Company (St. Louis,MO, USA). 13C4 labeled succinic acid and D9 labeled butanol were purchased from Cambridge IsotopeLaboratories, Inc. (Andover, MA, USA). All solvents for the LC-ESI-MS studies were HPLC grade(J.T. Baker, Phillipsburg, NJ, USA). All other solvents were Optima grade from Fisher Scientific (LosAngeles, CA, USA).
2.2. Human serum and plasma samples
Human serum (male, H-1388) purchased from Sigma Chemical Company (St. Louis, MO, USA) wasused for method development and ionization enhancement studies. For clinical analysis, human plasmacollected from intensive care unit patients diagnosed with sepsis (n = 27) and Systemic InflammatoryResponse Syndrome (SIRS) (n = 34) were assayed. Detailed information about the gender, age, race,admission cause, medical history, and current medical conditions as well as current medications werecollected. Plasma samples used in the current study were collected on the day of diagnosis of the sepsisor SIRS disease state and stored at −80◦C until analysis. Metabolite extraction, derivatization and LC-ESI-MS analysis for plasma samples were performed consecutively. The total time from the point ofmetabolite extraction to obtaining XCMS analyzed LC-ESI-MS data for each sample was about 8 h.Additional details for each procedure are provided in the following sections.
2.3. Serum/plasma metabolite extraction
A methanol protein precipitation extraction, as described by Want et al. [19], was used for all serumand plasma metabolite extractions. The procedure described here has been tested and was found suitablefor both serum and plasma preparations; no significant differences were observed. Briefly, 100 µl ofice-cold methanol was added to a starting volume of 50 µl serum or plasma. The mixture was vortexedimmediately for 20 s and incubated at −20◦C for 20 min, followed by centrifugation at 12,000 rpm(13,400×g) for 10 min. The supernatant was retained and dried in a SpeedVac. The dried serum/plasmametabolite extract was reconstituted in 50 µl H2O/acetonitrile (95/5, v/v) prior to LC-ESI-MS analy-sis. The same sample extraction method described here was used for the preparation of underivatized

330 G. O’Maille et al. / Metabolomics relative quantitation with mass spectrometry
serum/plasma. For derivatized samples, dried serum/plasma metabolite extracts were further derivatizedwith the respective reagents as described below.
2.4. Synthesis of amination reagent
The amination reagent used in this study was adapted from the work of Johnson et al. [44]. Thesynthesis of the amination reagent was slightly modified. Succinic anhydride (1.0 mmol) and dimethy-laminoethanol (1.2 mmol) were mixed and refluxed in 20 ml acetone for 2.5 h. The resulting reac-tion mixture was then cooled to room temperature and filtered. The white precipitate was washed threetimes with 20 ml of cold acetone and subsequently dried to give monodimethylaminoethylsuccinate(MDMAES). MDMAES was found to be stable for up to 3 months when stored under refrigeration (at∼4◦C) and away from light and moisture. The final amination reagent was prepared by first mixingMDMAES (0.1 mmol) and 1,1′-carbonyldiimidazole (0.1 mmol) in dichloromethane (0.2 ml) in a glasscontainer and vortexed for 10 s at 2 min intervals until all solids were dissolved. An additional 0.8 ml ofdichloromethane was then added to prepare a 100 mM solution of the amination reagent [44]. The finalamination reagent must be kept away from moisture since it is highly reactive. Therefore, this reagentmust be made fresh daily by mixing MDMAES and 1,1′-carbonyldiimidazole prior to use. NMR andhigh accuracy ESI-TOF mass spectral data analysis were performed to confirm the chemical structuresof MDMAES and the amination reagent.
2.5. Synthesis of isotopically labeled amination reagent
In order to prepare the isotopically labeled amination reagent, 13C4 labeled succinic anhydride wasused as a starting material and then follow the amination reagent synthesis described above. The syn-thesis of the 13C4 labeled succinic anhydride was adapted from the work of Zhang and Regnier [56].Briefly, acetyl chloride and 13C4 labeled succinic acid were mixed at a molar ratio of 300 to 1 and re-fluxed for 1.5 h. The clear solution was cooled and kept at 0◦C overnight. The crystals formed werecollected and washed with ethyl ether and dried under vacuum to give 13C4 labeled succinic anhydride.The 13C4 labeled MDMAES and subsequently 13C4 labeled amination reagent were synthesized usingthe 13C4 labeled succinic anhydride. NMR and high accuracy ESI-TOF mass spectral data analysis wereperformed to confirm the chemical structures and mass of the resulting 13C4 labeled amination reagent.
2.6. Amination derivatization procedure
A 100 µl volume of a freshly prepared 100 mM amination reagent solution was added to each ofthe dried serum/plasma metabolite extract in a glass vial with a Teflon-lined cap. The vial was tightlycapped and sonicated for 1 min prior to incubation at 65◦C for 4 h. After incubation, the residual solventwas dried in a SpeedVac. The aminated metabolite residue was reconstituted in 50 µl H2O/acetonitrile(95/5, v/v) and sonicated for 1 min prior to LC-ESI-MS analysis. For isotopically labeled derivatizationof human serum/plasma, a 13C4 labeled amination reagent solution was used.
2.7. Butylation derivatization procedure
The butylation reagent solution was prepared by mixing butanol and concentrated HCl in 3–1 ratio(v/v). A 100 µl volume of the butylation reagent solution was added to each of the dried serum/plasma

G. O’Maille et al. / Metabolomics relative quantitation with mass spectrometry 331
metabolite extract [42]. The reaction vial was tightly capped and vortexed for 30 s, followed by incuba-tion at 65◦C for 4 h [57]. The reaction mixture was then dried in a SpeedVac. The butylated metaboliteresidue was reconstituted in 50 µl H2O/acetonitrile (95/5, v/v) and sonicated for 1 min prior to LC-ESI-MS analysis. For isotopically labeled butylation of human serum/plasma, deuterated (D9) butanol wasused.
2.8. Chromatography and MS data acquisition
Reverse phase (RP) chromatography and mass detection of the serum metabolite extracts was per-formed on an Agilent 1100 LC/MSD SL system. Due to possible ionization drifts of the electrospray,each extracted sample was analyzed in triplicate, where the three injections were arranged in a randomorder among the run list of other serum/plasma samples to assess re-injection reproducibility. Addition-ally, a blank sample (consisted of the injection of 10 µl methanol) was placed between each serum/plasmasample in the run sequence to minimize potential carry-over. For each study sample run, 10 µl of serummetabolite extract was injected onto a C18 column (Symmetry® Column, 2.1×100 mm, 3.5 µm; Waters,Milford, MA, USA) and eluted at a flow rate of 250 µl/min under gradient conditions of 5% B to 90% Bover 60 min. Mobile phase A consisted of water/acetonitrile/formic acid (95/5/0.1 (v/v/v)), and B con-sisted of acetonitrile/formic acid (100/0.1 (v/v)). Mass spectral data from 100–1000 m/z were collectedin the positive ionization mode.
In order to minimize the contamination of the C18 column during the chromatographic separationof aminated samples, two additional steps were employed: (1) a 10-min holding at 5% B was addedat the beginning of the gradient. (2) A precolumn and column switching step was added. All aminatedsamples were initially loaded onto a precolumn (Zorbax SB-C18, Rapid Resolution Cartridge Column,2.1 × 30 mm, 3.5 µm; Agilent Technologies, Palo Alto, CA, USA). During the initial 10-min holding at5% B, the solvent flow after the precolumn was directed to waste to flush out the amination reagent. Atthe 10-min time point of the gradient, a column switching procedure was activated so that the solventflow from the precolumn was directed to the C18 separation column.
The sample throughput was about 14–16 samples per day for a 60- to 70-min LC separation and a20-min blank sample run between sample injections. For each plasma sample derivatization procedure,the time between the collection of plasma to the complete acquisition of the LC-ESI-MS data was esti-mated to be about 10 h.
MS/MS fragmentation data for selected ions of interest were acquired using the data dependentMS/MS functionality of the MicroMass Q-TOF Micro instrument (Waters, Millford, MA). For eachprecursor ion selected, collision energy ranging from 25 to 45 eV was applied to achieve the optimalfragmentation pattern.
2.9. LC-ESI-MS data analysis
All LC-ESI-MS data were processed using XCMS [55], an open source software (http://metlin.scripps.edu/download) for metabolomics studies. The name XCMS originated from the design of a software ca-pable of analyzing data from multiple types of chromatographically (GC and LC) separated samplesgiving the XC part of the name, and the MS part of the name originated from mass spectrometry data.XCMS was used to perform peak picking, peak integration, non-linear retention time correction andmatching of peaks between samples. These XCMS functionalities were designed to compare the same

332 G. O’Maille et al. / Metabolomics relative quantitation with mass spectrometry
components (defined as “metabolite features”, or simply “features”, with a unique set of m/z and reten-tion time values) in all samples despite any retention time shifts. A data table and an EIC (extracted ionchromatogram) folder were generated for each XCMS analysis.
Each XCMS generated data table consisted of column headings showing m/z, retention time, andsample names (for displaying the intensity area values for each feature in all samples) where values cor-responding to each heading were displayed in consecutive rows. A typical XCMS data table generatedfrom the LC-ESI-MS analysis of underivatized human serum metabolite extract consisted of 2000 rows,which corresponded to the detection of 2000 metabolite features, with each feature representing a uniqueset of m/z and retention time. In a previous study, Want and colleagues collected LC-ESI-MS data fromhuman plasma metabolites extracted using various organic solvents and acids [19]. The LC-ESI-MSdata analyzed by XCMS were presented in table formats in the supporting material of that manuscript.In the previous study [19] as well as in the current study, isotopic ions, adducts and fragments as wellas multiple peaks arising from multiple charged ions were treated as separate metabolite features; there-fore, we noted that one molecular species may give rise to multiple features. For the purpose of furtherevaluations, the XCMS data tables were generated in tab-delimited format and the data were exportedto other statistical software of choice. The statistical analysis section described in the following sectionmade use of these metabolite features data output in the XCMS data tables.
In addition to the data table, a second XCMS generated output consisted of a folder containing imagesof superimposed aligned EICs (extracted ion chromatograms) of individual features shown as intensityversus retention time plots. This visual presentation enabled the examination of individual feature peakshape as well as a visual examination and comparison of the peak heights of the same metabolite featuredetected in various samples. Additionally, different colors were manually assigned by the user to denotespecific groups or sets of samples to be compared, which greatly enhanced the effectiveness of themanual analysis.
2.10. Statistical analysis
Due to the large number of metabolite features from the large number of samples detected by LC-ESI-MS and captured by XCMS, further statistical analyses were performed by exporting the XCMSdata table outputs into MATLAB for more effective evaluation of the data from the clinical samples. TheXCMS outputs consisted of the m/z, retention time and peak intensity areas for all metabolite featuresdetected in each sample. Due to the XCMS retention time correction function, the metabolite featureswith the same m/z eluted at the same retention time can be compared between samples.
3. Results and discussion
3.1. Enhancement of ionization efficiency
One of the goals of this study was to expand the utility of LC-ESI-MS to non-targeted globalmetabolomics studies by detecting low abundance and poorly ionizable metabolites. These objectiveswere accomplished through chemical derivatization of human serum metabolites by employing deriva-tization techniques, namely amination [44] and butylation [42].
Results of the LC-ESI-MS experiments clearly showed that both derivatization procedures increasedthe number of components, as observed by the marked increase of chromatographic peaks in the to-tal ion chromatograms (TIC). Representative TIC of the underivatized, aminated and butylated serum

G. O’Maille et al. / Metabolomics relative quantitation with mass spectrometry 333
Fig. 1. Amination derivatization. Total ion chromatograms of underivatized and aminated human serum metabolites are shown(upper left and right). The asterisk denotes where the aminated cholesterol eluted. Cholesterol is undetected and unknown inunderivatized preparations. The corresponding MS/MS spectrum of the aminated cholesterol shown at the lower right corneroffers identification of the signature 189 Da neutral loss, which is indicative of an amination reagent conjugate. The 3D plot(lower left) shows the increase in intensity of all metabolite features arising from the amination as detected by XCMS.
metabolites were compared in parallel as shown in Figs 1 and 2. Derivatization through amination intro-duced a covalently bound positively charged tertiary amine group to the derivatized compounds, whichenhanced ionization efficiency either in solution or during the ESI process, and enabled detection. Toverify whether the amination procedure was successful, MS/MS analysis was performed on the peakthat eluted at 41 min. This peak, indicated by an asterisk symbol in Fig. 1, corresponded to the aminatedcholesterol with m/z 558. Fragmentation data of this peak showed a neutral loss of 189 Da, giving theprominent product ion at m/z 369, which corresponded to the loss of a neutral acid at the ester linkageconjugating the amination tag to cholesterol [44] at the C-3 position (Fig. 1).
In addition to the detection of aminated cholesterol, aminated phospholipid ions were identified, andthese were detected as the prominent peaks eluting between 10 and 15 min of the aminated TIC in(Fig. 1). For example, the underivatized phospholipid with m/z 496 (lysophosphatidyl choline with a16-carbon fatty acid chain [19,38]), typically eluting at 30 min, was detected at m/z 668 in its aminatedform, eluting at 16 min in the aminated sample. In the case of the 16-carbon phospholipid, the hydroxyl

334 G. O’Maille et al. / Metabolomics relative quantitation with mass spectrometry
Fig. 2. Butylation derivatization. Total ion chromatograms of underivatized and butylated human serum metabolites are shown(upper left and right). The asterisk denotes where the butylated phenylalanine eluted and the corresponding MS/MS spectrumis also displayed (lower right). The 3D plot (lower left) shows the increase in intensity of all metabolite features arising frombutylation as detected by XCMS.
group on the glycerol backbone was aminated, resulting in the aminated phospholipid with an increase ofm/z 172 corresponding to the amination tag conjugated through an ester linkage. Due to the incompleteamination, multiple ion peaks were detected consisting of the underivatized and aminated phospholipidions.
An enhanced detection of metabolites was also observed in the butylated sample, where negativelycharged carboxylic acids were derivatized to form neutral butyl esters. The enhanced detection uponbutylation occurred mainly in the early eluting region (1–15 min) of the reversed phase LC-ESI-MSrun (Fig. 2). This suggested an increase in the detectable fraction of polar metabolites, supporting theobservation that the derivative of phenylalanine eluted in the early segment of the run. MS/MS data(obtained through separate set up using a MicroMass Q-TOF MS instrument) further confirmed thebutylated phenylalanine product (m/z 222) [42] with fragment ions at m/z of 166 and 120 (Fig. 2).In summary, chemical derivatization allowed for the detection of aminated cholesterol and butylatedphenylalanine, whereas their underivatized forms were not detectable.

G. O’Maille et al. / Metabolomics relative quantitation with mass spectrometry 335
3.2. Validation and optimization of derivatization
Butylation and amination reaction conditions were studied to determine suitable incubation temper-ature and time duration. Using plasma samples spiked with known additional cholesterol (0.10, 0.50,1.0, 2.0 and 5.0 mM) and phenylalanine (0.10, 1.0, 5.0, 10, 50 and 100 µM) as quality controls for am-ination and butylation, respectively, the rate of formation of the derivatized products was monitored at65◦C for 1, 10 and 30 min as well as 1, 2, 4, 12, 24 and 48 h. Shorter incubation periods (i.e., <4 h)resulted in lower peak intensity of derivatized product ion. While, incubation duration at extended peri-ods such as 12 h or longer were found to be undesirable since the degradation of many major productswas observed; additionally, derivatization reproducibility also decreased resulting in high %CV valuesof >40%. It was determined that the incubation time duration of 4 h at 65◦C was most suitable forboth derivatization reactions, with butylation reaction >95% complete for phenylalanine, and the ami-nation reaction >90% complete for cholesterol. By examining the peak intensity areas generated usingXCMS, the derivatization reproducibility (n = 5) between preparations was found to be similar to there-injection reproducibility (n = 3); the overall %CV was ∼25%.
With amination, reaction solvent systems consisting of acetonitrile, acetone, chloroform, dichlorome-thane, DMSO and DMF as well as solvent mixtures were explored. Results showed that the aminationreaction efficiency and reproducibility was most suitable when dichloromethane was used, giving thebest amination reaction reproducibility. Three quality control serum/plasma extract samples: water, 3MHCl, and dichloromethane were incubated under the same reaction conditions. Additionally, controlblank samples containing only the respective derivatization reagents were also prepared and incubatedunder the same reaction conditions. Changes in the detected LC-ESI-MS XCMS metabolite feature listwere examined to ensure that the derivatization products were not resulted from the breakdown of thereagent, solvent impurity reactions, acid hydrolysis alone, or from elevated temperature alone.
Since the derivatization efficiencies of these derivatization agents have been previously studied, thefocus of the current work was to ensure suitable derivatization conditions for metabolomics applicationswere used, as well as acceptable derivatization reproducibility, derivatized product stability, and re-injection reproducibility of the derivatization method. From our experience in LC-ESI-MS analysis ofunderivatized human plasma extracts, run to run (including both intra-day and inter-day) variability inpeak intensity areas is typically ∼25%. We found that with the addition of the derivatization procedure,the inter-assay variability in peak intensity area count remained within 25% variability, indicating thatthe derivatization methods were highly reproducible.
3.3. Derivatized metabolite analysis of control human plasma
To further examine the effects of derivatization, XCMS data tables were generated by comparing LC-ESI-MS data from underivatized and derivatized samples (see Section 2 for details). Comparison of theLC-ESI-MS data before and after derivatization revealed an increase in the number of detected features:from ∼2000 to ∼5000 for each of the amination and butylation derivatization procedures. It should benoted that the number of metabolite features does not directly correspond to the number of metabo-lites, since isotopic, adduct, fragment, and multiple charged ions were all considered separate features inXCMS analyses. In addition, it is also known that derivatization reactions inherently introduce complex-ity to the sample mixtures; for example, the amination reagent reacts with other nucleophiles includingthiol and amine groups. Some ions contain both ionizable group(s) as well as targeted derivatizationfunctional group(s); when the derivatization is not 100% complete, such ions were detected in the un-derivatized sample as well as in the derivatized sample giving rise to multiple ion peaks, an example is

336 G. O’Maille et al. / Metabolomics relative quantitation with mass spectrometry
the phospholipid ions described earlier in Section 3.1. Furthermore, multiple products (in the case wheremultiple derivatized chemical groups are present, as in the case for butylated glutathione) as well asbreakdown products can arise from a single metabolite when subjected to the derivatization conditions.
As described in Section 3.2, we have examined reaction controls, with the reagent alone, with acidand/or heat treatment to account for false positives resulting from impurities in reagents, and from prod-ucts of acid hydrolysis and heat treatment alone. For example, phospholipid molecules detected promi-nently in the TIC of underivatized plasma (the 5 most intense peaks, eluting between 25 and 35 min[19]) were absent in the TIC from butylated plasma due to acid hydrolysis (Fig. 2). To counteract theseissues, XCMS datasets obtained from a series of control experiments were analyzed where the knownartifacts, i.e., the unique features arising only from the described control experiments, were removedfrom the metabolite feature XCMS output. By discounting features that were considered known arti-facts, an estimated 50% increase in the number of newly detected features was achieved with each of thederivatization methods. In other words, for each of the amination and butylation reactions, ∼1000 newfeatures were detected.
The intensity increase of newly detected XCMS features after amination and butylation proceduresare illustrated in the 3D contour plots in Figs 1 and 2. Previous work has suggested that an increasein hydrophobicity of compounds results in increased ESI response [37,58,59]. Such an increase in hy-drophobicity will also increase retention in a reversed phase system thereby reducing ionization sup-pression caused by salts and extensive co-elution of polar metabolites present in serum, giving favorablederivatization results, which is the case for the addition of butyl group and the amination conjugate.
3.4. Relative quantitation of isotopically labeled metabolites
In previous sections, we have demonstrated the advantage of amination and butylation derivatizationsin enhancing the detection of an additional ∼1000 metabolite features per LC-ESI-MS run. While mostof the underivatized and derivatized metabolite features have not been structurally characterized, in anuntargeted search of significant features, a typical approach is to compare sets of samples, i.e. samplesfrom different disease states to detect a difference. In such comparative experiments, it is important tobe able to obtain accurate ratios of the same metabolite features between the data from different samplesets. Chemical derivatization strategies combined with isotope labeling offer the potential for increaseddetection and the simultaneous direct relative quantitation of derivatized metabolites. The principal ideaof differential isotope labeling for the current metabolomics study is similar to the first steps of ICAT [51]strategy used in comparative proteomics, except that there are no affinity capture of the reagent tags inthe current work. The labeling approach presented here consists of two steps: (1) parallel derivatizationof samples with various isotopically labeled forms of the chemical derivatization reagent, and (2) mixingthe differentially derivatized products together and analyzed in a single LC-ESI-MS run.
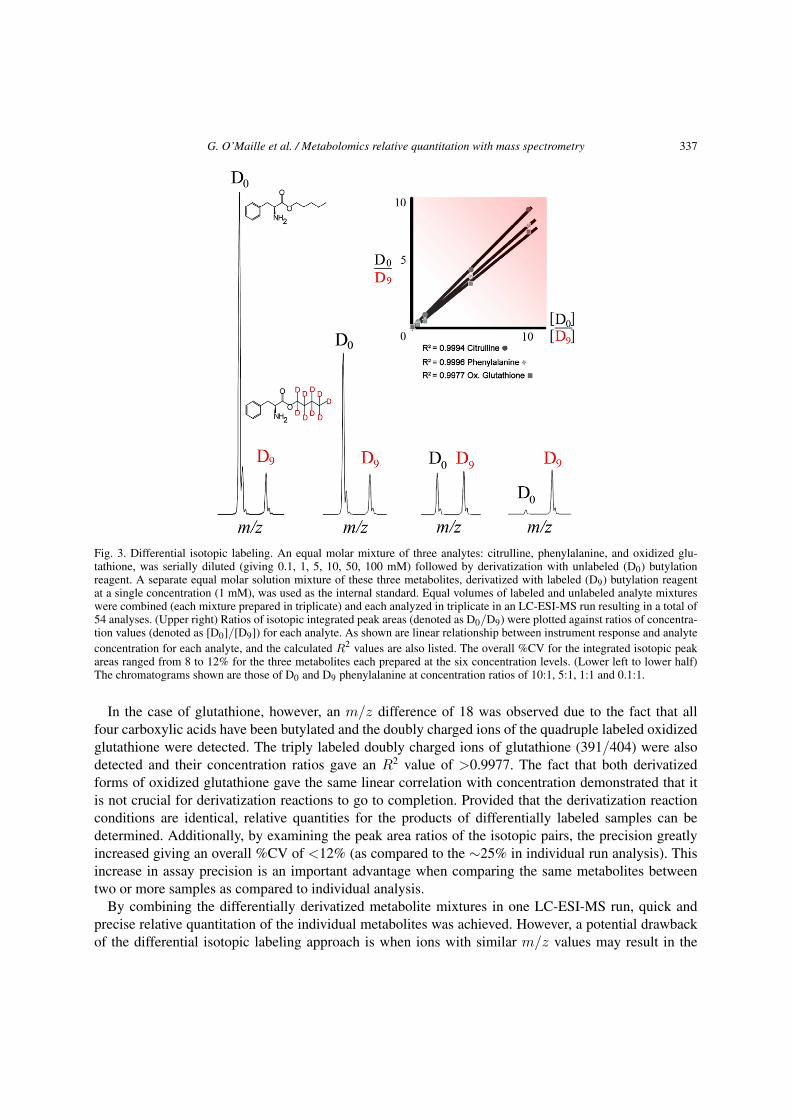
Since the same features originated from different sample sets were differentially derivatized, the re-sulting data provided the relative abundance of that particular metabolite feature between the varioussample sets, where the m/z difference reflected the m/z difference between the unlabeled and labeledforms of the derivatization reagent. Excellent R-square (R2) values (>0.9977) were obtained from thedifferential derivatization using D0 and D9 forms of butylation reagent in a study mixture of citrulline,phenylalanine, and oxidized glutathione, demonstrating the utility for relative quantitation. The corre-sponding isotopic ion pairs (m/z values for D0 and D9 forms) were 232/241, 222/231 and 419/437,respectively (Fig. 3). The m/z difference of 9 observed for the citrulline and phenylalanine isotopic ionpairs originated from the replacement of 9 hydrogen atoms of butylation reagent with 9 deuterium atomsin the isotopically labeled butylation reagent.
G. O’Maille et al. / Metabolomics relative quantitation with mass spectrometry 337
Fig. 3. Differential isotopic labeling. An equal molar mixture of three analytes: citrulline, phenylalanine, and oxidized glu-tathione, was serially diluted (giving 0.1, 1, 5, 10, 50, 100 mM) followed by derivatization with unlabeled (D0) butylationreagent. A separate equal molar solution mixture of these three metabolites, derivatized with labeled (D9) butylation reagentat a single concentration (1 mM), was used as the internal standard. Equal volumes of labeled and unlabeled analyte mixtureswere combined (each mixture prepared in triplicate) and each analyzed in triplicate in an LC-ESI-MS run resulting in a total of54 analyses. (Upper right) Ratios of isotopic integrated peak areas (denoted as D0/D9) were plotted against ratios of concentra-tion values (denoted as [D0]/[D9]) for each analyte. As shown are linear relationship between instrument response and analyteconcentration for each analyte, and the calculated R2 values are also listed. The overall %CV for the integrated isotopic peakareas ranged from 8 to 12% for the three metabolites each prepared at the six concentration levels. (Lower left to lower half)The chromatograms shown are those of D0 and D9 phenylalanine at concentration ratios of 10:1, 5:1, 1:1 and 0.1:1.
In the case of glutathione, however, an m/z difference of 18 was observed due to the fact that allfour carboxylic acids have been butylated and the doubly charged ions of the quadruple labeled oxidizedglutathione were detected. The triply labeled doubly charged ions of glutathione (391/404) were alsodetected and their concentration ratios gave an R2 value of >0.9977. The fact that both derivatizedforms of oxidized glutathione gave the same linear correlation with concentration demonstrated that itis not crucial for derivatization reactions to go to completion. Provided that the derivatization reactionconditions are identical, relative quantities for the products of differentially labeled samples can bedetermined. Additionally, by examining the peak area ratios of the isotopic pairs, the precision greatlyincreased giving an overall %CV of <12% (as compared to the ∼25% in individual run analysis). Thisincrease in assay precision is an important advantage when comparing the same metabolites betweentwo or more samples as compared to individual analysis.
By combining the differentially derivatized metabolite mixtures in one LC-ESI-MS run, quick andprecise relative quantitation of the individual metabolites was achieved. However, a potential drawbackof the differential isotopic labeling approach is when ions with similar m/z values may result in the

338 G. O’Maille et al. / Metabolomics relative quantitation with mass spectrometry
false increase of intensity for one of the ions in the ion pair. This problem can be minimized by usinghigh accuracy and high resolution mass analyzers where ions of similar masses can be differentiated.Another problem might be chemical in nature wherein reactive metabolites may form adducts with eachother. In this case, the difference between sample sets may still be observed when the metabolite profilesare examined, but the identification process would be more difficult.
When evaluating the effectiveness of derivatization approaches, additional benefits should be noted.For example, the fact that multiple ions could potentially arise from the same compound (such as phos-pholipids) is not an issue, rather, the multiple ions resulted will all be compared between sample sets,and the effectiveness of the comparison actually increases since the multiple ions will help validatethe presence and ratio changes of the same metabolite originating from different sample sets. Addi-tional benefits include enhanced structural elucidation when m/z differences between isotopic ion pairspoint to multiple labeling of a metabolite. This was demonstrated in the triple and quadruple labelingof oxidized glutathione due to the presence of multiple reactive carboxylic acids. The phenomenon ispotentially beneficial in identifying the number of reactive chemical groups in the unknown of interest.Furthermore, variations of the isotope labeling approach for quantification are limitless. For example, ifmultiple isotopically labeled forms of the derivatization reagent are available, e.g. containing 4, 8 and12 deuterium labeled forms of the reagent, then the simultaneous direct relative quantitation of multiplesets of samples can be achieved with one single LC-ESI-MS analysis.
3.5. Clinical application for biomarker discovery
To demonstrate the utility of isotopically labeled derivatization with clinical samples, in addition toSIRS and sepsis samples individually analyzed as underivatized samples as well as individually deriva-tized with butylation reagent and with amination reagent, pooled plasma samples derivatized with eitherthe D0 and D9 butylation reagent pair or the 13C0 and 13C4 amination reagent pair were also prepared andassayed. The pooled sepsis sample was derivatized with the unlabeled reagent while the pooled SIRSsample was derivatized with the isotopically labeled reagent. To illustrate the difference in data analysisapproach of pooled and individually derivatized sepsis and SIRS samples, an example of the 13C0 and13C4 amination ion pair peak intensities is shown in the upper portion of Fig. 4. The lower portion ofFig. 4 shows the XCMS EIC output plots of three potential sepsis biomarkers identified by individualsample derivatization.
In the pooled sepsis and SIRS differentially derivatized sample analysis, the intensity areas of themolecular ion peaks were integrated using XCMS to provide relative quantitative information regardingthe two disease states. By comparing the corresponding metabolite feature intensity areas (generated byXCMS) between the two disease states in the aminated set and butylated set of samples using a t-test,and sort the entire metabolite feature list according to probability (p-value), the top 100 most significantfeatures (ranked by t-test) from the pooled studies were compared with the significant features found inthe individually derivatized samples.
The individual derivatized sepsis and SIRS samples are important due to potential individual differ-ences between patients, which were not detected in pooled sample analyses. It is very likely that thepooled sample may be affected by a few members with exceptionally high or low abundance of a partic-ular metabolite feature, and, therefore, the results of pooled samples may be biased. In the individuallyderivatized set of sepsis and SIRS samples that are butylated or aminated, four parameters of the XCMSoutput and raw LC-ESI-MS data were examined: (1) results of a t-test (i.e. evaluating the p-value),(2) fold change in peak intensity area, (3) EIC plot and (4) raw LC-ESI-MS data. The criteria used were

G. O’Maille et al. / Metabolomics relative quantitation with mass spectrometry 339
Fig. 4. Pooled versus individual analysis of the sepsis disease state. (Top) samples from sepsis and SIRS patients were firstpooled by disease group, generating one pooled sepsis sample and one pooled SIRS sample, then followed by chemical deriva-tization with unlabeled (13C0) and labeled (13C4) amination reagents, respectively. The two derivatized and pooled sepsis andSIRS samples were subsequently combined in equal volumes and analyzed in a single LC-ESI-MS run. The chromatogramshowing the ion peaks of a differentially isotopically labeled metabolite present in both pooled sepsis and pooled SIRS sampleswere detected simultaneously and quantitated using the respective integrated peak areas. (Below) Individual clinical samplesfrom sepsis (n = 27) and SIRS (n = 34) patients were derivatized by amination reagent in one setup, and butylation reagentin another setup. The derivatized sepsis and SIRS samples resulted from the same derivatization method were analyzed andcompared using XCMS. Alignment of three separate extracted ion chromatograms (EICs) generated using XCMS of individualLC-ESI-MS runs of all sepsis and SIRS samples are shown. Results are color coded according to the disease state: sepsis in redand SIRS in black. Research into the structural characterization of the molecules is still ongoing.
(1) p-value > 0.001 (99.9% confidence), (2) fold change >1.5 or <0.5, i.e., more abundant in sepsis ormore abundant in SIRS, respectively, (3) normal peak shapes in the XCMS EIC plot, and (4) confirma-tion of the presence of identified peaks in the raw LC-ESI-MS data. Based on the criteria used, the dataanalysis of underivatized, butylated and aminated sepsis and SIRS samples resulted in 215, 186 and 105respective reproducible significant metabolite features that are currently being further characterized andevaluated.
At least 5 of the significant features from the pooled analysis were found to be the same as those ob-served with the individually analyzed samples, illustrating the utility to pool samples from sample setsenabling differential labeling and direct relative quantitation. The current approach produced encour-aging and reproducible data that are being further pursued in the areas of MS/MS fragmentation dataanalysis, accurate mass analysis, elementary composition calculation, mass spectral database search,fraction collection and concentration for other analytical techniques such as capillary NMR, and syn-

340 G. O’Maille et al. / Metabolomics relative quantitation with mass spectrometry
thesis of candidate compounds for validation purposes. The structural characterization and biologicalrelevance of the significant features is currently on-going and will be presented in a follow-up study.
4. Conclusions
This study demonstrated the use of chemical derivatization for LC-ESI-MS in a metabolomics ap-proach. Butylation and amination of serum samples displayed enrichment in detected metabolic com-ponents. This was illustrated by (1) chromatograms richer in peaks, (2) detection of selected “type”-compounds, phenylalanine and cholesterol, which were undetected in the non-derivatized serum. The>50% increase in detected metabolite features after butylation derivatization and amination derivatiza-tion compared to the underivatized sample is a significant result, as a large number of metabolites presentin plasma were not detected by LC-ESI-MS without derivatization. When reproducible chemical deriva-tization techniques are used to routinely assess human biofluids such as human serum, the results may beused to gain insights and further understanding of human metabolism. While two mechanistically differ-ent chemical derivatization reagents were used in the current study to maximize the detection of differentmetabolite features, it would be of great interest to use other derivatization reagents targeting the samechemical species to compare and further confirm the results of derivatized human serum extracts; for ex-ample ferrocenoyl azide [33] and tris(trimethoxyphenyl)phosphonium reagent (TMPP) [33,41] are verypromising reagents that have been shown to modify hydroxyl group and significantly enhance ionizationof previously undetected metabolites. The use of derivatization reagents targeting other function groupsare also expected to provide additional useful data for metabolomics research. Furthermore, a differentionization enhancing strategy involving solvent composition [60] is yet to be explored to achieve evenhigher number of metabolite features to be detected.
The future goals of this study include validating the increase or decrease in ion intensities (i.e., concen-tration) of the significant metabolite feature(s), structurally characterizing these metabolite(s) or diseasebiomarker(s), synthesizing isotopically labeled internal standard(s) of the disease biomarker(s), and spik-ing the internal standard(s) into clinical samples to more accurately quantitate the disease biomarker(s).In an ideal situation, all the metabolite features detected in underivatized as well as all derivatized sam-ples will be structurally characterized, and a complete metabolic map can be constructed to expand ourunderstanding of human metabolism.
The combination of derivatization with stable isotope labeling offered the possibility of performingsimultaneous relative quantitation of detected components while affording improved precision via peakratio comparisons. The comparative analysis of SIRS and sepsis clinical samples also showed encourag-ing results that are being further investigated. While this work demonstrated the effective use of chemicalderivatization for metabolomics studies, it also lays the ground work for future studies aimed at achiev-ing even more comprehensive and quantitative metabolite profiles.
Acknowledgements
A.N. is supported by a postdoctoral fellowship from The Swedish Research Council (VR). TheScripps authors appreciate the support of grants from the NIH (P30 MN062261) and DOE (DE-AC02-05CH11231) in the development of this technology. We would like to also thank Dr. Meng-Lin Tsao andDr. Juncai Meng for technical assistance.

G. O’Maille et al. / Metabolomics relative quantitation with mass spectrometry 341
References
[1] O. Fiehn, Combining genomics, metabolome analysis, and biochemical modelling to understand metabolic networks,Comp. Funct. Genom. 2 (2001), 155–168.
[2] A.R. Fernie, R.N. Trethewey, A.J. Krotzky and L. Willmitzer, Innovation – metabolite profiling: from diagnostics tosystems biology, Nat. Rev. Mol. Cell Biol. 5 (2004), 763–769.
[3] S.G. Villas-Boas, S. Mas, M. Akesson, J. Smedsgaard and J. Nielsen, Mass spectrometry in metabolome analysis, MassSpectr. Rev. 24 (2005), 613–646.
[4] E.J. Want, B.F. Cravatt and G. Siuzdak, The expanding role of mass spectrometry in metabolite profiling and characteri-zation, Chembiochem 6 (2005), 1941–1951.
[5] S.M. Roy, M. Anderle, H. Lin and C.H. Becker, Differential expression profiling of serum proteins and metabolites forbiomarker discovery, Intl. J. Mass Spectr. 238 (2004), 163–171.
[6] H. Idborg-Bjorkman, P.O. Edlund, O.M. Kvalheim, I. Schuppe-Koistinen and S.P. Jacobsson, Screening of biomarkers inrat urine using LC/electrospray ionization-MS and two-way data analysis, Anal. Chem. 75 (2003), 4784–4792.
[7] M.Y. Hirai, M. Yano, D.B. Goodenowe, S. Kanaya, T. Kimura, M. Awazuhara, M. Arita, T. Fujiwara and K. Saito, Inte-gration of transcriptomics and metabolomics for understanding of global responses to nutritional stresses in Arabidopsisthaliana, Proc. Natl. Acad. Sci. USA 101 (2004), 10205–10210.
[8] A. Saghatelian, S.A. Trauger, E.J. Want, E.G. Hawkins, G. Siuzdak and B.F. Cravatt, Assignment of endogenous substratesto enzymes by global metabolite profiling, Biochemistry 43 (2004), 14332–14339.
[9] G.J. Van Berkel, S.A. Mcluckey and G.L. Glish, Preforming ions in solution via charge-transfer complexation for analysisby electrospray ionization mass-spectrometry, Anal. Chem. 63 (1991), 2064–2068.
[10] E.C. Horning and M.G. Horning, Human metabolic profiles obtained by Gc and GC/MS, J. Chromatogr. Sci. 9 (1971),129–140.
[11] O. Fiehn, J. Kopka, P. Dormann, T. Altmann, R.N. Trethewey and L. Willmitzer, Metabolite profiling for plant functionalgenomics, Nat. Biotechnol. 18 (2000), 1157–1161.
[12] A. Jiye, J. Trygg, J. Gullberg, A.I. Johansson, P. Jonsson, H. Antti, S.L. Marklund and T. Moritz, Extraction and GC/MSanalysis of the human blood plasma metabolome, Anal. Chem. 77 (2005), 8086–8094.
[13] D.R. Knapp, Chemical derivatization for mass spectrometry, Methods Enzymol. 193 (1990), 314–329.[14] G. Siuzdak, The Expanding Role of Mass Spectrometry in Biotechnology, 2nd edn, MCC Press, San Diego, CA, 2006.[15] J.B. Fenn, M. Mann, C.K. Meng, S.F. Wong and C.M. Whitehouse, Electrospray ionization for mass-spectrometry of large
biomolecules, Science 246 (1989), 64–71.[16] V.V. Tolstikov and O. Fiehn, Analysis of highly polar compounds of plant origin: Combination of hydrophilic interaction
chromatography and electrospray ion trap mass spectrometry, Anal. Biochem. 301 (2002), 298–307.[17] A. Lafaye, C. Junot, B. Ramounet-Le Gall, P. Fritsch, J.C. Tabet and E. Ezan, Metabolite profiling in rat urine by liquid
chromatography/electrospray ion trap mass spectrometry. Application to the study of heavy metal toxicity, Rapid Commun.Mass Spectr. 17 (2003), 2541–2549.
[18] C.D. Broeckling, D.V. Huhman, M.A. Farag, J.T. Smith, G.D. May, P. Mendes, R.A. Dixon and L.W. Sumner, Metabolicprofiling of Medicago truncatula cell cultures reveals the effects of biotic and abiotic elicitors on metabolism, J. Exp. Bot.56 (2005), 323–336.
[19] E.J. Want, G. O’Maille, C.A. Smith, T.R. Brandon, W. Uritboonthai, C. Qin, S.A. Trauger and G. Siuzdak, Solvent-dependent metabolite distribution, clustering, and protein extraction for serum profiling with mass spectrometry, Anal.Chem. 78 (2006), 743–752.
[20] V.V. Tolstikov, A. Lommen, K. Nakanishi, N. Tanaka and O. Fiehn, Monolithic silica-based capillary reversed-phase liquidchromatography/electrospray mass spectrometry for plant metabolomics, Anal. Chem. 75 (2003), 6737–6740.
[21] E. Von Roepenack-Lahaye, T. Degenkolb, M. Zerjeski, M. Franz, U. Roth, L. Wessjohann, J. Schmidt, D. Scheel andS. Clemens, Profiling of Arabidopsis secondary metabolites by capillary liquid chromatography coupled to electrosprayionization quadrupole time-of-flight mass spectrometry, Plant Physiol. 134 (2004), 548–559.
[22] W.X. Wang, H.H. Zhou, H. Lin, S. Roy, T.A. Shaler, L.R. Hill, S. Norton, P. Kumar, M. Anderle and C.H. Becker,Quantification of proteins and metabolites by mass spectrometry without isotopic labeling or spiked standards, Anal.Chem. 75 (2003), 4818–4826.
[23] Y.F. Shen, R. Zhang, R.J. Moore, J. Kim, T.O. Metz, K.K. Hixson, R. Zhao, E.A. Livesay, H.R. Udseth and R.D. Smith,Automated 20 kpsi RPLC-MS and MS/MS with chromatographic peak capacities of 1000–1500 and capabilities in pro-teomics and metabolomics, Anal. Chem. 77 (2005), 3090–3100.
[24] I.D. Wilson, J.K. Nicholson, J. Castro-Perez, J.H. Granger, K.A. Johnson, B.W. Smith and R.S. Plumb, High resolution“Ultra performance” liquid chromatography coupled to oa-TOF mass spectrometry as a tool for differential metabolicpathway profiling in functional genomic studies, J. Proteome Res. 4 (2005), 591–598.
[25] R. Goodacre, S. Vaidyanathan, G. Bianchi and D.B. Kell, Metabolic profiling using direct infusion electrospray ionisationmass spectrometry for the characterisation of olive oils, Analyst 127 (2002), 1457–1462.

342 G. O’Maille et al. / Metabolomics relative quantitation with mass spectrometry
[26] J.I. Castrillo, A. Hayes, S. Mohammed, S.J. Gaskell and S.G. Oliver, An optimized protocol for metabolome analysis inyeast using direct infusion electrospray mass spectrometry, Phytochemistry 62 (2003), 929–937.
[27] W.B. Dunn, S. Overy and W.P. Quick, Evaluation of automated electrospray-TOF mass spectrometry for metabolic fin-gerprinting of the plant metabolome, Metabolomics 2 (2005), 137–148.
[28] S.M. Gao, Z.P. Zhang and H.T. Karnes, Sensitivity enhancement in liquid chromatography/atmospheric pressure ionizationmass spectrometry using derivatization and mobile phase additives, J. Chromatogr. B – Anal. Technol. Biomed. Life Sci.825 (2005), 98–110.
[29] J.M. Halket, D. Waterman, A.M. Przyborowska, R.K.P. Patel, P.D. Fraser and P.M. Bramley, Chemical derivatization andmass spectral libraries in metabolic profiling by GC/MS and LC/MS/MS, J. Exp. Bot. 56 (2005), 219–243.
[30] E. Bayer, P. Gfrorer and C. Rentel, Coordination-ionspray-MS (CIS-MS), a universal detection and characterizationmethod for direct coupling with separation techniques, Angew. Chem. – Int. Ed. 38 (1999), 992–995.
[31] J.M.E. Quirke, C.L. Adams and G.J. Vanberkel, Chemical derivatization for electrospray-ionization mass-spectrometry.1. Alkyl-halides, alcohols, phenols, thiols, and amines, Anal. Chem. 66 (1994), 1302–1315.
[32] G.J. Van Berkel and K.G. Asano, Chemical derivatization for electrospray-ionization mass-spectrometry. 2. Aromatic andhighly conjugated molecules, Anal. Chem. 66 (1994), 2096–2102.
[33] G.J. Van Berkel, J.M.E. Quirke, R.A. Tigani, A.S. Dilley and T.R. Covey, Derivatization for electrospray ionization massspectrometry. 3. Electrochemically ionizable derivatives, Anal. Chem. 70 (1998), 1544–1554.
[34] G.J. Van Berkel, J.M.E. Quirke and C.L. Adams, Derivatization for electrospray ionization-mass spectrometry. 4. Alkenesand alkynes, Rapid Commun. Mass Spectr. 14 (2000), 849–858.
[35] W.J. Griffiths, S. Liu, G. Alvelius and J. Sjovall, Derivatisation for the characterisation of neutral oxosteroids by electro-spray and matrix-assisted laser desorption/ionisation tandem mass spectrometry: the Girard P derivative, Rapid Commun.Mass Spectr. 17 (2003), 924–935.
[36] E. Lattova, S. Snovida, H. Perreault and O. Krokhin, Influence of the labeling group on ionization and fragmentation ofcarbohydrates in mass spectrometry, J. Am. Soc. Mass Spectr. 16 (2005), 683–696.
[37] A. Nordstrom, P. Tarkowski, D. Tarkowska, K. Dolezal, C. Astot, G. Sandberg and T. Moritz, Derivatization for LCelectrospray ionization-MS: A tool for improving reversed-phase separation and ESI responses of bases, ribosides, andintact nucleotides, Anal. Chem. 76 (2004), 2869–2877.
[38] G. Tong, E. Want, S. Trauger, C. Smith, R. Abagyan and G. Siuzdak, Metabolite derivatization approaches to enhance sen-sitivity and coverage, in: Proceedings of the 52nd ASMS Conference on Mass Spectrometry and Allied Topics, Nashville,TN, May 2004, pp. TPB-040.
[39] G. Tong, E. Want, T. Brandon, F. Bingham and G. Siuzdak, Chemical derivatization and data analysis approaches tometabolite profiling, in: Proceedings of the 19th Asilomar Conference on Mass Spectrometry, Metabolite Profiling: Bio-marker Discovery, Drug Efficacy and Fundamental Biochemistry, Pacific Grove, CA, October 2004.
[40] G. Tong, E. Want, C. Smith, Z. Shan, M.-L. Tsao, J. Meng, T. Brandon, W. Webb and G. Siuzdak, Metabolite profilingwith isotopically encoded chemical derivatization, in: Proceedings of the 53rd ASMS Conference on Mass Spectrometryand Allied Topics, San Antonio, TX, June 2005, pp. THP18–293.
[41] S.J. Barry, R.M. Carr, S.J. Lane, W.J. Leavens, S. Monte and I. Waterhouse, Derivatisation for liquid chromatogra-phy/electrospray mass spectrometry: synthesis of pyridinium compounds and their amine and carboxylic acid derivatives,Rapid Commun. Mass Spectr. 17 (2003), 603–620.
[42] D.H. Chace, Mass spectrometry in the clinical laboratory, Chem. Rev. 101 (2001), 445–477.[43] X. Huang and F.E. Regnier, Differential metabolomics using stable isotope labeling and two-dimensional gas chromatog-
raphy with time-of-flight mass spectrometry, Anal. Chem. 80 (2008), 107–114.[44] D.W. Johnson, H.J. ten Brink and C. Jakobs, A rapid screening procedure for cholesterol and dehydrocholesterol by
electrospray ionization tandem mass spectrometry, J. Lipid Res. 42 (2001), 1699–1705.[45] M.R. Shortreed, S.M. Lamos, B.L. Frey, M.F. Phillips, M. Patel, P.J. Belshaw and L.M. Smith, Ionizable isotopic labeling
reagent for relative quantification of amine metabolites by mass spectrometry, Anal. Chem. 78 (2006), 6398–6403.[46] P. Jonsson, J. Gullberg, A. Nordstrom, M. Kusano, M. Kowalczyk, M. Sjostrom and T. Moritz, A strategy for identifying
differences in large series of metabolomic samples analyzed by GC/MS, Anal. Chem. 76 (2004), 1738–1745.[47] M.R. Mashego, L. Wu, J.C. Van Dam, C. Ras, J.L. Vinke, W.A. Van Winden, W.M. Van Gulik and J.J. Heijnen, MIRA-
CLE: mass isotopomer ratio analysis of U-C-13-labeled extracts. A new method for accurate quantification of changes inconcentrations of intracellular metabolites, Biotechnol. Bioeng. 85 (2004), 620–628.
[48] L. Wu, M.R. Mashego, J.C. Van Dam, A.M. Proell, J.L. Vinke, C. Ras, W.A. Van Winden, W.M. Van Gulik and J.J. Hei-jnen, Quantitative analysis of the microbial metabolome by isotope dilution mass spectrometry using uniformly C-13-labeled cell extracts as internal standards, Anal. Biochem. 336 (2005), 164–171.
[49] A. Lafaye, J. Labarre, J.C. Tabet, E. Ezan and C. Junot, Liquid chromatography – Mass spectrometry and N-15 metaboliclabeling for quantitative metabolic profiling, Anal. Chem. 77 (2005), 2026–2033.
[50] J.K. Kim, K. Harada, T. Bamba, E. Fukusaki and A. Kobayashi, Stable isotope dilution-based accurate comparative quan-

G. O’Maille et al. / Metabolomics relative quantitation with mass spectrometry 343
tification of nitrogen-containing metabolites in Arabidopsis thaliana T87 cells using in vivo N-15-isotope enrichment,Biosci. Biotechnol. Biochem. 69 (2005), 1331–1340.
[51] S.P. Gygi, B. Rist, S.A. Gerber, F. Turecek, M.H. Gelb and R. Aebersold, Quantitative analysis of complex protein mixturesusing isotope-coded affinity tags, Nat. Biotechnol. 17 (1999), 994–999.
[52] M.H. Schoenberg, M. Weiss and P. Radermacher, Outcome of patients with sepsis and septic shock after ICU treatment,Langenbecks Arch. Surg. 383 (1998), 44–48.
[53] M. Poeze, G. Ramsay, H. Gerlach, F. Rubulotta and M. Levy, An international sepsis survey: a study of doctors’ knowledgeand perception about sepsis, Crit. Care 8 (2004), R409–R413.
[54] R. Shulman, Current drug treatment of sepsis, Hosp. Pharm. 9 (2002), 97–101.[55] C.A. Smith, E.J. Want, G. O’Maille, R. Abagyan and G. Siuzdak, XCMS: Processing mass spectrometry data for metabo-
lite profiling using nonlinear peak alignment, matching, and identification, Anal. Chem. 78 (2006), 779–787.[56] R.J. Zhang and F.E. Regnier, Minimizing resolution of isotopically coded peptides in comparative proteomics, J. Proteome
Res. 1 (2002), 139–147.[57] R. Lowe, E.P. Go, G.C. Tong, N.H. Voelcker and G. Siuzdak, Monitoring EDTA and endogenous metabolite biomarkers
from serum with mass spectrometry, Spectrosc. Int. J. 19 (2005), 137–146.[58] N.B. Cech and C.G. Enke, Practical implications of some recent studies in electrospray ionization fundamentals, Mass
Spectr. Rev. 20 (2001), 362–387.[59] N.B. Cech, J.R. Krone and C.G. Enke, Predicting electrospray response from chromatographic retention time, Anal. Chem.
73 (2001), 208–213.[60] C.A. Di, A. Costantino, C. Crescenzi and R. Samperi, Quantification of phenylurea herbicides and their free and humic
acid-associated metabolites in natural waters 47, J. Chromatogr. A 852 (1999), 465–474.

Submit your manuscripts athttp://www.hindawi.com
Chromatography Research International
Hindawi Publishing Corporationhttp://www.hindawi.com Volume 2013
Hindawi Publishing Corporationhttp://www.hindawi.com Volume 2013
Carbohydrate Chemistry
International Journal of
Hindawi Publishing Corporationhttp://www.hindawi.com
International Journal of
Analytical ChemistryVolume 2013
ISRN Chromatography
Hindawi Publishing Corporationhttp://www.hindawi.com Volume 2013
Hindawi Publishing Corporation http://www.hindawi.com Volume 2013Hindawi Publishing Corporation http://www.hindawi.com Volume 2013
The Scientific World Journal
Bioinorganic Chemistry and ApplicationsHindawi Publishing Corporationhttp://www.hindawi.com Volume 2013
Hindawi Publishing Corporationhttp://www.hindawi.com Volume 2013
CatalystsJournal of
ISRN Analytical Chemistry
Hindawi Publishing Corporationhttp://www.hindawi.com Volume 2013
ElectrochemistryInternational Journal of
Hindawi Publishing Corporation http://www.hindawi.com Volume 2013
Hindawi Publishing Corporationhttp://www.hindawi.com Volume 2013
Advances in
Physical Chemistry
ISRN Physical Chemistry
Hindawi Publishing Corporationhttp://www.hindawi.com Volume 2013
SpectroscopyInternational Journal of
Hindawi Publishing Corporationhttp://www.hindawi.com Volume 2013
ISRN Inorganic Chemistry
Hindawi Publishing Corporationhttp://www.hindawi.com Volume 2013
Hindawi Publishing Corporationhttp://www.hindawi.com Volume 2013
Journal of
Chemistry
Hindawi Publishing Corporationhttp://www.hindawi.com Volume 2013
Inorganic ChemistryInternational Journal of
Hindawi Publishing Corporation http://www.hindawi.com Volume 2013
International Journal ofPhotoenergy
Hindawi Publishing Corporationhttp://www.hindawi.com
Analytical Methods in Chemistry
Journal of
Volume 2013
ISRN Organic Chemistry
Hindawi Publishing Corporationhttp://www.hindawi.com Volume 2013
Hindawi Publishing Corporationhttp://www.hindawi.com Volume 2013
Journal of
Spectroscopy