Metabolomics by GC-MS - uab.edu · PDF fileMetabolomics by GC-MS ... source: Schauer et al...
53
Metabolomics by GC-MS Sara J. Cooper HudsonAlpha Institute for Biotechnology Huntsville, AL January 23, 2015
Transcript of Metabolomics by GC-MS - uab.edu · PDF fileMetabolomics by GC-MS ... source: Schauer et al...
Metabolomics by GC-MS
Sara J. CooperHudsonAlpha Institute for BiotechnologyHuntsville, AL
January 23, 2015
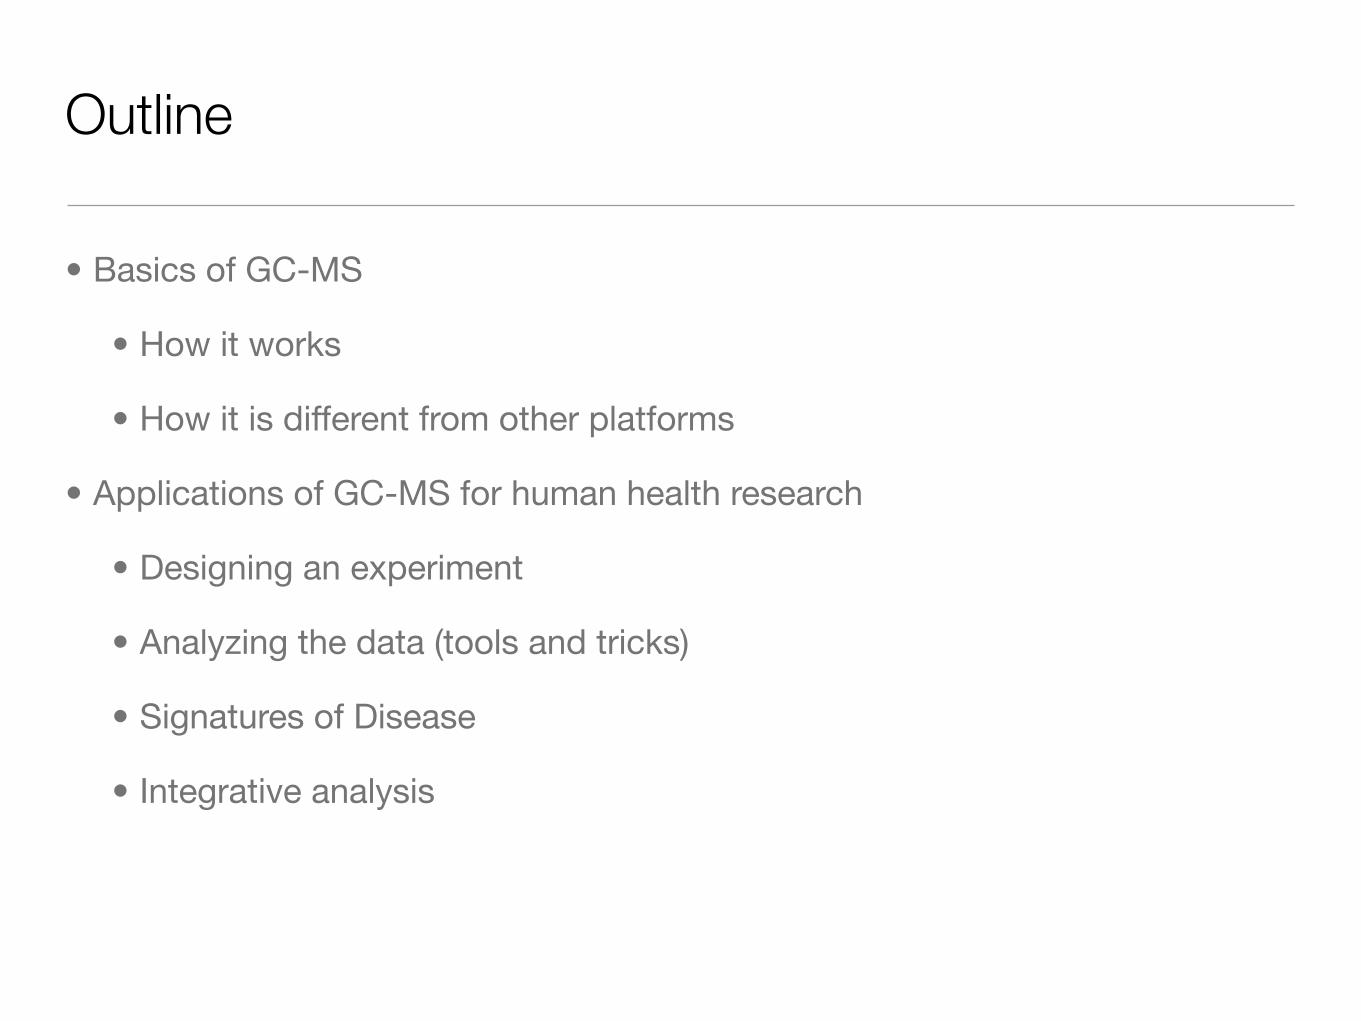
Outline
• Basics of GC-MS
• How it works
• How it is different from other platforms
• Applications of GC-MS for human health research
• Designing an experiment
• Analyzing the data (tools and tricks)
• Signatures of Disease
• Integrative analysis

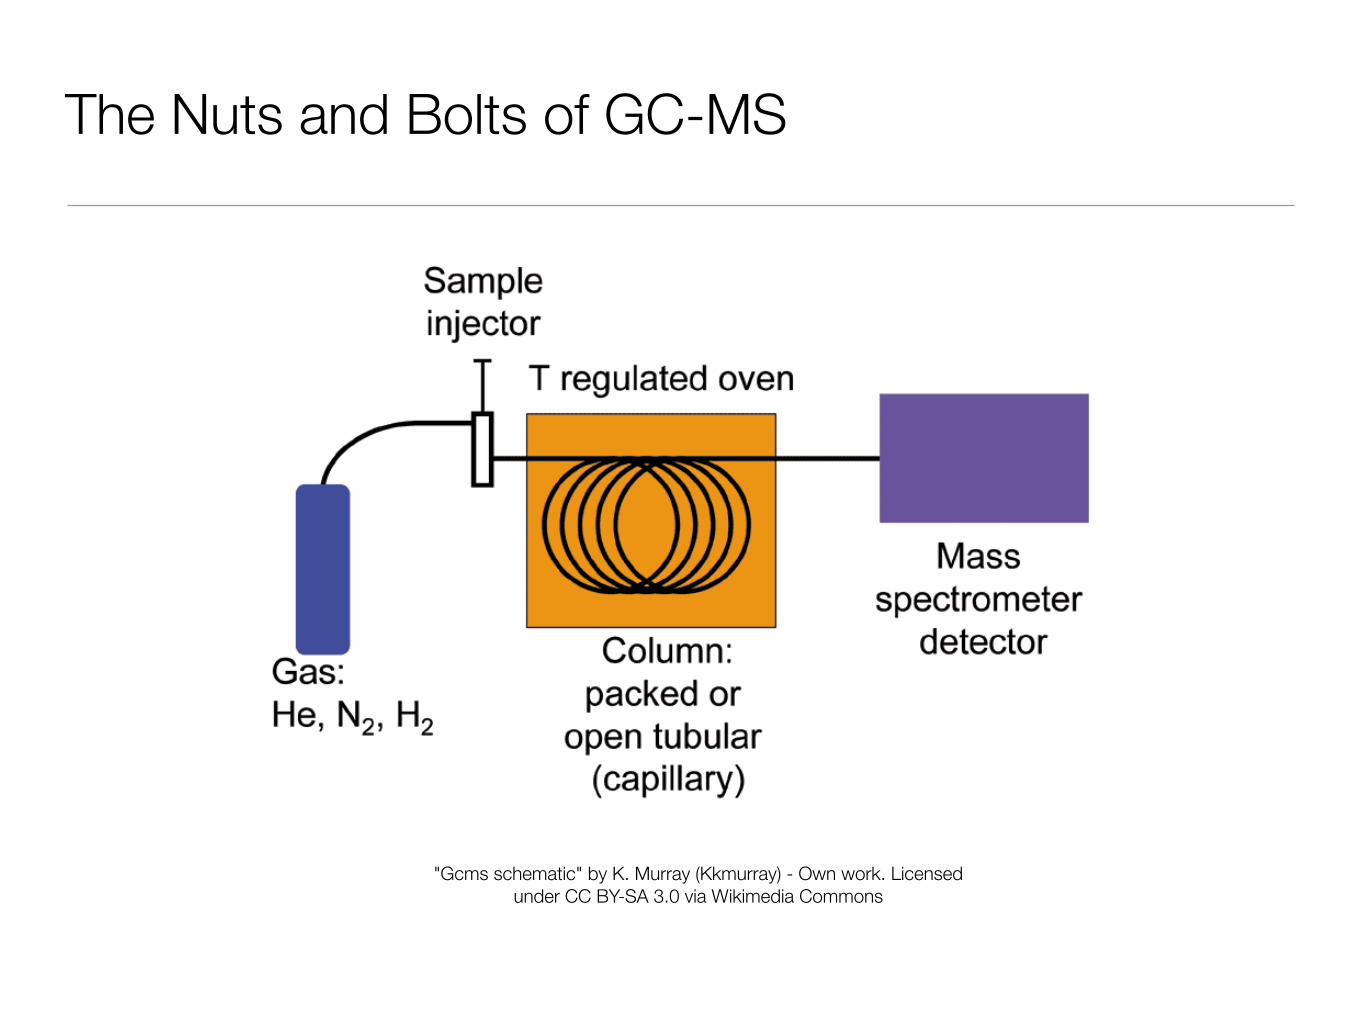
The Nuts and Bolts of GC-MS
"Gcms schematic" by K. Murray (Kkmurray) - Own work. Licensed under CC BY-SA 3.0 via Wikimedia Commons
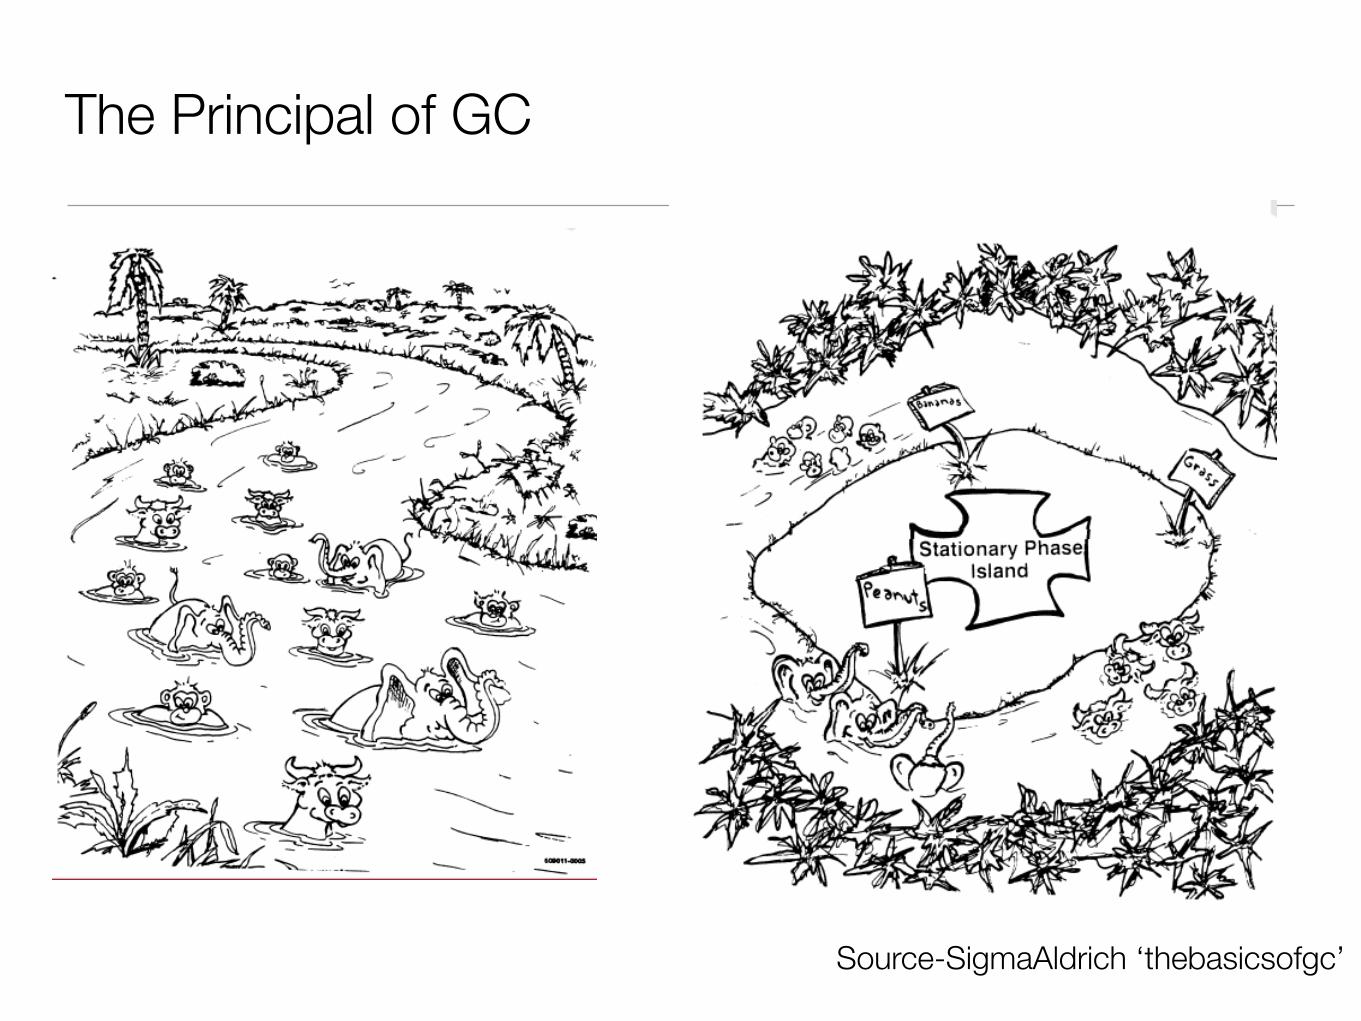
The Principal of GC
Source-SigmaAldrich ‘thebasicsofgc’

The Nuts and Bolts of GC-MS
"Gcms schematic" by K. Murray (Kkmurray) - Own work. Licensed under CC BY-SA 3.0 via Wikimedia Commons
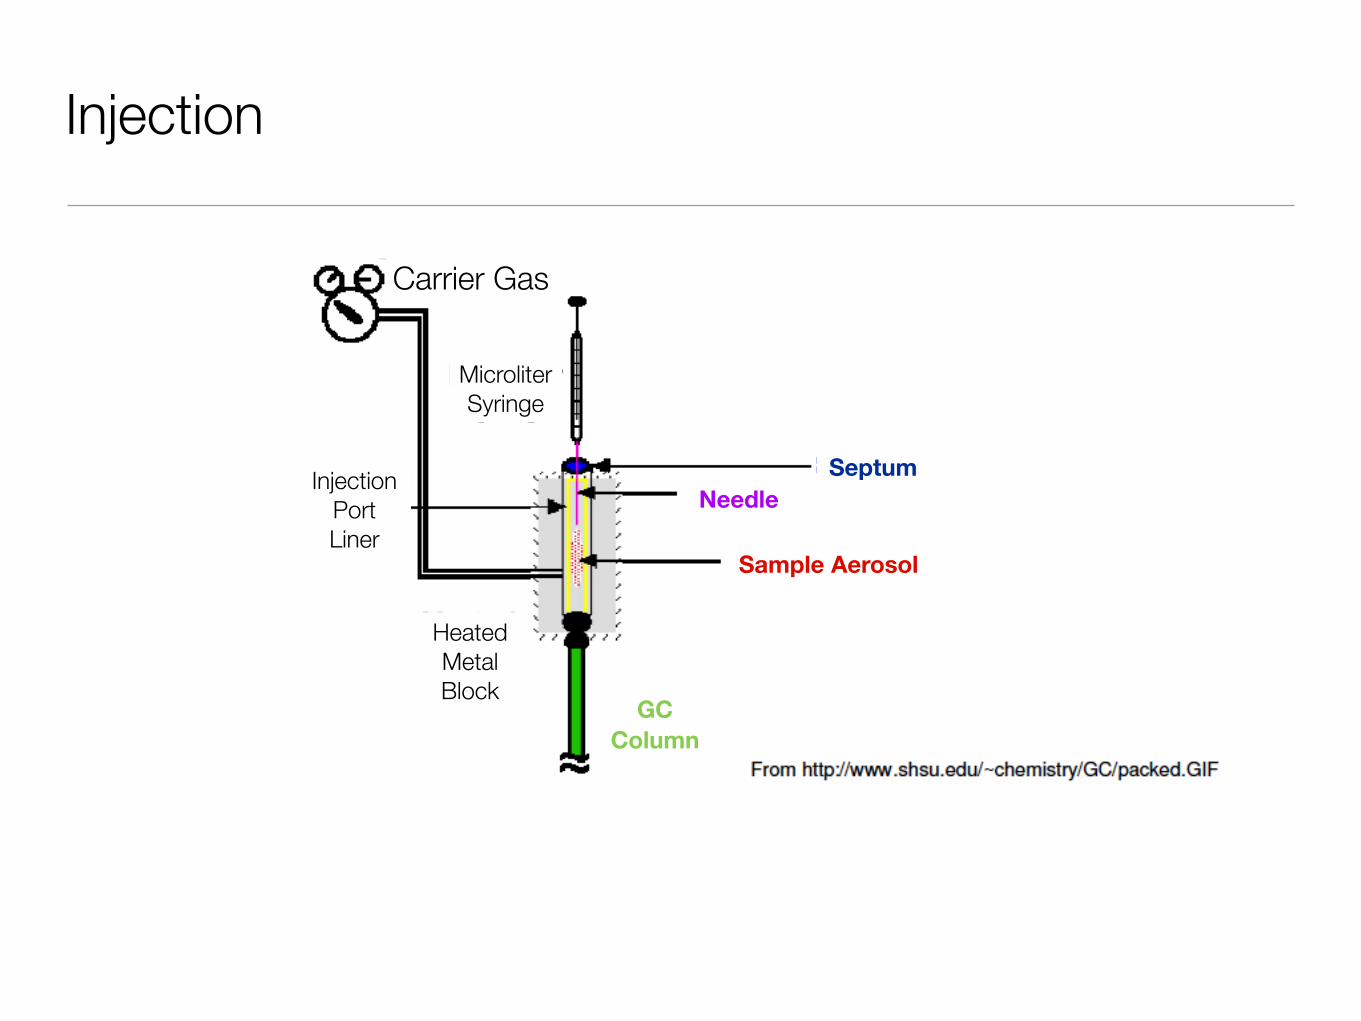
Injection
Carrier Gas
MicroliterSyringe
InjectionPortLiner
HeatedMetalBlock
GC Column
NeedleSeptum
Sample Aerosol

The Nuts and Bolts of GC-MS
"Gcms schematic" by K. Murray (Kkmurray) - Own work. Licensed under CC BY-SA 3.0 via Wikimedia Commons
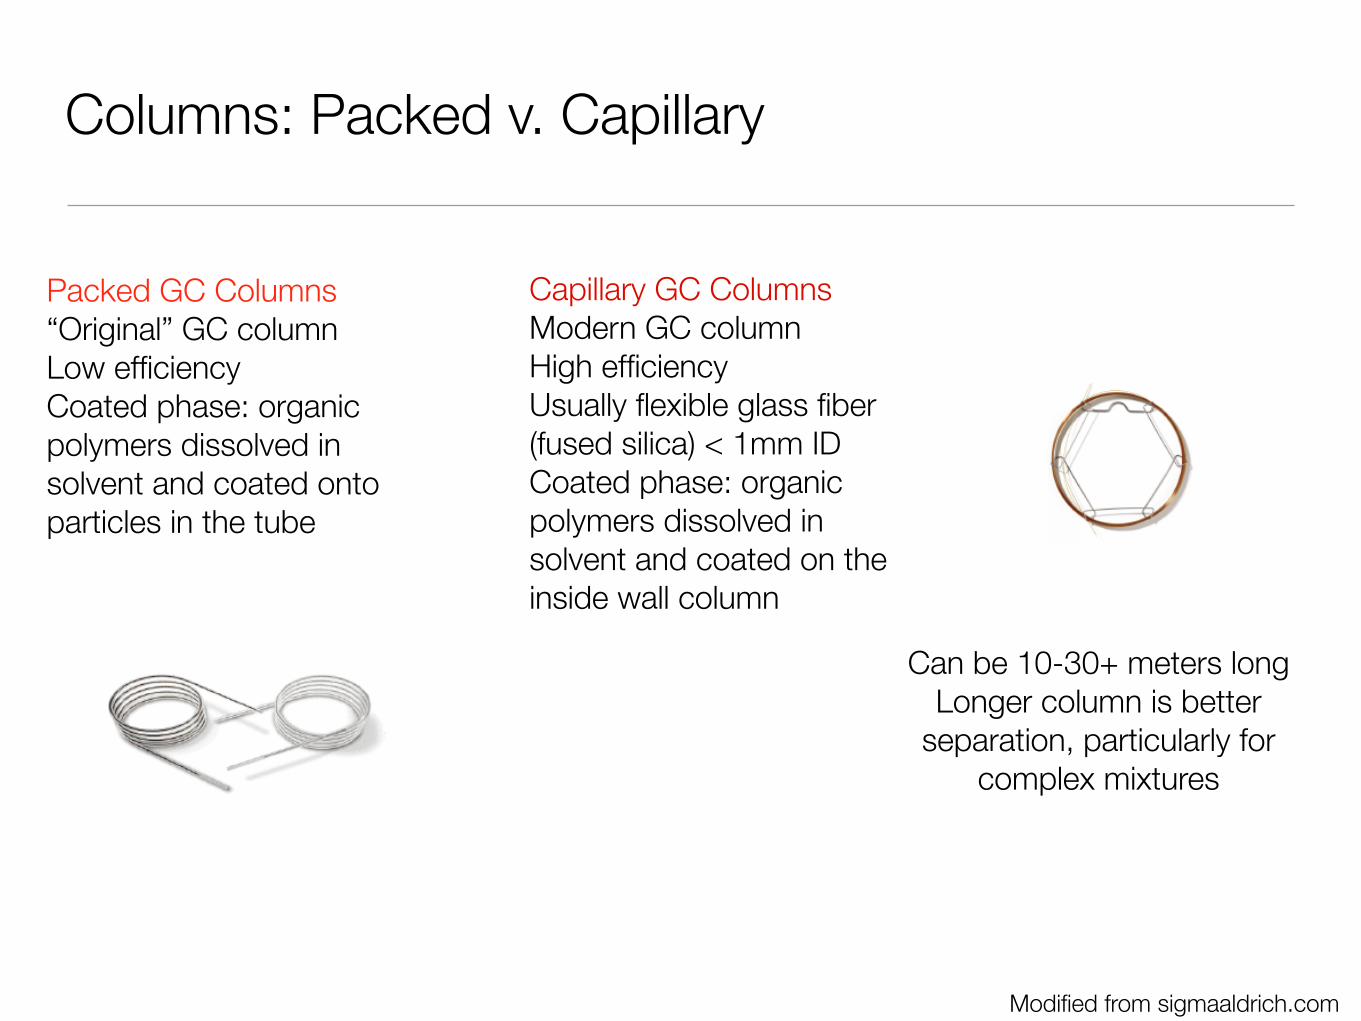
Columns: Packed v. Capillary
Packed GC Columns“Original” GC columnLow efficiencyCoated phase: organic polymers dissolved in solvent and coated onto particles in the tube
Capillary GC ColumnsModern GC columnHigh efficiencyUsually flexible glass fiber (fused silica) < 1mm IDCoated phase: organic polymers dissolved in solvent and coated on the inside wall column
Modified from sigmaaldrich.com
Can be 10-30+ meters longLonger column is better
separation, particularly for complex mixtures
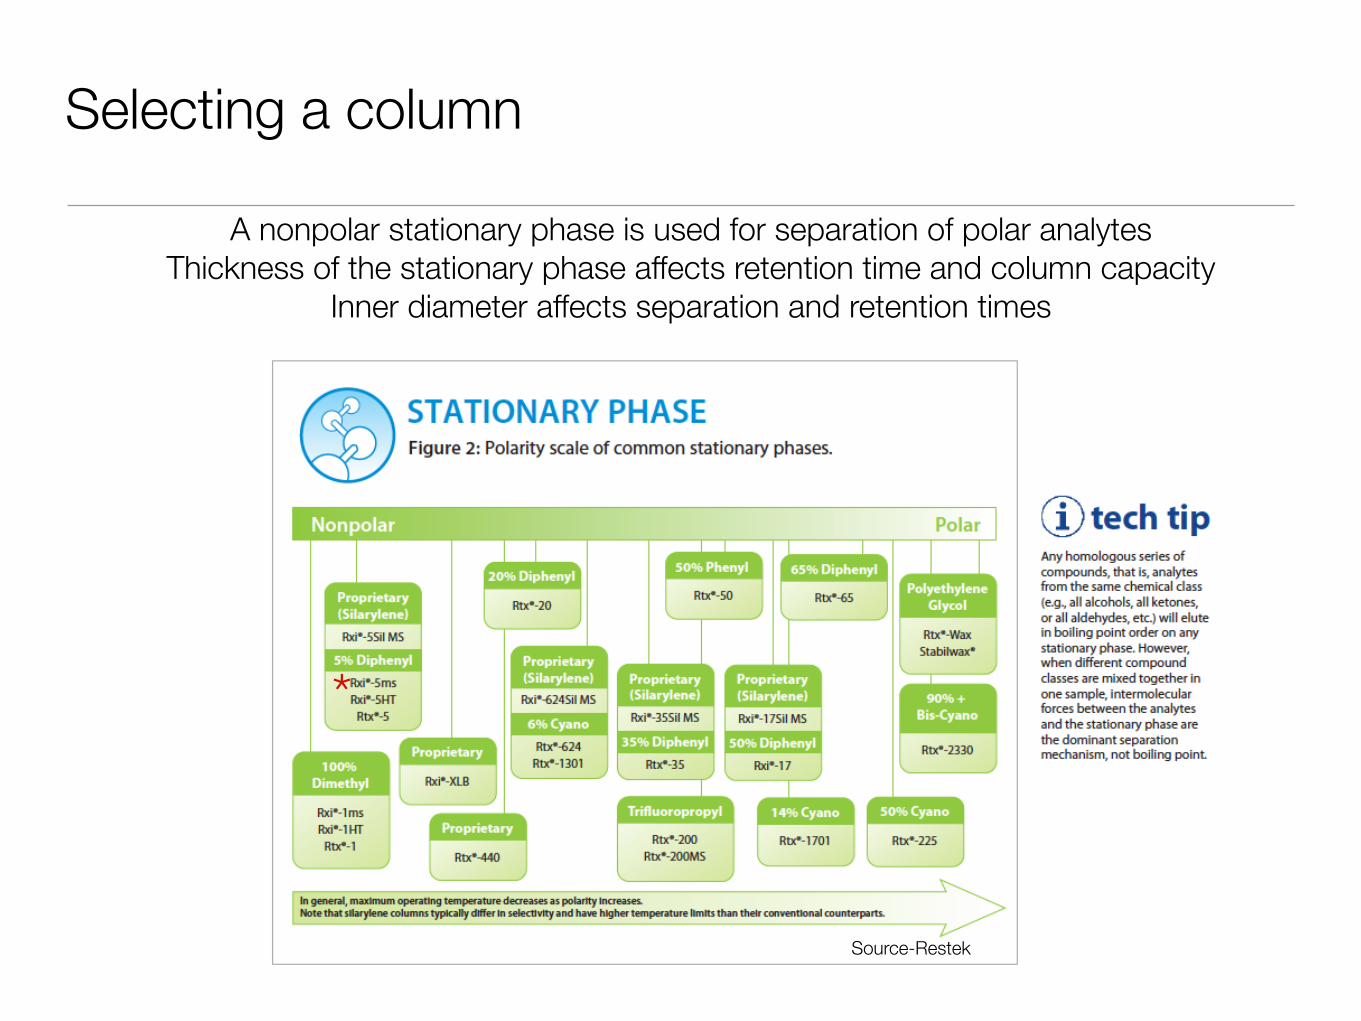
Selecting a column
*
A nonpolar stationary phase is used for separation of polar analytesThickness of the stationary phase affects retention time and column capacity
Inner diameter affects separation and retention times
Source-Restek

Two-dimensional chromatography
• GC Columns function in series to improve resolution of chemically similar analytes
Source: Leco Corp

Mass Spectrometer - Ionization and mass measurement
• Ionization
• Electron Ionization (Standard -70keV)
• Fragmentation
• Chemical Ionization (less common)
• Detection
• Time-of-flight mass spectrometry
• mass calculated based on time from ionization to reaching detector
• High-Resolution TOF
• offers higher mass resolution for metabolite identification
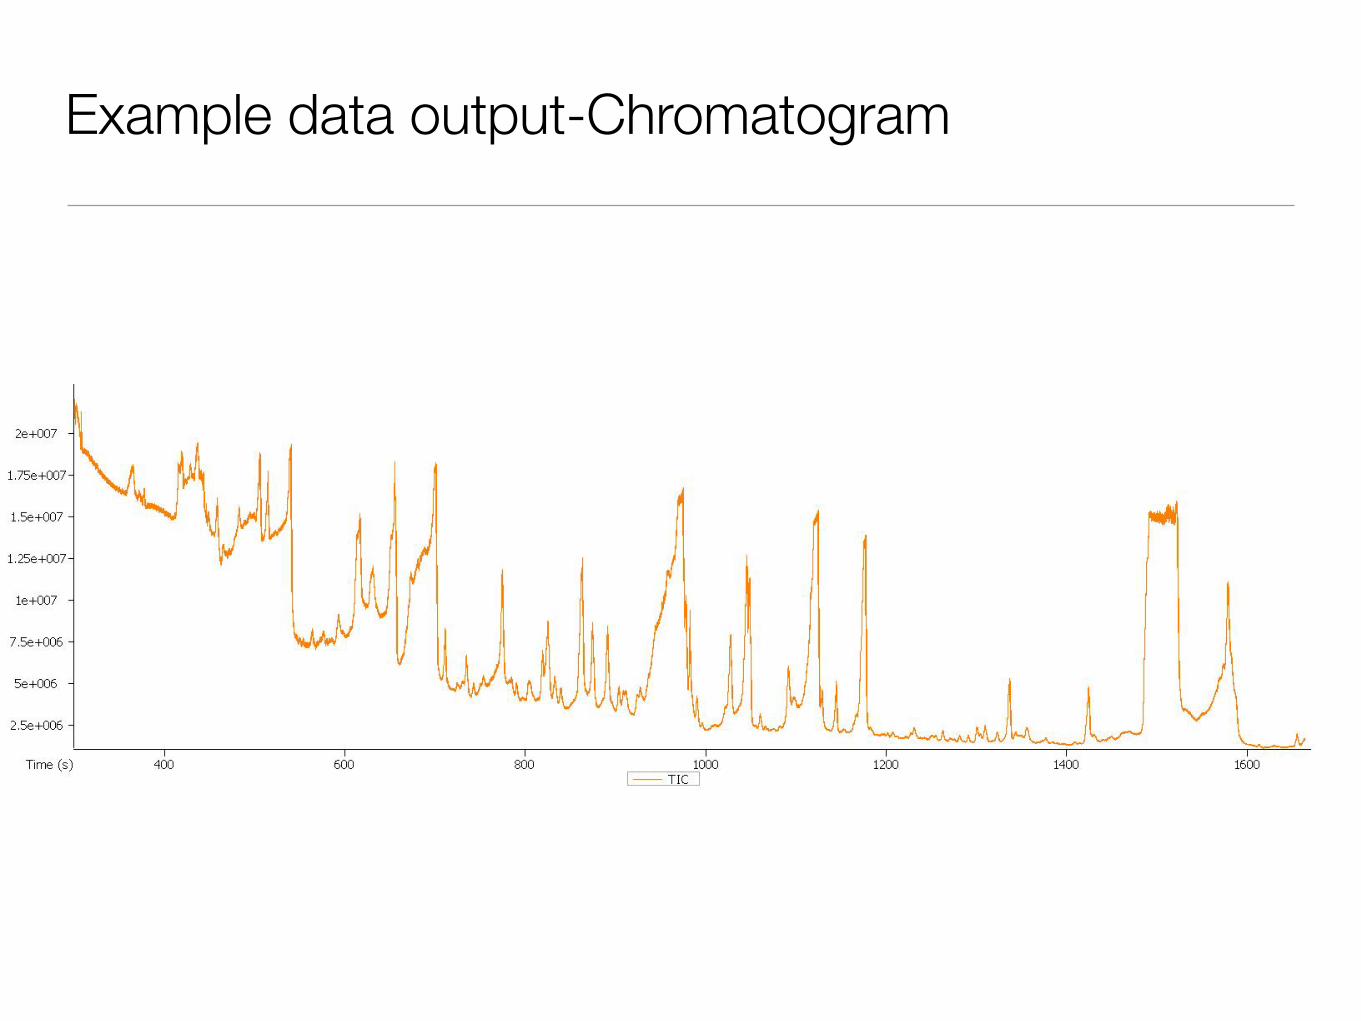
Example data output-Chromatogram

Signal Deconvolution
Source: Leco
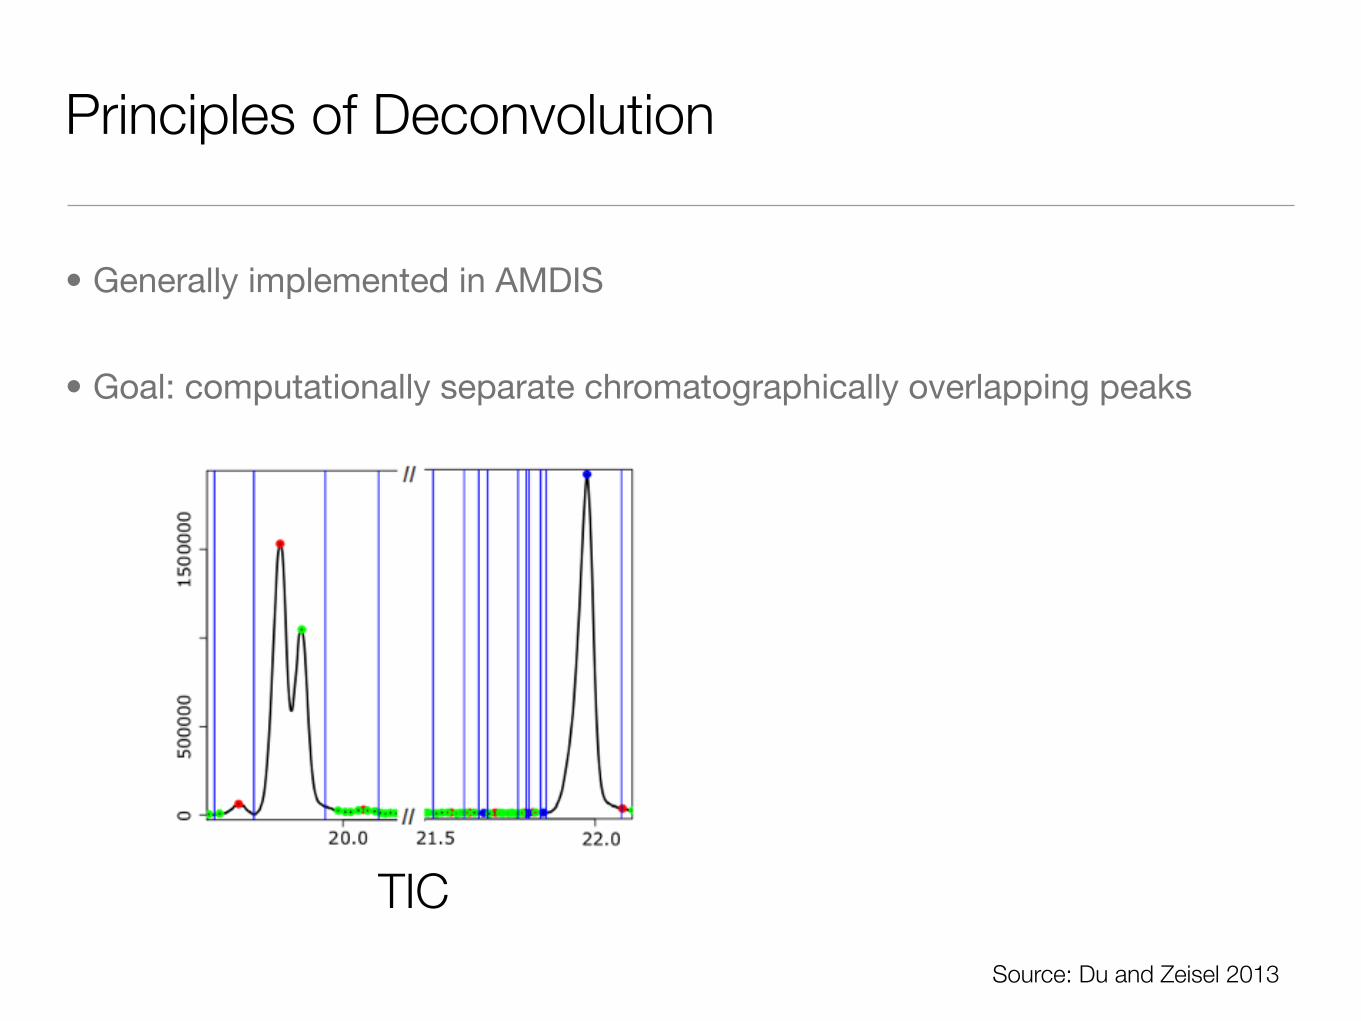
Principles of Deconvolution
• Generally implemented in AMDIS
• Goal: computationally separate chromatographically overlapping peaks
Source: Du and Zeisel 2013
TIC Individual ions
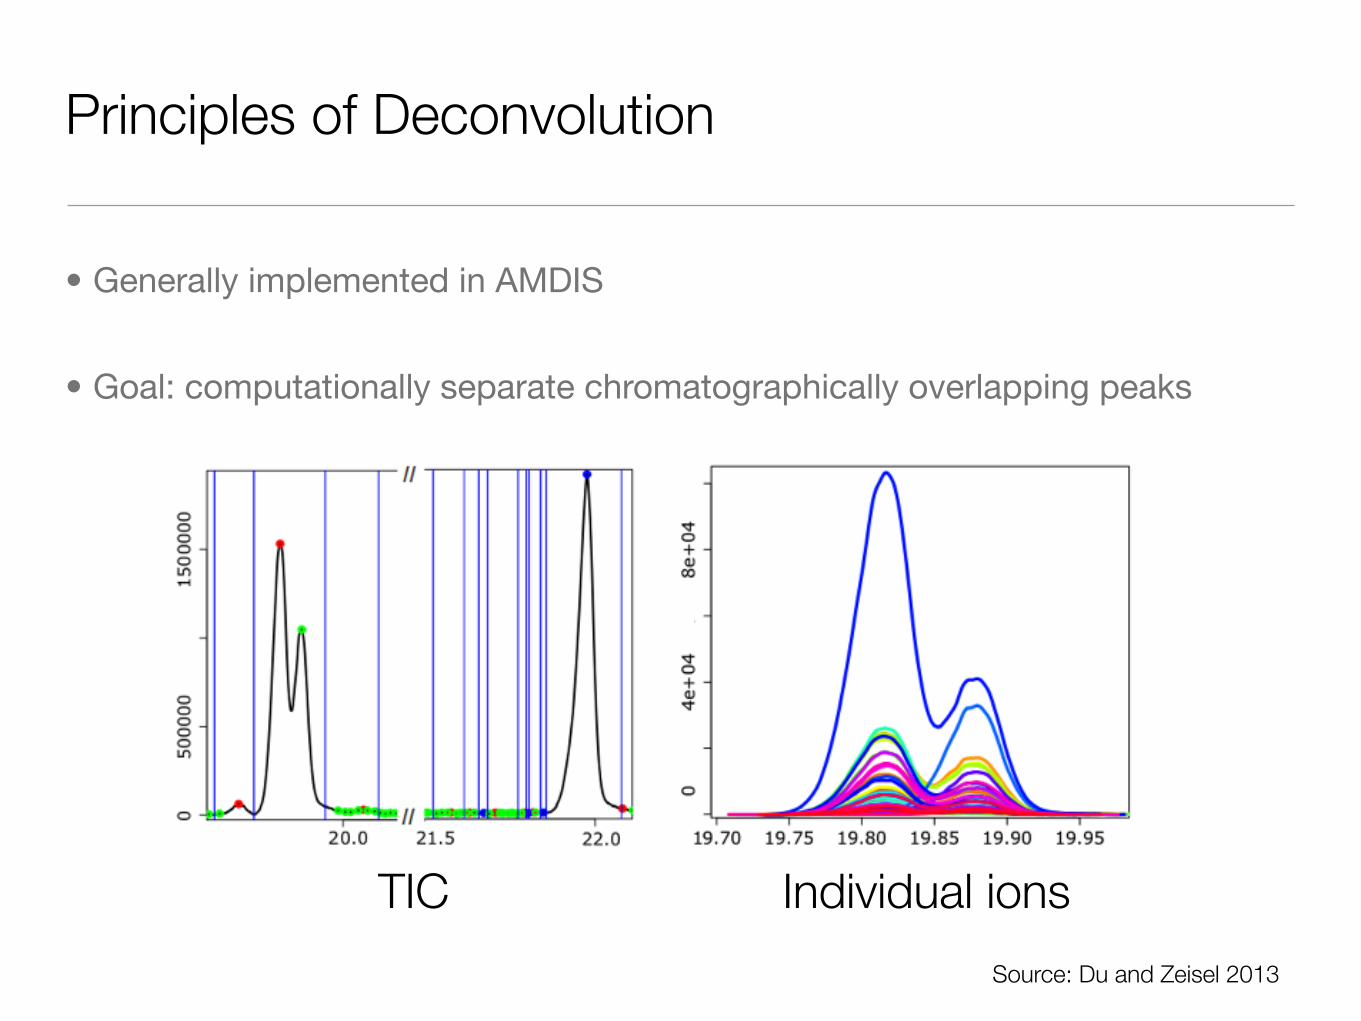
Principles of Deconvolution
• Generally implemented in AMDIS
• Goal: computationally separate chromatographically overlapping peaks
Source: Du and Zeisel 2013
TIC Individual ions

Principles of Deconvolution

Principles of Deconvolution

Principles of Deconvolution

Data projected into two dimensions
Glutamateasparagine
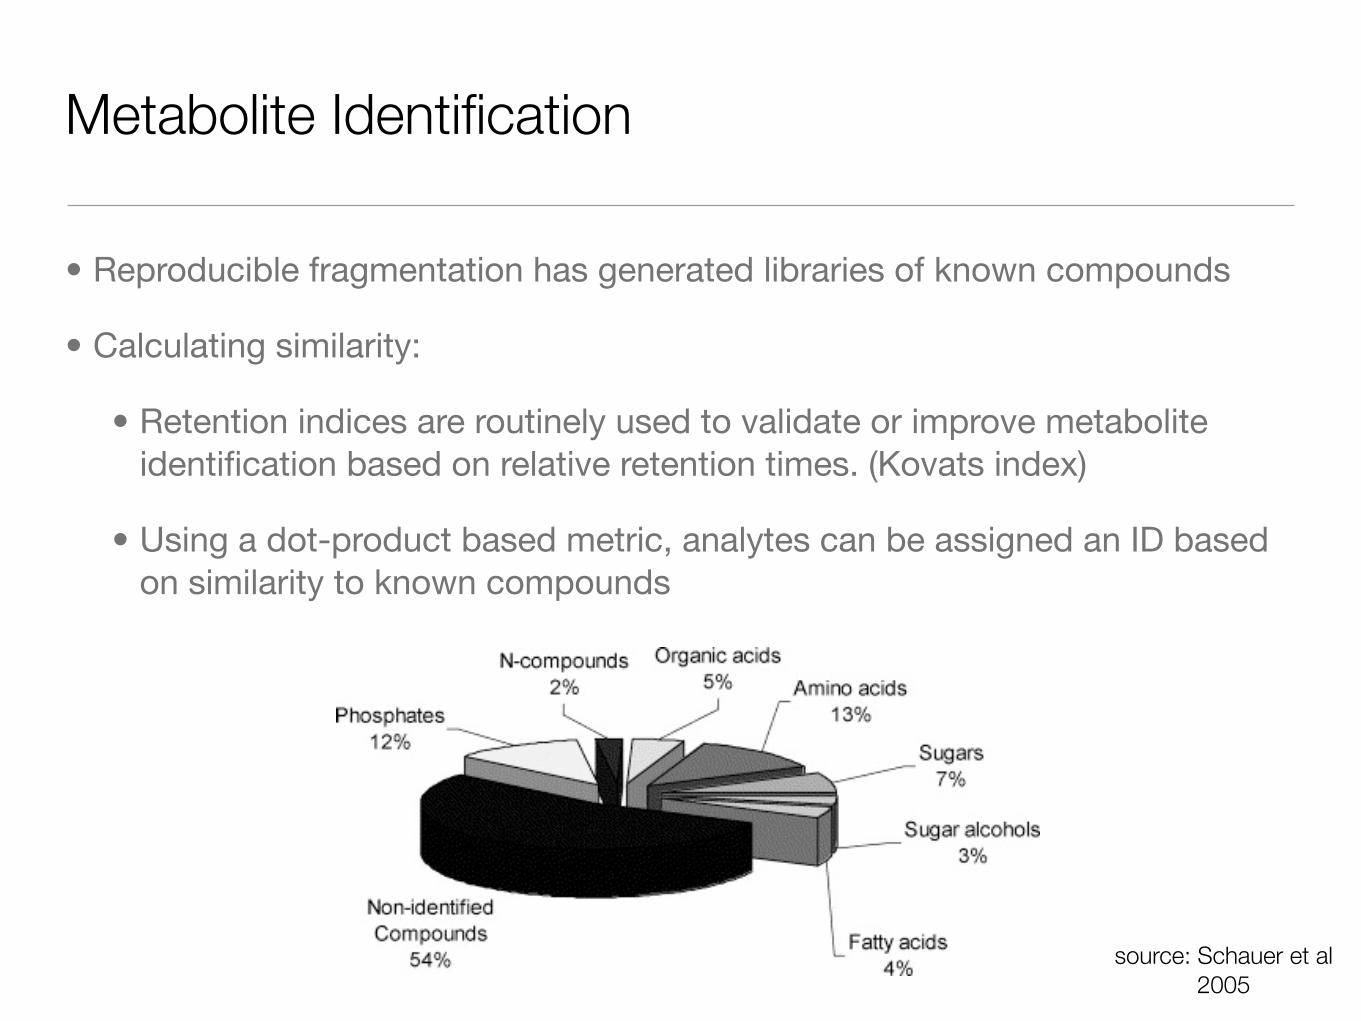
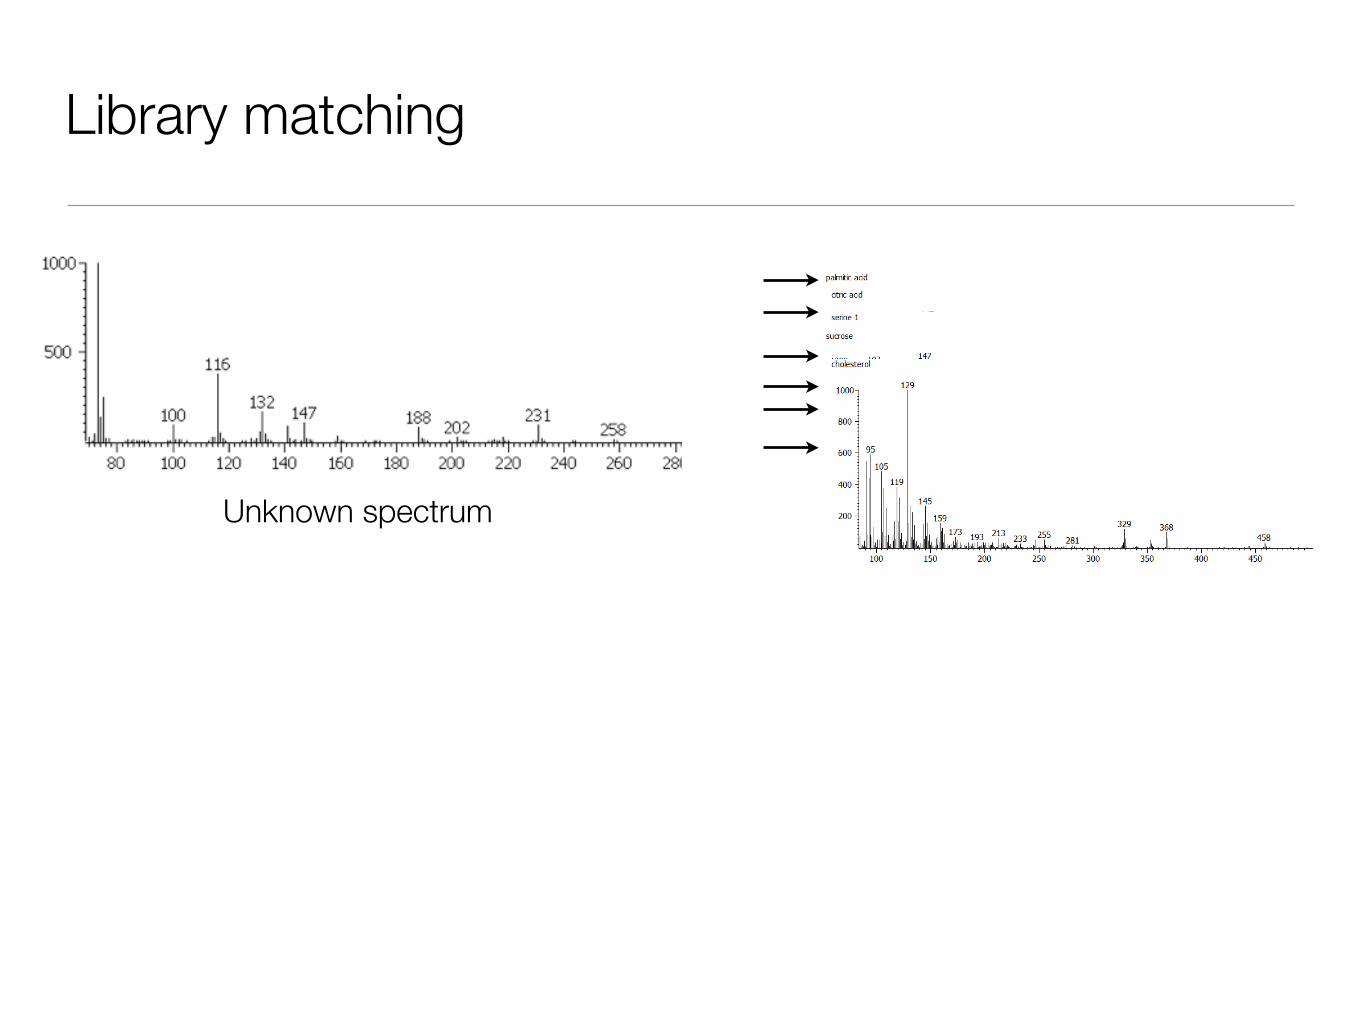
Metabolite Identification
• Reproducible fragmentation has generated libraries of known compounds
• Calculating similarity:
• Retention indices are routinely used to validate or improve metabolite identification based on relative retention times. (Kovats index)
• Using a dot-product based metric, analytes can be assigned an ID based on similarity to known compounds
source: Schauer et al 2005

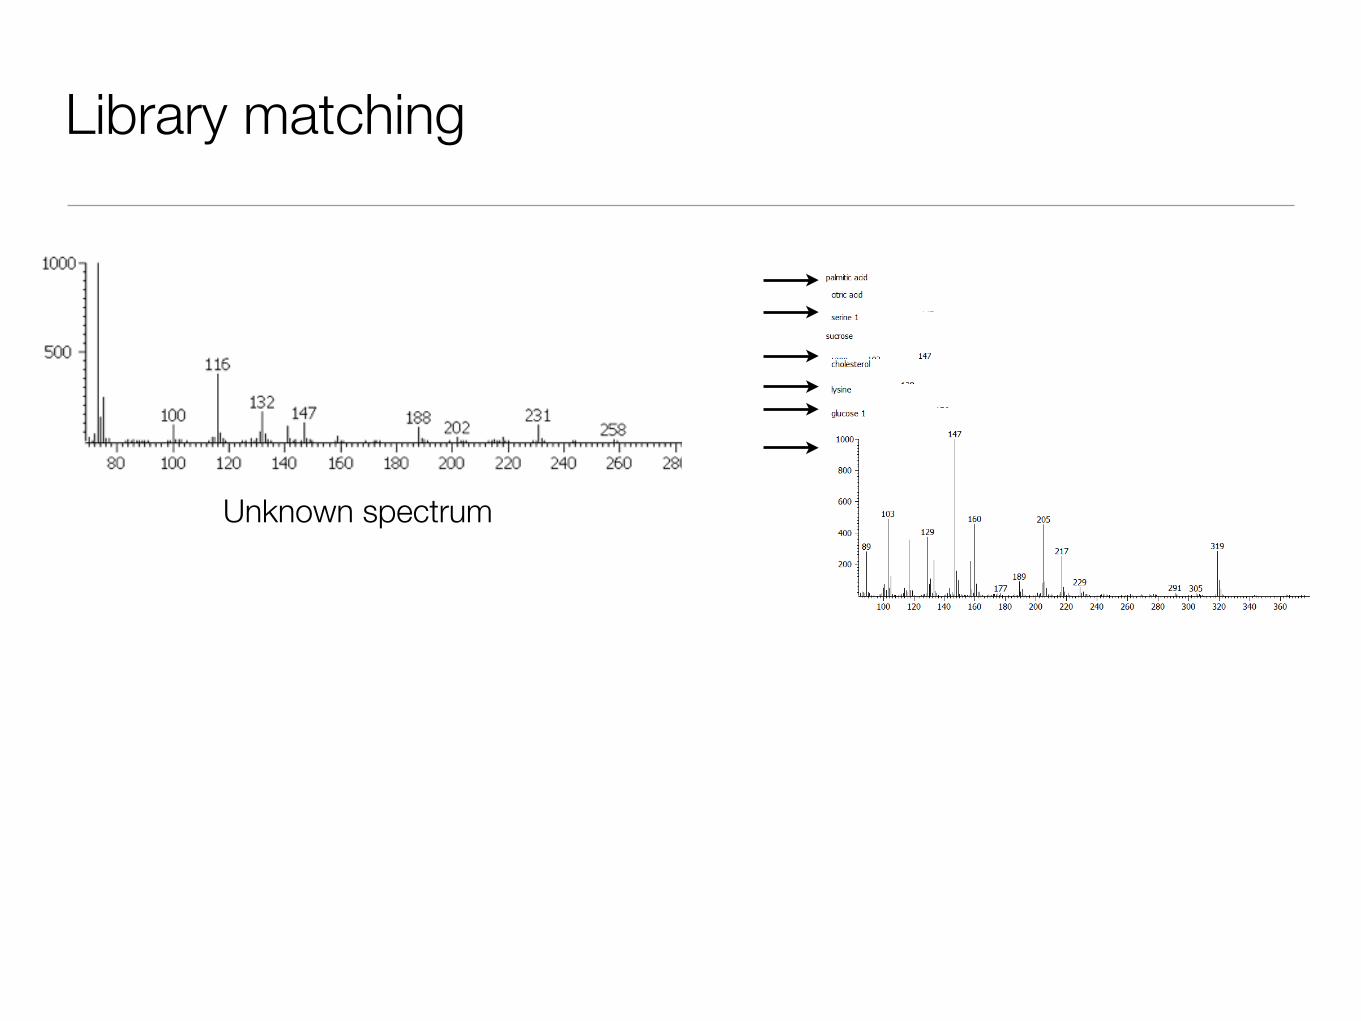
Library matching
Unknown spectrum

Library matching
Unknown spectrum

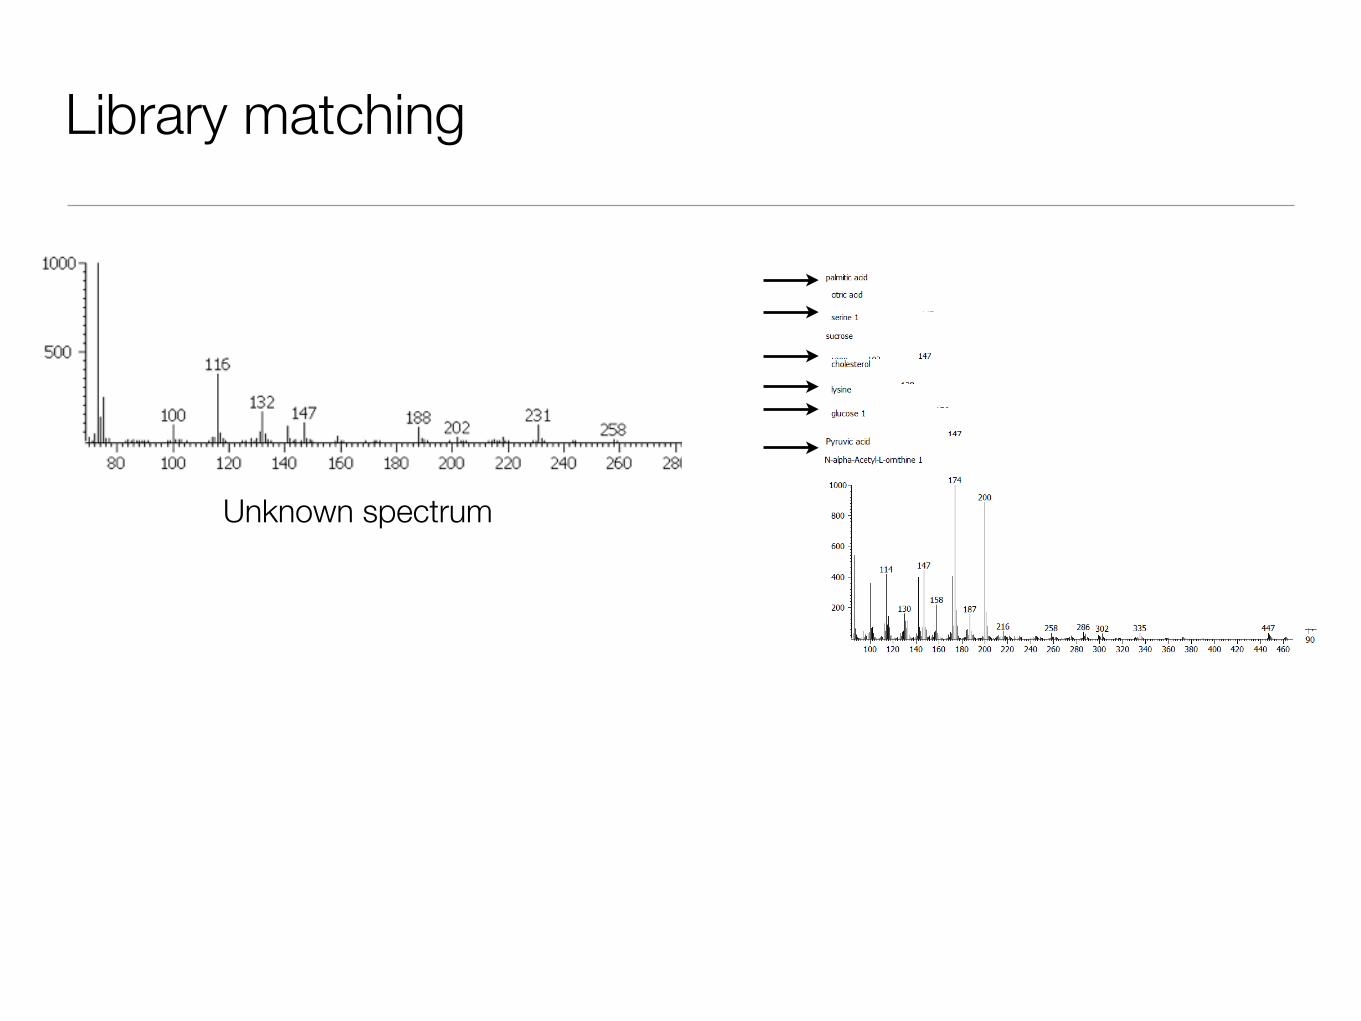
Library matching
Unknown spectrum

Library matching
Unknown spectrum
Library matching
Unknown spectrum

Library matching
Unknown spectrum
Library matching
Unknown spectrum

Library matching
Unknown spectrum
Library matching
Unknown spectrum
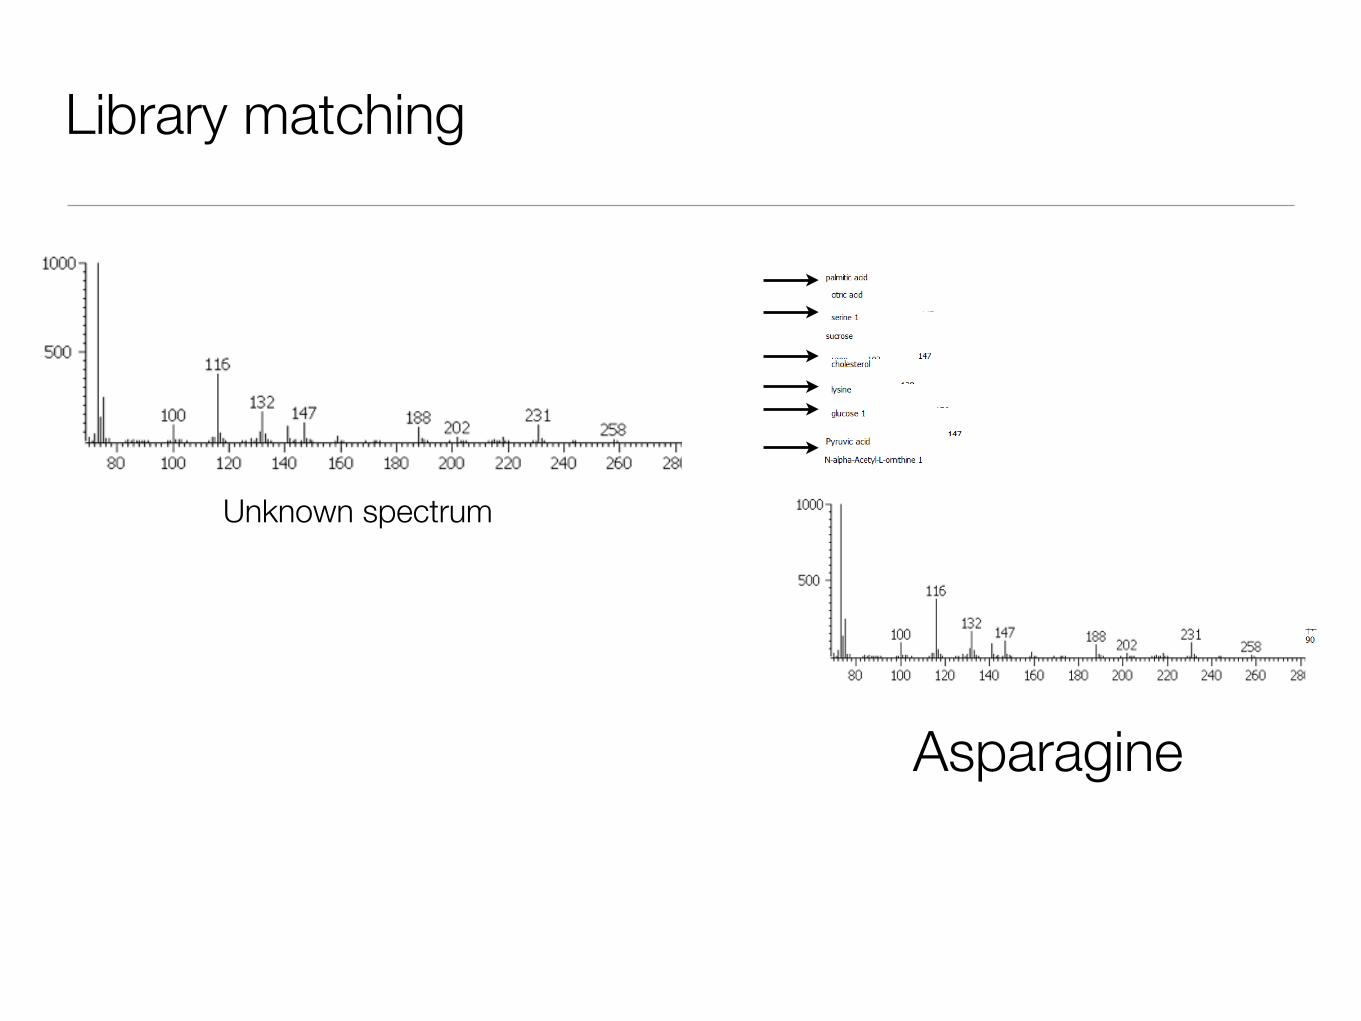
Library matching
Unknown spectrum
Asparagine

Metabolite ID advances
• Generation of publicly or commercially available databases
• NIST
• Golm
• Fiehn ($)
• Metabolite structure prediction algorithms
• Using clustering, modeling
• Improved algorithms for database searches

Why do GC-MS?
GC LC
Size
Polarity
Chromatography
Metabolite ID
Metabolites
Small Medium to Large
Requires derivitization to reduce polarity Better for polar
a.a., organic acidsfatty acids (short-medium)
nucleotides, lipids (including large)
Libraries Inferred composition by accurate mass
Highly reproducible-Retention indices Less critical

Applications for GC-MS
• Petroleum and Biodiesel
• Biofluids and tissues
• Breath
• Pesticides
• Pollutants in air, soil and water
• Yeast for brewing and wine-making

So you’ve decided to do GC...what to expect
• Experimental Design!! What question(s) do you want to answer?
• Sample preparation
• Data collection
• Preliminary Data analysis
• tools
• Metabolite identification

Sample procurement/preparation
• Samples should be snap frozen as quickly as possible after extraction and stored frozen until extraction
• Cultured cells should be grown in a minimal media if possible
• Avoid conditions where there are media/solvent components are present at high concentration
• e.g. Urine samples may be treated with urease
• Aspiration or filteringis the best way to remove media efficiently before freezing
• Extraction should be done under cold conditions when possible

Gas Chromatography for Metabolomics
• Gas chromatography requires all analytes to be volatile
• Common procedure for biological samples is derivatization
• Most common method is methoximation + silylation
• Basic Protocol:
• Dry all analytes by centrivap• Add methoxamine (stabilize ketones)• TMS reagent (generate volatile compounds)

Data collection
• You can expect anywhere from 500-5000 unfiltered peaks depending on extraction method, sample complexity and concentration
• Typical number of quantified metabolites found in the majority of samples (based on our typical 2D-GC protocol but it varies depending on column configuration and data collection speeds):
• Yeast: 150-200
• Serum: 200-250
• Urine: 350-500
• Tissue: 200-300
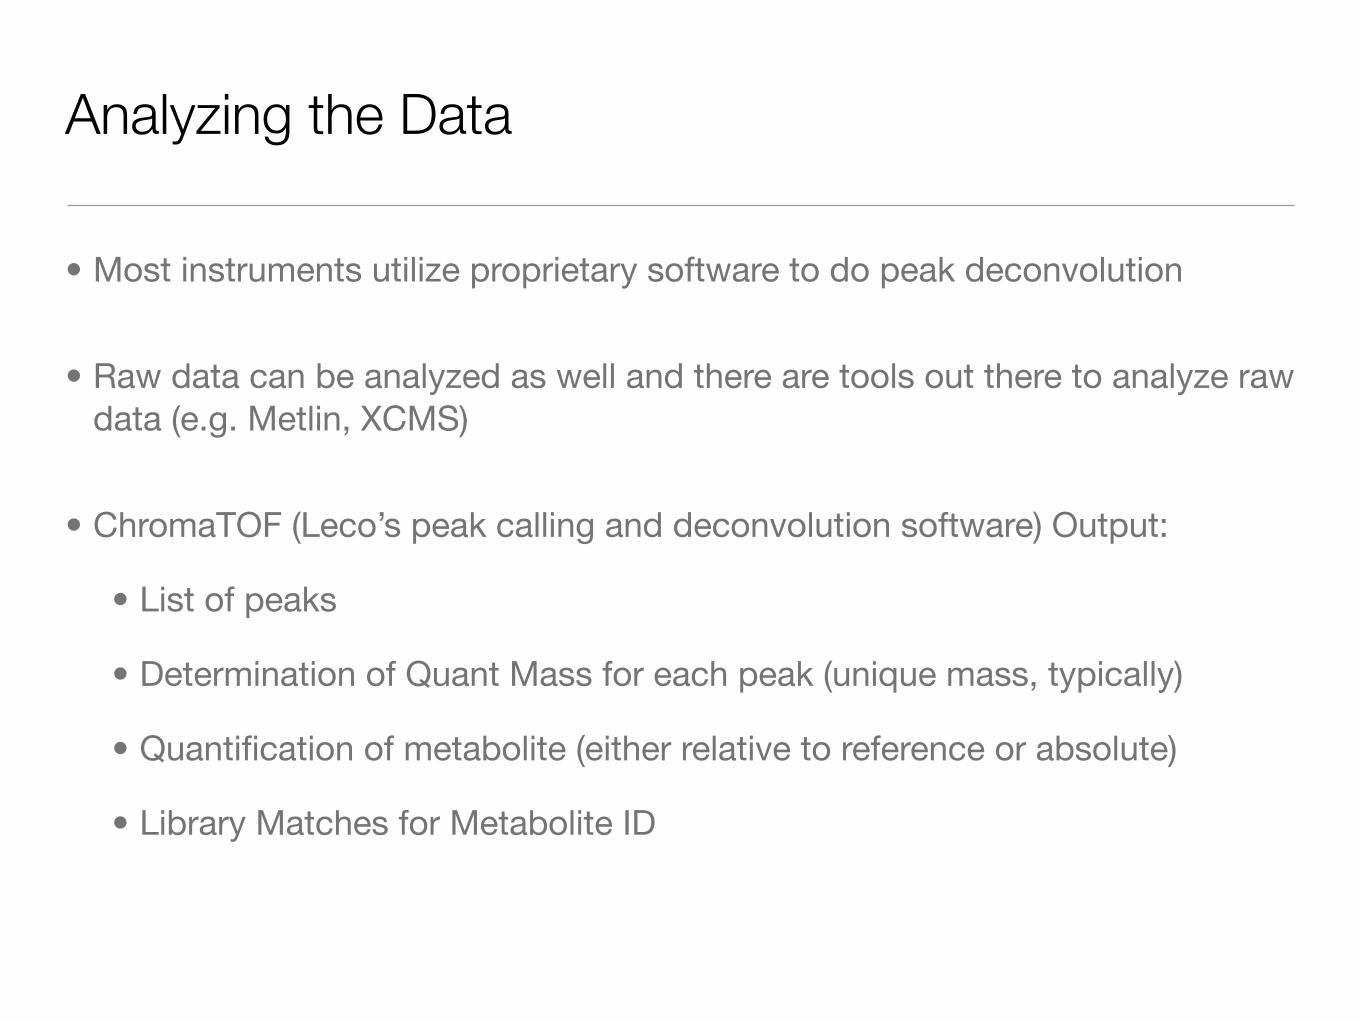
Analyzing the Data
• Most instruments utilize proprietary software to do peak deconvolution
• Raw data can be analyzed as well and there are tools out there to analyze raw data (e.g. Metlin, XCMS)
• ChromaTOF (Leco’s peak calling and deconvolution software) Output:
• List of peaks
• Determination of Quant Mass for each peak (unique mass, typically)
• Quantification of metabolite (either relative to reference or absolute)
• Library Matches for Metabolite ID
Steps to analyzing Metabolomics Data
1. Filtering Peaks
2. Alignment
3. Missing Values
4. Normalization
5. Statistical Analysis
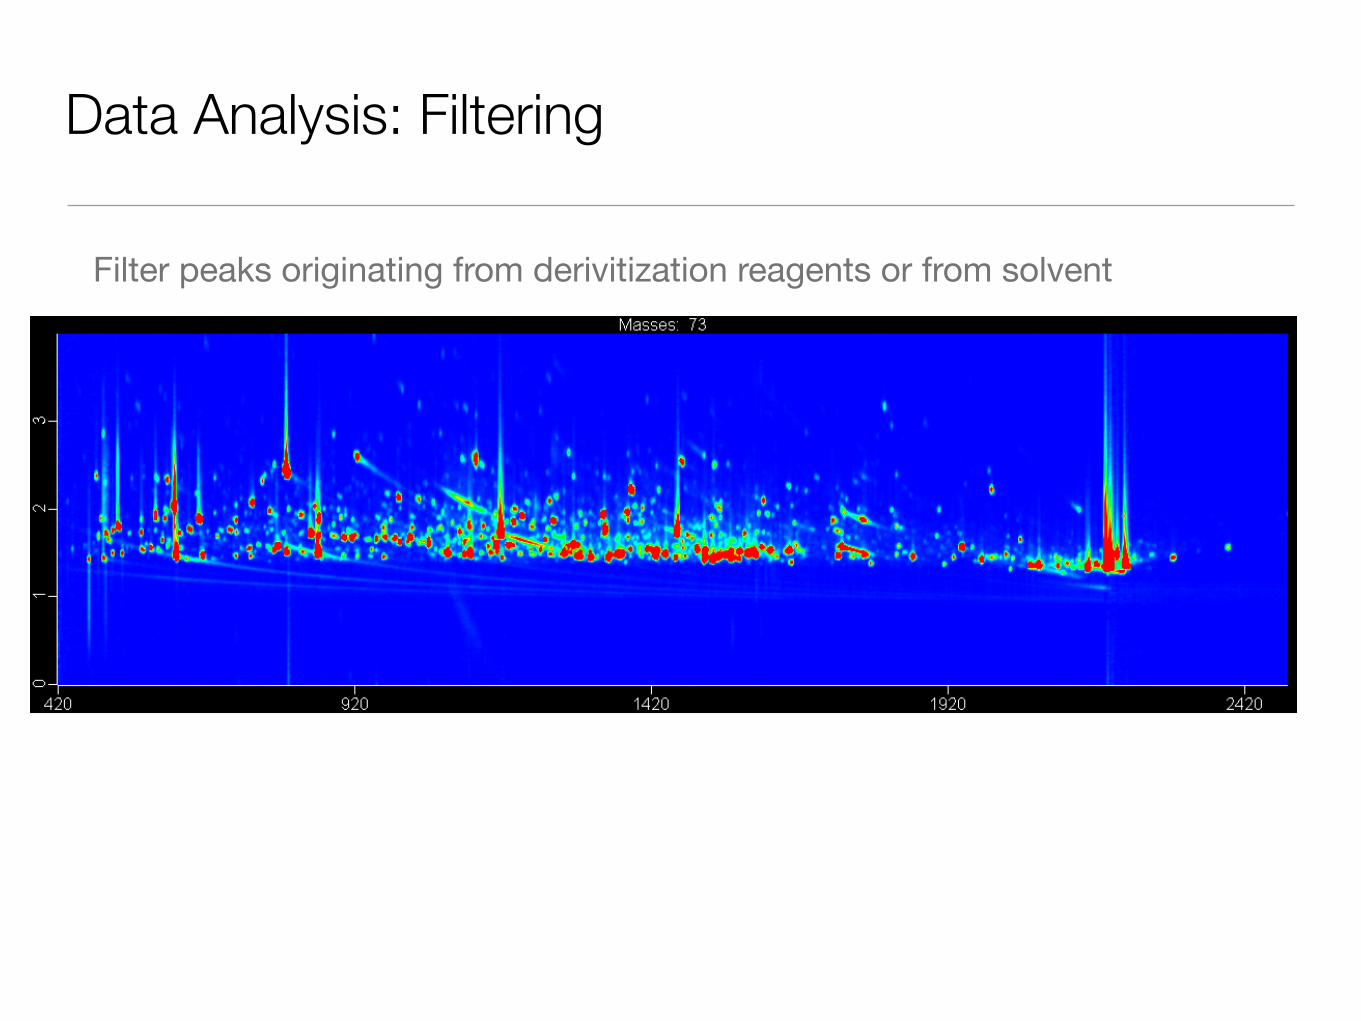
Data Analysis: Filtering
Filter peaks originating from derivitization reagents or from solvent
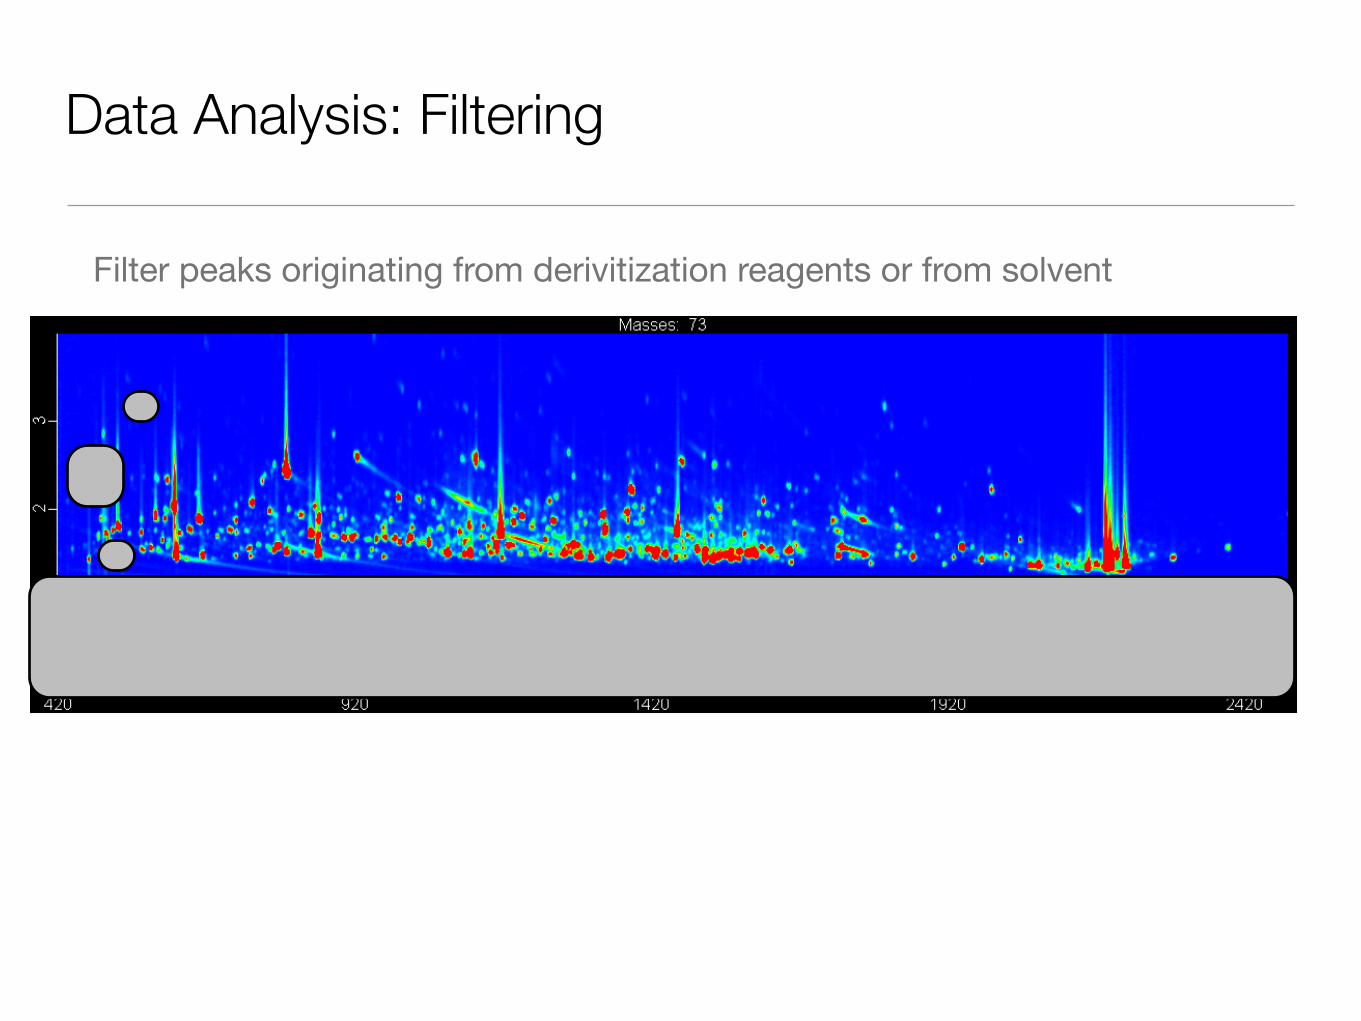
Data Analysis: Filtering
Filter peaks originating from derivitization reagents or from solvent
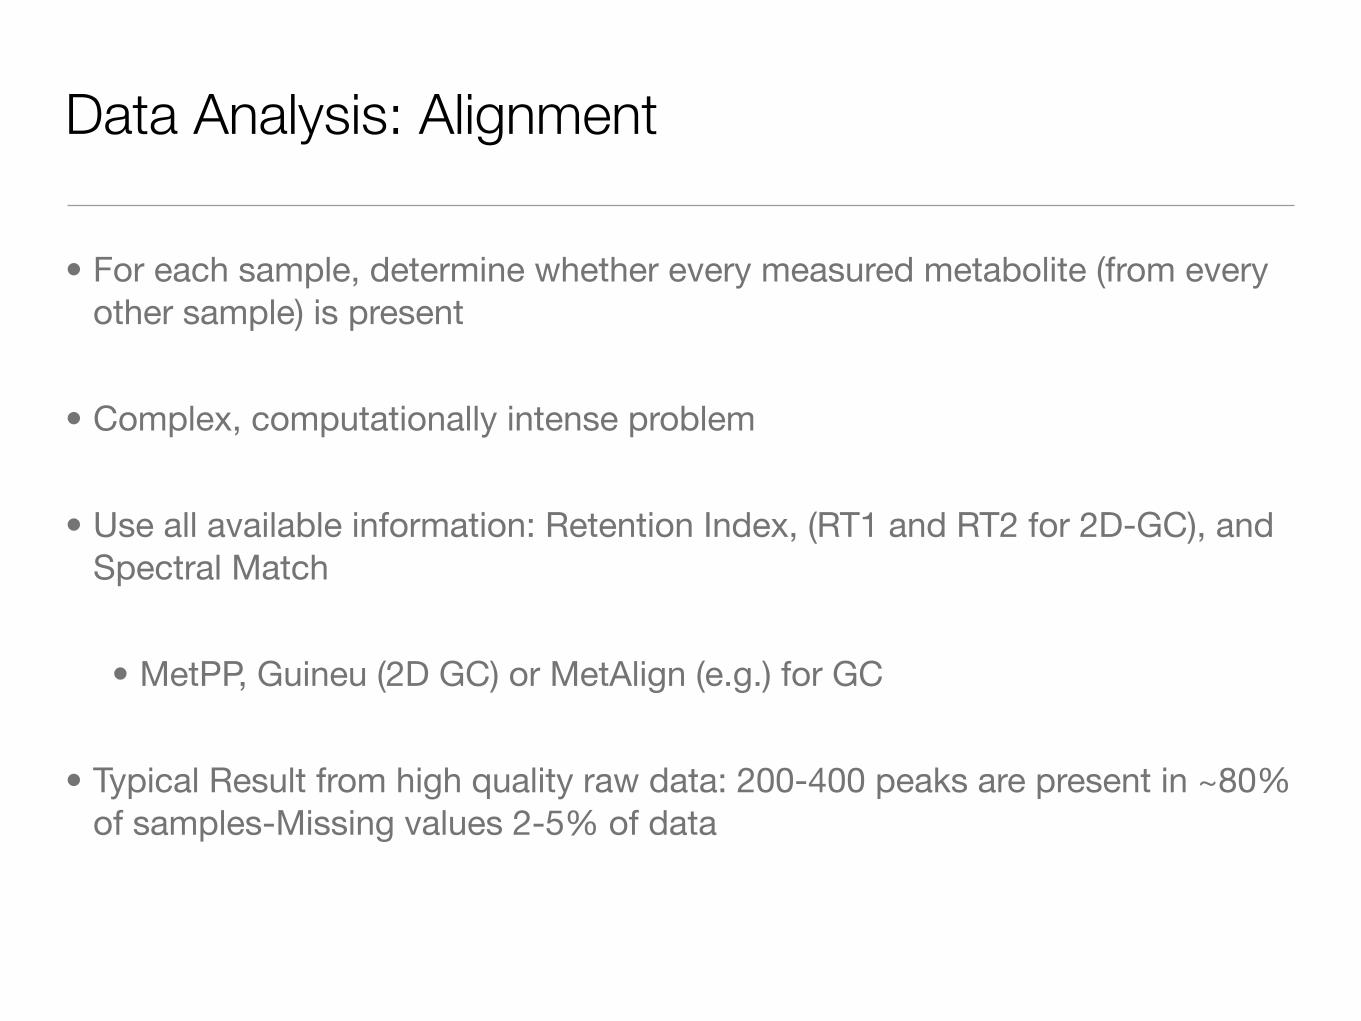
Data Analysis: Alignment
• For each sample, determine whether every measured metabolite (from every other sample) is present
• Complex, computationally intense problem
• Use all available information: Retention Index, (RT1 and RT2 for 2D-GC), and Spectral Match
• MetPP, Guineu (2D GC) or MetAlign (e.g.) for GC
• Typical Result from high quality raw data: 200-400 peaks are present in ~80% of samples-Missing values 2-5% of data

Data Analysis: Missing Values
• Conservative Filter: only consider metabolites present in the VAST majority of the samples (~95%)
• Assuming missing values are below detectable levels (0.5x lowest value for that metabolite)
• Assume missing values are present at an average or median level
• K nearest neighbor estimation-characterizes what values are present in other samples with the most highly correlated values for other metabolites to estimate a likely concentration
Limited to small number of metabolites (High
Confidence)
Can skew results if there are a large number of
missing values
Conservative, but can skew data
Moderately conservative , but not
possible if missing data is abundant

Data Analysis: Normalization
• Common Practice:
• Injection Control (A known amount of substance is injected with each sample. Those peaks should have the same area each time)
• Normalization by SUM (total area under the curve). Normalizes for overall sample concentration
• Clinical samples: normalization by creatinine or other specific analytes (not ideal for research, but sometimes necessary depending on application)
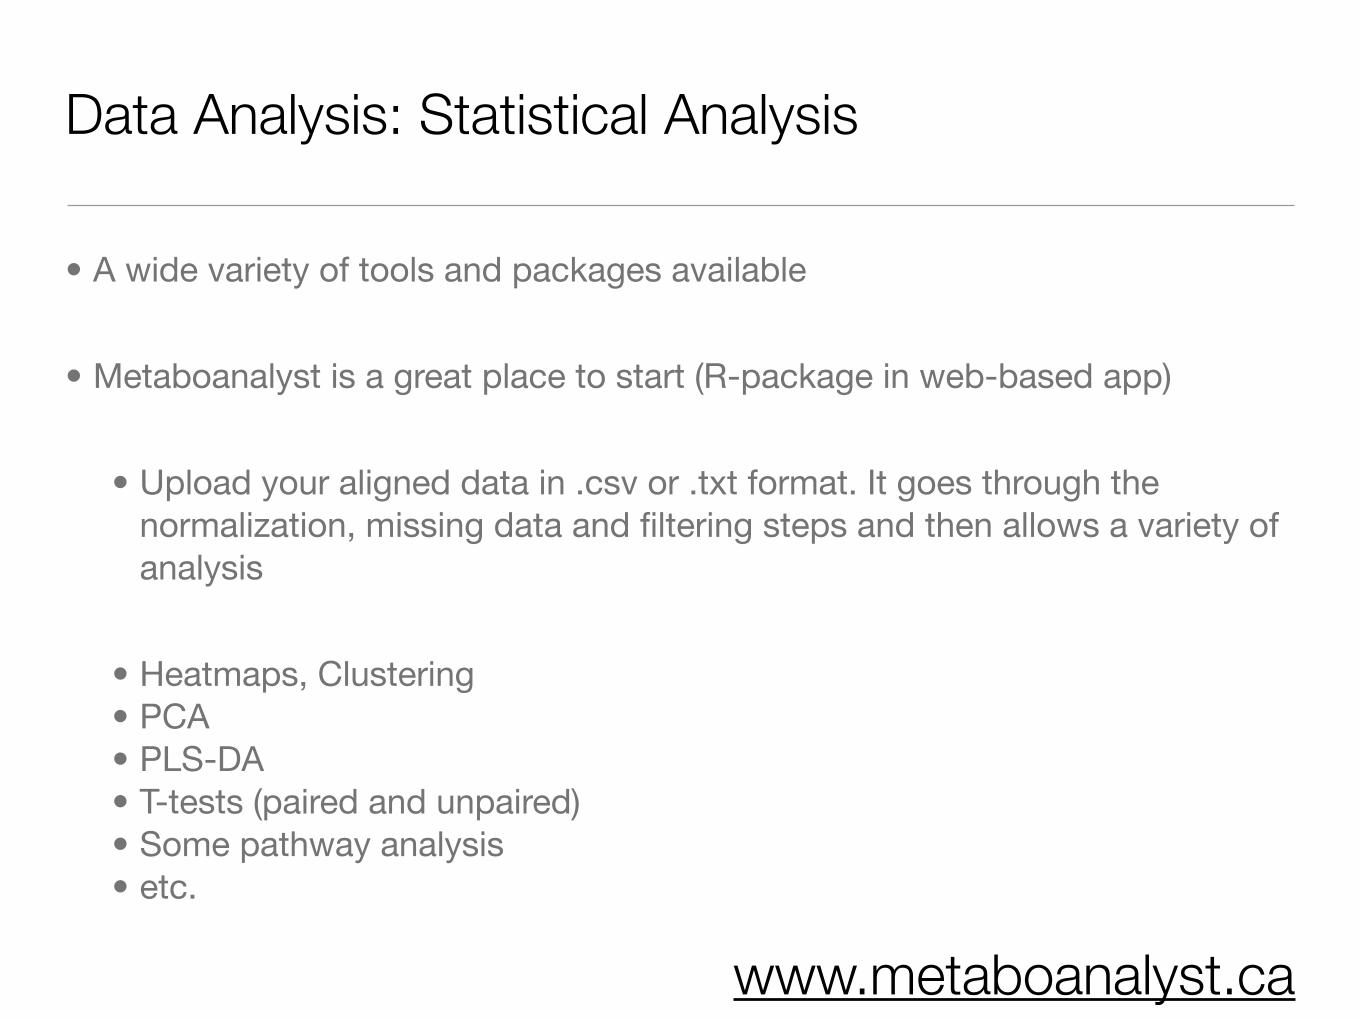
Data Analysis: Statistical Analysis
• A wide variety of tools and packages available
• Metaboanalyst is a great place to start (R-package in web-based app)
• Upload your aligned data in .csv or .txt format. It goes through the normalization, missing data and filtering steps and then allows a variety of analysis
• Heatmaps, Clustering• PCA• PLS-DA• T-tests (paired and unpaired)• Some pathway analysis• etc.
www.metaboanalyst.ca

Metaboanalyst
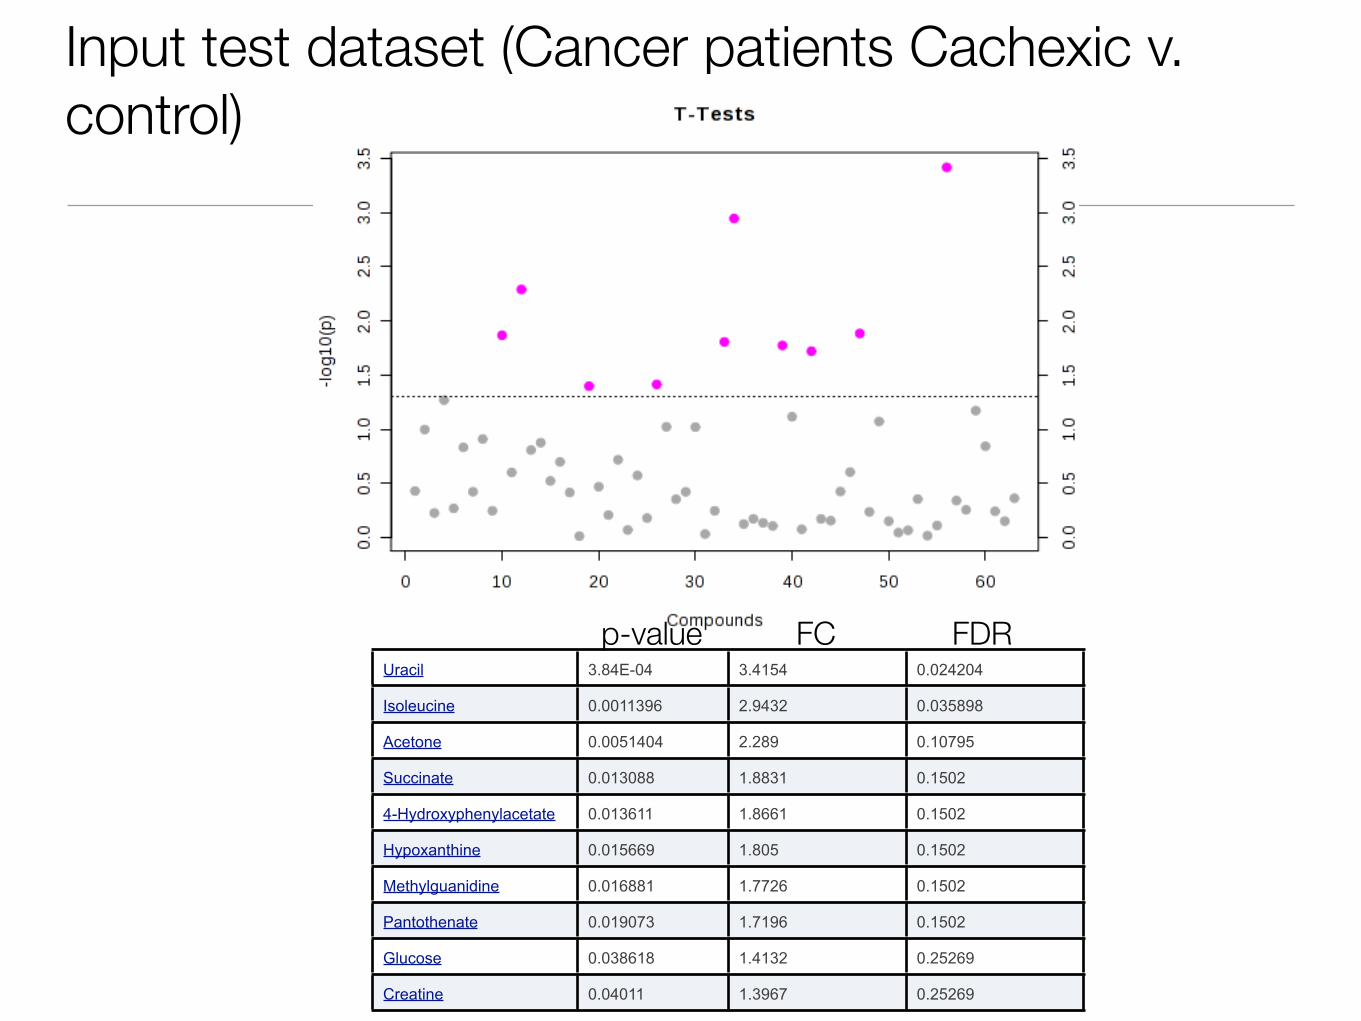
Input test dataset (Cancer patients Cachexic v. control)
Uracil 3.84E-04 3.4154 0.024204
Isoleucine 0.0011396 2.9432 0.035898
Acetone 0.0051404 2.289 0.10795
Succinate 0.013088 1.8831 0.1502
4-Hydroxyphenylacetate 0.013611 1.8661 0.1502
Hypoxanthine 0.015669 1.805 0.1502
Methylguanidine 0.016881 1.7726 0.1502
Pantothenate 0.019073 1.7196 0.1502
Glucose 0.038618 1.4132 0.25269
Creatine 0.04011 1.3967 0.25269
p-value FDRFC

Sample Data-top25 features by Ttest

Pathway Analysis
Glycine, Serine, Threonine
Alanine/Aspartate
Pantothenate and CoA
Inositol Phosphate

Data Analysis: Biological Understanding
• Web-based tools for pathway analysis
• KEGG (KEGGMapper) (all organisms)
• HMDB (Human Metabolome Database)
• Serum, urine, metabolome databases
• Yeast- Biochemical Pathways at yeastgenome.org
• ymdb (yeast metabolome database)
• Integrated analysis with genomic, proteomic data
• IMPaLA (similar to GO enrichment but specific to metabolic pathways)
• Ingenuity ($$$)
• Metaboanalyst (new)

Resources for GC-MS
• Restek Column Selection guide www.restek.com/• http://www.restek.com/pdfs/GNBR1724-UNV.pdf
• Leco• Agilent• Sigma https://www.sigmaaldrich.com/content/dam/sigma-aldrich/docs/
Aldrich/Bulletin/1/the-basics-of-gc.pdf• Books,Chapters, Reviews:
• Metabolomics by Wofram Weckwerth (Methods and Protocols)• “Mass Spectrometry based metabolomics” Dettmer 2007 http://
www.ncbi.nlm.nih.gov/pmc/articles/PMC1904337/• Analysis
• Metaboanalyst.ca• impala.molgen.mpg.de• hmdb.ca• golm database: gmd.mpimp-golmmpg.de• metlin.scripps.edu• xcmsonline.scripps.edu

Questions???
Thank you