Metabolomic and Proteomics Solutions for Integrated Biology and... · The only time they should use...
31
Metabolomic and Proteomics Solutions for Integrated Biology Christine Miller Omics Market Manager ASMS 2015
Transcript of Metabolomic and Proteomics Solutions for Integrated Biology and... · The only time they should use...

Metabolomic and Proteomics Solutions for Integrated Biology
Christine Miller
Omics Market Manager
ASMS 2015

Integrating Biological Analysis Using Pathways
R
R
HO
Protein B
Protein A
Protein X
• Identifies why the pathway is active• Suggests follow-on experiments
ASMS 2015 Omics VIP2
June 2, 2015
Presenter
Presentation Notes
The advantage of being able to plot metabolomics and proteomics results on pathways is that it can suggest why a pathway is active and indicate perhaps what the next experiment(s) should be

Agilent Instrumentation For Metabolomics
June 2, 2015
ASMS 2015 Omics VIP
3
QQQ6400 Series
Q-TOF6500 series
TOF6200 series
1290 Infinity IIUHPLC
Hi-DEF Q-TOF6500 series
7200BGC/Q-TOF
7000CGC/QQQ
5977AGC/MS
7100 CE
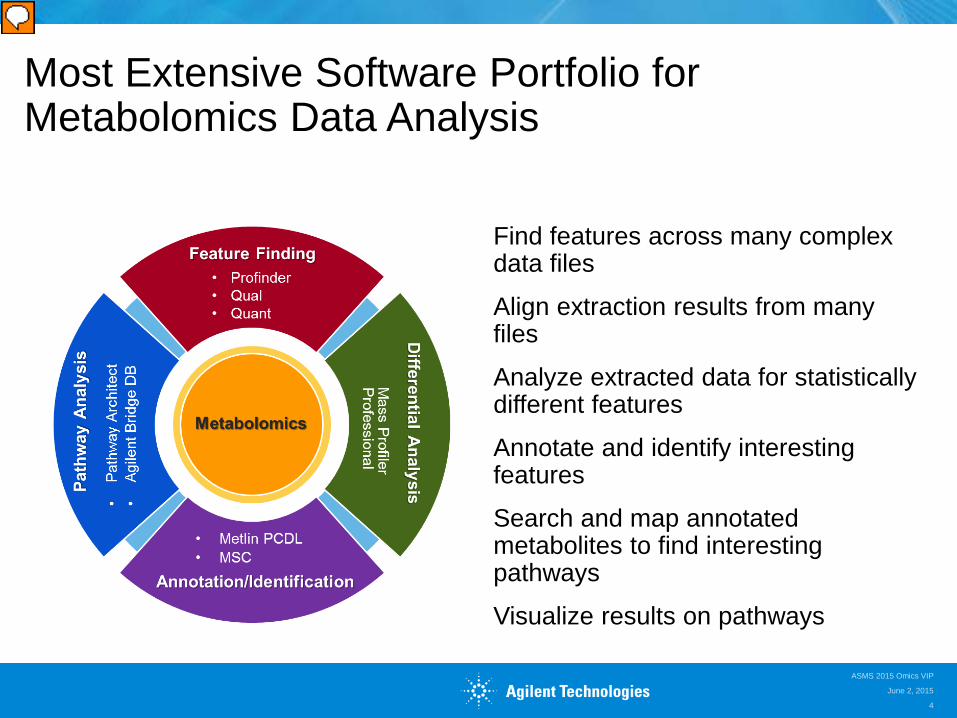
Most Extensive Software Portfolio for Metabolomics Data Analysis
Find features across many complex data files
Align extraction results from many files
Analyze extracted data for statistically different features
Annotate and identify interesting features
Search and map annotated metabolites to find interesting pathways
Visualize results on pathways
4
June 2, 2015
ASMS 2015 Omics VIP
Presenter
Presentation Notes
This wheel shows steps 2-5 from the previous slide’s workflow in a little more detail, listing the actual software packages that are used at each workflow stage. You can begin with Qual/Profinder or Quant for data analysis, then use MPP for differential analysis, PCDL database and library and MSC for identification and finally mapping onto pathways using pathway architect

Discovery & Pathway Directed Data Analysis
ASMS 2015 Omics VIP
5
Disc
over
yPa
thwa
y Dire
cted
Identify
ID Browser
Separate &Detect
LC-TOF/QTOF
LC-TOF/QTOF
Alignment & Statistics
Mass ProfilerProfessional
Mass ProfilerProfessional
Pathways
Pathway Architect
Pathway Architect
Feature Finding
Profinder
Profinder
June 2, 2015
Presenter
Presentation Notes
This cartoon shows two data processing workflows for data acquired in untargeted mode. The two workflows differ because: Untargeted analysis assumes no prior knowledge of what compounds are in the samples, and uses what we call a “naïve” feature finding process. It therefore requires the ID Browser to match compound to a database(s) of known compounds Pathway Targeted is used when the customer already knows what compounds they want to find in their data. Typically they are interested in the contents of pathways or networks (a collection of pathways). We have software that allows them to build a PCD of known pathway content using “Pathways to PCDL” software. The PCD can then be uploaded in Profinder to find only those features in the database they have built. This means they don’t have to do any identification using ID Browser.

Lipidomics: The Systematic Study Of The Entire Lipid Profile Of A Cell/Tissue/Organ/Organism Shotgun lipidomics using QQQ• Infusion based• Uses mixed scan functions• Quantitative using class internal stds• Class and composition info
Shotgun lipidomics using QTOF• Infusion based, MS/MS product ion• Quantitative using class internal stds• Class, composition and R-group info
Profiling lipidomics• LC/MS on accurate mass instrument• MS or MS/MS used for identification • Class, composition, R-group and isomer
June 2, 2015
ASMS 2015 Omics VIP
6
Biological functions include structure, storage, energy and signaling

Agilent Instrumentation For Lipidomics
June 2, 2015
ASMS 2015 Omics VIP
7
QQQ6400 Series
Q-TOF6500 series
TOF6200 series
1290 Infinity IIUHPLC
Hi-DEF Q-TOF6500 series
7200BGC/Q-TOF
7000CGC/QQQ
5977AGC/MS
1260 SFC

Overview Of Different Chromatographic Separations For Various Lipid Classes
June 2, 2015
ASMS 2015 Omics VIP
8
Lipid Category GC/MS LC/MS SFC/MS
Fatty acids (acyls) *** ** **Glycerolipids (triglycerides) * *** **Glycerophospholipids *** **Sphingolipids *** **Sterol lipids *** ** **Prenol lipids ** **Saccharolipids *** **Terpenes (plants) *** ** **Polyketides * ** **
*** is the best choice – chromatography impacts class of lipids resolved and detected!
Presenter
Presentation Notes
There are many approaches to separating lipids, each with advantages and disadvantages, however there is no single solution for all classes. As shown in Table 1, gas chromatography/mass spectrometry (GC/MS) has traditionally been used for fatty acyl characterization; this gives very detailed R-group information but loses the lipid level information due to the sample preparation (saponification). Terpenes and sterols are preferentially done by GC/MS due to superior chromatographic separation and ionization. Both liquid chromatography (LC) and supercritical fluid chromatography (SFC) are very broadly applicable techniques that preserve the lipid-level information, require no derivatization, and interface easily to atmospheric pressure mass spectrometers. The choice of chromatographic method impacts the class of lipids resolved and detected, and therefore depends on the application.

Agilent Instrumentation For Proteomics
June 2, 2015
ASMS 2015 Omics VIP
9
QQQ6400 Series
Q-TOF6500 series
HPLC-Chip
G1992A Nanospray source
Agilent Jet Stream source
1290 InfinityUHPLC
Agilent AssayMAP
Bravo

Most Extensive Software Portfolio for Proteomics Data Analysis
Identify proteins from discovery data-dependent analysis
and/or
Target peptides for proteins of interest
Analyze data for statistically different features
Search and map annotated proteins to find interesting pathways
Visualize results on pathways
10
Path
way
Ana
lysi
s
•P
athw
ay A
rchi
tect
•A
gile
nt B
ridge
DB Target Proteins
•S
kyline•
Quant
Mass Profiler Professional
Differential Analysis
Protein Identification
Spectrum Mill
Proteomics
June 2, 2015
ASMS 2015 Omics VIP

Discovery ProteomicsWorkflow
June 2, 2015
ASMS 2015 Omics VIP
11
Agile
nt L
CM
S
Separate &Detect
Identify orFeature Find
Statistics & Visualization
Pathway Analysis
Statisticsand
visualization
Pathway Architect
Omics data can be analyzed together in the same project
Mass Profiler Professional and Pathway Architect
Q-TOF
Spectrum MillSkylineProfinder
Presenter
Presentation Notes
MPP supports both Accurate and nominal mass data (all Agilent MS) GC/QTOF, LC/QTOF, LC/TOF GC/TQ, LC/QQQ, GCMSD
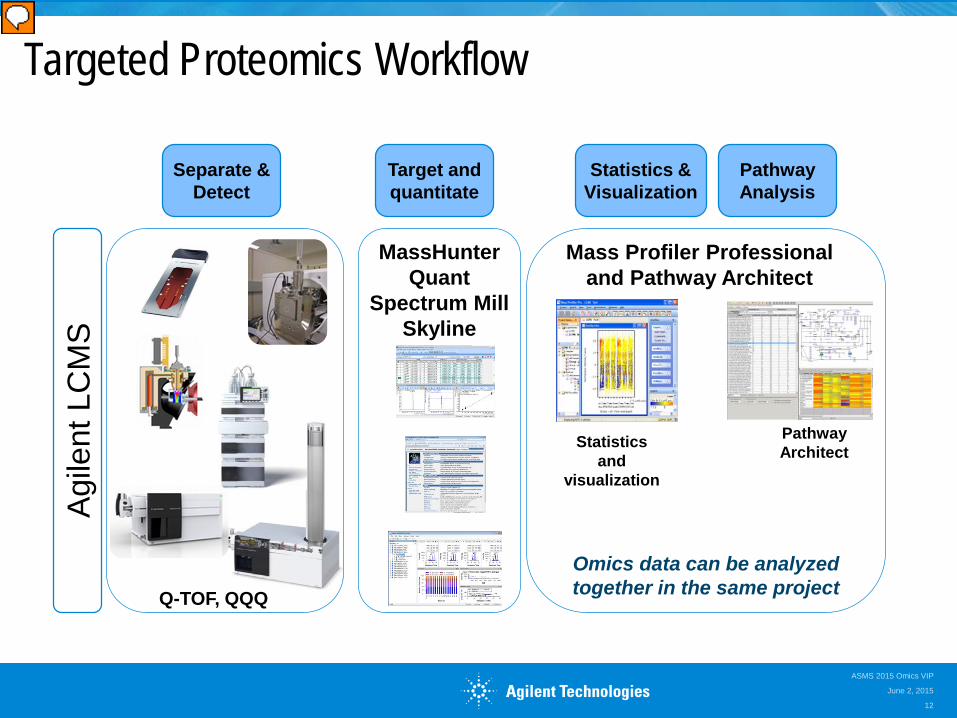
Targeted Proteomics Workflow
June 2, 2015
ASMS 2015 Omics VIP
12
Agile
nt L
CM
S
Separate &Detect
Target and quantitate
Statistics & Visualization
Pathway Analysis
Statisticsand
visualization
Pathway Architect
Omics data can be analyzed together in the same project
Mass Profiler Professional and Pathway Architect
Q-TOF, QQQ
MassHunter Quant
Spectrum MillSkyline
Presenter
Presentation Notes
MPP supports both Accurate and nominal mass data (all Agilent MS) GC/QTOF, LC/QTOF, LC/TOF GC/TQ, LC/QQQ, GCMSD

Integrated Biology SoftwareGeneSpring Suite
GXmRNA expressionAlternative SplicingmicroRNA expressionGenome-wide associationCopy Number Variation
Strand NGSDNA-Seq, RNA-SeqChIP-Seq, Methyl-Seq,small RNA-Seq &SureSelect QC
Mass Profiler ProfessionalProteomicsMetabolomics
Pathway ArchitectMulti-Omic Pathway AnalysisCanonical and NL Pathways
June 2, 2015
ASMS 2015 Omics VIP
13
Presenter
Presentation Notes
The resulting samples were processed using GeneSpring MPP 12.6. GeneSpring GX was used for the mRNA samples, and Mass Profiler Professional (MPP) for the metabolomics samples by LC/MS. Pathway analysis was performed using the Pathway Architect module of GeneSpring MPP.

LC/MS Data MiningMassHunter Profinder Batch Processor
14
Single software for untargeted and targeted feature extraction
Designed specifically for the needs of the metabolomics user
Processes many samples!
Minimizes false positive and negative results
Compound Centric: review and manual editing functionalities
Fast processing
Group 1
Group 2
Group 3
Group 4
Compound group level information
Details for a single compound
Stacked/overlaid EICs MS spectra
MassHunter Profinder Main Window
June 2, 2015
ASMS 2015 Omics VIP
Presenter
Presentation Notes
Customers should use Profinder for their data mining. The only time they should use MassHunter Qual is if they are doing some investigation of one or two files and want to identify the compounds ASAP without using MPP. Profinder is a very new piece of software for metabolomics and proteomics, designed to process a large number of LC/MS data files, quickly. It has been designed to allow rapid review and editing of peaks (re-integration or deletion). The added functionality of recursive analysis ensure fewer false positives and removal of missing values, which is critical for downstream differential and statistical analysis.

Statistics and Pathway AnalysisMass Profiler Professional (MPP)
June 2, 2015
ASMS 2015 Omics VIP
15
Designed for MS data
Performs many types of statistical analysis
• ANOVA, clustering, PCA, class prediction tools, correlation
ID Browser for compound annotation and identification
Export MS/MS target list
Pathway Architect for biological context
Presenter
Presentation Notes
The next step of data analysis is to find out what is the difference. Agilent offers a Statistics and Pathway Analysis tool called Mass Profiler Professional. It is designed primarily for MS data, it does also support NMR data. It performs many types of statistical analysis such as ANOVA, clustering , PCA and class prediction tools. Because it is designed for mass spectrometry perspective, ID browser was also built in to work with database software for compound annotation and identification. It also has the capability to export MS/MS target list for MS/MS experiment to confirm compound identifications that you decide whether they are relevant. Last, but certainly not the least, we really see this is part of active biology understanding, we built in pathway architect, so that you can put analyses into biological context

What’s Coming for Integrated Biology Workflows?
Peptide-level proteomics capability• New output file format for Skyline and Spectrum Mill
- Detailed peptide information exported for proteins- Agilent only capability
MassProfiler Professional 14.0• Supports new peptide-level export• Enables peptide-level queries, filters and visualization
Profinder 8.0- Faster (multi-threaded)- GC/MS support
ASMS 2015 Omics VIP16
June 2, 2015
Presenter
Presentation Notes
Today we announce a new release of Mass Profiler Professional (MPP) and Pathway Architect which will have support for KEGG (Kyoto Encyclopedia of Genes and Genomes) pathways, the premier source of pathway content with the highest number of journal citations. Agilent is the only mass spec provider that runs KEGG pathway analysis on the user’s desktop, avoiding the security problems of uploading data to the Internet. MPP 13 will also support Correlation Analysis, in which it will be possible for users to run an analysis of the mass spec results against metadata like crop location, crop variety, and sensory panel evaluations (e.g. sour, sweet, nutty, etc.)

Peptide-Level Export Empowers Deeper Analysis
Filter on peptides by
• Sequence
• PTMs
• Reproducibility
Statistical and correlation analysis at the peptide level
Visualize peptide results
• For proteins across samples
• On pathways
June 2, 2015
ASMS 2015 Omics VIP
17

Profinder 8.0: Scalable Performance and GC/MS Support
June 2, 2015
ASMS 2015 Omics VIP
18
RT
m/z
GC/MS by MFE:• Signals corresponding to different ions
elute at the same retention time• Each colored box = a unique co-elution
group = a compound
Library matching of MFE componentspectrum
MFE Spectrum
Spectral match 98.54
Library Spectrum

Brain Tumor Study: Background
Immunohistochemistry (protein) is the most commonly used method for patient sample evaluation
Using genomic signatures, glioblastoma multiforme (GBM) tumors have been classified into the following subtypes:• Classical
• Mesenchymal
• Neural
• Proneural
June 2, 2015
ASMS 2015 Omics VIP
19

Brain Tumor Study: Strategy
Research questions• Can we separate tumors profiled into subgroups using genomic
signatures? • Can we reduce the number of genes in signature without losing classifier
performance?
Approach• Use cancer genome atlas (TCGA) genomic signatures capable of
classifying GBM subtypes• Acquire discovery proteomics data from grade IV GBM tumors without
corresponding genomic information as well as control brain samples collected from epilepsy surgeries
• Leverage proteomics results to improve genomics classification
June 2, 2015
ASMS 2015 Omics VIP
20
Presenter
Presentation Notes
What analysis did I do? First two lines is situation. Next piece is what was strategy. What is going on in figures?

Brain Tumor Study: Workflow
Genomics
• Use hierarchical clustering of mRNA profiles to confirm genomic signatures• Assess data quality and bias using meta data framework analysis• Convert gene id to protein accession number
Proteomics
•Use PCA of discovery proteomics data to confirm tumor vs. control could be distinguished•Identify a set of differential proteins for the tumor samples•Use sample-sample correlation to cluster for QC and subtyping in proteomics experiment
Multi-omics
•Perform Venn analysis of differential proteins and genes•Find reduced set of genes for classifying tumor sub-types
June 2, 2015
ASMS 2015 Omics VIP
21
Presenter
Presentation Notes
A metabolomics discovery experiment starts with a well planned experimental design. 1) Once the samples are collected and prepared they are randomized and data is acquired by the appropriate LC-mass spectrometry technique (LC-TOF or LC-QTOF) or GC/MS. 2) For LC/MS data analysis, the data is extracted using in MassHunter Qual or the new MassHunter Profinder software (batch analysis) using the unbiased (untargeted) molecular feature extractor (MFE) algorithm. Alternatively, if a list of formulas is available that one wants to specifically query with, there is the algorithm “Find by Formula”. For GC/MSD data, the “Find by chromatographic deconvolution algorithm” is used for peak finding. 3) To identify metabolites we can import the extracted data files into Mass Profiler Professional (MPP), a statistical analysis and data visualization package. The “ID Browser” is launched from within MPP to search a database, such as METLIN database for LC/MS or Agilent-Fiehn library for GC/MS. Once the compounds have been annotated, we can launch pathway analysis. Pathway Architect can only map compounds with annotations and compound identifiers. It does not work on mass or empirical formula. 4) A user selected list can be submitted to Pathway Architect for analysis. The analysis process includes selecting the species and pathway database to use and mapping the abundances of the annotated metabolites onto corresponding nodes on the pathway diagrams such as found in WikiPathways and BioCyc/MetaCyc.

Brain Tumor Study: Hierarchical Clustering of Genomic Signatures
June 2, 2015
ASMS 2015 Omics VIP
22
Hierarchical clustering of 840 mRNA profiles from 173 GBM tumors
The four GBM subtypes were re-created

Brain Tumor Study: Metadata Analysis of Genomic Signatures
June 2, 2015
ASMS 2015 Omics VIP
23
Metadata obtained from TCGA was imported into the project
Metadata framework analysis of batch and sex was used to assess batch affects or bias

Brain Tumor Study: Principal Component Analysis of Genomic Signatures
June 2, 2015
ASMS 2015 Omics VIP
24
Principal component analysis of confirms subtypes in GBM samples from TCGA

Principle Component Analysis Plot Sample Clustered Correlation Plot
T – Tumor samples E – Epilepsy samples
Brain Tumor Study: Quality Control of Discovery Proteomics Data
Sample 5-T
June 2, 2015
ASMS 2015 Omics VIP
25
Presenter
Presentation Notes
Removed sample 5-T from further analysis as it clustered with normal brain samples in correlation analysis based on all entities (all proteins) list.

Tumor subgroups demonstrated, using 370 differential proteins, in both PCA and sample correlation showing the sample heterogeneity
Brain Tumor Study: Sample-sample Correlation and PCA of Discovery Proteomics Data
June 2, 2015
ASMS 2015 Omics VIP
26

Brain Tumor Study: Venn Analysis of Genomic and Proteomic Data Set
June 2, 2015
ASMS 2015 Omics VIP
27
54 Common Proteins
and Genes
840 Gene Signatures
370 Differential Proteins
Presenter
Presentation Notes
Translation of the 840 gene signature from gene expression experiment to the proteomics experiment (via Entrez ID), resulted in 655 proteins Data clean-up for missing values resulted in 97/655 proteins that are measured in 80% of samples of both tumor and control group. 54/97 proteins showed differential expression (T-test p-value >0.05 and FC>2.0) . GO analysis indicated the 54 proteins to be involved in cellular physiology functions and processes similar the 840 genes in expression experiment.

Brain Tumor Study: Comparison of 54 Genes Identified Using Proteomics Integration to Original Signature
Original Genomic Signature Genomic-Proteomic Signature
June 2, 2015
ASMS 2015 Omics VIP
28

Brain Tumor Study: Comparison of Original 370 Proteins to 54 Proteins Identified Using Integration
June 2, 2015
ASMS 2015 Omics VIP
29
Original 370 Protein List 54 Protein List after Integration

Integrated Biology Workflow Enhancements From Agilent to Accelerate Your ResearchComprehensive -omics workflows for metabolomics, proteomics, and genomics
Multi-variate software tools for integrated biology workflows
Pathway Architect provides data visualization directly on pathways
Peptide-level export and analysis coming in the Fall!
Profinder for GC/MS and enhanced speed coming in the Fall!
30June 2, 2015
ASMS 2015 Omics VIP

Thank you!
June 2, 2015
ASMS 2015 Omics VIP
31
Presenter
Presentation Notes
Thank you.