Metabolism of dicoumarol by liver microsomes from untreated and phenobarbital treated rats
9
Biochemical Pharmacology, Vol. 21, pp. 2303-2311. Pergamon Press, 1972. Printed in Great Britain. METABOLISM OF DICOUMAROL BY LIVER MICRO- SOMES FROM UNTREATED AND PHENOBARBITAL TREATED RATS FLEMMING CHRISTENSEN The Royal Dental College, Department of Biochemistry, Vennelyst Boulevard, 8000 ,~rhus C, DK, Denmark (Received 18 February 1972; accepted 18 April 1972) Abstract--The metabolism of dicoumarol by rat liver microsomes from untreated and phenobarbital treated rats was studied. Following differential centrifugation of rat liver homogenates only the 104,000g microsomal fraction supported dicoumarol metabolism. This was found to be strongly dependent on the presence of NADPH or a NADPH- generating system as well as oxygenand it was inhibited by CO. These data indicate that dicoumarol is metabolized by the mixed function oxidase of liver microsomes. The K,~ and V,~ for dicoumarol were determined using microsomes from untreated and pheno- barbital treated rats. The values of Kin were 5-0 × 10-s and 3"9 × 10⁻⁵ M, respectively, while the corresponding values of Vmwere 0.9 and 2"3 nmoles/mg protein/min. The significance of these results is discussed. Ir I~ASbeen shown repeatedly, that dicoumar01 is extensively metabolized in vivo by both man t'2 and animals 3-5 and that only minor amounts of the compound are excreted unchanged, t-5 At present no information is available concerning the chemical nature of the metabolites produced from dicoumarol although attempts to character- ize some of them have appeared. 6'7 Liver perfusion experiments have clearly pointed to the liver as the main site of dicoumarol metabolism s and many drugs apparently stimulate the hepatic metabolism of dicoumarol 9 (e.g. phenobarbital, 1° phenyrami- dol). ix Metabolism of dicoumarol in vitro, in the presence of liver microsomes and NADPH has been briefly reported by Burns et aL, 12 but a more detailed examination of the in vitro metabolism of dicoumarol is lacking. The present paper presents an investigation of dicoumarol metabolism in vitro by liver microsomes from both untreated and phenobarbital treated rats. MATERIALS AND METHODS Animals. White male rats of an inbred strain L from our animal stock were used throughout the experiments. The animals had free access to water and a laboratory food source (Altromin). In experiments with phenobarbital induced rats the animals were treated with phenobarbital (80 mg/kg) i.p. daily for 4 days, the last dose being administered 20 hr before sacrifice. Preparation of enzyme for dicoumarol metabolism. Two animals were used in each experiment. They were sacrificed by decapitation, the livers removed as quickly as possible and then homogenized with 2vol. of ice-cold 1"15~o KCI in 0.02 M Tris buffer pH 7.4 in a motor driven Teflonglasshomogenizer. All succeeding tissue manipu- lations were performed at 0-4 °. In the initial experiments the total homogenate was 23o3
-
Upload
flemming-christensen -
Category
Documents
-
view
212 -
download
0
Transcript of Metabolism of dicoumarol by liver microsomes from untreated and phenobarbital treated rats

Biochemical Pharmacology, Vol. 21, pp. 2303-2311. Pergamon Press, 1972. Printed in Great Britain.
METABOLISM OF DICOUMAROL BY LIVER MICRO- SOMES FROM UNTREATED AND PHENOBARBITAL
TREATED RATS
FLEMMING CHRISTENSEN
The Royal Dental College, Department of Biochemistry, Vennelyst Boulevard, 8000 ,~rhus C, DK, Denmark
(Received 18 February 1972; accepted 18 April 1972)
Abstract--The metabolism of dicoumarol by rat liver microsomes from untreated and phenobarbital treated rats was studied. Following differential centrifugation of rat liver homogenates only the 104,000 g microsomal fraction supported dicoumarol metabolism. This was found to be strongly dependent on the presence of NADPH or a NADPH- generating system as well as oxygen and it was inhibited by CO. These data indicate that dicoumarol is metabolized by the mixed function oxidase of liver microsomes. The K,~ and V,~ for dicoumarol were determined using microsomes from untreated and pheno- barbital treated rats. The values of Kin were 5-0 × 10 -s and 3"9 × 10 -5 M, respectively, while the corresponding values of Vm were 0.9 and 2"3 nmoles/mg protein/min. The significance of these results is discussed.
I r I~AS been shown repeatedly, that dicoumar01 is extensively metabolized in vivo by both man t'2 and animals 3-5 and that only minor amounts of the compound are excreted unchanged, t-5 At present no information is available concerning the chemical nature of the metabolites produced from dicoumarol although attempts to character- ize some of them have appeared. 6'7 Liver perfusion experiments have clearly pointed to the liver as the main site of dicoumarol metabolism s and many drugs apparently stimulate the hepatic metabolism of dicoumarol 9 (e.g. phenobarbital, 1° phenyrami- dol). ix Metabolism of dicoumarol in vitro, in the presence of liver microsomes and N A D P H has been briefly reported by Burns et aL, 12 but a more detailed examination o f the in vitro metabolism of dicoumarol is lacking. The present paper presents an investigation of dicoumarol metabolism in vitro by liver microsomes from both untreated and phenobarbital treated rats.
MATERIALS AND METHODS
Animals. White male rats of an inbred strain L from our animal stock were used throughout the experiments. The animals had free access to water and a laboratory food source (Altromin).
In experiments with phenobarbital induced rats the animals were treated with phenobarbital (80 mg/kg) i.p. daily for 4 days, the last dose being administered 20 hr before sacrifice.
Preparation of enzyme for dicoumarol metabolism. Two animals were used in each experiment. They were sacrificed by decapitation, the livers removed as quickly as possible and then homogenized with 2vol. of ice-cold 1"15~o KCI in 0.02 M Tris buffer pH 7.4 in a motor driven Teflonglasshomogenizer. All succeeding tissue manipu- lations were performed at 0-4 °. In the initial experiments the total homogenate was
23o3

2304 FLEMMING CHRI$'I'ENSEN
suitably diluted with KCI-Tris buffer pH 7.4 and assayed for enzyme activity. The total homogenate was centrifuged at 10,800 g for 15 min in a Sorvall RC 2 centrifuge. The sediment was suspended in KCI-Tris buffer to give an equivalent of 0.33 g liver per ml buffer and tested for its ability to metabolize dicoumarol (crude mitochondria). The supernatant was centrifuged at 104,0O0g for 60 min in a Spinco L 50 ultra- centrifuge. The microsomal pellet resulting was suspended in KCl-tris buffer pH 7.4 by gentle manual homogenization with a Teflon glass homogenizer to give the equiva- lent of 0.33 g liver per ml of buffer. The 104,000 g supernatant was likewise diluted and tested for its ability to support dicoumarol metabolism. The incubation experi- ments with dicoumarol were performed immediately following the preparation of the enzyme.
Incubation of dicoumarol with liver enzyme. All incubations were performed in duplicate in 25 ml conical flasks, a Dubnoff type metabolic shaking apparatus (Heto) was used for the incubations. Unless otherwise stated the incubations were carried out at 37 ° for 10 min at pH 7.4, each flask containing dicoumarol in the amounts stated in the individual experiments, MgCI2 (15/~moles), glucose-6-phosphate (20/~moles), NADP (1.5/zmoles), glucose-6-phosphate dehydrogenase (2 units) and Tris-HC1 (100/~moles). Dicoumarol dissolved in 0.1 M NaOH (0.1 ml) was added, followed first by the other components dissolved in 0-5 ml water and then 0.1 ml, 0-1 M HCI. The volume was adjusted with water in such a way that after the addition of the enzyme it amounted to a total of 3 ml. The reaction was initiated by the addition of enzyme and was stopped after the appropriate time by the addition of I ml, 1 M HCI to the flask. Flasks containing all the components mentioned above but in which the reaction was stopped at zero time were used as controls.
Experiments for demonstrating the influence of changing the atmosphere were performed in Warburg vessels. The gas phase was continually exchanged for 30 min before the enzyme, placed in the side arm, was added to the other components of the incubation mixture. Otherwise the experiments were conducted as described above.
Dicoumarol in the samples was determined by the paperchromatographic method of Christensen. 13
Protein was determined by the method of Lowry et al. 14 with bovine serum albumin as a standard.
Cytochrome P-450 was determined by the method of Omura and Sato, is a Shimadzu MPS-50 L recording spectrophotometer was used for the determinations. The differ- ence spectrum (CO-reduced minus reduced) was recorded and from the difference in extinction between 450 and 490 nm respectively, the content of cytochrome P-450 of microsomes was calculated using a molar extinction coefficient of 91 m M - l c m - ~ for the difference.
Extracts of the incubation mixtures obtained by the method of Christensen ~3 were applied to pre-coated silica gel TLC-plates (Merck, 20 × 20 cm, without fluorescence). The plates were developed with benzene-formic acid-ethyl methyl ketone (80 ml benzene saturated with HCOOH q-4 ml ethyl methyl ketone). The development was stopped when the solvent front advanced about I0 cm from the starting line. The plates were sprayed with diazotized o-dianisidine or sulphanilic acid as described by Christensen 1~ to make spots of dicoumarol or its metabolites visible.
Chemicals. Dicoumarol (3,3'-methylenebis(4-hydroxycoumarin)) was obtained from a commercial source.

Metabolism of dicoumarol 2305
Glucose-6-phosphate, glucose-6-phosphate dehydrogenase, NADP, NADH, N A D P H and uridine-5'-diphosphoglucuronate were obtained from Boehringer & Soehne, Mannheim, Germany. All other chemicals used were analytical reagents.
RESULTS
The subcellular localization of enzyme activity. Table 1 shows a representative experiment on the subcellular distribution of dicoumarol metabolism. Whereas the total homogenate revealed a distinct activity, the fraction sedimenting at 10,800 g showed only very slight if any activity. The fraction sedimenting at 104,000 g (micro- seines) was most effective in promoting dicoumarol metabolism, it was about 10-times
TABLE I . METABOLISM OF DICOUMAROL BY VARIOUS FRACTIONS OF LIVER HOMO-
GENATE FROM NORMAL RATS
Cell fraction
Dicoumarol metabolized* nmoles/10 min
per ml cell fraction per mg protein
Total homogenate 13.98 0.36 Crude mitochondria 0 0 Microsomes 31-82 3-75 104,000 g supernatant 0 0
* Dicoumarol (298 nmoles) was incubated under standard conditions with 1 ml of the various cell fractions prepared as described in Materials and Methods.
more potent than the total homogenate when compared on a milligram protein basis. The I04,000 g supcrnatant fraction was inactive and did not enhance the metabolism of dicoumarol when added to the microsomal fraction. The results therefore, strongly indicate that the microsomal fraction is of major importance in supporting the metabolism of dicoumarol. All succeeding experiments were therefore conducted with
~o _E 30'
20" E
10,
g o ~5
Untreated
• Dicoumarol 5 0
o B 055
40,
o 2'0 go 8'0
Phenobarbital
• Dicoumarol
o B 055
' 2 0
Incubation time, rain.
"50 =;
w o 4 o ~
• 30 ~ o .
5
B.P. 21117--~
FIG. 1. The relationship between the amount of dicoumarol metabolized and the incubation time. The amounts of metabolite B 055 produced from dicoumarol are also shown in arbitrary units. Liver microsomes from untreated or phenobarbital treated rats were incubated with dicoumarol
(298 nmoles) for the periods indicated and otherwise as described in Materials and Methods.
2306 FLEMMING CHRISTENSEN
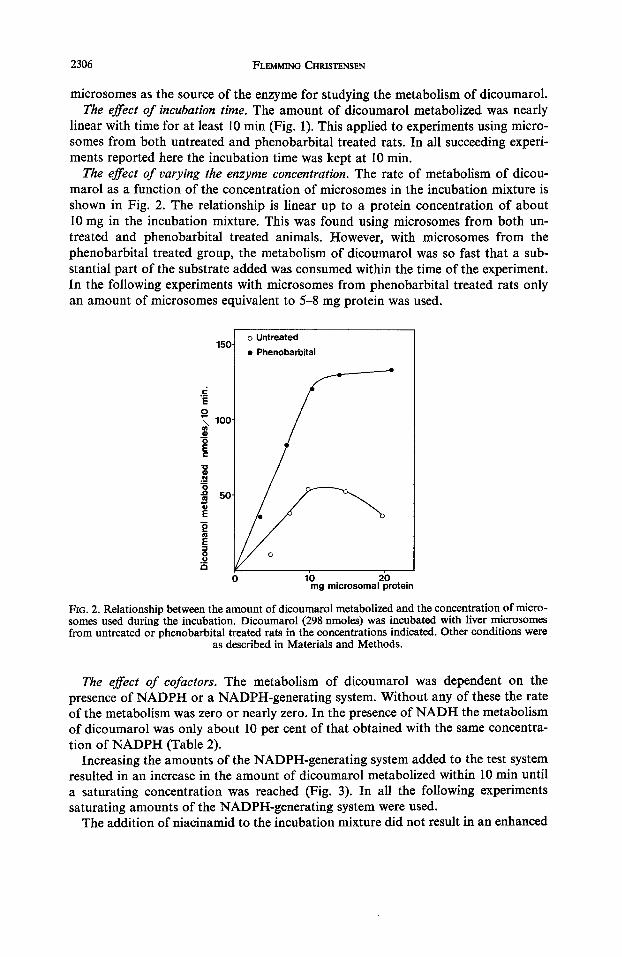
microsomes as the source of the enzyme for studying the metabolism of dicoumarol. The effect of incubation time. The amount of dicoumarol metabolized was nearly
linear with time for at least 10 min (Fig. 1). This applied to experiments using micro- somes from both untreated and phenobarbital treated rats. In all succeeding experi- ments reported here the incubation time was kept at 10 min.
The effect of varying the enzyme concentration. The rate of metabolism of dicou- marol as a function of the concentration of microsomes in the incubation mixture is shown in Fig. 2. The relationship is linear up to a protein concentration of about 10 mg in the incubation mixture. This was found using microsomes f rom both un- treated and phenobarbital treated animals. However, with microsomes f rom the phenobarbital treated group, the metabolism of dicoumarol was so fast that a sub- stantial part of the substrate added was consumed within the time of the experiment. In the following experiments with microsomes f rom phenobarbital treated rats only an amount of microsomes equivalent to 5-8 mg protein was used.
.=2 E 0
e 0 E= "0
I 0
.Q ¢u ¢p
E
0 ¢g
E
._u
1 5 0
1 0 0
5 0 ¸
o Untreated
• Phenobarbital
0 10 2 0 mg rnicrosomal protein
FIG. 2. Relationship between the amount of dicoumarol metabolized and the concentration of micro- somes used during the incubation. Dicoumarol (298 nmoles) was incubated with liver microsomes from untreated or phenobarbital treated rats in the concentrations indicated. Other conditions were
as described in Materials and Methods.
The effect of cofactors. The metabolism of dicoumarol was dependent on the presence of N A D P H or a NADPH-generat ing system. Without any of these the rate of the metabolism was zero or nearly zero. In the presence of N A D H the metabolism of dicoumarol was only about 10 per cent of that obtained with the same concentra- tion of N A D P H (Table 2).
Increasing the amounts of the NADPH-generat ing system added to the test system resulted in an increase in the amount of dicoumarol metabolized within 10 min until a saturating concentration was reached (Fig. 3). In all the following experiments saturating amounts of the NADPH-generat ing system were used.
The addition of niacinamid to the incubation mixture did not result in an enhanced

Metabolism of dicoumarol 2307
TABLE 2. EFFECT OF NADH AND NADPH ON THE META- BOLISM OF DICOUMAROL BY RAT LIVER MICROSOMES FROM
PHENOBARBITAL-TREATED RATS
Dicoumarol metabolized* Coenzyme nmoles/lO min/mg protein
NADH 2.06 NADPH 21-30
* The experiments were performed as described in Materials and Methods except that NADH or NADPH (4/~moles) were used instead of the NADPH-generating system.
me tabo l i sm o f d icoumaro l . Likewise u r id ine -5 ' -d iphosphog lucurona te had no s t imu- la t ing effect on d i coumaro l me tabo l i sm by liver microsomes even in the presence of the 104,000 g superna tan t f ract ion.
0'.5 1'.o ml NADPH-generating system
FIG. 3. The relationship between the amount of dicoumarol metabolized and the amount of NADPH- generating system used during the incubation. One ml of the NADPH-generating system contained: 40 t~moles glucose-6-phosphate, 3 t~moles NADP, 4 units of glucose-6-phosphate dehydrogenase. 0"75 ml microsomes (,~7.1 mg protein) from phenobarbital treated rats were incubated with 298
nmoles dicoumarol. Other conditions were as described in Materials and Methods.
The effect ofsubstrate concentration. The results o f vary ing the subs t ra te concent ra - t ion are shown in the fo rm o f L ineweave r -Burk plots in Fig. 4 using mic rosomes f rom bo th un t rea ted and phenoba rb i t a l t r ea ted rats. The Kin" and Vm-values ca lcula ted f rom the d i ag rams are given in Table 3. Whi le the Km-values differed only sl ightly between the un t rea ted and phenoba rb i t a l t rea ted rats, the Vm-value for the la t te r g roup was a b o u t 2.5 t imes greater t han tha t for the un t rea ted group,

2308 FLEMMING CHRISTENSEN
: ± v I
"~ 4~
x ._c 3 - E >¢
'T "6 2 "
o Untreated
• Phenobarbital
-,/0 -3'o -20 - lo o lb 25 35 4o ~s]mM -1
FIG. 4. Lineweaver-Burk plots of dicoumarol metabolism. The plots were based on velocity measure- ments at different concentrations of dicoumarol using mierosomes from untreated and phenobarbital treated rats. The individual points represent the means of three separate experiments with untreated rats and four separate experiments with phenobarbital treated rats. The lines were drawn according
to calculations based on the methods of least squares.
TABLE 3. Km AND Vm FOR DICOUMAROL METABOLIZED BY LIVER MICROSOMES FROM UNTREATED AND PHENOBARBITAL TREATED RATS
Animals (M) (nmoles/mg protein/10 min)
Untreated rats 5"0 × 10 -5 9"0 Phenobarbital treated
rats 3-9 × 10 -5 23.3
The K,- and Vm-values were determined from the Lineweaver-Burk plots of Fig. 4.
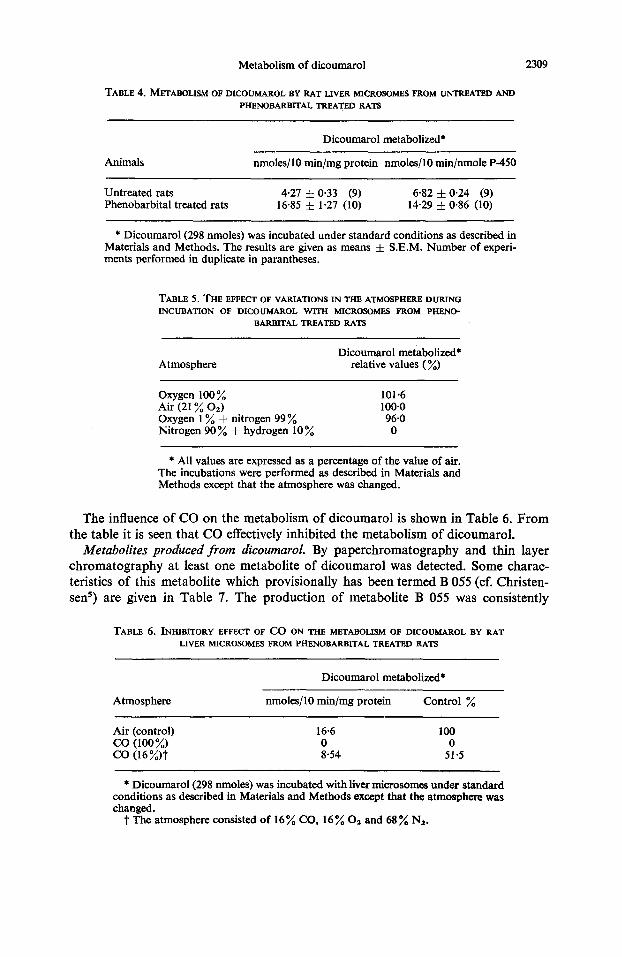
The metabolism of dicoumarol at a fixed concentration of this compound (0.1 mM) was determined in a series of experiments using microsomes from untreated and phenobarbital treated rats (T~ible 4). In these experiments all factors known to influence the rate of dicoumarol metabolism were kept at an optimum. The rate of the met- abolism was calculated as the amount of dicoumarol metabolized per unit time per mg protein or per nmole of cytochrome P-450. In both cases the results from the group of untreated animals differed significantly from those of the phenobarbital treated group. It is to be noted, that the rate of metabolism was about four times higher in the experiments with microsomes from phenobarbital treated animals than with microsomes from normal rats when compared on a mg protein basis. However, when the results were compared on a molar cytochrome P-450 basis the phenobarbital treated group was only twice as high as the untreated group.
The effect of the atmosphere during incubation. From Table 5 it is evident that the metabolism of dicoumarol was dependent on the oxygen concentration of the gas phase. When the incubation of dicoumarol with liver microsomes from phenobarbital treated rats was performed under an atmosphere of nitrogen + hydrogen the amount of dicoumarol metabolized was zero or only a few per cent of that obtained when ordinary air was used.
Metabolism of dicoumarol
TABLE 4. METABOLISM OF DICOUMAROL BY RAT LIVER M/CROSOMES FROM UNTREATED AND
PHENOBARBITAL TREATED RATS
2309
Dicoumarol metabolized*
Animals nmoles/10 min/mg protein nmoles/10 rnin/nmole P-450
Untreated rats 4.27 4- 0-33 (9) 6.82 4- 0.24 (9) Phenobarbital treated rats 16.85 :~ 1.27 (10) 14.29 4- 0.86 (10)
* Dicoumarol (298 nmoles) was incubated under standard conditions as described in Materials and Methods. The results are given as means 4- S.E.M. Number of experi- ments performed in duplicate in parantheses.
TABLE 5. T H E EFFECT OF VARIATIONS IN THE ATMOSPHERE DURING INCUBATION OF DICOUMAROL W I T H MICROSOMES FROM PHENO-
BARBITAL TREATED RATS
Atmosphere Dicoumarol metabolized*
relative values (%)
Oxygen 100% 101.6 Air (21 • 02) 100"0 Oxygen 1 9/o + nitrogen 99 % 96"0 Nitrogen 90% + hydrogen 10~o 0
* All values are expressed as a percentage of the value of air. The incubations were performed as described in Materials and Methods except that the atmosphere was changed.
The influence of CO on the metabol ism of d icoumarol is shown in Table 6. F r o m the table it is seen that CO effectively inhibi ted the metabol ism of dicoumarol .
Metabolites produced from dicoumaroL By paperchromatography and th in layer chromatography at least one metaboli te of d icoumarol was detected. Some charac- teristics of this metaboli te which provisionally has been termed B 055 (cf. Christen- sen s) are given in Table 7. The product ion of metaboli te B 055 was consistently
TABLE 6. INHIBITORY EFFECT OF C O ON THE METABOLISM OF DICOUMAROL BY RAT LIVER MICROSOMES FROM PHENOBARBITAL TREATED RATS
Atmosphere
Dicoumarol metabolized*
nmoles/10 min/mg protein Control ~o
Air (control) 16"6 100 c o (lOO%) o 0 CO (16%)t 8.54 51-5
* Dicoumarol (298 nmoles) was incubated with liver microsomes under standard conditions as described in Materials and Methods except that the atmosphere was changed.
t The atmosphere consisted of 16~o CO, 16~o 02 and 68~o Nz.

2310 FLEIVIMING CI-IRtSTENSEN
demonstrated if metabolism of dicoumarol had occurred. In a few instances a quanti- tative evaluation of this metabolite was performed, thereby disclosing a relationship between the amount formed to that of dicoumarol metabolized (Fig. 1).
TABLE 7. R f-VALUES OF DICOUMAROL AND METABOLITE ]} 055
Rrvalues
Dicoumarol Metabolite B 055
Paperchromatography* 0.73 0.53 Thin layer chromatographyt 0"55 0'35
* Solvent system: n-butanol-aqueous ammonia. I" Solvent system: benzene-formic acid-methyl ethyl ketone. The com-
pounds were detected with diazotized sulphanilic acid or diazotized o-dianisidine to give yellowish or reddish spots. For details see Materials and Methods.
DISCUSSION
The results obtained strongly indicate that dicoumarol, at least in the rat, is met- abolized mainly if not exclusively by the mixed oxidase system of liver microsomes. This conclusion is based on the facts that only the microsomal fraction of liver micro- somes supported the metabolism of dicoumarol and that this was strongly dependent on the presence of both oxygen and NADPH. It is also consistent with the inhibitory action of CO and the inductive effect of phenobarbital. The work of Burns e t a L x 2
agrees with our observations. Furthermore, it has been shown that warfarin, which is chemically related to dicoumarol, is mainly metabolized by the microsomal fraction of rat liver. 17.xs
The finding that uridine-5'-diphosphoglucuronate did not stimulate the metabolism of dicoumarol may indicate that glucuronide-formation is not a major pathway of dicoumarol metabolism.
The Kin-value for dicoumarol obtained with microsomes from untreated rats (5.0 × 10 -5 M) does not seem to differ significantly from that obtained with micro- somes from phenobarbital treated rats (3.9 × 10 -5 M). They agree with the previously reported 19 value of K~ (6.5 × 10 -s M) for the binding of dicoumarol to liver micro- somes as determined spectrophotometrically. The unchanged K=-value following induction with phenobarbital indicates that the enzyme responsible for dicoumarol metabolism is qualitatively unchanged following induction with phenobarbital. The two and a half fold increase in the value of I'm observed upon phenobarbital treat- ment indicates that the amount of active enzyme per unit microsomal protein had risen. As the amount of cytochrome P-450 per unit microsomal protein was about twice the value obtained with uninduced rat liver microsomes the metabolism of dicoumarol per unit cytochrome P-450 remained essentially unchanged after induc- tion. However, from Table 4 it is evident that under certain conditions a two-fold rise in the metabolism of dicoumarol per unit cytochrome P-450 was observed. The basis of this discrepancy is at present not understood.

Metabolism of dicoumarol 2311
This work has disclosed the produc t ion o f at least one metabol i te o f d icoumaro l
upon incubat ion with rat liver microsomes. The chemical nature o f this metabol i te is
now under investigation.
• acknowledgements--The author wishes to thank Miss B. Esmann and Mr. H. E. K. Andersen for skilful technical assistance.
R E F E R E N C E S
1. M. WEINER, S. SHAPIRO, J. AXELROD, J. R. COOPER and B. B. BRODIE, J. Pharmac. exp. Ther. 99, 409 (1950).
2. F. CHRISTENSEN, Acta reed. Scand. 175, 461 (1964). 3. E. P. HAUSNER, C. L. SHAFER, M. CORSON, O. JOHNSON, T. TRUJILLO and W. LANGHAM, Circula-
tion 3, 171 (1951). 4. F. CmUSTENSEN, Acta Pharmac. Tox. 21, 307 (1964). 5. F. CHRISTENSEN, Acta Pharmac. Tox. 22, 141 (1965). 6. R. A. O'REILLY, P. M. AO3ELER and L. S. LEONG, Thromb. Diath. haemorrh. 11, 1 (1964), 7. F. CHmSTENSEN, Acta Pharmac. Tox. 24, 232 (1966). 8. R. NAGASHIMA, G. LEVY and E. J. SARCIONE, d. Pharm. Sci. 57, 1881 (1968). 9. F. J. KAZMIER and J. A. SPrrrgLL, Mayo Clin. Proc. 45, 249 (1970).
10. P. G. DAYTON, Y. TARCAN, T. CHENKIN and M. WEINER, J. clin. Invest. 40, 1797 (1961). 11. H. M. SOLOMON and J. J. SCHROGIE, J. Pharmac. exp. Ther. 154, 660 (1966). 12. J. J. BURNS, S. A. CUCINELL, R. KOSTER and A. H. CONNEY, Ann. N.Y. Acad. Sci. 123, 273
(1965). 13. F. CHRISTENSEN, Acta Pharmac. Tox. 21, 299 (1964). 14. O. H. LOWRY, N. J. ROSEBROUGH, A. L. FARR and R. J, RANDALL, J. biol. Chem. 193, 265 (1951). 15. T. OMURA and R. SATO, J. bioL Chem. 239, 2370 (1964). 16. F. CHPOSTENSEN, Acre Pharmac. Tox. 21, 23 (1964). 17. M. IKEDA, V. ULLRICH and H. STAUDINGER, Biochem. Pharmac. 17, 1663 (1968). 18. M. IKEOA, A. H. CONNEY and J. J. BURNS, J. Pharmac. exp. Ther. 162, 338 (1968). 19. F. CHRISTENSEN and F. WlSSINO, Biochem. Pharmac. 21, 975 (1972).