Metabolic Systems Biology - Home - Springer · M Metabolic Systems Biology Nathan E. Lewis1, Neema...
23
M Metabolic Systems Biology Nathan E. Lewis 1 , Neema Jamshidi 1 , Ines Thiele 2 and Bernhard Ø. Palsson 1 1 Department of Bioengineering, University of California, San Diego, La Jolla, CA, USA 2 Bioinformatics Program, University of California, San Diego, La Jolla, CA, USA Glossary Bibliome The collection of primary literature, review literature, and textbooks on a particular topic. Biochemically, genetically and genomically (BiGG) structured reconstruction. A structured genome-scale metabolic network reconstruction which incorporates knowledge about the genomic, proteomic, and biochemical components, including relationships between each component in a particular organism or cell (see section “Reconstructions, Knowledge Bases, and Models”). Biomass function A pseudo-reaction representing the stoichiometric consumption of metabolites necessary for cellular growth (i.e., to produce biomass). When this pseudo-reaction is placed in a model, a flux through it represents the in silico growth rate of the organism or population (see section “Constraint-Based Methods of Analysis”). Constraint- based reconstruction and analysis (COBRA) A set of approaches for constructing manually curated, stoichiometric network reconstructions and analyzing the resulting models by applying equality and inequality constraints and computing functional states. In general, mass conservation and thermodynamics (for directionality) are the fundamental constraints. Additional constraints reflecting experimental conditions and other biological constraints (such as regulatory states) can be applied. The analysis approaches generally fall into two classes: biased and unbiased methods. Biased methods involve the application of various optimization approaches which # Springer Science+Business Media LLC 2017 R.A. Meyers (ed.), Encyclopedia of Complexity and Systems Science, DOI 10.1007/978-3-642-27737-5_329-2
-
Upload
nguyenhanh -
Category
Documents
-
view
217 -
download
0
Transcript of Metabolic Systems Biology - Home - Springer · M Metabolic Systems Biology Nathan E. Lewis1, Neema...

M
Metabolic Systems Biology
Nathan E. Lewis1, Neema Jamshidi1, Ines Thiele2
and Bernhard Ø. Palsson11Department of Bioengineering, University ofCalifornia, San Diego, La Jolla, CA, USA2Bioinformatics Program, University ofCalifornia, San Diego, La Jolla, CA, USA
Glossary
Bibliome The collection of primaryliterature, review literature, andtextbooks on a particulartopic. Biochemically,genetically and genomically(BiGG) structuredreconstruction.
A structured genome-scalemetabolic networkreconstruction whichincorporates knowledge aboutthe genomic, proteomic, andbiochemical components,including relationshipsbetween each component in aparticular organism or cell (seesection “Reconstructions,Knowledge Bases, andModels”).
Biomassfunction
A pseudo-reaction representingthe stoichiometric
consumption of metabolitesnecessary for cellular growth(i.e., to produce biomass).When this pseudo-reaction isplaced in a model, a fluxthrough it represents the insilico growth rate of theorganism or population (seesection “Constraint-BasedMethods of Analysis”).
Constraint-basedreconstructionand analysis(COBRA)
A set of approaches forconstructing manually curated,stoichiometric networkreconstructions and analyzingthe resulting models byapplying equality andinequality constraints andcomputing functional states. Ingeneral, mass conservation andthermodynamics (fordirectionality) are thefundamental constraints.Additional constraintsreflecting experimentalconditions and other biologicalconstraints (such as regulatorystates) can be applied. Theanalysis approaches generallyfall into two classes: biased andunbiased methods. Biasedmethods involve theapplication of variousoptimization approaches which
# Springer Science+Business Media LLC 2017R.A. Meyers (ed.), Encyclopedia of Complexity and Systems Science,DOI 10.1007/978-3-642-27737-5_329-2

require the definition of anobjective function. Unbiasedmethods do not require anobjective function (see section“Constraint-BasedModeling”).
Convex space A multi-dimensional space inwhich a straight line can bedrawn from any two points,without leaving the space (seesection “Constraint-BasedMethods of Analysis”).
Extremepathways(ExPa)analysis
An approach for calculating aunique, linearly independent,but biochemically feasiblereaction basis that can describeall possible steady state fluxcombinations in a biochemicalnetwork. ExPas are closelyrelated to Elementary Modes(see section “Constraint-BasedMethods of Analysis”).
Flux-balanceanalysis (FBA)
The formalism in which ametabolic network is framed asa linear programmingoptimization problem. Theprincipal constraints in FBAare those imposed by steadystate mass conservation ofmetabolites in the system (seesection “Constraint-BasedMethods of Analysis”).
Gene-protein-reactionassociation(GPR)
A mathematical representationof the relationships betweengene loci, gene transcripts,protein subunits, enzymes, andreactions using logicalrelationships (and/or) (seesection “Reconstructions,Knowledge Bases, andModels”).
Genome-scale The characterization of acellular function/system on itsgenome scale, i.e.,incorporation/consideration ofall known associated
components encoded in theorganism’s genome.
Isocline A line in a phenotypic phaseplane diagram, along which theratio between the shadowprices for two metabolites isfixed (see section “Constraint-Based Methods of Analysis”).
Knowledgebase
A specific type ofreconstruction which alsoaccounts for the followinginformation: molecularformulae, subsystemassignments, GPRs, referencesto primary and reviewliterature, and additionalpertinent notes (see section“Reconstructions, KnowledgeBases, and Models”).
Line ofoptimality
The isocline in a phenotypicphase plane diagram thatachieves the highest value ofthe objective in the phase plane(see section “Constraint-BasedMethods of Analysis”).
Linearprogrammingproblem
A class of optimizationproblems in which a linearobjective function ismaximized or minimizedsubject to linear equality andinequality constraints (seesection “Constraint-BasedMethods of Analysis”).
Metabolicnetwork nullspace
The set of independent vectorsthat satisfy the equation:S • v = 0; i.e., a flux basissatisfying the steady stateconditions, also referred to asthe steady state flux solutionspace (see section “Constraint-Based Methods of Analysis”).
Networkreconstruction
An assembly of thecomponents and theirinterconversions for anorganism, based on the genomeannotation and the bibliome(see section “Reconstructions,
2 Metabolic Systems Biology

Knowledge Bases, andModels”).
Objectivefunction
A function which is maximizedor minimized in optimizationproblems. In FBA, theobjective function is a linearcombination of fluxes. Forprokaryotes and simpleeukaryotes grown in thelaboratory under controlledconditions, the biomassfunction is often used as theobjective function (see section“Constraint-Based Methods ofAnalysis”).
Open readingframe (ORF)
A DNA segment that has a startand stop site for translation andcan encode for a proteinproduct (see section “TheHuman Metabolic NetworkReconstruction: Characterizingthe Knowledge Landscape anda Framework for Drug TargetDiscovery”).
Phenotypicphase plan(PhPP)analysis
A constraint-based method ofanalysis which uses FBAsimulations to perform asensitivity analysis byoptimizing the objectivefunction as two uptake fluxesare varied simultaneously. Theresults of generally displayedgraphically. Isoclines and theline of optimality can be usedto characterize differentfunctional states in the phaseplane (see section “Constraint-Based Methods of Analysis”).
Sensitivityanalysis
The analysis of how the outputof a model changes as inputparameters are varied (seesection “Constraint-BasedMethods of Analysis”).
Shadow price For FBA optimizationproblems, the (negative)change in the objectivefunction divided by the change
in the availability of aparticular metabolite (i.e., thenegative sensitivity of theobjective function with respectto a particular metabolite) (seesection “Constraint-BasedMethods of Analysis”).
Singlenucleotidepolymorphism(SNP)
A genetic sequence variationthat involves a change orvariation of a single base (seesection “Causal SNPClassification Using Co-sets”).
Solution space The set of feasible solutions fora system under a defined set ofconstraints (see section“Constraint-Based Methods ofAnalysis”).
Uniformrandomsampling(Monte Carlosampling)
A constraint-based method ofanalysis that uses Monte Carlosampling methods to obtain auniform distribution of randomsamples from the allowableflux space in order to find therange and probabilitydistributions for reaction fluxes(see section “Constraint-BasedMethods of Analysis”).
Definition of the Subject
Systems biology has various definitions. Com-mon features among accepted definitions gener-ally involve the description and analysis ofinteracting biomolecular components. Systemsanalysis of biological network is quickly demon-strating its utility as it helps to characterize bio-molecular behavior that could not otherwise beproduced by the individual components alone(Kitano 2002). Three areas in which systems anal-ysis has been implemented in biology include:(1) the generation and statistical analysis ofhigh-throughput data in an effort to catalog andcharacterize cellular components; (2) the con-struction and analysis of computational modelsfor various biological systems (e.g., metabolism,signaling, and transcriptional regulation); and(3) the integration of the knowledge of parts and
Metabolic Systems Biology 3

computational models to predict and engineerbiological systems (synthetic biology) (Church2005; Kirschner 2005; Kitano 2002).Metabolism,as a system, has played an important role in thedevelopment of systems biology, especially in themodeling sense. This is because the network com-ponents (e.g., enzymes and metabolites) havebeen studied in detail for decades, and manylinks between components have been experimen-tally characterized. Metabolic systems biology,compared to systems biology in general, entailsthe computational analysis of these enzymes andmetabolites and the metabolic pathways in whichthey participate. Metabolic systems biology, usinggenome-scale metabolic network reconstructionsand their models, has helped (1) to elucidate bio-molecular function (Reed et al. 2006b); (2) topredict phenotypic behavior (Edwards et al.2001); (3) to discover new biological knowledge(Covert et al. 2004; Reed et al. 2006b); and (4) todesign experiments for engineering applications(Alper et al. 2005; Lee et al. 2005). Constraint-Based methods have played a pivotal role in theanalysis of large and genome-scale metabolic net-works. The structure, mathematical formulation,and analytical techniques of constraints-basedmethods have also paved the way for the success-ful modeling of other complex biological net-works, such as transcriptional regulation (Barrettet al. 2005; Covert et al. 2004; Gianchandani et al.2006; Herrgard et al. 2006b) and signaling net-works (Papin and Palsson 2004).
Introduction
The analysis of network capabilities, prediction ofcellular phenotypes, and in silico hypothesis gen-eration are among the goals in metabolic systemsbiology. In order to build the models that enablesuch analysis, a large amount of knowledge aboutthe biological system is required. For a growingnumber of organisms detailed knowledge aboutthe molecular components and their interactions isbecoming available. The increasing availability ofvarious types of high-throughput data, such astranscriptomic, proteomic, metabolomic, and
interactomic (e.g., protein-protein, protein-DNA), has facilitated their identification.
Biological networks are too complex to bedescribed by traditional mechanistic modelingapproaches. This is due to the large number ofcomponents, the various physicochemical interac-tions, and complex hierarchical organization inspace and time. Consequently, constraint-basedmodeling approaches have been developedwhich combine fundamental physicochemicalconstraints with mathematical methods to circum-vent the need for comprehensive parametrization.These models are able to retain critical mechanis-tic aspects such as network structure via stoichi-ometry and thermodynamics. However, theseconstraints will not yield a uniquely determinedsystem, but rather an underdetermined system oflinear equations. Hence it is important to developmethods to characterize the functional propertiesof the solution spaces. There has been intenseactivity in developing such methods, many ofwhich have been reviewed in Price et al. (2004a)and are listed later in this chapter. The generalprinciples underlying genome-scale modelingtechniques will be further described in thischapter.
This chapter will introduce the reconstructionprocess and describe some constraint-basedmethods of analysis. This will be followed byexample studies involving E. coli and humanmetabolism in which these constraint-basedapproaches have been successfully implementedfor:
• Predicting phenotypes and outcomes of adap-tive evolution in E. coli (section “Growth Pre-dictions of Evolved Strains”)
• Discovering gene function in E. coli (section“Discovery of Gene Function”)
• Characterizing healthy and disease states in thehuman cardiomyocyte mitochondria (section“Effects of Perturbed Mitochondrial States”)
• Functionally classifying correlated reactionsets to understand disease states and potentialtreatment targets in human metabolism(section “Causal SNP Classification UsingCo-sets”)
4 Metabolic Systems Biology

• Expanding genome-scale modeling to humanmetabolism (section “The Human MetabolicNetwork Reconstruction: Characterizing theKnowledge Landscape and a Framework forDrug Target Discovery”)
Reconstructions, Knowledge Bases, andModels
Where is the Life we have lost in living?Where is the wisdom we have lost in knowledge?Where is the knowledge we have lost ininformation?T.S. Eliot, “The Rock”, Faber & Faber 1934.
A reconstruction is an assembly of the compo-nents and their interactions for an organism,based on the genome annotation and the bibliome.A knowledge base is a very specific type of recon-struction which also accounts for the followinginformation: molecular formulae, subsystemassignments, gene-protein-reaction associations(GPRs), references to primary and review litera-ture, and additional notes regarding data qualityand sources. Therefore, this knowledge base rep-resents an assimilation of the current state ofknowledge about biochemistry of the particularorganism. A knowledge base also highlights miss-ing information (e.g., network gaps and missingGPRs). Throughout the remainder of the chapterwe will refer to knowledge bases and reconstruc-tion interchangeably even though we have definedthem distinctly.
A model is the result of converting a knowl-edge base or reconstruction into a computable,mathematical form by translating the networksinto a matrix format and by defining systemboundaries (see section “From Reconstruction toModels”). It is important to note that a singlereconstruction or knowledge base may yield mul-tiple condition specific models (Fig. 1). The rela-tionships between a genome and its derivativeproteomes and phenotypes are analogous to therelationships between a knowledge base, theresulting models, and the possible functionalstates (Fig. 1).
Reconstructions, in a way, reverse the concernvoiced above by T.S. Eliot by structuring data toprovide information and processing informationto find knowledge, which is then cataloged in aknowledge base. The models derived from thisknowledge base can then be used for in silicohypothesis generation and predictive modeling,which can lead to biological discovery and pro-vide insight into how biological systems operate.
There are two prominent approaches for net-work reconstructions top-down and bottom-up.Top-down reconstructions rely on high-throughput data, genome sequence, and genomeannotation to computationally piece togethercomponent interaction networks based on statisti-cal measures. Top-down reconstructions oftenaim to characterize the entire network. However,the resulting network links may be “soft”, sincethey are based on statistical approaches. Top-down approaches may lead to the discovery ofpreviously unknown components and relation-ships. Bottom-up reconstructions, in contrast,aim to be accurate and well-defined in theirscope, as the components and interactions areexperimentally verified. The bottom-up recon-struction process requires extensive manualcuration and validation of its content to ensurethe desired accuracy and self-consistency. Thisprocess results in a Biochemically, Geneticallyand Genomically (BiGG) structured knowledgebase, in which genes are connected to the proteinsand enzymes they encode, and each enzyme isconnected to the reactions it catalyzes, alsoknown as a gene-protein-reaction-association(GPR). Bottom-up reconstructions have beenshown to be useful for many applications such asgenerating hypotheses and analyzing systemprocesses.
The Reconstruction ProcessThe bottom-up reconstruction of genome-scalemetabolic networks is a well established proce-dure that has been conducted for many organisms(Reed et al. 2006a) and can be carried out in analgorithmic manner (Fig. 2). Briefly, the mainphases are: (1) the generation of an initial compo-nent list based on genome annotation, (2) themanual curation of this initial list based on
Metabolic Systems Biology 5

Genome
Knowledgebase
Proteome1
Proteome2
Model 1
Model 2
Phenotype 1
Phenotype 2
Phenotype 3
Phenotype 4
Functional State 1
Functional State 2
Functional State 3
Functional State 4
Metabolic Systems Biology, Fig. 1 An analogybetween genomes and knowledge bases. Regulation playsa significant role in defining phenotypes for a givengenome. The regulatory program is driven by environmen-tal cues. Similarly models derived from a knowledge base
are subject to the constraints reflecting the regulatory andenvironmental factors (which also govern the proteome).The set of candidate functional states of different modelsreflects all of the possible phenotypes
Metabolic Systems Biology, Fig. 2 The reconstructionprocess. First, a component list is generated from thegenome annotation and information in various databases.Second, the component list is manually curated usingprimary and review literature. Furthermore, the reactionsare mass and charge balanced and assembled into path-ways. Third, debugging of the reconstruction is done bycomputationally testing the properties and capabilities of
the reconstruction to ensure that the derived models havecapabilities similar to the organism. Pathway gaps may befilled if supported by experimental evidence or if requiredfor network functionality. Fourth, simulation and analysisis conducted to reconcile the reconstruction with experi-mental data, which may lead to further iterations andrefinements of the reconstruction
6 Metabolic Systems Biology

primary and review literature, (3) the functionalvalidation of network capabilities using experi-mental data, and (4) simulation and analysis.This last step may lead to iterative improvementsthrough reconciliation of the network with newdata.
Step 1: Generation of the Initial Component ListThe first step in the reconstruction of a metabolicnetwork is the selection of an organism and gen-eration of a list of all currently known components(e.g., genes, proteins, and metabolites) involvedin its metabolism. A sequenced and annotatedgenome is a prerequisite for building genome-scale networks. The quality of the reconstructiondepends greatly on the quality of the annotationand the available literature describing the physi-ology and biochemistry of the organism. Parsingof the genome annotation for genes with meta-bolic functions results in the initial componentlist, and this list may be extended by obtainingassociated reactions for these functions from data-bases such as KEGG (Kanehisa et al. 2004),BRENDA (Schomburg et al. 2004), ExPASy(Gasteiger et al. 2003), Reactome (Vastrik et al.2007), and MetaCyc (Caspi et al. 2008). It iscritical to manually curate this list, since the spe-cific enzymes in the reconstructed organism maynot act upon all of the substrates and cofactorsincluded in the reactions in these databases.
Step 2: Manual CurationOnce a component list is compiled, biochemicalreactions must be manually defined, verified,assigned a confidence score, and assembled intopathways. For each reaction in the network, sev-eral properties must be defined, such as substratespecificity and their corresponding products, reac-tion stoichiometry, reaction directionality, subcel-lular localization, and chemical formulae for themetabolites with their corresponding charges. Inaddition, all genes and their associated gene prod-ucts are connected to reactions in GPRs, usingBoolean logic to describe each association. Thisthorough description of each reaction involvesmanual curation, as information is gathered fromthe primary literature, review articles, andorganism-specific books. The completeness of
this description depends heavily on how exten-sively the organism has been studied. Confidencescores for the reactions are a measure for the levelof experimental support for the inclusion of a geneand its associated reaction(s). Generally, confi-dence scores have been defined on a scale from1 to 4 and are assigned to each reaction in areconstruction. Direct biochemical characteriza-tion of reaction activity is considered the goldstandard; therefore reactions with such datareceive a confidence score of 4. A score of 3 isgiven to reactions that are supported by geneticdata, such as gene cloning. When a reaction issupported by sequence homology, physiologicaldata, or localization data, the reaction is given aconfidence score of 2. Reactions that are addedonly because they were needed for modeling pur-poses would receive a score of 1 (for a moredetailed description, refer to Reed et al. (2006a)).
Step 3: Debugging and Functional Validation ofthe ReconstructionEven for well studied organisms, a metabolicreconstruction at this stage will have a substantialnumber of gaps, resulting in limited network func-tionality. These gaps exist because the annotationof the genome is often incomplete. For example,even in E. coli, 20% of all genes do not haveknown functions, according to the latest genomeannotation (Riley et al. 2006).
Gaps can be classified as knowledge or scopegaps. Knowledge gaps result from a lack ofknowledge about the presence of transportand/or biochemical transformations for a particu-lar metabolite in the target organism. Preferably,these gaps will be filled using primary literature.Alternatively, reactions may be included ashypotheses that require experimental verificationand therefore are assigned a low confidence score.After converting the reconstruction into a mathe-matical format (see Fig. 3b and section “FromReconstruction to Models”), computational algo-rithms can be used to assist the gap-filling process(Leino et al. 1997; Satish Kumar et al. 2007).Using tools such as flux balance analysis (FBA)the reconstruction can be tested for the function-ality of all physiologically relevant pathways. Forexample, if an amino acid is known to be non-
Metabolic Systems Biology 7

essential for an organism, the complete biosyn-thetic pathway is needed, even if some of therequired genes have not been annotated in thegenome. Scope gaps involve transformationsthat are outside the scope of interest in the net-work, such as DNA methylation reactions andtRNA charging. These gaps will not be filled,but it is important to document and classify thesein the knowledge base.
Step 4: Simulation and AnalysisOnce the network is manually curated anddebugged, its capabilities and accuracy should betested by comparing in silico with experimentalobservations. These tests may include gene essenti-ality studies and evaluation of growth phenotypesunder various conditions (Leino et al. 1997; Reedet al. 2006a). This step includes the simulation andanalysis of secretion products and alternate nutrientsources. Additional experimental studies and newly
generated data will lead to further iterations andrefinement of the reconstruction content.
From Reconstruction to ModelsA network reconstruction is converted into amathematical model in two steps. First, systemboundaries and the relevant inputs and outputsare defined. Second, the network is representedby a matrix. In this matrix, each column representsa reaction and each row represents a uniquemetabolite. The elements of the matrix are thestoichiometric coefficients for each metabolite ineach reaction (reactants are negative and productsare positive). The collection of reactionsrepresented in this manner is called the stoichio-metric matrix, S. At this stage condition specificconstraints (e.g., measured uptake and secretionrates, or known regulatory constraints) will beapplied to external and internal reactions, thusresulting in a distinct, condition-specific set.
Metabolic Systems Biology, Fig. 3 Converting areconstruction into a model. The conversion of a recon-struction into a model involves the definition of systemboundaries (top) and the conversion to a mathematicalformat (bottom). (a) Biochemical reactions can be writtenas conversions from reactant(s) into product(s). (b) Inputand output fluxes that transport metabolites in and/or out ofthe system are defined (designated by bx). The dashed lineindicates an open system. (c) In a cell, for example, the cell
membrane acts as a natural boundary. In a model it can berepresented by an open system boundary, allowing thetransfer of metabolites across the cell membrane. Thecomplete mathematical representation of the network,containing the entire set of internal reactions withexchange (transport) reactions, is termed the stoichiometricmatrix, S. Abbreviations: Sint internal reactions, Sexchexchange reactions across the open-system boundaries,Sext extracellular metabolites
8 Metabolic Systems Biology

Different sets of constraints applied to the samereconstruction will result in different models.
Constraint-Based Modeling
As discussed above, constraint-based modelinghas enabled the analysis of genome-scale net-works in a mechanistic and predictive mannerwithout relying on data-intensive parametrization.In addition, this technique has provided greatflexibility, allowing different methods to be usedwhile requiring few changes to the model struc-ture. The strengths of this modeling approach aredemonstrated in the size of the networks that canbe modeled (e.g., the human metabolic networkinvolves about 3,300 reactions (Duarte et al.2007)) and the ability it has to make predictionsdespite incomplete knowledge of the system. Thissection will focus on the types of constraints andsome of the associated methods.
Biological Basis for ConstraintsConstraints on cells can be grouped into threemajor classes: physicochemical, environmental,and regulatory constraints. Physicochemical con-straints, the first type, are inviolable “hard” con-straints on cell function. These constraints includeosmotic balance, electroneutrality, the laws ofthermodynamics, and mass and energy conserva-tion. Spatial constraints, another type of physico-chemical constraints, affect the function ofbiological systems due to mass transport limita-tions and molecular crowding. The second classof constraints, environmental constraints, are con-dition and time dependent, and include variablessuch as pH, nutrients, temperature, and extracel-lular osmolarity. Since environmental conditionsand their effects on a cell can vary widely, predic-tive models rely heavily on well-defined experi-mental conditions. The third type of constraints,regulatory constraints, are self-imposed con-straints in which pathway fluxes are modulatedby allosteric regulation of enzymes and/or by geneexpression via transcriptional control. These con-straints are “soft” and can be altered through evo-lutionary processes (Herring et al. 2006). Thesecollective constraints contribute to a specific
phenotype; therefore, their consideration inconstraint-based modeling will assist the identifi-cation of relevant functional states.
The Mathematical Description of ConstraintsConstraints can be quantitatively represented bybalances and bounds, where balances are equali-ties and bounds are inequalities. The conservationof mass dictates that there is no net accumulationor depletion of metabolites at the steady state. Thismass balance can be described mathematically as
S• v ¼ 0, (1)
where S is the m � n stoichiometric matrix(with m metabolites and n reactions), andv(n � 1) is the flux vector, which represents theflux through each network reaction (Varma andPalsson 1994). Similar steady state balance repre-sentations can be used for other physicochemicalconstraints, such as electroneutrality (Joshi andPalsson 1989b; Marhl et al. 1997), osmotic pres-sure (Brumen and Heinrich 1984; Joshi andPalsson 1989a; Klipp et al. 2005), and thermody-namic constraints around biochemical loops(Beard et al. 2002).
Bounds can be added as additional constraints.Environmental and regulatory constraints can beadded by placing bounds on individual chemicaltransformations. For example, upper and lowerflux rate limits
vminOviOvmax (2)
can be placed on the ith reaction or transporter,to reflect experimentally measured enzyme capac-ity or metabolite uptake rates in a given environ-ment. Thermodynamic constraints for eachreaction can be applied by constraining the reac-tion directionality or by applying a set of linearthermodynamic constraints to eliminate thermo-dynamically infeasible fluxes (Henry et al. 2007).
Constraint-Based Methods of AnalysisA plethora of methods have been developed toanalyze constraint-based models and many havebeen reviewed thoroughly (Price et al. 2004a).Table 1 provides a list of methods and potential
Metabolic Systems Biology 9
questions they can address. Constraint-Basedmethods can be grouped into biased and unbiasedapproaches.
Biased MethodsBiased methods necessitate an objective function,i.e., a reaction or pseudo-reaction for which oneoptimizes. Some examples of commonly usedobjective functions include biomass production,ATP production, or the production of a byproductof interest (Savinell and Palsson 1992; Vo et al.2004). For example, when bacteria are cultured inconditions selecting for growth, the cellular objec-tive function is well-approximated by maximizingbiomass production (Edwards et al. 2001; Segreet al. 2002).
Flux Balance Analysis (FBA) is the formula-tion of linear programming problems for stoichio-metric metabolic networks. Most of the biasedmethods employ variations or adaptations ofFBA. For example, in Flux Variability Analysis(FVA) (Mahadevan and Schilling 2003) everyreaction in a condition-specific model is maxi-mized and minimized. Gene Deletion Analysis(Edwards and Palsson 2000a), another FBA-based approach, involves the sequential deletioneach gene in a model and optimization for growthin order to define the in silico knock-outphenotypes.
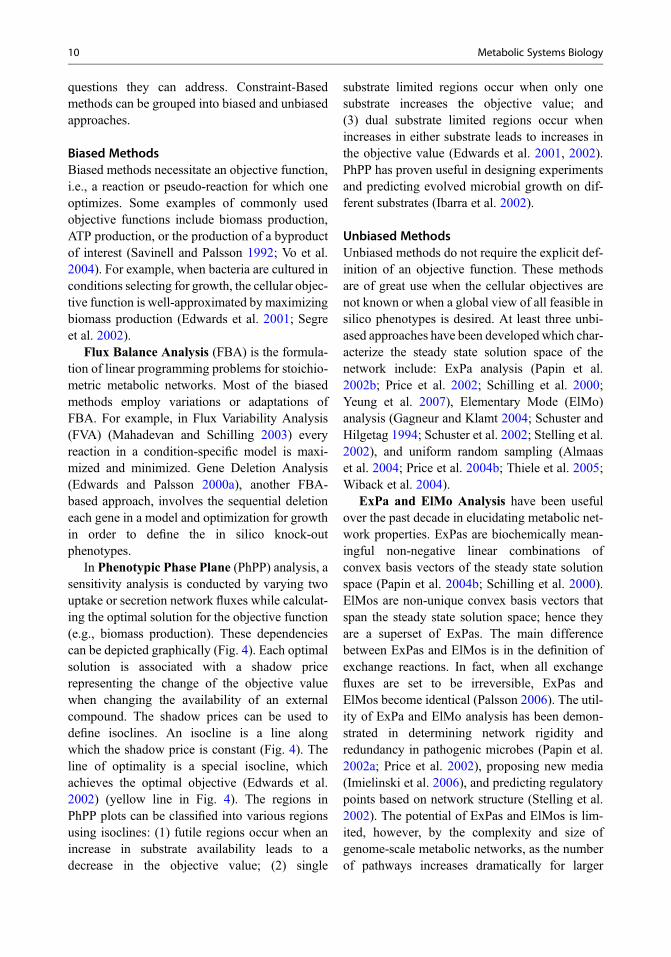
In Phenotypic Phase Plane (PhPP) analysis, asensitivity analysis is conducted by varying twouptake or secretion network fluxes while calculat-ing the optimal solution for the objective function(e.g., biomass production). These dependenciescan be depicted graphically (Fig. 4). Each optimalsolution is associated with a shadow pricerepresenting the change of the objective valuewhen changing the availability of an externalcompound. The shadow prices can be used todefine isoclines. An isocline is a line alongwhich the shadow price is constant (Fig. 4). Theline of optimality is a special isocline, whichachieves the optimal objective (Edwards et al.2002) (yellow line in Fig. 4). The regions inPhPP plots can be classified into various regionsusing isoclines: (1) futile regions occur when anincrease in substrate availability leads to adecrease in the objective value; (2) single
substrate limited regions occur when only onesubstrate increases the objective value; and(3) dual substrate limited regions occur whenincreases in either substrate leads to increases inthe objective value (Edwards et al. 2001, 2002).PhPP has proven useful in designing experimentsand predicting evolved microbial growth on dif-ferent substrates (Ibarra et al. 2002).
Unbiased MethodsUnbiased methods do not require the explicit def-inition of an objective function. These methodsare of great use when the cellular objectives arenot known or when a global view of all feasible insilico phenotypes is desired. At least three unbi-ased approaches have been developed which char-acterize the steady state solution space of thenetwork include: ExPa analysis (Papin et al.2002b; Price et al. 2002; Schilling et al. 2000;Yeung et al. 2007), Elementary Mode (ElMo)analysis (Gagneur and Klamt 2004; Schuster andHilgetag 1994; Schuster et al. 2002; Stelling et al.2002), and uniform random sampling (Almaaset al. 2004; Price et al. 2004b; Thiele et al. 2005;Wiback et al. 2004).
ExPa and ElMo Analysis have been usefulover the past decade in elucidating metabolic net-work properties. ExPas are biochemically mean-ingful non-negative linear combinations ofconvex basis vectors of the steady state solutionspace (Papin et al. 2004b; Schilling et al. 2000).ElMos are non-unique convex basis vectors thatspan the steady state solution space; hence theyare a superset of ExPas. The main differencebetween ExPas and ElMos is in the definition ofexchange reactions. In fact, when all exchangefluxes are set to be irreversible, ExPas andElMos become identical (Palsson 2006). The util-ity of ExPa and ElMo analysis has been demon-strated in determining network rigidity andredundancy in pathogenic microbes (Papin et al.2002a; Price et al. 2002), proposing new media(Imielinski et al. 2006), and predicting regulatorypoints based on network structure (Stelling et al.2002). The potential of ExPas and ElMos is lim-ited, however, by the complexity and size ofgenome-scale metabolic networks, as the numberof pathways increases dramatically for larger
10 Metabolic Systems Biology

Metabolic Systems Biology, Table 1 There are numerous methods that have been developed to analyze constraint-based reconstructions of metabolic networks using experimental data to answer biological questions. Below is a list ofsome of these methods and questions they can help to answer
Method Question Examples
Alternate optima How many flux states can be attained bymaximizing or minimizing an objective function(e.g., maximum growth or ATP production)?
Lee et al. (2000), Mahadevan andSchilling (2003), Reed and Palsson(2004), Varma and Palsson (1993a), andVo et al. (2004)
Energy balanceanalysis
How can one evaluate the thermodynamicfeasibility of FBA simulation results?
Beard et al. (2002)
ExPa/ElMo How does one define a biochemically feasible,unique set of reactions that span the steady statesolution space?
Papin et al. (2004b), Schilling et al.(2000), and Schuster et al. (2002)
FBA What is the maximum (or minimum) of a specifiedcellular objective function?
Fell and Small (1986), Papoutsakis(1984), Savinell and Palsson (1992),and Varma and Palsson (1993b)
Flux confidenceinterval
What are the confidence intervals of flux valueswhen fluxomic data is mapped to a constraint basedmodel?
Antoniewicz et al. (2006)
Flux coupling What are the sets of network reactions that are fullycoupled, partially coupled, or directionallycoupled?
Burgard et al. (2004)
Flux variabilityanalysis
What is the maximum and minimum flux for everyreaction under a given set of constraints (i.e., whatis the bounding box of the solution space)?
Mahadevan and Schilling (2003)
Gap fill/gap find What are the candidate reactions that can fillnetwork gaps, thus helping improve the model andproviding hypotheses for unknown pathways thatcan be experimentally validated?
Satish Kumar et al. (2007)
Gene annotationrefinementalgorithm
Which reactions are likely missing from thenetwork, given a set of phenotypic observations?What are the candidate gene products with whichcorresponding reactions could fill the gap?
Reed et al. (2006b)
Gene deletionanalysis
Which are the lethal gene deletions in an organism? Edwards and Palsson (2000a)
K-cone analysis Given a set of fluxes and concentrations for aparticular steady state, what is the range ofallowable kinetic constants?
Famili et al. (2005)
Metaboliteessentiality
How does metabolite essentiality contribute tocellular robustness?
Kim et al. (2007)
Minimization ofmetabolicadjustment(MOMA)
Can suboptimal growth predictions be moreconsistent with experimental data in wild type andknock-out strains?
Segre et al. (2002)
Net analysis Given metabolomic data, what are the allowablemetabolite concentration ranges for othermetabolites, and what are the likely regulated stepsin the pathway based on nonequilibriumthermodynamics?
Kummel et al. (2006)
Objective functionfinder/ObjFind
What are the different possible cellular objectives? Burgard and Maranas (2003), Knorret al. (2007), and Schuetz et al. (2007)
Optimal metabolicnetworkidentification
Given experimentally measured flux data, what isthe most likely set of active reactions in the networkunder the given condition that will reconcile datawith model predictions?
Herrgard et al. (2006a)
(continued)
Metabolic Systems Biology 11

networks (Klamt and Stelling 2002; Yeung et al.2007). For example the core E. coli model(consisting of approximately 86 reactions) hasapproximately 20,000 ExPas in rich media growthconditions (Palsson 2006). The number of ExPasin E. coli iJR904 (Reed et al. 2003), which con-sists of ~900 reactions, has been estimated to beon the order of 1018 ExPas (Yeung et al. 2007).Even more impressive is the estimate of 1029
ExPas for the human metabolic network recon-struction (Yeung et al. 2007). These incrediblepathway number estimates not only present insur-mountable computational challenges but also sig-nificant difficulties in the analysis of ExPas andElMos.
Another unbiased method is uniform randomsampling of metabolic networks (Almaas et al.2004; Wiback et al. 2004). Uniform random sam-pling involves enumerating the candidate flux dis-tributions in the steady state solution space until astatistical criterion is satisfied, e.g., a uniform setof flux distributions (Fig. 5a). There have beendifferent approaches in implementing these pro-cedures (Price et al. 2004b; Thiele et al. 2005;Wiback et al. 2004). The distribution of randomsamples provides both a range of allowable fluxesand a probability distribution for flux values forthe given set of constraints (Figs. 5b–d). Thismethod not only allows for the analysis of theentire convex flux spaces of metabolic networks,
Metabolic Systems Biology, Table 1 (continued)
Method Question Examples
OptKnock/OptGene How can one design a knock-out strain that isoptimized for byproduct secretion coupled tocellular growth?
Burgard et al. (2003), and Patil et al.(2005)
OptReg What are the optimal reaction activations/inhibitions and eliminations to improvebiochemical production?
Pharkya and Maranas (2006)
OptStrain Which reactions (not encoded by the genome) needto be added in order to enable a strain to produce aforeign compound?
Pharkya et al. (2004)
PhPP How does an objective function change as afunction of two metabolite exchange rates?
Ibarra et al. (2002), and Varma et al.(1993)
rFBA How do transcriptional regulatory rules affect therange of feasible in silico phenotypes?
Covert et al. (2004)
Regulatory on/offminimization(ROOM)
After a gene knockout, what is the most probableflux distribution that requires a minimal change intranscriptional regulation?
Shlomi et al. (2005)
Robustness analysis How does an objective function change as afunction of another network flux?
Edwards and Palsson (2000b)
SR-FBA To what extent do different levels of metabolic andtranscriptional regulatory constraints determinemetabolic behavior?
Shlomi et al. (2007)
Stable isotopetracers
How can intracellular flux predictions beexperimentally validated, and which pathways areactive under the different conditions?
Sauer (2006)
Thermodynamicsbasedmetabolic fluxanalysis
How can one use thermodynamic data to generatethermodynamically feasible flux profiles?
Henry et al. (2007)
Uniform randomsampling
What are the distributions of network states thathave not been excluded based on physicochemicalconstraints and/or experimental measurements?What are the completely or partially correlatedreaction sets?
Almaas et al. (2004), Price et al.(2004b), Thiele et al. (2005), andWiback et al. (2004)
12 Metabolic Systems Biology

but it can also be employed to study concave fluxspaces and systems with non-linear constraints(Price et al. 2006). Thus it is apparent that uniformrandom sampling is a useful method that providesinformation about a metabolic network and aglobal view of all possible in silico phenotypes.
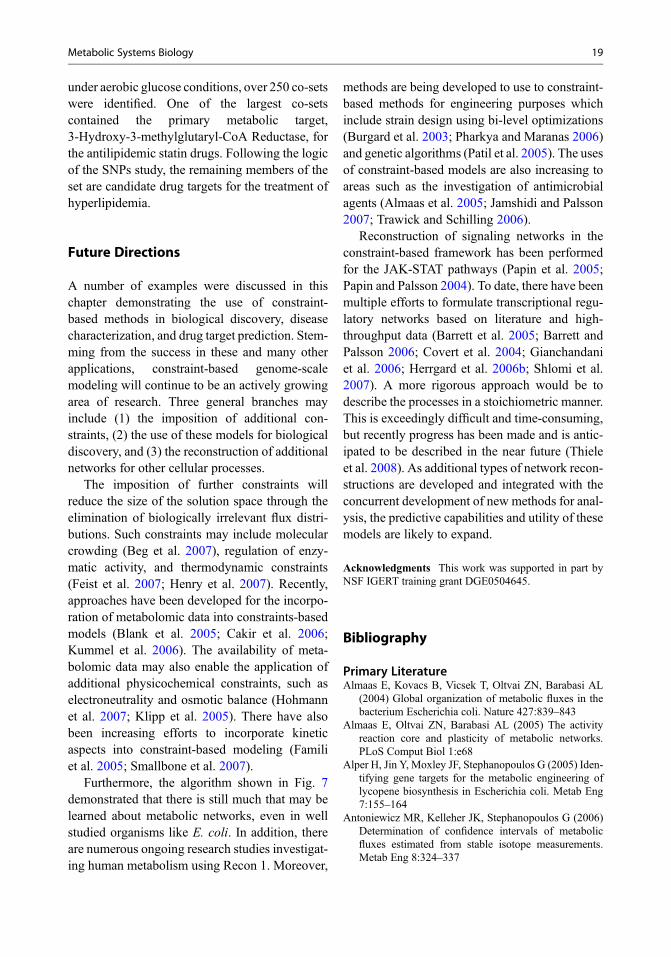
Co-set Analysis: Overlap between Biased andUnbiased MethodsSince biased methods are a subset of unbiasedmethods, these two different methods can beused to calculate similar quantities, such as func-tionally correlated reactions, as demonstrated byco-set analysis. Correlated reaction sets (co-sets)are sets of reactions that are perfectly correlated(R2= 1) at the steady state (Fig. 6a, b) (Papin et al.
0.000.090.180.260.350.440.530.620.710.790.88 0.8
0.7
0.6
0.5
0.4
0.3
0.2
0.1
0.0
10
Succinate Uptake Rate(mmol gDW–1hr–1)
Growth Rate(mmol gDW–1hr–1)
15
2030 20 10 0
Infeasible Solutions
Singel-Substrate Limited
Dual-Substrate Limited
Single-Substrate Limited
Oxygen Uptake Rate(mmol gDW–1hr–1)
Metabolic Systems Biology, Fig. 4 PhenotypicPhase Plane plot. PhPPs have been used to show thatE. coli grown on a single carbon source does not alwaysgrow optimally (compared to in silico predictions).
However, after growing exponentially on at least one suchsubstrate, E. coli was shown to evolve to the line of opti-mality (yellow line) predicted in PhPPs (Ibarra et al. 2002)
Metabolic Systems Biology 13

2004a). Reaction co-sets can be computed usingdifferent methods, such as flux coupling (Burgardet al. 2004), ExPa analysis (Papin et al. 2002b), oruniform random sampling (Price et al. 2004b;Thiele et al. 2005). There are pros and cons tousing any of these methods. Flux coupling allows
the identification of directionally coupled reac-tions, but requires a stated cellular objective.While ExPa analysis allows for the enumerationof co-sets without stating an objective, practicalconsiderations such as computational time cur-rently make ExPa analysis calculations infeasible
0.04
0.035
0.03
0.025
0.02
0.015
Fra
ctio
nal P
roba
bilit
y of
Flu
xF
ract
iona
l Pro
babi
lity
of F
lux
Fra
ctio
nal P
roba
bilit
y of
Flu
x
0.01
0.005
00 1 2 3
Reaction Flux (mmol gDW−1 min−1)
Candidate Values for Flux2
Candidate Values for Flux1
4 5 6 7 8 9 10
0.04
0.035
0.03
0.025
0.02
0.015
0.01
0.005
00 1
Normal Constraint
Flux1
Flu
x 2
Flux3
Altered Constraint
2 3Reaction Flux (mmol gDW−1 min−1)
Candidate Values for Flux3
4 5 6 7 8 9 10
0.04
0.035
0.03
0.025
0.02
0.015
0.01
0.005
00 1 2 3
Reaction Flux (mmol gDW−1 min−1)4 5 6 7 8 9 10
a
b
d
c
Metabolic Systems Biology, Fig. 5 Uniform samplingof the solution space under normal and perturbed metabolicstates. (a) Uniform random sampling of the solution spacecan be used to assign ranges of feasible fluxes and proba-bility distributions for each reaction in the network. (b–d)The sample points can be visualized with a histogram for
each network reaction (black lines). Measured changes influx bounds (min/max) of network fluxes can be applied asnetwork constraints, yielding altered flux distributions (redlines). These changes may reduce the maximum flux value(b), shift the most probable flux value (c), or leave thedistribution unaltered (d)
14 Metabolic Systems Biology

for genome-scale models. For large networks,co-sets may be computed more rapidly using uni-form random sampling. This method also allowsthe pairwise correlation coefficients of all reac-tions to be computed; therefore, partially corre-lated reaction sets (R2 < 1) can be identified.These may be of interest when sampling the net-work under different environmental conditions ordisease states (Thiele et al. 2005).
Implementation of Constraint-Based MethodsIn order to make these analytical tools accessibleto the scientific community, many of the methodsin Table 1 have been implemented in MATLABand released in the COBRA toolbox (Becker et al.2007; http://systemsbiology.ucsd.edu/Downloads/. Accessed 4 July 2008). Other packagesthat implement various constraint-based methodsinclude CellNetAnalyzer (FBA, ElMo analysis,and topological analysis) (Klamt et al. 2007;http://www.mpi-magdeburg.mpg.de/projects/cna/cna.html. Accessed 4 July 2008) and Meta-FluxNet (FBA, reaction deletion analysis, andnetwork visualization) (Lee et al. 2003). Thesesoftware packages and toolboxes are free ofcharge to the academic community.
Metabolic Systems Biology andConstraint-Based Modeling:Applications
As previously discussed, the past couple ofdecades have witnessed the development andanalysis of constraint-based models. This hasresulted in a wide array of analytical methodswhich have been employed to deepen the under-standing of how biological systems function. Theremainder of this chapter will discuss examples inwhich constraint-based models and methods wereused to predict growth rates of evolved prokary-otic strains, design experiments, identify genefunctions, characterize the effects of diseases andmetabolic perturbations, classify genetic disor-ders, and propose alternative drug targets.
Growth Predictions of Evolved StrainsIt has been hypothesized that incorrect log-phasegrowth predictions are caused by incompleteadaptation to a particular environmental givencondition (Ibarra et al. 2002). To test this hypoth-esis, Escherichia coli K-12 MG1655 was grownon different carbon sources (acetate, succinate,malate, glucose and glycerol) at varying
V2
Co-set 1V1 and V3
Co-set 2
Metabolic Network
a
c
bIdentification of co-sets
Common phenotypicproperties for each co-set
Shared phenotypicproperties
Shared phenotypicproperties
V4 and V7
V1
V5
V6
V4V7
V3
Metabolic Systems Biology, Fig. 6 Mapping of SNPsonto reaction co-sets. (a–c) The identification of co-sets ina metabolic network leads to functionally grouped reactionsets. The reactions within each co-set are predicted to havesimilar disease phenotypes (Jamshidi and Palsson 2006).
The same concept can be applied to the identification ofalternative drug target candidates in humans to treat dis-eases (Duarte et al. 2007) and potentially for the identifi-cation of alternative anti-microbial drug targets in humanpathogens (Jamshidi and Palsson 2007)
Metabolic Systems Biology 15

concentrations and temperatures. PhPP analysiswas carried out to identify the different phasesand growth optimality for the different carbonsources (Fig. 4). Optimal growth in all of thesubstrates, except glycerol, were measured andfound to lie on the calculated line of optimality(yellow line in Fig. 4). It was observed that afterselecting for growth, the adaptive evolution of theparental strains (~500 generations) led toincreased growth rates while remaining on theline of optimality. This improved performanceresulted from increased uptake of the carbonsources. The glycerol case however, showed thatE. coli grows sub-optimally on this carbon source,i.e., the experimentally measured growth rate didnot lie on the line of optimality; however, after40 days (~700 generations) the growth of theevolved strain moved to the line of optimality(Ibarra et al. 2002), and continued to evolve ahigher growth rate while remaining on the line.
Discovery of Gene FunctionWhen coupled with experimental data, genome-scale constraint based models can aid in hypothe-sis generation and can suggest functions for pre-viously uncharacterized genes (Leino et al. 1997).FBA was used to predict growth phenotypes ofE. coli on a number of different carbon sources.Experimental growth phenotype data (Bochneret al. 2001) was compared with the computationalpredictions to identify cases in which the modelfailed to accurately predict growth phenotypes(growth vs. non-growth) (Fig. 7a). In 54 cases,the model failed to predict experimentally mea-sured growth phenotypes. Four failure modeswere remedied using the literature, while theremaining 50 cases suggested incomplete knowl-edge. The computational algorithm outlined inFig. 7b was used to predict potential reactions ortransporters that could reconcile the model pre-dictions and experimental results. Therefore, auniversal database of all known metabolic reac-tions in living organisms (Kanehisa et al. 2004)was queried and the minimum number of reac-tions needed to restore in silico growth of themodel were computed. Solutions were found for26 of the failure modes. A subset of the predicted
solutions was chosen for experimental verifica-tion, and two sets will be discussed here.
The computational algorithm suggested thesimplest solution to achieve growth on D-malatewas decarboxylation of D-malate into pyruvate.A library of E. coli knockout mutants showed thatthree mutant strains demonstrated altered growthon D-malate: DdctA (slow growth), DyeaT, andDyeaU (both no growth). Through subsequentsequence homology analysis, gene expressionmeasurement (with RT-PCR), and chromatinimmunoprecipitation experiments, it was demon-strated that DctA is likely a transporter forD-malate, YeaU converts D-malate to pyruvate,and YeaT is a positive regulator that increasesexpression of yeaU.
Another example was L-galactonate.Affymetrix gene-expression data was used toidentify genes involved with L-galactonate catab-olism. Two candidates were found to be greatlyupregulated: yjjL and yjjN. After additionalexperiments, these genes were annotated as fol-lows: yjjL transports L-galactonate, yjjN isresponsible for the L-galactonate oxidoreductaseactivity, and yjjM regulates their gene expression(Fig. 7c).
Successful in silico predictions can help tovalidate a model and unsuccessful predictionscan provide opportunities to expand knowledge.These studies demonstrated that failed predictionscould be used to algorithmically generate experi-mentally testable hypotheses and lead to refine-ment of the genome annotation.
Effects of Perturbed Mitochondrial StatesA constraint-based network of a humancardiomyocyte mitochondrion has been used toevaluate candidate functional states in healthyand diseased individuals as well as investigatecurrently used therapies (Thiele et al. 2005). Uni-form random sampling was used to assess allcandidate metabolic flux states to characterizethe effects of various metabolic perturbations,such as diabetes, ischemia, and various diets(Thiele et al. 2005). For each condition, additionalconstraints were applied to the network to repre-sent the various conditions, e.g., uptake and secre-tion rates. It was found that the perturbations
16 Metabolic Systems Biology

witnessed in diabetes and ischemia lead to a sig-nificant reduction of the size of the solution space,rendering the metabolic network less flexible tovariations in nutrient availability (see Fig. 5).
Sampling under normal physiological condi-tions was found to be consistent with experimen-tal data, thus providing necessary networkvalidation. Diabetic disease states were then sim-ulated by increasing mitochondrial fatty aciduptake while decreasing cellular glucose uptake.The consequences of these constraints on thesteady state solution space were found to be dra-matic, meaning that for most network reactions,
the range of flux values (flexibility) was signifi-cantly decreased. In particular, the oxygenrequirement of the diabetic model was dramati-cally increased, which is consistent with theincreased risk of cardiac complications seen indiabetic patients (Taegtmeyer et al. 2002).Another interesting observation was that the fluxthrough mitochondrial pyruvate dehydrogenasewas found to be severely restricted due to networkstoichiometry when fatty acid uptake wasincreased. Many prior studies had focused onpotential inhibitory mechanisms leading to thedecrease in pyruvate dehydrogenase in diabetic
Phenotypes vs. Model Predictions
Computational Algorithm
Experimental ValidationExp. Growth (+)
CellularMetabolism
Exp. Growth (+)
Pred Growth (-)
Exp. Growth (-)Pred Growth (-)
Pred Growth (+)
METABOLICRECONSTRUCTION
1.09,200 fold
Gene Expression
L-LactateL-galactonate0.8
0.6
0.4
0.2
0.0
1
0.8
0.6
0.4
0.2
00
Time (hours)
Opt
ical
Den
sity
12 24 36 48 60 72
Wildtype and Mutant Growth on L-galactonate
yjjL
yjjL-
yjjM
yjjM-
yjjN
yjjN-BW25113
such that:
(1)
(2)
(3)
(4)
(5)
(6)
(7)
For multiple solutions, at iteration qinclude the additional q-1 constraints:
where n=1 ... q-1
a , b � {0,1}
aj·ymin,j≤ yj ≤ aj·ymax,j
bk·zmin,k≤ zk ≤ bk·zmax,k
S·v + U·y+X·z = 0
Vbiomass> 0.05 hr -1
Vmin,i ≤ Vi ≤ Vmax, i
minimize ∑ ai + ∑ bj
∑ a+ ∑b ≤ a·an+ b·bn −1
Metabolic Systems Biology, Fig. 7 Refining genomeannotation through computational prediction and experi-mental validation. (a) The validity of a metabolic modelcan be tested by comparing simulation outcomes withexperimental results. In cases where the model fails toaccurately predict the experimental outcome, (b) a compu-tational algorithm can be employed that will predict theminimum number of reactions needed to reconcile theerroneous no-growth predictions from the model with theexperimental data that demonstrates growth (Eq. 2). Thereactions are selected from two matrices, U (containing allknown metabolic reactions) and X (containing exchangereactions). The vectors v, y and z represent the steady stateflux vectors for all of the reactions in S, U, andX respectively (Eq. 1), each with minimum and maximum
fluxes as dictated in Eqs. 3, 4, and 5. Vectors a and b arebinary vectors in which an element is 1 only if thecorresponding reaction in U or X is added to reconcilemodel with the experimental data. (c) For predicted setsof reactions, various experimental methods (e.g., growthphenotyping of gene knockout strains, measurement ofgene expression levels, etc.) can be employed to validatepredicted reaction sets. Accurate predictions of gene func-tion allow for annotation of the associated genes and thecorresponding reactions can be added to the networkreconstruction for future use in models (Figure adaptedwith permission from Reed et al. (2006b). Copyright#2006 by The National Academy of Sciences of the UnitedStates of America, all rights reserved)
Metabolic Systems Biology 17

patients. However, the results of this studysuggested that stoichiometry rather than inhibitionmay cause the reduced flux.
Causal SNP Classification Using Co-setsSince reactions that are part of co-sets are either allon or off together, from the disease viewpoint, anyenzyme deficiency that affects a reaction in aparticular co-set would be expected to have dis-ease phenotypes that are similar to the symptomsassociated with enzymopathies of any otherenzyme contained within the co-set (Fig. 6). Theco-sets for the human cardiomyocyte mitochon-drion were analyzed in the context of single nucle-otide polymorphisms (SNPs), single base pairvariations in the genes of individuals (Jamshidiand Palsson 2006). Causal SNPs result in alteredphenotypes as a direct consequence of the alteredgenome sequence. The Online Mendelian Inheri-tance in Man (OMIM) database, which catalogshuman genetic disorders, (Hamosh et al. 2005)and primary/review literature were used to mapthe nuclear encoded mitochondrial diseasescaused by SNPs onto the co-sets using GPRs.
The resulting analysis largely confirmed thehypothesis that causal SNPs in the same reactionco-set often exhibited similar disease phenotypes.This phenotypic coherence was observed for thethree different types of co-sets identified: TypeA Co-sets which included sets of genes that codefor sub-units of a single enzyme complex, TypeB Co-sets which involved reactions in a linearpathway, and Type C Co-sets which involvednoncontiguous reactions (see Fig. 6). Examplesof diseases which exhibited similar phenotypesincluded porphyrias (Type B co-set), fatty acidoxidation defects (Type B Co-set) and failure tothrive due to neurological problems (TypeC Co-set).
It is important to recognize that these co-setsare condition dependent and have the potential tochange as environmental conditions and nutrientavailability vary. Furthermore it is not expectedthat the co-sets always have perfect agreementwith clinical observations, since there are addi-tional levels of information that are currently notaccounted for in the models. This case study lentcredibility to the hypothesis that co-sets can be
used to understand and classify causal relation-ships in disease states. This concept can also beapplied for proposing alternative drug targets forthe treatment of disease (see section “The HumanMetabolic Network Reconstruction: Characteriz-ing the Knowledge Landscape and a Frameworkfor Drug Target Discovery”) (Duarte et al. 2007;Jamshidi and Palsson 2007) and may serve as arich source of hypothesis generation for alterna-tive or new treatments for diseases.
The Human Metabolic NetworkReconstruction: Characterizing theKnowledge Landscape and a Framework forDrug Target DiscoveryWhile the human cardiac mitochondrion recon-struction has proven useful in the study of normaland diseased states, it only covers a small percent-age of human metabolism. In order to account forcellular human metabolism more comprehen-sively, a genome-scale human reconstructionwas created through a group effort resulting inthe first manually curated human metabolic recon-struction, Recon 1 (Duarte et al. 2007). Recon1 accounts for the functions of 1,496 ORFs,2,766 metabolites, and 3,311 reactions. Itaccounts for the following compartments: cyto-plasm, mitochondria, nucleus, endoplasmic retic-ulum, Golgi apparatus, lysosome, peroxisome andthe extracellular environment. The networkreconstruction was reconciled against288 known metabolic functions in human.
Confidence scores were used to define theknowledge landscape of human metabolism. Ofspecial interest are subsystems with low confi-dence scores, or experimental evidence, renderingthem good candidates for experimental studies.For example, intracellular transport reactions andvitamin associated pathways were found to beconsistently poorly characterized. Hence, theknowledge landscape provides an assessment ofour current status of knowledge of human metab-olism and a platform for discovery when com-bined with in silico methods (see section“Discovery of Gene Function”).
Another application of Recon 1 is the predic-tion of drug targets and consequences of meta-bolic perturbations using co-sets. For example,
18 Metabolic Systems Biology
under aerobic glucose conditions, over 250 co-setswere identified. One of the largest co-setscontained the primary metabolic target,3-Hydroxy-3-methylglutaryl-CoA Reductase, forthe antilipidemic statin drugs. Following the logicof the SNPs study, the remaining members of theset are candidate drug targets for the treatment ofhyperlipidemia.
Future Directions
A number of examples were discussed in thischapter demonstrating the use of constraint-based methods in biological discovery, diseasecharacterization, and drug target prediction. Stem-ming from the success in these and many otherapplications, constraint-based genome-scalemodeling will continue to be an actively growingarea of research. Three general branches mayinclude (1) the imposition of additional con-straints, (2) the use of these models for biologicaldiscovery, and (3) the reconstruction of additionalnetworks for other cellular processes.
The imposition of further constraints willreduce the size of the solution space through theelimination of biologically irrelevant flux distri-butions. Such constraints may include molecularcrowding (Beg et al. 2007), regulation of enzy-matic activity, and thermodynamic constraints(Feist et al. 2007; Henry et al. 2007). Recently,approaches have been developed for the incorpo-ration of metabolomic data into constraints-basedmodels (Blank et al. 2005; Cakir et al. 2006;Kummel et al. 2006). The availability of meta-bolomic data may also enable the application ofadditional physicochemical constraints, such aselectroneutrality and osmotic balance (Hohmannet al. 2007; Klipp et al. 2005). There have alsobeen increasing efforts to incorporate kineticaspects into constraint-based modeling (Familiet al. 2005; Smallbone et al. 2007).
Furthermore, the algorithm shown in Fig. 7demonstrated that there is still much that may belearned about metabolic networks, even in wellstudied organisms like E. coli. In addition, thereare numerous ongoing research studies investigat-ing human metabolism using Recon 1. Moreover,
methods are being developed to use to constraint-based methods for engineering purposes whichinclude strain design using bi-level optimizations(Burgard et al. 2003; Pharkya and Maranas 2006)and genetic algorithms (Patil et al. 2005). The usesof constraint-based models are also increasing toareas such as the investigation of antimicrobialagents (Almaas et al. 2005; Jamshidi and Palsson2007; Trawick and Schilling 2006).
Reconstruction of signaling networks in theconstraint-based framework has been performedfor the JAK-STAT pathways (Papin et al. 2005;Papin and Palsson 2004). To date, there have beenmultiple efforts to formulate transcriptional regu-latory networks based on literature and high-throughput data (Barrett et al. 2005; Barrett andPalsson 2006; Covert et al. 2004; Gianchandaniet al. 2006; Herrgard et al. 2006b; Shlomi et al.2007). A more rigorous approach would be todescribe the processes in a stoichiometric manner.This is exceedingly difficult and time-consuming,but recently progress has been made and is antic-ipated to be described in the near future (Thieleet al. 2008). As additional types of network recon-structions are developed and integrated with theconcurrent development of new methods for anal-ysis, the predictive capabilities and utility of thesemodels are likely to expand.
Acknowledgments This work was supported in part byNSF IGERT training grant DGE0504645.
Bibliography
Primary LiteratureAlmaas E, Kovacs B, Vicsek T, Oltvai ZN, Barabasi AL
(2004) Global organization of metabolic fluxes in thebacterium Escherichia coli. Nature 427:839–843
Almaas E, Oltvai ZN, Barabasi AL (2005) The activityreaction core and plasticity of metabolic networks.PLoS Comput Biol 1:e68
Alper H, Jin Y, Moxley JF, Stephanopoulos G (2005) Iden-tifying gene targets for the metabolic engineering oflycopene biosynthesis in Escherichia coli. Metab Eng7:155–164
Antoniewicz MR, Kelleher JK, Stephanopoulos G (2006)Determination of confidence intervals of metabolicfluxes estimated from stable isotope measurements.Metab Eng 8:324–337
Metabolic Systems Biology 19

Barrett CL, Palsson BO (2006) Iterative reconstruction oftranscriptional regulatory networks: an algorithmicapproach. PLoS Comput Biol 2:e52
Barrett CL, Herring CD, Reed JL, Palsson BO (2005) Theglobal transcriptional regulatory network for metabo-lism in Escherichia coli exhibits few dominant func-tional states. Proc Natl Acad Sci U S A102:19103–19108
Beard DA, Liang SD, Qian H (2002) Energy balance foranalysis of complex metabolic networks. BiophysJ 83:79–86
Becker SA, Feist AM, Mo ML, Hannum G, Palsson BO,Herrgard MJ (2007) Quantitative prediction of cellularmetabolism with constraint-based models: the COBRAtoolbox. Nat Protoc 2:727–738
Beg QK, Vazquez A, Ernst J et al (2007) Intracellularcrowding defines the mode and sequence of substrateuptake by Escherichia coli and constrains its metabolicactivity. Proc Natl Acad Sci U S A 104:12663–12668
Blank LM, Kuepfer L, Sauer U (2005) Large-scale13C-flux analysis reveals mechanistic principles ofmetabolic network robustness to null mutations inyeast. Genome Biol 6:R49
Bochner BR, Gadzinski P, Panomitros E (2001) Phenotypemicroarrays for high-throughput phenotypic testingand assay of gene function. Genome Res11:1246–1255
Brumen M, Heinrich R (1984) A metabolic osmotic modelof human erythrocytes. Biosystems 17:155–169
Burgard AP, Maranas CD (2003) Optimization-basedframework for inferring and testing hypothesized met-abolic objective functions. Biotechnol Bioeng82:670–677
Burgard AP, Pharkya P, Maranas CD (2003) Optknock: abilevel programming framework for identifying geneknockout strategies for microbial strain optimization.Biotechnol Bioeng 84:647–657
Burgard AP, Nikolaev EV, Schilling CH, Maranas CD(2004) Flux coupling analysis of genome-scale meta-bolic network reconstructions. Genome Res14:301–312
Cakir T, Patil KR, Onsan Z, Ulgen KO, Kirdar B, NielsenJ (2006) Integration of metabolome data with metabolicnetworks reveals reporter reactions. Mol Syst Biol 2:50
Caspi R, Foerster H, Fulcher CA et al (2008) The MetaCycdatabase of metabolic pathways and enzymes and theBioCyc collection of pathway/genome databases.Nucleic Acids Res 36(Database issue):D623–D631
Church GM (2005) From systems biology to syntheticbiology. Mol Syst Biol 1:0032
Covert MW, Knight EM, Reed JL, Herrgard MJ, PalssonBO (2004) Integrating high-throughput and computa-tional data elucidates bacterial networks. Nature429:92–96
Duarte NC, Becker SA, Jamshidi N et al (2007) Globalreconstruction of the human metabolic network basedon genomic and bibliomic data. Proc Natl Acad SciU S A 104:1777–1782
Edwards JS, Palsson BO (2000a) Metabolic flux balanceanalysis and the in silico analysis of Escherichia coliK-12 gene deletions. BMC Bioinformatics 1:1
Edwards JS, Palsson BO (2000b) Robustness analysis ofthe Escherichia coli metabolic network. BiotechnolProg 16:927–939
Edwards JS, Ibarra RU, Palsson BO (2001) In silico pre-dictions of Escherichia coli metabolic capabilities areconsistent with experimental data. Nat Biotechnol19:125–130
Edwards JS, Ramakrishna R, Palsson BO (2002) Charac-terizing the metabolic phenotype: a phenotype phaseplane analysis. Biotechnol Bioeng 77:27–36
Famili I, Mahadevan R, Palsson BO (2005) K-cone analy-sis: determining all candidate values for kinetic param-eters on a network scale. Biophys J 88:1616–1625
Feist AM, Henry CS, Reed JL et al (2007) A genome-scalemetabolic reconstruction for Escherichia coli K-12MG1655 that accounts for 1260 ORFs and thermody-namic information. Mol Syst Biol 3:121
Fell DA, Small JR (1986) Fat synthesis in adipose tissue.An examination of stoichiometric constraints. BiochemJ 238:781–786
Gagneur J, Klamt S (2004) Computation of elementarymodes: a unifying framework and the new binaryapproach. BMC Bioinformatics 5:175
Gasteiger E, Gattiker A, Hoogland C, Ivanyi I, Appel RD,Bairoch A (2003) ExPASy: the proteomics server forin-depth protein knowledge and analysis. NucleicAcids Res 31:3784–3788
Gianchandani EP, Papin JA, Price ND, Joyce AR, PalssonBO (2006) Matrix formalism to describe functionalstates of transcriptional regulatory systems. PLoSComputBiol 2:e101
Hamosh A, Scott AF, Amberger JS, Bocchini CA,McKusick VA (2005) Online Mendelian Inheritancein Man (OMIM), a knowledgebase of human genesand genetic disorders. Nucleic Acids Res 33:D514–D517
Henry CS, Broadbelt LJ, Hatzimanikatis V (2007)Thermodynamics-based metabolic flux analysis.Biophys J 92:1792–1805
Herrgard MJ, Fong SS, Palsson BO (2006a) Identificationof genome-scale metabolic network models usingexperimentally measured flux profiles. PLoS ComputBiol 2:e72
Herrgard MJ, Lee BS, Portnoy V, Palsson BO (2006b)Integrated analysis of regulatory and metabolic net-works reveals novel regulatory mechanisms in Saccha-romyces cerevisiae. Genome Res 16:627–635
Herring CD, Raghunathan A, Honisch C et al (2006) Com-parative genome sequencing of Escherichia coli allowsobservation of bacterial evolution on a laboratory time-scale. Nat Genet 38:1406–1412
Hohmann S, Krantz M, Nordlander B (2007) Yeast osmo-regulation. Methods Enzymol 428:29–45
Ibarra RU, Edwards JS, Palsson BO (2002) Escherichiacoli K-12 undergoes adaptive evolution to achieve insilico predicted optimal growth. Nature 420:186–189
20 Metabolic Systems Biology

Imielinski M, Belta C, Rubin H, Halasz A (2006) System-atic analysis of conservation relations in Escherichiacoli genome-scale metabolic network reveals novelgrowth media. Biophys J 90:2659–2672
Jamshidi N, Palsson BO (2006) Systems biology of SNPs.Mol Syst Biol 2:38
Jamshidi N, Palsson BO (2007) Investigating the metaboliccapabilities of mycobacterium tuberculosis H37Rvusing the in silico strain iNJ661 and proposing alterna-tive drug targets. BMC Syst Biol 1:26
Joshi A, Palsson BO (1989a) Metabolic dynamics in thehuman red cell. Part I-A comprehensive kinetic model.J Theor Biol 141:515–528
Joshi A, Palsson BO (1989b) Metabolic dynamics in thehuman red cell. Part II-Interactions with the environ-ment. J Theor Biol 141:529–545
Kanehisa M, Goto S, Kawashima S, Okuno Y, HattoriM (2004) The KEGG resource for deciphering thegenome. Nucleic Acids Res 32:D277–D280
Kim PJ, Lee DY, Kim TY et al (2007) Metabolite essenti-ality elucidates robustness of Escherichia coli metabo-lism. Proc Natl Acad Sci U S A 104:13638–13642
Kirschner MW (2005) The meaning of systems biology.Cell 121:503–504
Kitano H (2002) Computational systems biology. Nature420:206–210
Klamt S, Stelling J (2002) Combinatorial complexity ofpathway analysis in metabolic networks. Mol Biol Rep29:233–236
Klamt S, Saez-Rodriguez J, Gilles ED (2007) Structuraland functional analysis of cellular networks withCellNetAnalyzer. BMC Syst Biol 1:2
Klipp E, Nordlander B, Kruger R, Gennemark P, HohmannS (2005) Integrative model of the response of yeast toosmotic shock. Nat Biotechnol 23:975–982
Knorr AL, Jain R, Srivastava R (2007) Bayesian-basedselection of metabolic objective functions. Bioinfor-matics 23:351–357
Kummel A, Panke S, Heinemann M (2006) Putative regu-latory sites unraveled by network-embedded thermo-dynamic analysis of metabolome data. Mol Syst Biol2:2006.0034
Lee S, Palakornkule C, Domach MM, Grossmann IE(2000) Recursive MILP model for finding all the alter-nate optima in LP models for metabolic networks.Comput Chem Eng 24:711–716
Lee DY, Yun H, Park S, Lee SY (2003) MetaFluxNet: themanagement of metabolic reaction information andquantitative metabolic flux analysis. Bioinformatics19:2144–2146
Lee SJ, Lee DY, Kim TY, Kim BH, Lee J, Lee SY(2005) Metabolic engineering of Escherichia coli forenhanced production of succinic acid, based on genomecomparison and in silico gene knockout simulation.Appl Environ Microbiol 71:7880–7887
Leino RL, Gerhart DZ, van Bueren AM, McCall AL,Drewes LR (1997) Ultrastructural localization ofGLUT 1 and GLUT 3 glucose transporters in ratbrain. J Neurosci Res 49:617–626
Mahadevan R, Schilling CH (2003) The effects of alternateoptimal solutions in constraint-based genome-scalemetabolic models. Metab Eng 5:264–276
Marhl M, Schuster S, Brumen M, Heinrich R (1997)Modeling the interrelations between the calcium oscil-lations and ER membrane potential oscillations.Biophys Chem 63:221–239
Palsson BØ (2006) Systems biology: properties ofreconstructed networks. Cambridge University Press,Cambridge
Papin JA, Palsson BO (2004) The JAK-STAT signalingnetwork in the human B-cell: an extreme signalingpathway analysis. Biophys J 87:37–46
Papin JA, Price ND, Edwards JS, Palsson BBO (2002a)The genome-scale metabolic extreme pathway struc-ture in Haemophilus influenzae shows significant net-work redundancy. J Theor Biol 215:67–82
Papin JA, Price ND, Palsson BO (2002b) Extreme pathwaylengths and reaction participation in genome-scale met-abolic networks. Genome Res 12:1889–1900
Papin JA, Reed JL, Palsson BO (2004a) Hierarchical think-ing in network biology: the unbiased modularization ofbiochemical networks. Trends Biochem Sci29:641–647
Papin JA, Stelling J, Price ND, Klamt S, Schuster S,Palsson BO (2004b) Comparison of network-basedpathway analysis methods. Trends Biotechnol22:400–405
Papin JA, Hunter T, Palsson BO, Subramaniam S (2005)Reconstruction of cellular signalling networks andanalysis of their properties. Nat Rev Mol Cell Biol6:99–111
Papoutsakis ET (1984) Equations and calculations for fer-mentations of butyric acid bacteria. Biotechnol Bioeng26:174–187
Patil KR, Rocha I, Forster J, Nielsen J (2005) Evolutionaryprogramming as a platform for in silico metabolic engi-neering. BMC Bioinformatics 6:308
Pharkya P, Maranas CD (2006) An optimization frame-work for identifying reaction activation/inhibition orelimination candidates for overproduction in microbialsystems. Metab Eng 8:1–13
Pharkya P, Burgard AP, Maranas CD (2004) OptStrain: acomputational framework for redesign of microbialproduction systems. Genome Res 14:2367–2376
Price ND, Papin JA, Palsson BO (2002) Determination ofredundancy and systems properties of the metabolicnetwork of Helicobacter pylori using genome-scaleextreme pathway analysis. Genome Res 12:760–769
Price ND, Reed JL, Palsson BO (2004a) Genome-scalemodels of microbial cells: evaluating the consequencesof constraints. Nat Rev Microbiol 2:886–897
Price ND, Schellenberger J, Palsson BO (2004b) Uniformsampling of steady-state flux spaces: means to designexperiments and to interpret enzymopathies. BiophysJ 87:2172–2186
Price ND, Thiele I, Palsson BO (2006) Candidate states ofHelicobacter pylori’s genome-scale metabolic network
Metabolic Systems Biology 21

upon application of “loop law” thermodynamic con-straints. Biophys J 90:3919–3928
Reed JL, Palsson BO (2004) Genome-scale in silicomodels of E. coli have multiple equivalent phenotypicstates: assessment of correlated reaction subsets thatcomprise network states. Genome Res 14:1797–1805
Reed JL, Vo TD, Schilling CH, Palsson BO (2003) Anexpanded genome-scale model of Escherichia coliK-12 (iJR904 GSM/GPR). Genome Biol 4:R54
Reed JL, Famili I, Thiele I, Palsson BO (2006a) Towardsmultidimensional genome annotation. Nat Rev Genet7:130–141
Reed JL, Patel TR, Chen KH et al (2006b) Systemsapproach to refining genome annotation. Proc NatlAcad Sci U S A 103:17480–17484
Riley M, Abe T, Arnaud MB et al (2006) Escherichia coliK-12: a cooperatively developed annotation snapshot-2005. Nucleic Acids Res 34:1–9
Satish Kumar V, Dasika MS, Maranas CD (2007) Optimi-zation based automated curation of metabolic recon-structions. BMC Bioinformatics 8:212
Sauer U (2006) Metabolic networks in motion: 13C-basedflux analysis. Mol Syst Biol 2:62
Savinell JM, Palsson BO (1992) Network analysis of inter-mediary metabolism using linear optimization.I Development of mathematical formalism. J TheorBiol 154:421–454
Schilling CH, Letscher D, Palsson BO (2000) Theory forthe systemic definition of metabolic pathways and theiruse in interpreting metabolic function from a pathway-oriented perspective. J Theor Biol 203:229–248
Schomburg I, Chang A, Ebeling C et al (2004) BRENDA,the enzyme database: updates and major new develop-ments. Nucleic Acids Res 32:D431–D433
Schuetz R, Kuepfer L, Sauer U (2007) Systematic evalua-tion of objective functions for predicting intracellularfluxes in Escherichia coli. Mol Syst Biol 3:119
Schuster S, Hilgetag C (1994) On elementary fluxmodes inbiochemical reaction systems at steady state. J Biol Syst2:165–182
Schuster S, Hilgetag C, Woods JH, Fell DA (2002) Reac-tion routes in biochemical reaction systems: algebraicproperties, validated calculation procedure and exam-ple from nucleotide metabolism. J Math Biol45:153–181
Segre D, Vitkup D, Church GM (2002) Analysis of opti-mality in natural and perturbed metabolic networks.Proc Natl Acad Sci U S A 99:15112–15117
Shlomi T, Berkman O, Ruppin E (2005) Regulatory on/offminimization of metabolic flux changes after geneticperturbations. Proc Natl Acad Sci U S A102:7695–7700
Shlomi T, Eisenberg Y, Sharan R, Ruppin E (2007)A genome-scale computational study of the interplaybetween transcriptional regulation and metabolism.Mol Syst Biol 3:101
Smallbone K, Simeonidis E, Broomhead DS, Kell DB(2007) Something from nothing: bridging the gap
between constraint-based and kinetic modelling.FEBS J 274:5576–5585
Stelling J, Klamt S, Bettenbrock K, Schuster S, Gilles ED(2002) Metabolic network structure determines keyaspects of functionality and regulation. Nature420:190–193
Taegtmeyer H, McNulty P, Young ME (2002) Adaptationand maladaptation of the heart in diabetes: part I: gen-eral concepts. Circulation 105:1727–1733
Thiele I, Price ND, Vo TD, Palsson BO (2005) Candidatemetabolic network states in human mitochondria.Impact of diabetes, ischemia, and diet. J Biol Chem280:11683–11695
Thiele I, Jamshidi N, Fleming RMT, Palsson BØ(2008) Genome-scale reconstruction of E. coli’s tran-scriptional and translational machinery: a knowledge-base and its mathematical formulation. (under review)
Trawick JD, Schilling CH (2006) Use of constraint-basedmodeling for the prediction and validation of antimi-crobial targets. Biochem Pharmacol 71:1026–1035
Varma A, Palsson BO (1993a) Metabolic capabilities ofEscherichia coli: I. Synthesis of biosynthetic precursorsand cofactors. J Theor Biol 165:477–502
Varma A, Palsson BO (1993b) Metabolic capabilities ofEscherichia coli II. Optimal growth Patterns. J TheorBiol 165:503–522
Varma A, Palsson BO (1994) Metabolic flux balancing:basic concepts, scientific and practical use. NatBiotechnol 12:994–998
Varma A, Boesch BW, Palsson BO (1993) Stoichiometricinterpretation of Escherichia coli glucose catabolismunder various oxygenation rates. Appl Environ Micro-biol 59:2465–2473
Vastrik I, D’Eustachio P, Schmidt E et al (2007) Reactome:a knowledge base of biologic pathways and processes.Genome Biol 8:R39
Vo TD, Greenberg HJ, Palsson BO (2004) Reconstructionand functional characterization of the humanmitochon-drial metabolic network based on proteomic and bio-chemical data. J BiolChem 279:39532–39540
Wiback SJ, Famili I, Greenberg HJ, Palsson BO(2004) Monte Carlo sampling can be used to determinethe size and shape of the steady-state flux space. J TheorBiol 228:437–447
Yeung M, Thiele I, Palsson BO (2007) Estimation of thenumber of extreme pathways for metabolic networks.BMC Bioinformatics 8:363
Books and ReviewsFiest AM, Palsson BØ (2008) The growing scope of appli-
cations of genome-scale metabolic reconstructions: thecase of E. coli. Nat Biotechnol 26:659–667
Joyce AR, Palsson BØ (2007) Toward whole cell modelingand simulation: comprehensive functional genomicsthrough the constraint-based approach. In: BoshoffHI, Barry CE III (eds) Systems biological approachesin infectious diseases, vol 265. Birkhauser Verlag,Basel, pp 267–309
22 Metabolic Systems Biology

Mo ML, Jamshidi N, Palsson BØ (2007) A genome-scale,constraint-based approach to systems biology of humanmetabolism. Mol BioSyst 3:9
Thiele I, Palsson BØ (2007) Bringing genomes to life: theuse of genome-scale in silico models. In: ChoiS (ed) Introduction to systems biology. HumanaPress, Totowa
Metabolic Systems Biology 23