Metabolic Repression of Transcription in Higher Plants · Metabolic Repression of Transcription in...
13
The Plant Cell, Vol. 2, 1027-1 038, October 1990 O 1990 American Society of Plant Physiologists Metabolic Repression of Transcription in Higher Plants Jen Sheen Department of Genetics, Harvard Medical School, and Department of Molecular Biology, Massachusetts General Hospital, Boston, Massachusetts 02114 Using freshly isolated maize mesophyll protoplasts and a transient expression method, I showed that the transcrip- tional activity of seven maize photosynthetic gene promoters is specifically and coordinately repressed by the photosynthetic end products sucrose and glucose and by the exogenous carbon source acetate. Analysis of deleted, mutated, and hybrid promoters showed that sugars and acetate inhibit the activity of distinct positive upstream regulatory elements without a common consensus. The metabolic repression of photosynthetic genes overrides other forms of regulation, e.g., light, tissue type, and developmental stage. Repression by sugars and repression by acetate are mediated by different mechanisms. The identification of conditions that avoid sugar repression overcomes a major obstacle to the study of photosynthetic gene regulation in higher plants. INTRODUCTION Photosynthesis involves the most important metabolic pathways in the vegetative phase of higher plants. Among the essential substrates for photosynthesis, C02, water, and light, light is well documented to be an important regulator of photosynthetic gene expression (Simpson et al., 1986; Kuhlemeier et al., 1987; Schell, 1987; Ha and An, 1988; Benfey and Chua, 1989; Ueda et al., 1989). However, little is known about the contribution of other metabolites to the regulation of photosynthetic gene expression, even though metabolic regulation is well known at the leve1 of enzyme activity in photosynthesis (Woodrow and Berry, 1988). Because a large number of genes are involved in photosynthetic pathways, it is rea- sonable to speculate that some type of metabolic regu- lation might exist to maintain economical use of the pathways. To date, the study of photosynthetic gene regulation has relied solely on transgenic plants (Kuhlemeier et al., 1987; Schell, 1987; Benfey and Chua, 1989). Although informative, the study of transgenic plants is cumbersome and limited for routine analysis to a few easily transformed dicot species. The multicellular nature of transgenic plants also creates difficulties for the study of metabolic regula- tion. In contrast, transient expression in protoplasts is convenient and powerful, and has been used successfully to study gene regulation by plant hormones (Marcotte et al., 1988), UV light (Lipphardt et al., 1988), heat shock (Callis et al., 1988), and anaerobic stress (Walker et al., 1987). However, the study of photosynthetic gene regu- lation in protoplasts has not been vigorously pursued because it is widely believed that photosynthetic genes are suppressed in mesophyll protoplasts by osmotic stress (Fleck et al., 1982; Vernet et al., 1982). In the course of developing a protoplast transient expression method to study photosynthetic gene regulation, I discovered that the inhibition of photosynthetic gene expression in proto- plasts is likely the result of photosynthetic end product repression by sucrose and glucose. Sucrose and glucose are two commonly used osmotica in tobacco protoplast culture (Nagy and Maliga, 1976) in which repression of photosynthetic genes was shown previously (Fleck et al., 1982; Vernet et al., 1982). Here, I present evidence that the transcriptional activity of seven photosynthetic gene promoters is repressed specifically and coordinately by sugars. Although glucose repression in fscherichia coli and yeast is a type of catabolite repression, the glucose repression in photosynthetic higher plants should probably be called a type of anabolite repression because excess sugars inhibit the photosynthetic anabolic pathways. To determine whether photosynthetic genes are subject to other forms of metabolic regulation, further studies with various reagents were carried out. These experiments demonstrated that acetate, a common carbon source for green algae, also mediated anabolite repression in higher plants. Analysis of deleted, mutated, and hybrid promoters showed that sugars and acetate inhibited the activity of distinct positive upstream regulatory elements. RESULTS Transient Expression in Maize Mesophyll Protoplasts To determine whether maize mesophyll protoplasts can be used for transient expression assays, two constructs
Transcript of Metabolic Repression of Transcription in Higher Plants · Metabolic Repression of Transcription in...

The Plant Cell, Vol. 2, 1027-1 038, October 1990 O 1990 American Society of Plant Physiologists
Metabolic Repression of Transcription in Higher Plants
Jen Sheen Department of Genetics, Harvard Medical School, and Department of Molecular Biology, Massachusetts General Hospital, Boston, Massachusetts 021 14
Using freshly isolated maize mesophyll protoplasts and a transient expression method, I showed that the transcrip- tional activity of seven maize photosynthetic gene promoters is specifically and coordinately repressed by the photosynthetic end products sucrose and glucose and by the exogenous carbon source acetate. Analysis of deleted, mutated, and hybrid promoters showed that sugars and acetate inhibit the activity of distinct positive upstream regulatory elements without a common consensus. The metabolic repression of photosynthetic genes overrides other forms of regulation, e.g., light, tissue type, and developmental stage. Repression by sugars and repression by acetate are mediated by different mechanisms. The identification of conditions that avoid sugar repression overcomes a major obstacle to the study of photosynthetic gene regulation in higher plants.
INTRODUCTION
Photosynthesis involves the most important metabolic pathways in the vegetative phase of higher plants. Among the essential substrates for photosynthesis, C02, water, and light, light is well documented to be an important regulator of photosynthetic gene expression (Simpson et al., 1986; Kuhlemeier et al., 1987; Schell, 1987; Ha and An, 1988; Benfey and Chua, 1989; Ueda et al., 1989). However, little is known about the contribution of other metabolites to the regulation of photosynthetic gene expression, even though metabolic regulation is well known at the leve1 of enzyme activity in photosynthesis (Woodrow and Berry, 1988). Because a large number of genes are involved in photosynthetic pathways, it is rea- sonable to speculate that some type of metabolic regu- lation might exist to maintain economical use of the pathways.
To date, the study of photosynthetic gene regulation has relied solely on transgenic plants (Kuhlemeier et al., 1987; Schell, 1987; Benfey and Chua, 1989). Although informative, the study of transgenic plants is cumbersome and limited for routine analysis to a few easily transformed dicot species. The multicellular nature of transgenic plants also creates difficulties for the study of metabolic regula- tion. In contrast, transient expression in protoplasts is convenient and powerful, and has been used successfully to study gene regulation by plant hormones (Marcotte et al., 1988), UV light (Lipphardt et al., 1988), heat shock (Callis et al., 1988), and anaerobic stress (Walker et al., 1987). However, the study of photosynthetic gene regu- lation in protoplasts has not been vigorously pursued because it is widely believed that photosynthetic genes are suppressed in mesophyll protoplasts by osmotic stress (Fleck et al., 1982; Vernet et al., 1982). In the course of
developing a protoplast transient expression method to study photosynthetic gene regulation, I discovered that the inhibition of photosynthetic gene expression in proto- plasts is likely the result of photosynthetic end product repression by sucrose and glucose. Sucrose and glucose are two commonly used osmotica in tobacco protoplast culture (Nagy and Maliga, 1976) in which repression of photosynthetic genes was shown previously (Fleck et al., 1982; Vernet et al., 1982). Here, I present evidence that the transcriptional activity of seven photosynthetic gene promoters is repressed specifically and coordinately by sugars. Although glucose repression in fscherichia coli and yeast is a type of catabolite repression, the glucose repression in photosynthetic higher plants should probably be called a type of anabolite repression because excess sugars inhibit the photosynthetic anabolic pathways. To determine whether photosynthetic genes are subject to other forms of metabolic regulation, further studies with various reagents were carried out. These experiments demonstrated that acetate, a common carbon source for green algae, also mediated anabolite repression in higher plants. Analysis of deleted, mutated, and hybrid promoters showed that sugars and acetate inhibited the activity of distinct positive upstream regulatory elements.
RESULTS
Transient Expression in Maize Mesophyll Protoplasts
To determine whether maize mesophyll protoplasts can be used for transient expression assays, two constructs

1028 The Plant Cell
that contain the cauliflower mosaic virus 35s (35s) pro- moter and two reporter genes that encode chlorampheni- col acetyltransferase (CAT) and (3-glucuronidase (GUS) were electroporated into freshly isolated maize mesophyll protoplasts. The experiment was repeated six times for each construct to evaluate the sensitivity and the repro- ducibility of electroporation and CAT and GUS assays. As shown in Table 1, the 35s promoter directed a high level of CAT and GUS expression in maize mesophyll proto- plasts. Both CAT and GUS activities could be detected in cell extracts prepared from less than 100 protoplasts electroporated with 35SCAT or 35SGUS. Although both CAT and GUS assays are very sensitive, the fluorogenic assay for GUS activity (Jefferson, 1987) has a 10-fold higher background and more errors among repeated sam- ples than the isotopic and phase extraction assay for CAT activity (Seed and Sheen, 1988).
Sugar Repression
To determine whether photosynthetic gene promoters are active in mesophyll protoplasts, a chimeric gene was con- structed with the maize C4 pyruvate phosphodikinase (PPDK) gene (C4ppdkZm7) promoter fused to the CAT coding sequence and the 3' sequence of the nopaline synthase gene (nos). The C,ppdkZm7 encodes the chlo- roplast isoform of PPDK, which is the key enzyme of the C4 pathway in C4 photosynthesis. As shown in Figure 1, a high level of CAT activity was detected after plasmid DNA containing this chimeric gene was electroporated into freshly explanted maize mesophyll protoplasts cultured in 0.6 M mannitol solution. A similar plasmid without the C4ppdkZm7 promoter did not direct CAT activity. To de- termine whether sucrose or glucose, two photosynthetic end products commonly used as stabilizers for protoplast culture, would inhibit the activity of a light-regulated pho- tosynthetic gene promoter, electroporated protoplasts were cultured in solutions containing 0.3 M sucrose or
glucose in addition to 0.3 M mannitol. The promoter activity of C4ppdkZm7 was decreased more than 15-fold in the presence of either sucrose or glucose (Figure 1). In the same experiment, two control plasmids bearing the 35s and the nos promoters directed similar levels of CAT activity (less than twofold difference) in mesophyll proto- plasts cultured with or without sucrose or glu- cose (Figure 1). Therefore, the sugar inhibition of the C4ppdkZm7 promoter was not the result of a nonspecific inhibition of transcriptional activity in protoplasts.
Acetate Repression
With a convenient transient expression tool in hand, it is feasible to find out rapidly whether another type of meta- bolic repression exists in higher plants. Four more sugars, various metabolic intermediates, severa1 common carbon sources, nitrogen sources, salts, and plant hormones were also tested for their ability to mediate repression. As shown in Table 2, acetate was found to be a potent inhibitor (more than 50-fold repression) and glycerol and fructose were found to be mild inhibitors (about 1 O-fold repression). Acetate is a commonly used carbon source for the heter- otrophic growth of Chlamydomonas and has been shown to inhibit the expression of chlorophyll a/b-binding protein, an essential polypeptide for light capture in photosynthesis (Kindle, 1987). The inhibition of photosynthetic gene pro- moter activity by acetate in maize seems to imply the existence of similar repression in higher plants.
Metabolic Repression 1s Coordinated among Photosynthetic Gene Promoters
To learn how widespread the repression effect is among other photosynthetic genes, the promoters of the C4 phos- phoenolpyruvate carboxylase gene (C4pepcZm7), C4 malic enzyme gene (C4meZm7), chlorophyll a/b-binding protein
Table 1. Expression of 35SCAT and 35SGUS in Maize Mesophyll Protoplasts
Relative CAT Activity
Samples 35SCAT Samples No Plasmid Samples 35SGUS Samples No Plasmid
1 22.7 1 0.13 1 40.4 1 2.1 2 22.6 2 0.14 2 42.2 2 2.0 3 22.6 3 0.1 4 3 50.7 3 2.3 4 20.3 4 0.1 2 4 39.6 4 2.3 5 20.6 5 0.13 5 49.7 5 3.0 6 21.8 6 0.14 6 51.2 6 2.9 SO 0.98 SD 0.006 SD 4.98 SD 0.382
Results of six replicas are shown. 60th CAT and GUS assays were performed with cell extracts from 2 x 10³ protoplasts for 90 min. The relative CAT activity was expressed in counts per minute divided by 1000. The relative GUS activity was the direct fluorescence reading divided bv 10. The exDeriment was repeated twice with similar results. SD: standard deviatibn.
Relative GUS Activity

Metabolic Repression in Higher Plants 1029
35s
Promoter and CAT fusions
CAT nos
-507 +72
-1 -155
Relative CAT activity
(Relative GUS activity)
mannitol sucrose glucose
10.0 (22.7) 0.7 (18.5) 0.2 (18.9) 9.9 (26.3) 0.5 (15.2) 0.1 (19.0) 10.4 (21.3) 0.6 (17.1) 0.2 (18.0)
23.8 15.1 15.7 23.7 13.3 13.6
11.9 8.1 8.6 10.8 7.1 7.3
0.0 0.0 0.0 0.0 0.0 0.0
Figure 1. Transient Expression of C4ppdkZml CAT, 35SCAT, and nosCAT in Maize Mesophyll Protoplasts and the Effect of Sugars.
The plasmid DNA of C4ppdkZmlCAT (55 pg), 35SCAT (50 pg), and nosCAT (50 pg) was electroporated into 3 x 10⁵ maize mesophyll protoplasts. 35SGUS (30 pg) was cotransfected with C,ppdkZml CAT during electroporation as interna1 control. Each electroporated sample was divided into three parts (1 x 10⁵ protoplasts each) and cultured in 1 mL of 0.6 M mannitol, 1 mL of 0.3 M sucrose plus 0.3 M mannitol, and 1 mL of 0.3 M glucose plus 0.3 M mannitol. CAT assay was performed with cell extracts from 5 x 1 O4 protoplasts for C,ppdkZml CAT and nosCAT, and from 2 x 1 O3 protoplasts for 35SCAT. Relative CAT activity was expressed in counts per minute divided by 1000. GUS assay was performed with cell extracts from 2 x 10³ protoplasts. Relative GUS activity was the direct fluorescence reading divided by 10. Three replicas were performed with C4ppdkZml CAT and two replicas were performed with 35SCAT, nosCAT, and blueCAT (without a promoter). The experiment was repeated once with similar results.
genes (cabZm 7 , cabZm5) and ribulosebisphosphate car- boxylase small subunit genes (rbcSZm7 and rbcSZm3) were fused to the CAT coding sequence and the 3' sequence of nos. Promoters of three other nonphotosyn- thetic genes, 35S, nos, and maize alcohol dehydrogenase gene (Adh7), were similarly fused to the CAT and nos 3' sequences, as well as the promoter of a cytosolic PPDK gene (cyppdkZm7), which encodes the cytosolic isoform of PPDK that might be involved in carbon metabolism. As shown in Table 3 and Table 4, the activity of all photosyn- thetic gene promoters was repressed about threefold to 20-fold by sugars and about 20-fold to 200-fold by ace- tate. The repression by glucose was generally stronger than the repression by sucrose. Glycerol only repressed the activity of two photosynthetic gene promoters, C,ppdkZm7 (1 O-fold) and cabZm7 (fivefold) (data not shown). In contrast, less than twofold repression was found for most nonphotosynthetic gene promoters by sug- ars and at least one nonphotosynthetic gene promoter by acetate in the same experiment (Tables 3 and 4). However,
sugars but not acetate repressed the activity of the cyppdkZm7 promoter (Tables 3 and 4). Although the pre- cise role of the cyppdkZm7 gene product is not known at present, these data suggest that it might be involved in
Table 2. Effects of Various Reagents on C4ppdkZmlCAT Exoression
Reagents Relative -Fold CAT Activity Repression
Mannitol Sorbitol Sucrose Glucose Fructose Galactose Lactose Xylose Ammonium sulfate Potassium nitrate Sodium pyrophosphate Sodium phosphate 2,4-Dichlorophenoxyacetate Benzylaminopurine K3 salts Pyruvate Phosphoenolpyruvate Oxalacetate Malate Glyceraldehyde 3-phosphate Dihydroxyacetone phosphate Aspartate Glutamate lsocitrate Citrate Succinate Glyoxylate Acetate Ethanol Glycerol
10.19 1 .o 6.1 1 1.7 0.69 14.8 0.59 17.3 0.90 11.3 3.24 3.1
11.34 0.9 7.61 1.3
16.36 0.6 11.17 0.9 10.55 1 .o 9.19 1.1 8.73 1.2
10.22 1 .o 3.48 2.9 7.22 1.4 5.45 1.9 9.59 1.1
17.97 0.6 7.33 1.4 6.59 1.5 9.88 1 .o 8.1 1 1.3 7.21 1.4 5.98 1.7 4.88 2.1 3.06 3.3 0.1 6 63.7
12.17 0.8 0.81 12.6
Protoplasts from 1 O electroporated samples (3 x 1 O5 protoplasts transfected with 50 pg of C4ppdkZml CAT) were pooled together and distributed (105 each) into 1 mL of 0.6 M mannitol solution containing various reagents. The osmolarity was maintained roughly equal to 0.6 M mannitol solution. The concentration of various sugars is 0.3 M. The concentration of other reagents is 5 mM for salts, nitrogen sources, and metabolic intermediates, 3 mM for acetate, 2 mg/L for plant hormones, and 5% (v/v) for ethanol and glycerol. K3 salt is the mix of salts in K3 medium (Nagy and Maliga, 1976). The experiment was repeated once with similar results. Similar results were obtained when the concentra- tion of some salts and metabolic intermediates was increased up to 50 mM (data not shown). Fructose 6-phosphate (10 mM) and fructose 1,6-phosphate (1 O mM) were tested without significant effect (data not shown). -Fold repression was calculated relative to the expression in mannitol. CAT activity was assayed with cell extract from 5 x 10⁴ protoplasts.

1030 The Plant Cell
Sugar Repression and Acetate Repression Are Concentration Dependent and Physiologically Significant
Table 3. Effects of Sugars on Photosynthetic and Nonphotosynthetic Gene Promoter Activities
Promoter and CAT Fusions (Cotransfection GUS Fusion) Mannitol Sucrose Glucose Sugar repression allowed a low level of basal expression
Relative C A I (GUS) Activity
C,ppdkZmlCAT (35SGUS) 9.6 (37.1) 0.7 (21.1) 0.4 (18.9) C,pepcZmlCAT (35SGUS) 7.2 (35.7) 2.3 (18.3) 0.9 (17.6) C4meZmlCAT (35SGUS) 5.4 (26.7) 1.3 (13.2) 0.6 (12.4) cabZml CAT (35SGUS) 18.2 (30.4) 4.9 (1 5.5) 1.8 (1 6.2) cabZm5CAT (35SGUS) 21.8 (27.6) 2.0 (15.2) 1.8 (17.4) rbcSZmlCAT (35SGUS) 22.0 (30.9) 1.7 (18.6) 0.6 (19.1) rbcSZm3CAT (35SGUS) 7.5 (33.2) 1.6 (15.8) 0.3 (15.1) 35SCAT 34.2 20.1 19.7 nosCAT 20.7 12.7 11.9 Adhl CAT 5.6 4.7 4.3 cyppdkZmlCAT (35SGUS) 19.3 (27.6) 3.4 (17.7) 0.6 (19.6)
Cell extract from 5 x 10⁴ protoplasts was used for CAT assay except the 35SCAT sample (2 x 10³ protoplasts). Cell extract from 2 x 1 O3 protoplasts was used for GUS assay. Relative GUS activity of cotransfection is shown in parentheses. Similar results were obtained when the experiment was repeated three times without cotransfection and once with cotransfection. The con- struction of photosynthetic gene promoter and CAT fusions will be described elsewhere (J. Sheen, A. Schaffner, and H. Huang, unmblished data).
both photosynthetic and nonphotosynthetic carbon metab- olism. The insensitivity of cyppdkzml promoter activity to acetate shows that sugar repression and acetate repres- sion are mediated by distinct mechanisms.
The detection of the rbcSZml, rbcSZm3, and C,meZml promoter activities in the mesophyll protoplasts was un- expected initially because the rbcS and C4me mRNAs only accumulate in bundle sheath cells but not mesophyll cells of greening maize leaves (Sheen and Bogorad, 1986b, 1987). However, the results of in vitro labeled RNA from cell type-specific nuclei indicate that all bundle sheath- specific genes are regulated at the post-transcriptional level (J. Sheen, unpublished results). The Adhl and nos promoters are shown here to be active in maize mesophyll protoplasts. The results are not unexpected because two isoforms of alcohol dehydrogenase are found in maize leaves (Scandalios, 1974) and the nos promoter is active in tobacco mesophyll cells (Simpson et al., 1986).
The cotransfections of 35SGUS and cyppdkZml GUS were used as interna1 controls for sugar and acetate repression, respectively (Tables 3 and 4). The 35SGUS was not included in the samples of 35SCAT, nosCAT, and Adhl CAT because of promoter interferences (data not shown). The expression of cyppdkZml GUS in cotransfec- tion experiments was slightly affected by other promoters (Table 4).
that was not inhibited even with 0.6 M of sucrose, as shown in Table 5. When the concentration of sucrose was decreased from 300 mM to the lower level found in normal photosynthetically active cells (30 mM) (Gerhard et al., 1987), sugar repression was no longer significant (Table 5). Therefore, it is possible that sugar inhibition is a type of feedback regulation and only occurs when the accu- mulation of sugars in cells is above certain physiological limits.
The effective concentration of acetate for repression has a very narrow range (1 mM to 3 mM) and is only slightly higher than the endogenous concentration of acetate (0.25 mM to 1 mM) found in leaf cells probably derived from a number of sources (Kuhn et al., 1981 ; Murphy and Stumpf, 1981). As shown in Table 6, when the concentration of acetate applied to protoplasts was decreased to 0.3 mM, repression was no longer detectable (less than twofold repression). These experiments suggest that acetate repression is sensitive, stringent, and physiologically sig- nificant. However, it is not clear where the sensor for acetate is located and how the signal is transmitted in the leaf cell.
Table 4. Effect of Acetate on Photosynthetic and Nonphotosynthetic Gene Promoter Activity
Relative CAT (GUS) Activity Promoter and CAT Fusions (Cotransfection GUS Fusion) No Acetate 3 mM Acetate
~~ ~ ~
C4ppdkZml CAT (cyppdk- 25.3 (23.0) 1.5 (1 1.7)
C,pepcZml CAT (cyppdk- 8.5 (25.5) 0.1 (8.8)
C,meZml CAT (cyppdk- 7.5 (24.8) 0.2 (6.2)
cabZmlCAT (cyppdkzml GUS) 24.8 (24.6) 0.3 (8.6) cabZm5CAT (cyppdkZmlGUS) 30.1 (19.9) 0.2 (6.6) rbcSZml CAT (cyppdk- 13.3 (15.1) 0.5 (7.1)
rbcSZm3CAT (cyppdk- 8.9 (17.1) 0.04 (6.7)
35SCAT (cyppdkZmlGUS) 54.9 (33.3) 6.3 (19.4) nosCAT (cyppdkZmlGUS) 28.6 (38.5) 4.8 (10.9) AdhlCAT (cyppdkZmlGUS) 8.3 (28.1) 1 .O (8.3) cyppdkZml CAT 13.2 8.8
CAT assay was the same as described in Table 3. Cell extract from 104 protoplasts was used for GUS assay. Relative GUS activity of cotransfection is shown in parentheses. Similar results were obtained when the experiment was repeated three times without cotransfection and once with cotransfection.
ZmlGUS)
Zml GUS)
Zml GUS)
Zml GUS)
Zml GUS)

Metabolic Repression in Higher Plants 1031
Table 5. Concentration Dependence of Sugar Repression
Sucrose Concentration and Relative CAT Activity
Promoter and CAT Fusions
~~~~~ ~ ~
1 O0 300 O mM 30 mM mM mM 600 mM
~~
C4ppdkZml CAT C4pepcZml CAT rbcSZml CAT 35SCAT nosCAT
~~~~~~~~~~~
53.85 16.20 8.65 2.10 2.05 25.89 13.19 7.03 2.97 2.97 56.66 28.73 14.70 7.70 7.42
181.73 150.37 115.36 100.02 - 23.49 12.70 9.92 9.14 -
Cell extract from 1 O5 protoplasts was used for CAT assay except the 35SCAT sample (3 x 1 O4 protoplasts). The experiment was repeated once.
Repression 1s Mediated by Distinct Positive Upstream Regulatory Elements
To identify the DNA sequences responsible for repression, a set of mutated C4ppdkZm7 and cabZm5 promoters was created by deletion, mutagenesis, and promoter sequence interchange and analyzed for repression by sugars and acetate. The deletions spanned multiple positive and neg- ative upstream regulatory elements of the promoters (J. Sheen and H. Huang, unpublished results). Similar repres- sion was observed for all promoters deleted to within 30 bp to 50 bp upstream of the TATA box. Further deletion gave weak promoter activity that did not appear to be repressed, as shown in Figure 2. These results suggested that all of the positive upstream regulatory elements were susceptible to repression. To exclude the possibility that repression might be mediated by the basal promoter ele- ments of photosynthetic gene promoters, three hybrid promoters derived from 35s and C4ppdkZm7 promoters were analyzed (Figure 2). When positive upstream regu-
Table 6. Concentration Dependence of Acetate Repression
Acetate Concentration and Relative CAT (GUS) Activity
Promoter and CAT O 0.1 0.3 1.0 3.0 Fusions (Cotransfection) mM mM mM mM mM
C4ppdkZml CAT 8.1 5.9 4.4 1.3 0.7 (CyppdkZml GUS) (15.6)(13.4) (13.7) (15.4) (16.7) CabZm5CAT 21.7 9.3 9.6 1.2 0.2 (cyppdkzml GUS) (23.6)(16.7) (16.1) (12.1) (14.3) cyppdkZm1 CAT 10.8 7.8 6.2 6.7 8.5
latory elements of the C4ppdkZm7 promoter were placed upstream of the 35s basal promoter element, expression was repressed. Conversely, when the positive regulatory elements of the 35s promoter were placed upstream of the C4ppdkZm 7 basal promoter elements, little repression was observed (Figure 2). Moreover, when the 16-bp en- hancer of the octopine synthase promoter (ocs) (Ellis et al., 1987) was fused to the basal promoter of cabZm5, or substituted two of the positive regulatory elements in the C4ppdkZm7 promoter (J. Sheen, unpublished results), the ocscab5 promoter and the mutated photosynthetic pro- moters (C,ppdkmutl and C4ppdkmut2) became insensitive to repression, as shown in Figures 3 and 4.
Thus, the positive upstream regulatory elements appear to mediate repression by sugars and acetate. The involve- ment of the upstream negative element as proposed in yeast glucose repression (Beier and Young, 1982; Struhl, 1985) is unlikely because the upstream deletions did not eliminate repression, and a 16-bp nonresponsive enhancer converts a photosynthetic gene promoter from responsive (cabZm5, C4ppdkZml) to nonresponsive (ocscab5, C4ppdkmutl, and C4ppdkmut2) (Figures 3 and 4). The possibility of post-transcriptional regulation can also be excluded. As shown in Figure 2, identical CAT mRNA should be synthesized from various deleted promoters, and repression depends on the presence of upstream positive elements (Figure 2). Moreover, in the case of hybrid and mutated promoters, the CAT mRNAs synthe- sized contain either 35s (C4ppdk35Shybl), cabZm5 (ocscab5), or C4ppdkZm7 (35SC4ppdkhybl, hyb2, C4ppdkmutl, mut2) untranslated leader sequences, but repression depends exclusively on the type of upstream positive elements (Figures 2, 3, and 4).
Cell extract from 5 x 1 O4 protoplasts was used for CAT assay. Cell extract from 104 protoplasts was used for GUS assay. Rela- tive GUS activity of cotransfection is shown in parentheses. The experiment was repeated twice without cotransfection and once with cotransfection with similar results.
DISCUSSION
The experiments reported here demonstrate that, as in unicellular bacteria and yeast, genes involved in metabolic
1032 The Plant Cell
C4ppdkZmlCAT
Promoter and CAT fusions
I CAT lnos
cabdellCAT
cabdel2CAT
-138 +71
cabdel3CAT
-54 +71
35SCAT -430 + I + -430 -401-51 +72
35SC4ppdkhybl CAT I CAT 1nos1
35SC4ppdkhybZCAT "1 -430 -251-29 +72
r, C4ppdk35ShyblCAT 1 I CAT lnosl
-507 -441-45 +1
Relative CAT activity
mannitol
23.3
22.0
9.7
0.4
27.1
30.1
16.1
0.2
185.7
178.7
188.6
19.0
glucose acetate
0.7 0.8
1.8 1.3
0.8 1.4
0.3 0.2
1.6 0.3
3.2 0.3
0.8 0.2
0.2 0.2
115.1 50.0
135.1 66.7
147.9 59.2
0.6 2.0
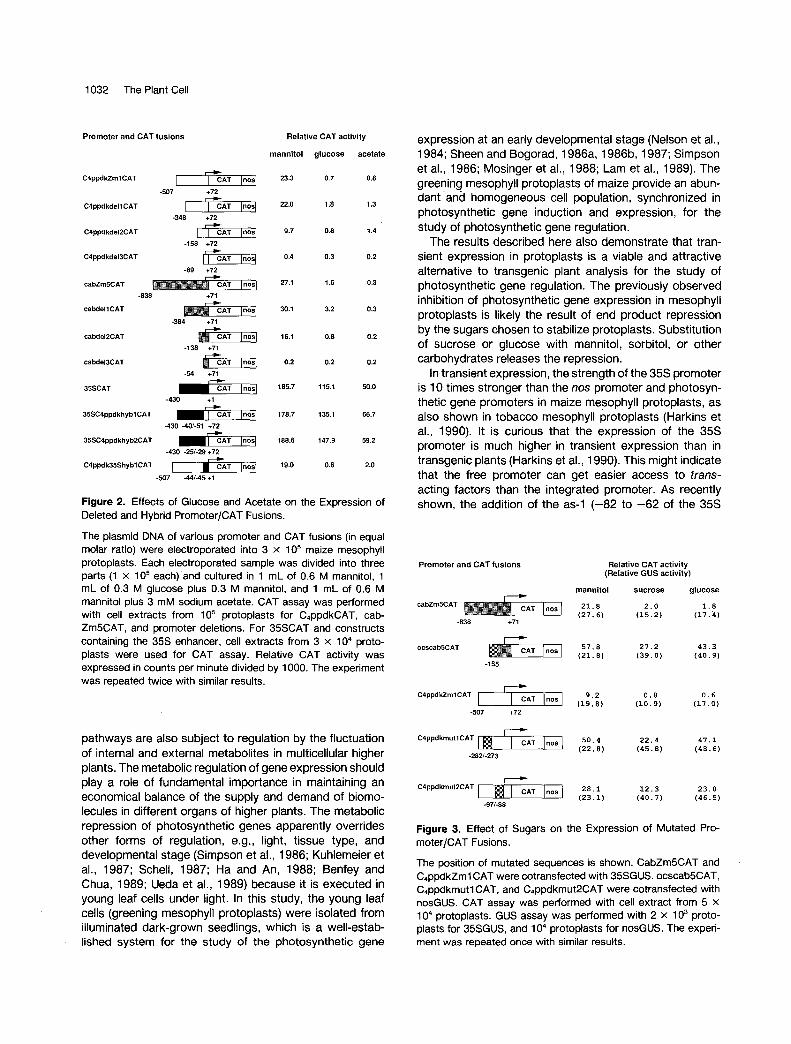
Figure 2. Effects of Glucose and Acetate on the Expression of Deleted and Hybrid Promoter/CAT Fusions.
The plasmid DNA of various promoter and CAT fusions (in equal molar ratio) were electroporated into 3 x 10⁵ maize mesophyll protoplasts. Each electroporated sample was divided into three parts (1 x 10⁵ each)'and cultured in 1 mL of 0.6 M mannitol, 1 mL of 0.3 M glucose plus 0.3 M mannitol, and 1 mL of 0.6 M mannitol plus 3 mM sodium acetate. CAT assay was performed with cell extracts from 105 protoplasts for C4ppdkCAT, cab- ZmSCAT, and promoter deletions. For 35SCAT and constructs containing the 35s enhancer, cell extracts from 3 x 10⁴ proto- plasts were used for CAT assay. Relative CAT activity was expressed in counts per minute divided by 1000. The experiment was repeated twice with similar results.
pathways are also subject to regulation by the fluctuation of interna1 and externa1 metabolites in multicellular higher plants. The metabolic regulation of gene expression should play a role of fundamental importance in maintaining an economical balance of the supply and demand of biomo- lecules in different organs of higher plants. The metabolic repression of photosynthetic genes apparently overrides other forms of regulation, e.g., light, tissue type, and developmental stage (Simpson et al., 1986; Kuhlemeier et al., 1987; Schell, 1987; Ha and An, 1988; Benfey and Chua, 1989; Ueda et al., 1989) because it is executed in young leaf cells under light. In this study, the young leaf cells (greening mesophyll protoplasts) were isolated from illuminated dark-grown seedlings, which is a well-estab- lished system for the study of the photosynthetic gene
expression at an early developmental stage (Nelson et al., 1984; Sheen and Bogorad, 1986a, 1986b, 1987; Simpson et al., 1986; Mosinger et al., 1988; Lam et al., 1989). The greening mesophyll protoplasts of maize provide an abun- dant and homogeneous cell population, synchronized in photosynthetic gene induction and expression, for the study of photosynthetic gene regulation.
The results described here also demonstrate that tran- sient expression in protoplasts is a viable and attractive alternative to transgenic plant analysis for the study of photosynthetic gene regulation. The previously observed inhibition of photosynthetic gene expression in mesophyll protoplasts is likely the result of end product repression by the sugars chosen to stabilize protoplasts. Substitution of sucrose or glucose with mannitol, sorbitol, or other carbohydrates releases the repression.
In transient expression, the strength of the 35s promoter is 10 times stronger than the nos promoter and photosyn- thetic gene promoters in maize mesophyll protoplasts, as also shown in tobacco mesophyll protoplasts (Harkins et al., 1990). It is curious that the expression of the 35s promoter is much higher in transient expression than in transgenic plants (Harkins et al., 1990). This might indicate that the free promoter can get easier access to trans- acting factors than the integrated promoter. As recently shown, the addition of the as-1 (-82 to -62 of the 35s
Promoter and CAT fusions Relative CAT activity (Relative GUS activity)
mannitol sucrose glucose A
cabZm5CAT 2 1 . 8 2 . 0 1 . 8 ( 2 7 . 6 ) ( 1 5 . 2 ) ( 1 7 . 4 )
-838 +71
ocscab5CAT 5 7 . 8 2 7 . 2 4 3 . 3 ( 2 1 . 8 ) ( 3 9 . 0 ) ( 4 0 . 9 )
-155
0 . 8 0.6 (10.9) ( 1 7 . 0 )
C4ppdUmlCAT
-507 +72
2 2 . 4 4 7 . 1 ( 4 5 . 8 ) ( 4 8 . 6 )
C4ppdkmull CAT
-2821-273
1 2 . 3 2 3 . 0 ( 4 0 . 7 ) ( 4 6 . 5 )
C4ppdkmutPCAT
-971.88
Figure 3. Effect of Sugars on the Expression of Mutated Pro- moter/CAT Fusions.
The position of mutated sequences is shown. CabZm5CAT and C4ppdkZml CAT were cotransfected with 35SGUS. ocscab5CAT, Cappdkmutl CAT, and C4ppdkmut2CAT were cotransfected with nosGUS. CAT assay was performed with cell extract from 5 x 10⁴ protoplasts. GUS assay was performed with 2 x 10³ proto- plasts for 35SGUS, and 104 protoplasts for nosGUS. The experi- ment was repeated once with similar results.

Metabolic Repression in Higher Plants 1033
Promoter and CAT fusions Relative CAT activity (Relative GUS activity)
no acetate acetate
cabZm5CAT 2 4 8 ( 1 9 . 9 ) 0 . 2 (6.6)
-838 +71
ocscab5CAT 6 6 . 4 ( 2 4 . 2 ) 7 . 9 (11.2)
-155
C4ppdkZml CAT -1 1 2 . 8 ( 2 3 . 0 ) 0 . 7 (11.7)
-507 +72
m-1 6 6 . 2 ( 2 5 . 4 ) 1 6 . 9 (12.3) C4ppdYmutl CAT
-2821-273
-1 3 9 . 4 ( 2 1 . 5 ) 7 . 4 ( 1 7 . 8 ) C4ppdkmutZCAT
-971-88
Figure 4. Effect of Acetate on the Expression of Mutated Pro- moter/CAT Fusions.
The cotransfection plasmid was cyppdkZml GUS. CAT assay was performed with cell extract from 5 x 1 O4 protoplasts. GUS assay was performed with cell extract from 1 O4 protoplasts. The exper- iment was repeated once with similar results.
promoter) tetramer enhances leaf expression considerably in transgenic tobacco plants (Lam and Chua, 1990).
The most striking advantages of protoplast transient expression are rapidity, convenience, and versatility. Start- ing from the isolation of protoplasts to the collection of quantitative data, the whole process takes less than 2 days, whereas it takes months to obtain equivalem results with transgenic plants. In addition, the electroporation and CAT assay used here yield highly reproducible results when samples from the same batch of protoplasts are tested. It is especially convenient for testing a large number of constructs without relying on interna1 controls and the large number of duplicated samples needed for transgenic plant analysis. The method requires little tissue culture and plant care and can be applied to both dicot and monocot plants.
Glucose Repression in Maize 1s a Nove1 Type of Feedback Regulation on Gene Expression
In E. coli and yeast, glucose is a preferred exogenous carbon source and can inhibit the expression of genes involved in other catabolic pathways. This inhibition is called catabolite repression (Miller and Reznikoff, 1978; Beier and Young, 1982; Struhl, 1985). In higher plants, glucose is synthesized endogenously through photosyn- thesis and used for starch synthesis in chloroplasts, or is converted to sucrose in the cytosol for export. The export
of sucrose from leaf cells is a principal factor linking carbon assimilation at the source (photosynthetic organs) to car- bon utilization at the sink (nonphotosynthetic organs) (Bon- ner and Varner, 1976; Stitt, 1986; Foyer, 1988). The remova1 of sinks causes an increase in the sucrose con- centration of leaves and a severe inhibition of photosyn- thesis (Foyer, 1988). The feeding of the leaves with su- crose or glucose also causes a substantial increase in leaf sugar content and a significant decrease in photosynthetic capacity (Foyer, 1988; Huber, 1989). Based on these observations, it has been proposed that sugars play a crucial role in the biochemical feedback regulation of car- bon assimilation by depriving the chloroplasts of ortho- phosphate, a metabolite essential for generating ATP by photophosphorylation during photosynthesis (Stitt, 1986; Walker and Sivak, 1986; Foyer, 1988; Huber, 1989). Therefore, sugars can act as the modulators of source and sink interaction when the production of photosynthate significantly exceeds the capacity of photosynthate utilization.
In this work, I present evidence that sugars can play another role in the feedback regulation of photosynthesis,
Amino acids Pyrimidines
Light + C O d H20
PHOTOSYNTHESIS Figure 5. Acetyl-COA 1s a Central Metabolite in Plant Cells.
A simplified scheme of global cellular metabolism of plant cells is shown. Acetyl-COA connects the carbon assimilation from pho- tosynthesis in chloroplasts to the metabolism of amino acids, fatty acids, and nucleotides. The glyoxylate cycle in glyoxysome is most active when cells are fed with acetate or are metabolizing lipids. The gluconeogenesis through the glyoxylate cycle is unique to plant cells. One-end arrows indicate that reverse reactions are unlikely to occur. PGA is 3-phosphoglycerate. F-6-P is fructose 6- phosphate.

1034 The Plant Cell
namely switching off the expression of photosynthetic genes. It is also possible that sugar repression is used, in part, as a regulatory mechanism for the developmental and tissue-specific expression of photosynthetic genes in higher plants. For instance, photosynthetic genes are tran- scriptionally more active in young developing leaves than in mature leaves, probably because mature leaves produce and accumulate more sugars than do younger leaves (Sheen and Bogorad, 1986, 1987; Nakamura and Hashi- moto, 1988; J. Sheen, unpublished results). Another ex- ample is that photosynthetic genes are usually not ex- pressed in nonphotosynthetic cells, probably because the sugar content of these cells is often higher (over 200 mM) than that found in photosynthetic cells (1 O mM to 50 mM) (Gerhard et al., 1987; Griffith et al., 1987).
Sugar repression allows a basal level of expression and is reversible when the concentration of sugars decreases. The concentration dependence and leaky features of sugar repression in higher plants resemble that found in end product repression of the tryptophan operon in E. coli (Miller and Reznikoff, 1978; Yanofsky, 1981). Because sugars are the major end product of photosynthesis, it is more appropriate to classify the glucose repression of photosynthetic genes as a type of end product repression in higher plants. Moreover, because sugars inhibit the expression of genes involved in an anabolic pathway- photosynthesis-glucose repression in higher plants is a type of anabolite repression in contrast to catabolite repression in bacteria and yeast.
Acetate Repression 1s Evolutionarily Conserved in the Plant Kingdom
Besides sugar repression, transcriptional repression of photosynthetic genes was found with acetate. The effec- tive concentration of acetate is 1 O0 times lower than that of sugars for transcriptional repression. This difference reflects the intrinsic concentration ranges of sugars and acetate in leaf cells (10 mM to 50 mM for sucrose and 0.25 mM to 1 mM for acetate) (Kuhn et al., 1981; Gerhard et al., 1987). Repression mediated by acetate and repres- sion mediated by sugars are quite different. Usually, ace- tate repression is 1 O times stronger than sugar repression for photosynthetic gene promoters, with the exception of the cytosolicppdkZm7 promoter that is inhibited by sugars but not acetate (Tables 3 and 4). Thus, there must be at least two pathways for metabolic repression at the tran- scriptional level in maize.
The reasons for acetate repression can probably be best explained by the unique ability of plant cells to use acetate for gluconeogenesis and by the central role played by acetyl-COA (the direct cellular derivative of acetate) in the global cellular metabolism of plant cells, as shown in Figure 5 (Beevers, 1969; Fletcher and Beevers, 1970; Bassham,
1971 ; Lehninger, 1975; Bonner and Varner, 1976; Murphy and Stumpf, 1981). It has been shown that acetate can be used as the sole exogenous carbon source by severa1 green algae. In alga1 cells fed with acetate, the glyoxysome, a single membrane-bound organelle, is involved in using acetyl-COA for gluconeogenesis through the glyoxylate cycle (Beevers, 1969; Monroy and Schwartzbach, 1984; Gibbs et al., 1986; Steinbiss and Zetsche, 1986; Rikin and Schwartzbach, 1989). The presence of acetate inhibits the expression of photosynthetic genes under light but acti- vates the expression of glyoxysome enzymes for the metabolism of acetate (Monroy and Schwartzbach, 1984; Gibbs et al., 1986; Steinbiss and Zetsche, 1986; Kindle, 1987; Rikin and Schwartzbach, 1989). These observations suggest that in algae acetate is a more favorable exoge- nous carbon source than CO,, probably because the utili- zation of CO, involves the expression of more complex photosynthetic pathways. The repression of genes in- volved in other metabolic pathways by preferred exoge- nous carbon sources in green algae is a type of metabolic repression similar to that found in E. coli and yeast. How- ever, an anabolic pathway, photosynthesis, is inhibited in green algae instead of the catabolic pathways inhibited in bacteria and yeast.
In higher plants, glyoxysomes are particularly abundant in germinating seedlings that are metabolizing fat. In these cells, acetyl-COA plays an important role for the generation of energy through the TCA cycle and the generation of carbohydrates through the glyoxylate cycle (Figure 4) (Beevers, 1969; Huang and Beevers, 1971 ; Lehninger, 1975; Bonner and Varner, 1976; Kuhn et al., 1981 ; Murphy and Stumpf, 1981). The presence of acetate repression in the mesophyll cells of maize seedlings might suggest the adaptation of an economical strategy by higher plants to ensure the use of stored fat first before switching over to the operation of more complex photosynthetic pathways. Alternatively, plants can also absorb nutrients from organic acid-enriched soil, and the presence of excess acetate can act as a signal to convert plants to the utilization of easily available fuel from the environment. Because glyoxysomes and acetate repression are found in the plant kingdom from green algae to higher plants, the evolutionary con- servation strongly suggests that they play a role of fun- damental importance in cellular metabolism.
Mechanisms Mediating Metabolic Regulation in Higher Plants Differ from Those Found in Bacteria, Yeast, and Vertebrates
Mechanisms of metabolic regulation are quite different in bacteria and yeast. In bacteria, genes encoding enzymes with related metabolic functions are frequently arranged contiguously in the chromosome and are coregulated by short sequences upstream of the gene cluster. The lactose

Metabolic Repression in Higher Plants 1035
operon and tryptophan operon are two well-known ex- amples (Miller and Reznikoff, 1978). In yeast, genes en- coding related enzymes of metabolic pathways are not arranged in gene clusters and are frequentiy scattered among severa1 chromosomes (Hinnebusch and Fink, 1983; Giniger et al., 1985). However, the genes encoding amino acid biosynthesis enzymes from different pathways are regulated through a consensus sequence and its binding protein GCN4 (Hinnebusch and Fink, 1983; Hope and Struhl, 1985). Although it is not yet clear whether the glucose repression in yeast is controlled by a consensus sequence, it has been proposed to be regulated by nega- tive regulatory elements (Beier and Young, 1982, Struhl, 1985). As in yeast, photosynthetic genes in higher plants are located on different chromosomes (Shiaoman et al., 1989; Weber and Helentjaris, 1989). Thus far, the analysis of Seven different photosynthetic gene promoters of maize has not demonstrated any overt consensus sequences among the upstream regulatory elements (J. Sheen, A. Schaffner, and H. Huang, unpublished results). In this work, analysis of deleted, mutated, and hybrid promoters showed that distinct positive upstream regulatory ele- ments but not basal promoter structures or negative ele- ments were responsible for mediating repression.
Recently, it has been proposed that CCAAT/enhancer- binding protein (C/EBP) may play a role in the regulation of genes involved in energy metabolism (gluconeogenesis and lipogenesis) in vertebrates (McKnight et al., 1989). One piece of evidence is that the promoters of at least five genes involved in energy metabolism are trans-activated by C/EBP (McKnight et al., 1989). Because the consensus sequence for the binding of C/EBP is present in only one (CabZm5) out of seven photosynthetic gene promoters, the metabolic repression of photosynthetic genes in higher plants apparently uses mechanisms unlike that of vertebrates.
Although metabolic repression in higher plants might be regulated by protein-protein interactions instead of protein- DNA interactions, the involvement of degenerate binding sites cannot be ruled out. The isolation and analysis of the genes encoding photosynthetic gene activators and the use of a protoplast transient expression method will allow rapid elucidation of these interesting mechanisms without recourse to transgenic plants.
METHODS
Plant Growth and Protoplast lsolation
Protoplasts were isolated from 20-hr illuminated leaves of 1 O-day- old maize seedlings that had been kept in the dark at 2 5 T . The middle part of the second leaves (about 6 cm in length) was cut to 0.5-mm strips with new razor blades and digested in an enzyme
solution containing 1% (w/v) cellulase RS, 0.1% (w/v) macero- zyme R1 O (both from Yakult Honsha, Nishinomiya, Japan), 0.6 M mannitol, 1 O mM Mes (pH 5.7), 1 mM CaCI,, 1 mM MgCIZ, 1 O mM (3-mercaptoethanol, and 0.1% BSA (w/v) for no more than 3 hr at 2 3 T . Protoplasts were released by shaking on a rotary shaker at 80 rpm for 10 min and were filtered through a 70-pm nylon filter. Protoplasts were collected by centrifugation at 1 O0 g for 2 min, washed in cold 0.6 M mannitol solution once, centrifuged, and resuspended at 2 x 1 06/mL in cold 0.6 M mannitol. The yield was about 5 X 1 06/g. The viability was about 99% estimated by staining with fluorescein diacetate (Sigma) and examined by fluo- rescence microscopy. Mesophyll protoplasts with chloroplasts contributed about 95% of the total population.
CAT and GUS Chimeric Constructs with Various Promoters
C,ppdkZml CAT was constructed by fusing the 5'-flanking region (-507 to +72) of the C,ppdkZm7 gene to the CAT coding sequence and the nos 3' sequence as described (Fromm et al., 1985, 1986; Callis et al., 1988) except that the BamHl site of puC8 was converted to a Sacl site for promoter fusion. The nos promoter was originated from Dr. V. Walbot's laboratory but was deleted down to the Sac II site (-155) to obtain better plasmid DNA yield and expression. 35SGUS and nosGUS were generated by transferring the 35s and nos promoter fragments from 35SCAT and nosCAT (excised with Hindlll and BamHl digestion) to the pUCl9GUS (Jefferson, 1987). CyppdkZml GUS was generated by cloning the cyppdkZm7 promoter (-1100 to +85) to the pUCl9NcoGUS (J. Dewdney, unpublished data) after the ligation of Nco linker to the 3' end.
Electroporation and Protoplast Culture
Electroporation conditions were 400 V/cm, 200 pF, 1 O msec (set pulse time), and one pulse with a Promega X-cell 450 apparatus. Each sample contained 3 x 10⁵ protoplasts and about 50 pg of DNA in 0.3 mL of 0.6 M mannitol and 20 mM KCI. After electro- poration, 105 protoplasts were cultured in 1 mL of 0.6 M mannitol, 4 mM Mes (pH 5.7), and brome mosaic virus (BMV) salts (Okuno et al., 1977; Loesch-Fries and Hall, 1980) at 25°C under 20 pE/ m2 of light for 20 hr (200 pE/m2 light gave similar results). The BMV salts were omitted when the effect of various salts was tested.
CAT and GUS Assays
CAT assays were performed with cell extracts from 2 x 10³ to 105 protoplasts in 100 pL for 90 min as described (Seed and Sheen, 1988). The phase-extraction method is quantitative, fast, inexpensive, and more sensitive compared with the conventional method by TLC plates. Because of its broad linear range (from 0.05% to 50% conversion) and low background (about 100 cpm with 0.2 pCi of 3H-chloramphenicol per sample), the new method is excellent for the study of weak promoters. The relative CAT activity is expressed in counts per minute divided by 1000.
The fluorogenic assay for GUS activity was performed with cell extracts from 2 x 1 O3 to 1 o4 protoplasts in 200 pL for 90 min as

1036 The Plant Cell
described (Jefferson, 1987). The relative GUS activity is the direct fluorescence reading divided by 1 O.
Because protoplast activity and substrates for CAT and GUS assays were not identical in each experiment, the data from different experiments were not combined.
Deletion, Promoter Interchange, and Mutagenesis
The deleted promoters of C4ppdkZm7 were generated by Ba131 digestion from the 5’ end as described (Maniatis et al., 1982). The promoter sequences of C4ppdkZm7, from -507 to +72, from -348 to +72, from -158 to +72, and from -69 to +72, were inserted into the 35SCAT plasmid (Fromm et al., 1985, 1986; Callis et al., 1988) digested with Hindlll and Sacl to gen- erate C,ppdkZml CAT, C,ppdkdell CAT, C,ppdkdePCAT, and C4ppdkde13CAT, respectively. The deleted promoters of cab- Zm5CAT were generated by Spel, BssHII, and Dral digestions (Sullivan et al., 1989). The promoter sequences of cabZm5, from -838 to +71, from -384 to +71, from -138 to +71, and from -54 to +71, were inserted into the blueCAT plasmid (J. Sheen, unpublished data) digested with EcoRl and Styl, Spel and Styl, Smal and Styl, and Smal and Styl to generate cabZm5CAT, cabdell CAT, cabdel2CAT, and cabdel3CAT, respectively. The hybrid promoters were generated by Ba131 digestions from both the 5’ and 3’ ends of the 35s and C4ppdkZm7 promoters and fusions with Hindlll linkers. The 35SC4ppdkhybl CAT and 35SC4ppdkhyb2CAT were created by inserting the 35s promoter sequences, from -430 to -40 and from -430 to -25, into the C,ppdkZml CAT deletions at -51 and -29 positions with Hindlll linkers, respectively. The C4ppdk35Shybl CAT was created by inserting the C,ppdkZm7 promoter sequences from -507 to -44 into the 35SCAT deletion at -45 position with Hindlll linkers. The ocscab5 was generated by ligating the 16-bp ocs enhancer (ACGTAAGCGCTTACGT) (Ellis et al., 1987) to a truncated cabZm5 promoter at -1 00. The mutated C4ppdkZm7 promoters were first generated by site-specific mutagenesis with primers containing 1 O-bp mismatches flanked by 15-bp homologous se- quences on both ends as described (Kunkel, 1985). Then the 16- bp ocs enhancer was inserted into the mutated sites digested with EcoRV and Xbal to create C4ppdkmutl and C4ppdkmut2.
ACKNOWLEDGMENTS
I thank Maura Cannon, Hai Huang, Anton Schaffner, and Virginia Walbot for providing plasmids containing Adhl CAT, cabZml CAT, cabZm5CAT, C4pepcZml CAT, rbcSZml CAT, rbcSZm3CAT, 35FCAT, and nosCAT; Ming-Che Shih and Julia Dewdney for pUC19GUS and pUC19NcoGUS; and Fred Ausubel and Howard Goodman for their continuous support. This work was supported by a grant from Hoechst A.G.
Received May 1 1, 1990; accepted August 3, 1990.
REFERENCES
Bassham, J.A. (1 971). The control of photosynthetic carbon metabolism. Science 172, 526-534.
Beevers, H. (1 969). Glyoxysomes of caster bean endosperm and their relation to gluconeogenesis. Ann. N.Y. Acad. Sci. 168,
Beier, D.R., and Young, E.T. (1982). Characterization of a regu- latory region upstream of the ADR2 locus of S. cerevisiae. Nature 300, 724-728.
Benfey, P.N., and Chua, N.-H. (1989). Regulated genes in trans- genic plants. Science 244, 174-1 81 .
Bonner, J., and Varner, J.E. (1 976). Plant Biochemistry. (New York: Academic Press, Inc.).
Callis, J., Fromm, M., and Walbot, V. (1988). Heat inducible expression of a chimeric maize hsp70CAT gene in maize pro- toplasts. Plant Physiol. 88, 965-968.
Ellis, J.G., Llewellyn, D.J., Walker, J.C., Dennis, E.S., and Peacock, W.J. (1987). The ocs element: A 16 base pair palin- drome essential for activity of the octopine synthase enhancer.
Fleck, J., Durr, A., Fritsch, C., Vernet, T., and Hirth, L. (1982). Osmotic-shock stress proteins in protoplasts of Nicotiana syl- vestris. Plant Sci. Lett. 26, 159-1 65.
Fletcher, J.S., and Beevers, H. (1 970). Acetate metabolism in cell suspension cultures. Plant Physiol. 45, 765-772.
Foyer, C.H. (1 988). Feedback inhibition of photosynthesis through source-sink regulation in leaves. Plant Physiol. Biochem. 26,
Fromm, M., Taylor, L.P., and Walbot, V. (1985). Expression of genes transferred into monocot and dicot plant cells by electro- poration. Proc. Natl. Acad. Sci. USA 82, 5824-5828.
Fromm, M., Taylor, L.P., and Walbot, V. (1986). Stable transfor- mation of maize after gene transfer by electroporation. Nature 319,791-793.
Gerhard, R., Stitt, M., and Heldt, H.W. (1 987). Subcellular metab- olite levels in spinach leaves. Plant Physiol. 83, 399-407.
Gibbs, M., Gfeller, R.P., and Chen, C. (1986). Fermentative metabolism of Chlamydomonas reinhardtii. Plant Physiol. 82,
Giniger, E., Varnum, S.M., and Ptashne, M. (1985). Specific DNA binding of GAL4, a positive regulatory protein of yeast. Cell40,
Griffith, S.T., Jones, R.T., and Brenner, M.L. (1987). In vitro sugar transport in Zea mays L. kernels. Plant Physiol. 84,
Ha, S.-B., and An, G. (1 988). ldentification of upstream regulatory elements involved in the developmental expression of the Ara- bidopsis tbaliana cab7 gene. Proc. Natl. Acad. Sci. USA 85,
Harkins, K.R., Jefferson, R.A., Kavanagh, T.Y., Bevan, M.W., and Galbraith, D.W. (1 990). Expression of photosynthesis- related gene fusions is restricted by cell type in transgenic plants and in transfected protoplasts. Proc. Natl. Acad. Sci.
Hinnebusch, A.G., and Fink, G.R. (1983). Repeated DNA se-
313-324.
EMBO J. 6,3203-3208.
483-492.
160-1 66.
767-774.
467-471.
801 7-8021.
USA 87, 816-820.

Metabolic Repression in Higher Plants 1037
quences upstream from HlSl also occur at severa1 other co- regulated genes in Saccharomyces cerevisiae. J. Biol. Chem.
Hope, I.A., and Struhl, K. (1985). GCN4 protein, synthesized in vitro, binds HIS3 regulatory sequences: lmplications for gen- eral control of amino acid biosynthesis genes in yeast. Cell 43,
Huang, A.H.C., and Beevers, H. (1971). lsolation of microbodies from plant tissues. Plant Physiol. 48, 637-641.
Huber, S. (1989). Biochemical mechanism for regulation of su- crose accumulation in leaves during photosynthesis. Plant Physiol. 91, 656-662.
Jefferson, R.A. (1987). Assaying chimeric genes in plants: The GUS gene fusion system. Plant MOI. Biol. Rep. 5, 387-405.
Kindle, K.L. (1987). Expression of a gene for a light-harvesting chlorophyll a/b-binding protein in Chlamydomonas reinhardtii: Effect of light and acetate. Plant MOI. Biol. 9, 547-563.
Kuhlemeier, C., Green, P.J., and Chua, N.-H. (1987). Regulation of gene expression in higher plants. Annu. Rev. Plant Physiol.
Kuhn, D.N., Knauf, M., and Stumpf, P.K. (1981). Subcellular localization of acetyl-COA synthetase in leaf protoplasts of Spinacia oleracea. Arch. Biochem. Biophys. 209, 441 -450.
Kunkel, T.A. (1 985). Rapid and efficient site-specific mutagenesis without phenotype selection. Proc. Natl. Acad. Sci. USA 82,
Lam, E. and Chua, N.-H. (1990). GT-1 binding site confers light responsive expression in transgenic tobacco. Science 248,
Lam, E., Green, P.J., Wong, M., and Chua, N.-H. (1989). Phy- tochrome activation of two nuclear genes requires cytoplasmic protein synthesis. EMBO J. 8, 2777-2783.
Lehninger, A.L. (1 975). Biochemistry. (New York: Worth Publish- ers, Inc.).
Lipphardt, S., Brettschneider, R., Kreuzaler, F., Schell, J., and Dangl, J.L. (1 988). UV-inducible transient expression in pars- ley protoplasts identifies regulatory cis-elements of a chimeric Antirrhinum majus chalcone synthase gene. EMBO J. 7,
Loesch-Fries, L.S. and Hall, T.C. (1 980). Synthesis, accumula- tion, and encapsidation of individual brome mosaic virus RNA components in barley protoplasts. J. Gen. Virol. 47, 323-332.
Maniatis, T., Fritsch, E.F., and Sambrook, J. (1 982). Molecular Cloning: A Laboratory Manual. (Cold Spring Harbor, NY: Cold Spring Harbor Laboratory).
Marcotte, W.R., Bayley, C.C., and Quatrano, R.S. (1988). Reg- ulation of a wheat promoter by abscisic acid in rice protoplasts. Nature 335, 454-457.
McKnight, S.L., Lane, M.D., and Gluecksohn-Waelsch, S. (1 989). 1s CCAAT/enhancer-binding protein a central regulator of energy metabolism? Genes Dev. 3, 2021-2024.
Miller, J., and Rernikoff, W. (1978). The Operon. (Cold Spring Harbor, NY: Cold Spring Harbor Laboratory).
Monroy, A.F., and Schwartzbach, S.D. (1 984). Catabolite repres- sion of chloroplast development in Euglena. Proc. Natl. Acad. Sci. USA 81,2786-2790.
Mosinger, E., Batschauer, A., Apel, K., Schaefer, E., and
258,5238-5247.
177-1 88.
38,221-257.
488-492.
471 -474.
4027-4033.
Briggs, W. (1 988). Phytochrome regulation of greening in bar- ley. Plant Physiol. 86, 706-710.
Murphy, D.J., and Stumpf, P.K. (1981). The origin of chloroplastic acetyl coenzyme A. Arch. Biochem. Biophys. 212,730-739.
Nagy, J.T., and Maliga, P. (1976). Callus induction and plant regeneration from mesophyll protoplasts cultured in vitro. Z. Pflanzenphysiol. 78, 453-455.
Nakamura, Y., and Hashimoto, H. (1 988). Characteristics of photosynthate partitioning during chloroplast development in Avena leaves. Plant Physiol. 87,458-462.
Nelson, T., Harpster, M.H., Mayfield, S.P., and Taylor, W.C. (1 984). Light-regulated expression during maize leaf develop- ment. J. Cell Biol. 98, 558-564.
Okuno, T., Furusawa, I., and HirÚki, C. (1977). lnfection of bar- ley protoplasts with brome mosaic virus. Phytopathology 67,
Rikin, A., and Schwartzbach, S.D. (1989). Regulation by light and ethanol of the synthesis of the light-harvesting chlorophyll a/b-binding protein of photosystem II in Euglena. Planta 178,
Scandalios, J.G. (1 974). lsozymes in development and differen- tiation. Annu. Rev. Plant Physiol. 25, 225-258.
Schell, J. (1987). Transgenic plants as tools to study the molec- ular organization of plant genes. Science 237, 1 176-1 183.
Seed, B., and Sheen, J.-Y. (1988). A simple phase-extraction assay for chloramphenicol acetyltransferase activity. Gene 67,
Sheen, J.-Y., and Bogorad, L. (1 986a). Differential expression of six light-harvesting chlorophyll a/b-binding protein genes in maize leaf cell types. Proc. Natl. Acad. Sci. USA 83,
Sheen, J.-Y., and Bogorad, L. (1986b). Expression of ribu- lose bisphosphate carboxylase large subunit and three small subunit genes in two cell types of maize leaves. EMBO J. 13,
Sheen, J.-Y., and Bogorad, L. (1 987). Differential expression of C., pathway gene in mesophyll and bundle sheath cells of greening maize leaves. J. Biol. Chem. 262, 11726-1 1730.
Shiaoman, C., Raines, C.A., Longstaff, M., Sharp, P.J., Gale, M.D., and Dyer, T.A. (1 989). Chromosomal location and copy number in wheat and some of its relatives of genes for enzymes involved in photosynthesis. MOI. Gen. Genet. 218, 423-430.
Simpson, J., Van Montagu, M., and Herrera-Estrella, L. (1 986). Photosynthesis-associated gene families: Differences in re- sponse to tissue-specific and environmental factors. Science
Steinbiss, H.J., and Zetsche, K. (1986). Light and metabolite regulation of the synthesis of ribulose-l,5-bisphosphate carbox- ylase/oxygenase and the corresponding mRNAs in the unicel- lular alga Chlorogonium. Planta 167, 575-581.
Stitt, M. (1 986). Regulation of photosynthetic sucrose synthesis: Integration, adaptation, and limits. In Phloem Transport, J. Cronshaw, W.J. Lucas, and R.T. Giaquinta, eds (New York: Alan R. Liss, Inc.), pp. 331 -347.
Struhl, K. (1985). Negative control at a distance mediates catab- olite repression in yeast. Nature 317, 822-824.
Sullivan, T.D., Christensen, A.H., and Quail, P.H. (1 989). Isola-
'
610-615.
76-83.
271-277.
781 1-781 5.
3417-3422.
233,34-38.
1038 The Plant Cell
tion and characterization of a maize chlorophyll a/b binding protein gene that produces high levels of mRNA in the dark. MOI. Gen. Genet. 215, 431-440.
Ueda, T., Pichersky, E., Malik, V.S., and Cashmore, A.R. (1989). Leve1 of expression of the tomato rbcS-3A gene is modulated by a far upstream promoter element in a developmentally reg- ulated manner. Plant Cell 1, 217-227.
Vernet, T., Fleck, J., Durr, A., Fritsch, C., Pinck, M., and Hitth, L. (1982). Expression of the gene coding for the small subunit of ribulose bisphosphate carboxylase during differentiation of tobacco plant protoplasts. Eur. J. Biochem. 126, 489-494.
Walker, D.A., and Sivak, M.N. (1986). Photosynthesis and phos-
phate: A cellular affair? Trends Biochem. Sci. 11, 176-179. Walker, J.C., Howard, E.A., Dennis, E.S., and Peacock, W.J.
(1 987). DNA sequences required for anaerobic expression of the maize alcohol dehydrogenase 1 gene. Proc. Natl. Acad. Sci.
Weber, D., and Helentjaris, T. (1989). Mapping RFLP loci in maize using B-A translocations. Genetics 121, 583-590.
Woodrow, I.E., and Berry, J.A. (1 988). Enzymatic regulation of photosynthetic CO, fixation in C3 plants. Annu. Rev. Plant Physiol. 39, 533-594.
Yanofsky, C. (1981). Attenuation in the control of expression of bacterial operons. Nature 289, 751 -758.
USA 84,6624-6628.

DOI 10.1105/tpc.2.10.1027 1990;2;1027-1038Plant CellJ Sheen
Metabolic repression of transcription in higher plants.
This information is current as of June 19, 2018
Permissions X
https://www.copyright.com/ccc/openurl.do?sid=pd_hw1532298X&issn=1532298X&WT.mc_id=pd_hw1532298
eTOCs http://www.plantcell.org/cgi/alerts/ctmain
Sign up for eTOCs at:
CiteTrack Alerts http://www.plantcell.org/cgi/alerts/ctmain
Sign up for CiteTrack Alerts at:
Subscription Information http://www.aspb.org/publications/subscriptions.cfm
is available at:Plant Physiology and The Plant CellSubscription Information for
ADVANCING THE SCIENCE OF PLANT BIOLOGY © American Society of Plant Biologists