Metabolic consequences of interleukin-6 challenge … · Metabolic consequences of interleukin-6...
12
RESEARCH Open Access Metabolic consequences of interleukin-6 challenge in developing neurons and astroglia Jacquelyn A Brown 1,2† , Stacy D Sherrod 2,3† , Cody R Goodwin 2,4 , Bryson Brewer 5 , Lijie Yang 5 , Krassimira A Garbett 1 , Deyu Li 2,5 , John A McLean 2,4 , John P Wikswo 2,3,6,7* and Károly Mirnics 1,2,8,9* Abstract Background: Maternal immune activation and subsequent interleukin-6 (IL-6) induction disrupt normal brain development and predispose the offspring to developing autism and schizophrenia. While several proteins have been identified as having some link to these developmental disorders, their prevalence is still small and their causative role, if any, is not well understood. However, understanding the metabolic consequences of environmental predisposing factors could shed light on disorders such as autism and schizophrenia. Methods: To gain a better understanding of the metabolic consequences of IL-6 exposure on developing central nervous system (CNS) cells, we separately exposed developing neuron and astroglia cultures to IL-6 for 2 hours while collecting effluent from our gravity-fed microfluidic chambers. By coupling microfluidic technologies to ultra-performance liquid chromatography-ion mobility-mass spectrometry (UPLC-IM-MS), we were able to characterize the metabolic response of these CNS cells to a narrow window of IL-6 exposure. Results: Our results revealed that 1) the use of this technology, due to its superb media volume:cell volume ratio, is ideally suited for analysis of cell-type-specific exometabolome signatures; 2) developing neurons have low secretory activity at baseline, while astroglia show strong metabolic activity; 3) both neurons and astroglia respond to IL-6 exposure in a cell type-specific fashion; 4) the astroglial response to IL-6 stimulation is predominantly characterized by increased levels of metabolites, while neurons mostly depress their metabolic activity; and 5) disturbances in glycerophospholipid metabolism and tryptophan/kynurenine metabolite secretion are two putative mechanisms by which IL-6 affects the developing nervous system. Conclusions: Our findings are potentially critical for understanding the mechanism by which IL-6 disrupts brain function, and they provide information about the molecular cascade that links maternal immune activation to developmental brain disorders. Keywords: glycerophospholipid, immune activation, interleukin, kynurenine, metabolomics, microfluidics, ultra-performance liquid chromatography - ion mobility - mass spectrometry Background Maternal immune activation (MIA) strongly contributes to the pathophysiology of multiple brain disorders in the offspring, including schizophrenia [1], autism [2,3], major depression [4] and multiple sclerosis [5]. Importantly, mounting evidence suggests that altered immune status is not merely a reaction to a primary disease process, but an etiological contributor to the disease itself [6,7]. It has been well documented that disturbed cytokine levels can cause long-term behavioral changes. For example, in animal models, maternal infection with influenza virus during pregnancy leads to long-lasting microanatomical, neurochemical, and behavioral changes in the brains of the offspring [8,9]. However, such changes are not medi- ated directly by the viral infection [10]. Rather, MIA ap- pears to be the key [11], as offspring of mothers exposed to polyinosinic:polycytidylic acid (polyI:C, a synthetic * Correspondence: [email protected]; [email protected] † Equal contributors 2 Vanderbilt Institute for Integrative Biosystems Research and Education, 6809 Stevenson Center, Vanderbilt University, Nashville, TN 37235, USA 1 Department of Psychiatry, 465 21 st Avenue South, Vanderbilt University, Nashville, TN 37232, USA Full list of author information is available at the end of the article JOURNAL OF NEUROINFLAMMATION © 2014 Brown et al.; licensee BioMed Central Ltd. This is an Open Access article distributed under the terms of the Creative Commons Attribution License (http://creativecommons.org/licenses/by/4.0), which permits unrestricted use, distribution, and reproduction in any medium, provided the original work is properly credited. The Creative Commons Public Domain Dedication waiver (http://creativecommons.org/publicdomain/zero/1.0/) applies to the data made available in this article, unless otherwise stated. Brown et al. Journal of Neuroinflammation 2014, 11:183 http://www.jneuroinflammation.com/content/11/1/183
Transcript of Metabolic consequences of interleukin-6 challenge … · Metabolic consequences of interleukin-6...
JOURNAL OF NEUROINFLAMMATION
Brown et al. Journal of Neuroinflammation 2014, 11:183http://www.jneuroinflammation.com/content/11/1/183
RESEARCH Open Access
Metabolic consequences of interleukin-6 challengein developing neurons and astrogliaJacquelyn A Brown1,2†, Stacy D Sherrod2,3†, Cody R Goodwin2,4, Bryson Brewer5, Lijie Yang5, Krassimira A Garbett1,Deyu Li2,5, John A McLean2,4, John P Wikswo2,3,6,7* and Károly Mirnics1,2,8,9*
Abstract
Background: Maternal immune activation and subsequent interleukin-6 (IL-6) induction disrupt normal braindevelopment and predispose the offspring to developing autism and schizophrenia. While several proteins havebeen identified as having some link to these developmental disorders, their prevalence is still small and theircausative role, if any, is not well understood. However, understanding the metabolic consequences of environmentalpredisposing factors could shed light on disorders such as autism and schizophrenia.
Methods: To gain a better understanding of the metabolic consequences of IL-6 exposure on developing centralnervous system (CNS) cells, we separately exposed developing neuron and astroglia cultures to IL-6 for 2 hourswhile collecting effluent from our gravity-fed microfluidic chambers. By coupling microfluidic technologies toultra-performance liquid chromatography-ion mobility-mass spectrometry (UPLC-IM-MS), we were able tocharacterize the metabolic response of these CNS cells to a narrow window of IL-6 exposure.
Results: Our results revealed that 1) the use of this technology, due to its superb media volume:cell volume ratio,is ideally suited for analysis of cell-type-specific exometabolome signatures; 2) developing neurons have lowsecretory activity at baseline, while astroglia show strong metabolic activity; 3) both neurons and astroglia respondto IL-6 exposure in a cell type-specific fashion; 4) the astroglial response to IL-6 stimulation is predominantlycharacterized by increased levels of metabolites, while neurons mostly depress their metabolic activity; and 5)disturbances in glycerophospholipid metabolism and tryptophan/kynurenine metabolite secretion are twoputative mechanisms by which IL-6 affects the developing nervous system.
Conclusions: Our findings are potentially critical for understanding the mechanism by which IL-6 disrupts brainfunction, and they provide information about the molecular cascade that links maternal immune activation todevelopmental brain disorders.
Keywords: glycerophospholipid, immune activation, interleukin, kynurenine, metabolomics, microfluidics,ultra-performance liquid chromatography - ion mobility - mass spectrometry
BackgroundMaternal immune activation (MIA) strongly contributesto the pathophysiology of multiple brain disorders in theoffspring, including schizophrenia [1], autism [2,3], majordepression [4] and multiple sclerosis [5]. Importantly,
* Correspondence: [email protected];[email protected]†Equal contributors2Vanderbilt Institute for Integrative Biosystems Research and Education, 6809Stevenson Center, Vanderbilt University, Nashville, TN 37235, USA1Department of Psychiatry, 465 21st Avenue South, Vanderbilt University,Nashville, TN 37232, USAFull list of author information is available at the end of the article
© 2014 Brown et al.; licensee BioMed CentralCommons Attribution License (http://creativecreproduction in any medium, provided the orDedication waiver (http://creativecommons.orunless otherwise stated.
mounting evidence suggests that altered immune status isnot merely a reaction to a primary disease process, but anetiological contributor to the disease itself [6,7]. It hasbeen well documented that disturbed cytokine levels cancause long-term behavioral changes. For example, inanimal models, maternal infection with influenza virusduring pregnancy leads to long-lasting microanatomical,neurochemical, and behavioral changes in the brains ofthe offspring [8,9]. However, such changes are not medi-ated directly by the viral infection [10]. Rather, MIA ap-pears to be the key [11], as offspring of mothers exposedto polyinosinic:polycytidylic acid (polyI:C, a synthetic
Ltd. This is an Open Access article distributed under the terms of the Creativeommons.org/licenses/by/4.0), which permits unrestricted use, distribution, andiginal work is properly credited. The Creative Commons Public Domaing/publicdomain/zero/1.0/) applies to the data made available in this article,
Brown et al. Journal of Neuroinflammation 2014, 11:183 Page 2 of 12http://www.jneuroinflammation.com/content/11/1/183
cytokine-inducing immunostimulant) show deficits similarto those of offspring whose mothers were exposed to virusinfection [12].MIA triggers a complex immune response that ultim-
ately alters the developmental trajectory of the fetal brain[9]. Cytokines play a critical role in MIA, and in particular,interleukin-6 (IL-6) induction appears to be responsiblefor many of the long-lasting behavioral changes seen inMIA-born offspring [13,14]. IL-6, a pro-inflammatorycytokine with a profound effect on brain function [15,16],is elevated as a result of various MIA paradigms, and ex-posure to IL-6 gives rise to a similar behavioral phenotypethat is observed in offspring of mothers exposed to flu,lipopolysaccharide (LPS), or polyI:C [12-14]. Furthermore,blocking IL-6 effects with anti-IL-6 antibody duringinfluenza-virus infection, polyI:C exposure, or IL-6 chal-lenge prevents the deleterious effects of MIA [13], thussuggesting that the IL-6 inflammatory cascade is a critical(and at least partially causal) mediator of the deleteriouseffects observed in the offspring.Within the central nervous system, cells communicate
through multiple mechanisms, including synaptic contacts,active secretion of proteins, and release of metabolites. Thenon-synaptic communication between the various braincell types is extremely important during development, andthe various chemical gradients are critical for brain pat-terning, neuronal differentiation and migration, laminardevelopment and establishment of the synaptic framework[17]. Thus, the ability to study the molecular secretions inthe developing brain in a high-throughput, unbiased wayprovides insight into typical fetal brain development andpathological processes that result in developmental disor-ders. Custom-made, microfabricated bioreactors (such asmicrofluidic chambers) offer the opportunity to maintaintissue explants and small numbers of primary cells in aclose-to-physiological environment, wherein the extracellu-lar volume and fluid interconnectivity between cellularcompartments are sufficiently optimized for studyingparacrine and autocrine signaling phenomena withoutdilution [18,19]. This, coupled with ultra-performanceliquid chromatography - ion mobility - mass spectrom-etry (UPLC-IM-MS), provides an opportunity to studythe exometabolomic features of numerous cell typesunder tightly controlled conditions [20] and with nar-row temporal resolution.Considering these strengths, we have applied micro-
fluidic-based culturing of embryonic neurons and glialcells to study their exometabolomic activity under restingconditions and upon stimulation with interleukin-6. In acomprehensive comparison of baseline and IL-6-inducedchanges across these two cell types, we putatively identi-fied metabolites and molecular pathways that might play acritical role in the pathophysiology of neurodevelopmentaldisorders.
MethodsExperimental animalsC57 black male and female mice were kept in mating for3 days. E0 was defined as time of vaginal plug. At E15pregnant females were euthanized with isofuran over-dose and embryos removed. The ventral midbrain wasisolated as previously described [21]. All procedureswere in accordance with IACUC standards and wereapproved by Vanderbilt’s Institutional Animal Care andUse Committee for use in this study.
Neuronal and astroglial cell culturesNeuronal cultures were prepared as previously de-scribed using Hibernate-E dissection media [22]. Theventral midbrain of each E15 embryo was dissociated inHank’s balanced salt solution (HBSS) containing 1% pa-pain and 5 U mL−1 DNase (Worthington Biochemicals,Lakewood, NJ, USA) and transferred to a solution con-taining 1% ovomucoid protease inhibitor (WorthingtonBiochemicals, Lakewood, NJ, USA). After dissociation,neurons and astroglia were separated by magnetic cellsorting using established protocols [23]. Dissociatedcells were immuno-enriched using a PNCAM antibody(Miltenyi Biotec, Bergisch Gladbach, Germany), thuspositively selecting for neurons and allowing astroglia tobe collected in the flow-through. This purificationmethod achieved approximately 94% purity in cell culture.Following centrifugation, purified neurons were resus-pended in neural basal (NB) culture media (supplementedwith B-27 and 2 mM L-glutamine) and loaded into poly-D-lysine (10 μg ml−1) and laminin (9.6 μg ml−1)-coatedmicrofluidic chambers. Primary astrocyte cultures werereconstituted and maintained in minimum essentialmedium (MEM) (supplemented with 10% albumin andN-2) for 3 days. On day 4, cell culture media was ex-changed for NB culture media (supplemented with B-27and 2 mM L-glutamine) for the following 3 days [24-26].Microfluidic chambers were loaded with approximately200,000 cells/well and cell cultures were maintained at aconstant gravity-fed flow for 6 days prior to exposure.
Exposure to IL-6On the 6th day, the above-described culturing mediawas replaced with media containing 100 ng ml−1 IL-6(Shenandoah Biotech, Warwick, PA, USA) for 2 hours.Following media replacement, effluent was collected for2 hours, collecting a total flow-through volume of60 μl/sample. Three biological replicates for each condi-tion were collected. (Experimental conditions: Neuronalcultures, Neuronal cultures + IL-6, Astroglial cultures,Astroglial cultures + IL-6; Controls: Empty microfluidicchamber containing no cells, Empty microfluidic cham-ber no cells + IL-6). Each UPLC-IM-MS measurementwas performed in triplicate (technical replicates).
Brown et al. Journal of Neuroinflammation 2014, 11:183 Page 3 of 12http://www.jneuroinflammation.com/content/11/1/183
Microfluidic chambersMicrofluidic devices were fabricated using standard softlithography methods [27,28] as previously described[29-31]. First, a master mold was formed using a negativeSU-8 photoresist. Spin-coating SU-8 2100 (Microchem,Newton, MA, USA) on a silicon wafer at 1500 RPM re-sulted in a uniform layer of photoresist approximately200-μm thick. Standard photolithographic methods wereused to pattern the desired microchannel features intothe SU-8. Briefly, the SU-8 film was exposed to UVlight through a 20,000 DPI printed transparency mask(CAD-Art, Bandon, OR, USA), baked for 2 hours at95°C, and processed with SU-8 developer to yield a 3Drelief of the 2D pattern on the mask. After fabricationof the mold, liquid polydimethylsiloxane (PDMS) pre-polymer (Dow Corning, Midland, MI, USA) was mixedwith its curing agent (10:1 ratio) and poured over themold. The PDMS was then degassed for approximately1 hour and cured in a 70°C oven for at least 2 hours.Following curing, the PDMS layer was removed fromthe SU-8 mold, and 5-mm diameter holes were punchedin the inlet and outlet of each microfluidic channel. Airplasma bonding was then used to attach the PDMS layerto a glass cover slip (VWR Vista Vision, Suwanee, GA,USA). After bonding, Pyrex cloning cylinders (Fisher Sci-entific, Pittsburgh, PA, USA) were adhered to the inlet/outlet regions of each channel to form small reservoirsto load and remove cells and culture media. Prior to
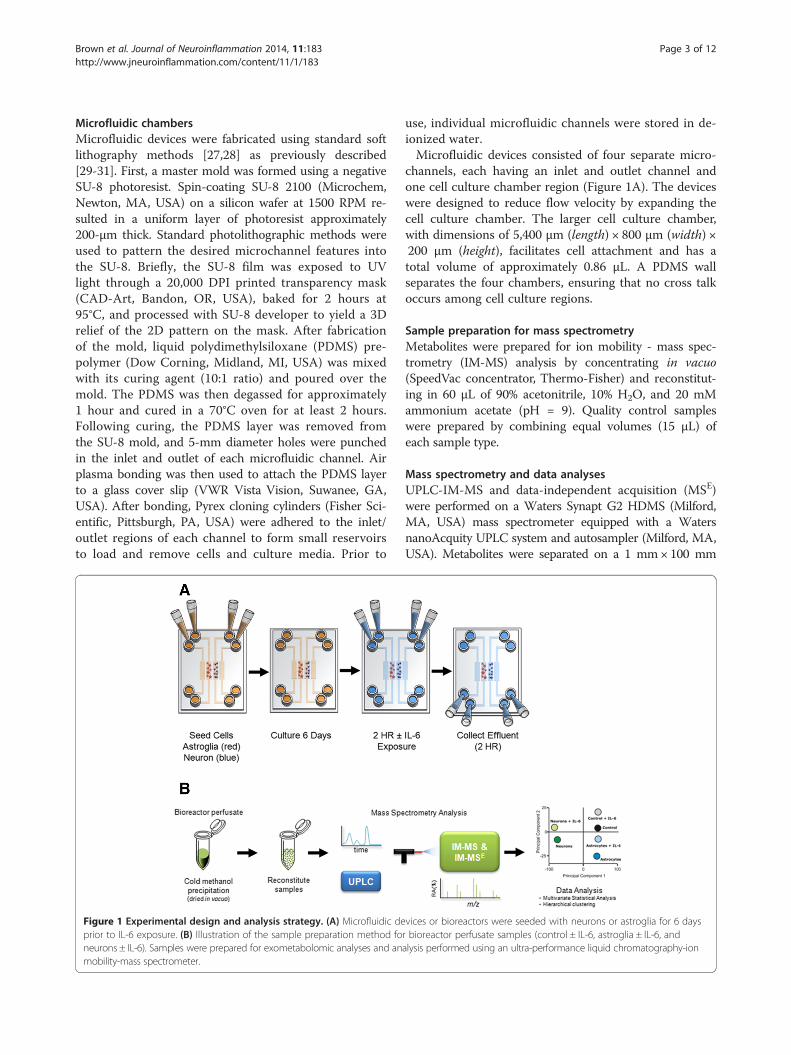
Figure 1 Experimental design and analysis strategy. (A) Microfluidic deprior to IL-6 exposure. (B) Illustration of the sample preparation method foneurons ± IL-6). Samples were prepared for exometabolomic analyses and anmobility-mass spectrometer.
use, individual microfluidic channels were stored in de-ionized water.Microfluidic devices consisted of four separate micro-
channels, each having an inlet and outlet channel andone cell culture chamber region (Figure 1A). The deviceswere designed to reduce flow velocity by expanding thecell culture chamber. The larger cell culture chamber,with dimensions of 5,400 μm (length) × 800 μm (width) ×200 μm (height), facilitates cell attachment and has atotal volume of approximately 0.86 μL. A PDMS wallseparates the four chambers, ensuring that no cross talkoccurs among cell culture regions.
Sample preparation for mass spectrometryMetabolites were prepared for ion mobility - mass spec-trometry (IM-MS) analysis by concentrating in vacuo(SpeedVac concentrator, Thermo-Fisher) and reconstitut-ing in 60 μL of 90% acetonitrile, 10% H2O, and 20 mMammonium acetate (pH = 9). Quality control sampleswere prepared by combining equal volumes (15 μL) ofeach sample type.
Mass spectrometry and data analysesUPLC-IM-MS and data-independent acquisition (MSE)were performed on a Waters Synapt G2 HDMS (Milford,MA, USA) mass spectrometer equipped with a WatersnanoAcquity UPLC system and autosampler (Milford, MA,USA). Metabolites were separated on a 1 mm× 100 mm
vices or bioreactors were seeded with neurons or astroglia for 6 daysr bioreactor perfusate samples (control ± IL-6, astroglia ± IL-6, andalysis performed using an ultra-performance liquid chromatography-ion
Brown et al. Journal of Neuroinflammation 2014, 11:183 Page 4 of 12http://www.jneuroinflammation.com/content/11/1/183
hydrophilic interaction column packed with 1.7-μm, 13-nmethylene bridged hybrid (BEH) particles (Waters, Milford,MA, USA). Liquid chromatography was performed using a20-minute gradient at a flow rate of 90 μL min−1 using solv-ent A (10% H2O (v/v) with 10 mM ammonium acetate atpH 9 in acetonitrile) and solvent B (100% H2O with10 mM ammonium acetate at pH 9). A 3-min washperiod (99% solvent A) was performed prior to any gra-dient changes. After 3 min, solvent B increased to 75%over 12.5 min and up to 50% in 15 min. The columnwas re-equilibrated to 99% solvent A for 5 min aftereach run. Typical IM-MS analyses were run using reso-lution mode, with a capillary voltage of 3.5 kV, sourcetemperature at 120°C, sample cone at 5, source gas flowof 400 mL min−1, desolvation temperature at 400°C, Hecell flow of 180 mL min−1, and an IM gas flow of90 mL min−1. The data were acquired in positive ionmode from 50 to 1700 Da with a 0.3 s scan time; full-scan data were mass corrected during acquisition usingan external reference consisting of 3 ng mL−1 solution ofleucine enkephalin infused at a flow rate of 7 μL min−1.All analytes were analyzed using MSE with an energyramp from 10 to 45 eV.
Data analysisThe integrated intensity of each chromatographically re-solved m/z peak was log2 transformed. Differences inthese peak areas were determined using the averagelogarithmic ratio (ALR =meanEXP - meanCNTR). Statisticalsignificance was determined using unpaired two-tailedStudent’s t-test. Both biological and technical replicateswere used in these calculations. An m/z species was con-sidered differentially expressed when it met the dualcriteria of absolute value |ALR| >0.585 (50% change)and P value <0.05. Direction of change was defined asALRs >0.585 = produced ALRs < -0.585 = consumed. Thelog2 peak area values of species with differential levels be-tween the experimental and control samples were sub-jected to a two-way unsupervised hierarchical clusteringanalysis based on Euclidian distance using GenePatternsoftware [32].
Identification of analytes by ion mobility - massspectrometryThe raw data acquired were converted to mzXML filesusing ProteoWizard msconvert [33]. Following conver-sion, mzXML files were analyzed using XCMS in thestatistical package R Studio (v 0.97.449) to pick and alignfeatures (that is, retention time (RT) - mass-to-charge(m/z) ratio pairs). XCMS was used with default settingsexcept for rector (method = ‘obiwarp’). Data were thennormalized to the summed total ion intensity per chro-matogram, with the total ion count normalized to 10,000counts. The resulting processed data matrix was introduced
into uMetrix (Version 2.0.0) EZ Info multivariate statisticalanalysis software for principal component analysis (PCA)with Pareto scaling.Metabolite peak identifications were putatively assigned
using both accurate mass measurements and MS/MS ana-lysis. Ion mobility separations were utilized to isolate pre-cursor ions, correlate product ions, and discern in-sourcefragmentation. Candidate structures were obtained andinterpreted with available biochemical databases, includingMETLIN [34], the Human Metabolome Database [35], andLIPID MAPS [36] [see Additional files 1, 2, 3, 4 and 5].
Determination of metabolomics differencesPrincipal component analysis was performed on expressionlevels of all measurable analytes using uMetrix (v 2.0.0) EZInfo extended statistics software. Unsupervised, two-wayhierarchical clustering (samples versus analytes) was per-formed on normalized log2 analyte levels in GenePattern[32] using Pearson distance. To determine differentiallyexpressed analytes, all analyses were performed on log2-transformed values. Analytes were considered differentiallyexpressed if they met a dual set of criteria of magnitudechange and significance (P <0.05; │ALR│ >0.585). Add-itionally, for an analyte to be changed under IL-6 stimula-tion, it also had to be significantly different (P <0.05) fromthe IL-6 media perfused through the microfluidic chambercontaining no cells. These calculations were performed inMS-Excel 2010.
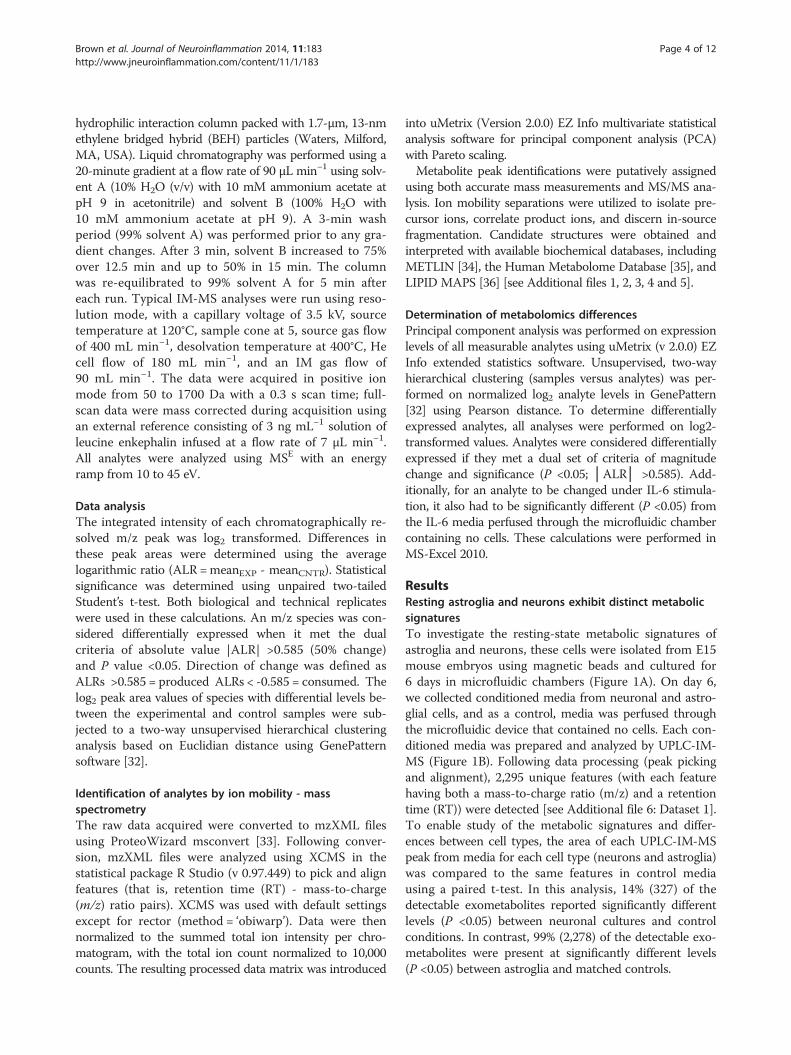
ResultsResting astroglia and neurons exhibit distinct metabolicsignaturesTo investigate the resting-state metabolic signatures ofastroglia and neurons, these cells were isolated from E15mouse embryos using magnetic beads and cultured for6 days in microfluidic chambers (Figure 1A). On day 6,we collected conditioned media from neuronal and astro-glial cells, and as a control, media was perfused throughthe microfluidic device that contained no cells. Each con-ditioned media was prepared and analyzed by UPLC-IM-MS (Figure 1B). Following data processing (peak pickingand alignment), 2,295 unique features (with each featurehaving both a mass-to-charge ratio (m/z) and a retentiontime (RT)) were detected [see Additional file 6: Dataset 1].To enable study of the metabolic signatures and differ-ences between cell types, the area of each UPLC-IM-MSpeak from media for each cell type (neurons and astroglia)was compared to the same features in control mediausing a paired t-test. In this analysis, 14% (327) of thedetectable exometabolites reported significantly differentlevels (P <0.05) between neuronal cultures and controlconditions. In contrast, 99% (2,278) of the detectable exo-metabolites were present at significantly different levels(P <0.05) between astroglia and matched controls.
Brown et al. Journal of Neuroinflammation 2014, 11:183 Page 5 of 12http://www.jneuroinflammation.com/content/11/1/183
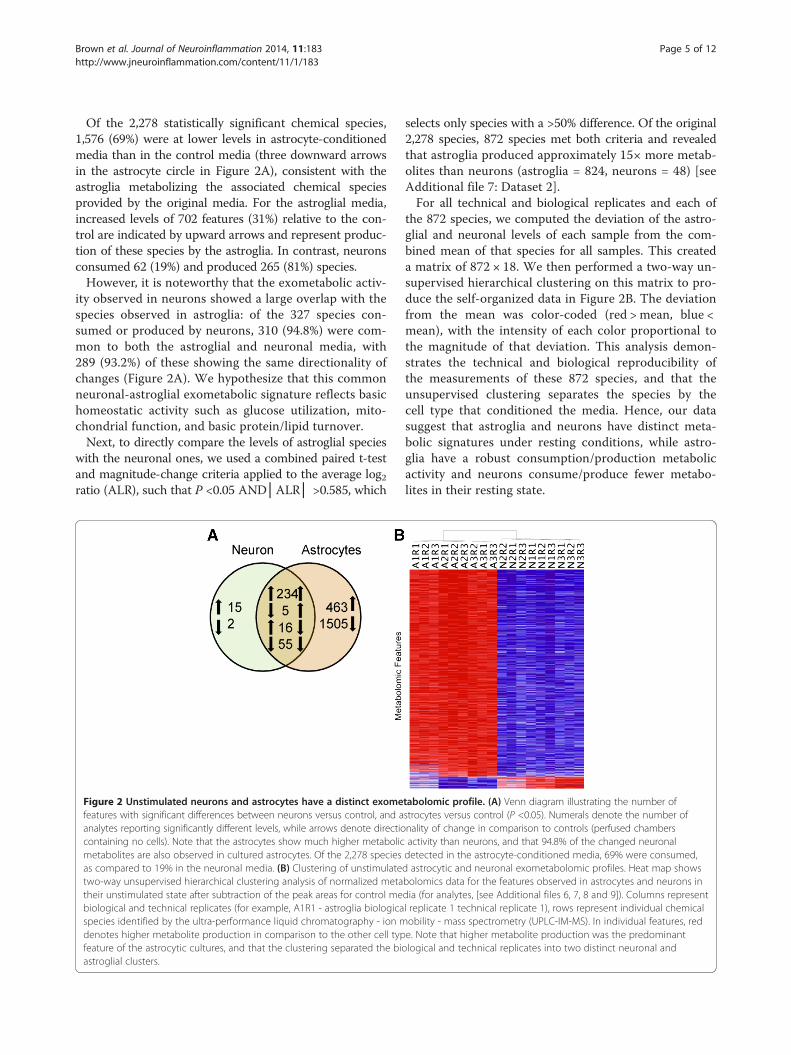
Of the 2,278 statistically significant chemical species,1,576 (69%) were at lower levels in astrocyte-conditionedmedia than in the control media (three downward arrowsin the astrocyte circle in Figure 2A), consistent with theastroglia metabolizing the associated chemical speciesprovided by the original media. For the astroglial media,increased levels of 702 features (31%) relative to the con-trol are indicated by upward arrows and represent produc-tion of these species by the astroglia. In contrast, neuronsconsumed 62 (19%) and produced 265 (81%) species.However, it is noteworthy that the exometabolic activ-
ity observed in neurons showed a large overlap with thespecies observed in astroglia: of the 327 species con-sumed or produced by neurons, 310 (94.8%) were com-mon to both the astroglial and neuronal media, with289 (93.2%) of these showing the same directionality ofchanges (Figure 2A). We hypothesize that this commonneuronal-astroglial exometabolic signature reflects basichomeostatic activity such as glucose utilization, mito-chondrial function, and basic protein/lipid turnover.Next, to directly compare the levels of astroglial species
with the neuronal ones, we used a combined paired t-testand magnitude-change criteria applied to the average log2ratio (ALR), such that P <0.05 AND│ALR│ >0.585, which
Figure 2 Unstimulated neurons and astrocytes have a distinct exomefeatures with significant differences between neurons versus control, and aanalytes reporting significantly different levels, while arrows denote directiocontaining no cells). Note that the astrocytes show much higher metabolicmetabolites are also observed in cultured astrocytes. Of the 2,278 speciesas compared to 19% in the neuronal media. (B) Clustering of unstimulatetwo-way unsupervised hierarchical clustering analysis of normalized metatheir unstimulated state after subtraction of the peak areas for control mebiological and technical replicates (for example, A1R1 - astroglia biologicaspecies identified by the ultra-performance liquid chromatography - ion mdenotes higher metabolite production in comparison to the other cell typfeature of the astrocytic cultures, and that the clustering separated the bioastroglial clusters.
selects only species with a >50% difference. Of the original2,278 species, 872 species met both criteria and revealedthat astroglia produced approximately 15× more metab-olites than neurons (astroglia = 824, neurons = 48) [seeAdditional file 7: Dataset 2].For all technical and biological replicates and each of
the 872 species, we computed the deviation of the astro-glial and neuronal levels of each sample from the com-bined mean of that species for all samples. This createda matrix of 872 × 18. We then performed a two-way un-supervised hierarchical clustering on this matrix to pro-duce the self-organized data in Figure 2B. The deviationfrom the mean was color-coded (red > mean, blue <mean), with the intensity of each color proportional tothe magnitude of that deviation. This analysis demon-strates the technical and biological reproducibility ofthe measurements of these 872 species, and that theunsupervised clustering separates the species by thecell type that conditioned the media. Hence, our datasuggest that astroglia and neurons have distinct meta-bolic signatures under resting conditions, while astro-glia have a robust consumption/production metabolicactivity and neurons consume/produce fewer metabo-lites in their resting state.
tabolomic profile. (A) Venn diagram illustrating the number ofstrocytes versus control (P <0.05). Numerals denote the number ofnality of change in comparison to controls (perfused chambersactivity than neurons, and that 94.8% of the changed neuronaldetected in the astrocyte-conditioned media, 69% were consumed,d astrocytic and neuronal exometabolomic profiles. Heat map showsbolomics data for the features observed in astrocytes and neurons india (for analytes, [see Additional files 6, 7, 8 and 9]). Columns representl replicate 1 technical replicate 1), rows represent individual chemicalobility - mass spectrometry (UPLC-IM-MS). In individual features, rede. Note that higher metabolite production was the predominantlogical and technical replicates into two distinct neuronal and
Brown et al. Journal of Neuroinflammation 2014, 11:183 Page 6 of 12http://www.jneuroinflammation.com/content/11/1/183
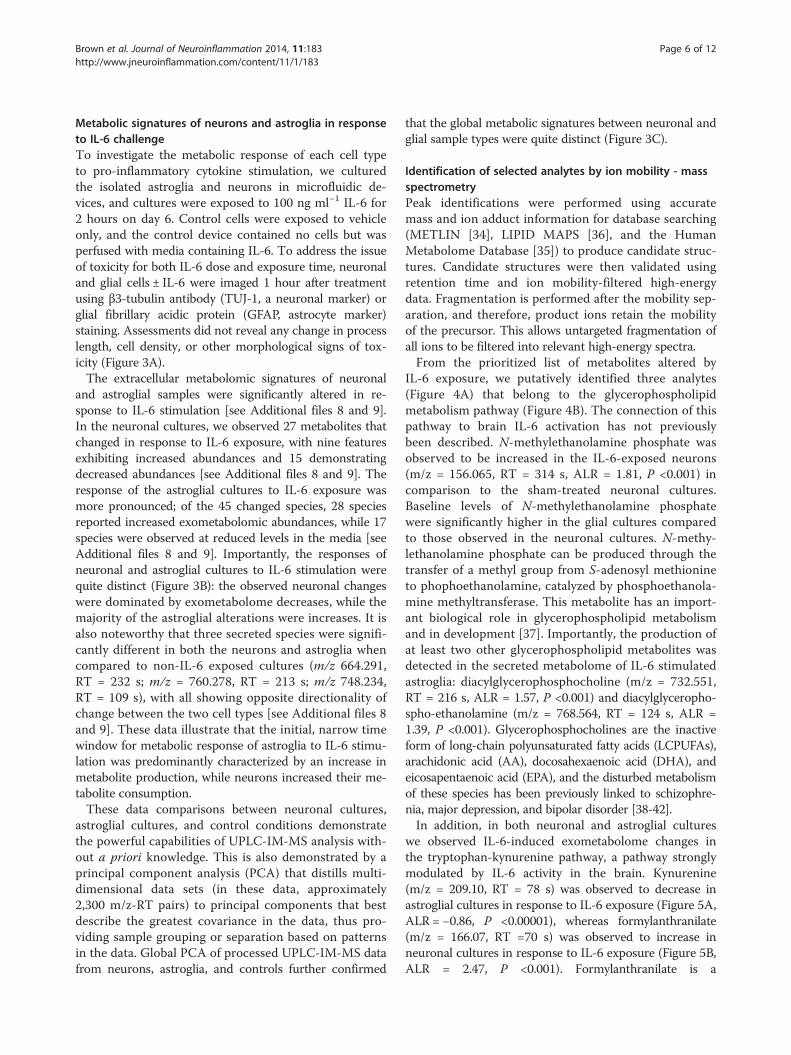
Metabolic signatures of neurons and astroglia in responseto IL-6 challengeTo investigate the metabolic response of each cell typeto pro-inflammatory cytokine stimulation, we culturedthe isolated astroglia and neurons in microfluidic de-vices, and cultures were exposed to 100 ng ml−1 IL-6 for2 hours on day 6. Control cells were exposed to vehicleonly, and the control device contained no cells but wasperfused with media containing IL-6. To address the issueof toxicity for both IL-6 dose and exposure time, neuronaland glial cells ± IL-6 were imaged 1 hour after treatmentusing β3-tubulin antibody (TUJ-1, a neuronal marker) orglial fibrillary acidic protein (GFAP, astrocyte marker)staining. Assessments did not reveal any change in processlength, cell density, or other morphological signs of tox-icity (Figure 3A).The extracellular metabolomic signatures of neuronal
and astroglial samples were significantly altered in re-sponse to IL-6 stimulation [see Additional files 8 and 9].In the neuronal cultures, we observed 27 metabolites thatchanged in response to IL-6 exposure, with nine featuresexhibiting increased abundances and 15 demonstratingdecreased abundances [see Additional files 8 and 9]. Theresponse of the astroglial cultures to IL-6 exposure wasmore pronounced; of the 45 changed species, 28 speciesreported increased exometabolomic abundances, while 17species were observed at reduced levels in the media [seeAdditional files 8 and 9]. Importantly, the responses ofneuronal and astroglial cultures to IL-6 stimulation werequite distinct (Figure 3B): the observed neuronal changeswere dominated by exometabolome decreases, while themajority of the astroglial alterations were increases. It isalso noteworthy that three secreted species were signifi-cantly different in both the neurons and astroglia whencompared to non-IL-6 exposed cultures (m/z 664.291,RT = 232 s; m/z = 760.278, RT = 213 s; m/z 748.234,RT = 109 s), with all showing opposite directionality ofchange between the two cell types [see Additional files 8and 9]. These data illustrate that the initial, narrow timewindow for metabolic response of astroglia to IL-6 stimu-lation was predominantly characterized by an increase inmetabolite production, while neurons increased their me-tabolite consumption.These data comparisons between neuronal cultures,
astroglial cultures, and control conditions demonstratethe powerful capabilities of UPLC-IM-MS analysis with-out a priori knowledge. This is also demonstrated by aprincipal component analysis (PCA) that distills multi-dimensional data sets (in these data, approximately2,300 m/z-RT pairs) to principal components that bestdescribe the greatest covariance in the data, thus pro-viding sample grouping or separation based on patternsin the data. Global PCA of processed UPLC-IM-MS datafrom neurons, astroglia, and controls further confirmed
that the global metabolic signatures between neuronal andglial sample types were quite distinct (Figure 3C).
Identification of selected analytes by ion mobility - massspectrometryPeak identifications were performed using accuratemass and ion adduct information for database searching(METLIN [34], LIPID MAPS [36], and the HumanMetabolome Database [35]) to produce candidate struc-tures. Candidate structures were then validated usingretention time and ion mobility-filtered high-energydata. Fragmentation is performed after the mobility sep-aration, and therefore, product ions retain the mobilityof the precursor. This allows untargeted fragmentation ofall ions to be filtered into relevant high-energy spectra.From the prioritized list of metabolites altered by
IL-6 exposure, we putatively identified three analytes(Figure 4A) that belong to the glycerophospholipidmetabolism pathway (Figure 4B). The connection of thispathway to brain IL-6 activation has not previouslybeen described. N-methylethanolamine phosphate wasobserved to be increased in the IL-6-exposed neurons(m/z = 156.065, RT = 314 s, ALR = 1.81, P <0.001) incomparison to the sham-treated neuronal cultures.Baseline levels of N-methylethanolamine phosphatewere significantly higher in the glial cultures comparedto those observed in the neuronal cultures. N-methy-lethanolamine phosphate can be produced through thetransfer of a methyl group from S-adenosyl methionineto phophoethanolamine, catalyzed by phosphoethanola-mine methyltransferase. This metabolite has an import-ant biological role in glycerophospholipid metabolismand in development [37]. Importantly, the production ofat least two other glycerophospholipid metabolites wasdetected in the secreted metabolome of IL-6 stimulatedastroglia: diacylglycerophosphocholine (m/z = 732.551,RT = 216 s, ALR = 1.57, P <0.001) and diacylglyceropho-spho-ethanolamine (m/z = 768.564, RT = 124 s, ALR =1.39, P <0.001). Glycerophosphocholines are the inactiveform of long-chain polyunsaturated fatty acids (LCPUFAs),arachidonic acid (AA), docosahexaenoic acid (DHA), andeicosapentaenoic acid (EPA), and the disturbed metabolismof these species has been previously linked to schizophre-nia, major depression, and bipolar disorder [38-42].In addition, in both neuronal and astroglial cultures
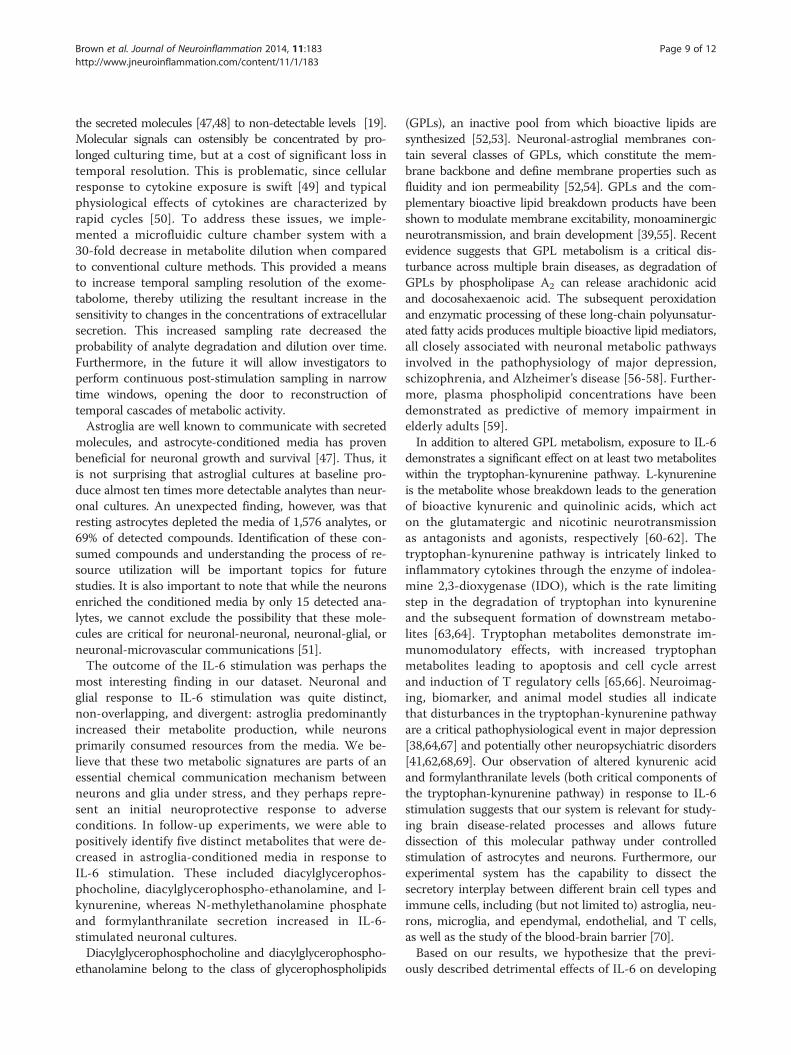
we observed IL-6-induced exometabolome changes inthe tryptophan-kynurenine pathway, a pathway stronglymodulated by IL-6 activity in the brain. Kynurenine(m/z = 209.10, RT = 78 s) was observed to decrease inastroglial cultures in response to IL-6 exposure (Figure 5A,ALR = −0.86, P <0.00001), whereas formylanthranilate(m/z = 166.07, RT =70 s) was observed to increase inneuronal cultures in response to IL-6 exposure (Figure 5B,ALR = 2.47, P <0.001). Formylanthranilate is a
Figure 3 Effects of IL-6 exposure on astrocytes and neuronal cultures. (A) Cultured neurons and astrocytes were exposed to IL-6 for 2 hoursand allowed to recover for 1 hour prior to imaging. Cells were fixed with 4% PFA and labeled with neuronal marker Tuj-1 or GFAP, an astrocytemarker. Appearance, process length, and cell density were similar to the untreated, matched controls. (B) Venn diagram illustrating the number offeatures with significant differences between IL-6 treatment and matched, sham-treated control cultures (P <0.05;│ALR│>0.585, that is, >50% ofcontrol). Numerals denote the number of features (m/z and retention time pairs) with significantly different levels, while arrows denote directionality ofchange in comparison to controls. Note that the neuronal and astroglial exometabolome response to IL-6 treatment is distinct. (C) Global principalcomponent analysis (PCA) of ultra-performance liquid chromatography - ion mobility - mass spectrometry (UPLC-IM-MS) data illustrating that there aredistinct metabolic signatures between neuronal and astroglial sample types.
Brown et al. Journal of Neuroinflammation 2014, 11:183 Page 7 of 12http://www.jneuroinflammation.com/content/11/1/183
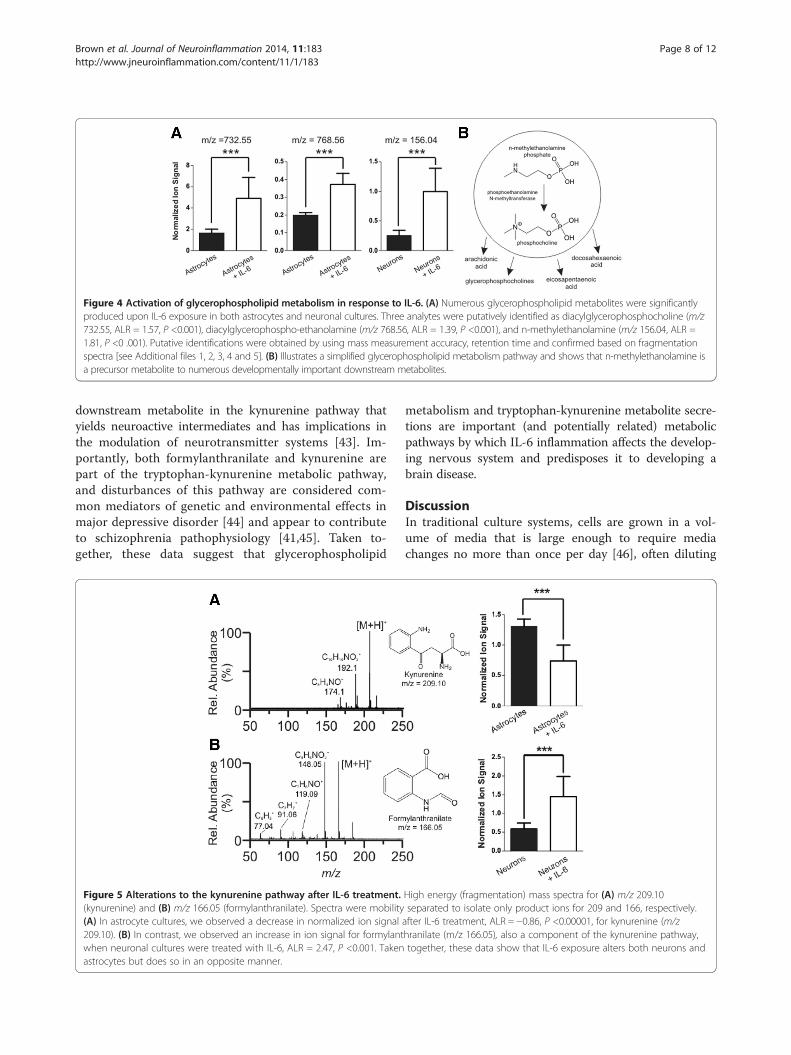
Figure 4 Activation of glycerophospholipid metabolism in response to IL-6. (A) Numerous glycerophospholipid metabolites were significantlyproduced upon IL-6 exposure in both astrocytes and neuronal cultures. Three analytes were putatively identified as diacylglycerophosphocholine (m/z732.55, ALR = 1.57, P <0.001), diacylglycerophospho-ethanolamine (m/z 768.56, ALR = 1.39, P <0.001), and n-methylethanolamine (m/z 156.04, ALR =1.81, P <0 .001). Putative identifications were obtained by using mass measurement accuracy, retention time and confirmed based on fragmentationspectra [see Additional files 1, 2, 3, 4 and 5]. (B) Illustrates a simplified glycerophospholipid metabolism pathway and shows that n-methylethanolamine isa precursor metabolite to numerous developmentally important downstream metabolites.
Brown et al. Journal of Neuroinflammation 2014, 11:183 Page 8 of 12http://www.jneuroinflammation.com/content/11/1/183
downstream metabolite in the kynurenine pathway thatyields neuroactive intermediates and has implications inthe modulation of neurotransmitter systems [43]. Im-portantly, both formylanthranilate and kynurenine arepart of the tryptophan-kynurenine metabolic pathway,and disturbances of this pathway are considered com-mon mediators of genetic and environmental effects inmajor depressive disorder [44] and appear to contributeto schizophrenia pathophysiology [41,45]. Taken to-gether, these data suggest that glycerophospholipid
Figure 5 Alterations to the kynurenine pathway after IL-6 treatment.(kynurenine) and (B) m/z 166.05 (formylanthranilate). Spectra were mobility(A) In astrocyte cultures, we observed a decrease in normalized ion signal209.10). (B) In contrast, we observed an increase in ion signal for formylantwhen neuronal cultures were treated with IL-6, ALR = 2.47, P <0.001. Takenastrocytes but does so in an opposite manner.
metabolism and tryptophan-kynurenine metabolite secre-tions are important (and potentially related) metabolicpathways by which IL-6 inflammation affects the develop-ing nervous system and predisposes it to developing abrain disease.
DiscussionIn traditional culture systems, cells are grown in a vol-ume of media that is large enough to require mediachanges no more than once per day [46], often diluting
High energy (fragmentation) mass spectra for (A) m/z 209.10separated to isolate only product ions for 209 and 166, respectively.after IL-6 treatment, ALR = −0.86, P <0.00001, for kynurenine (m/zhranilate (m/z 166.05), also a component of the kynurenine pathway,together, these data show that IL-6 exposure alters both neurons and
Brown et al. Journal of Neuroinflammation 2014, 11:183 Page 9 of 12http://www.jneuroinflammation.com/content/11/1/183
the secreted molecules [47,48] to non-detectable levels [19].Molecular signals can ostensibly be concentrated by pro-longed culturing time, but at a cost of significant loss intemporal resolution. This is problematic, since cellularresponse to cytokine exposure is swift [49] and typicalphysiological effects of cytokines are characterized byrapid cycles [50]. To address these issues, we imple-mented a microfluidic culture chamber system with a30-fold decrease in metabolite dilution when comparedto conventional culture methods. This provided a meansto increase temporal sampling resolution of the exome-tabolome, thereby utilizing the resultant increase in thesensitivity to changes in the concentrations of extracellularsecretion. This increased sampling rate decreased theprobability of analyte degradation and dilution over time.Furthermore, in the future it will allow investigators toperform continuous post-stimulation sampling in narrowtime windows, opening the door to reconstruction oftemporal cascades of metabolic activity.Astroglia are well known to communicate with secreted
molecules, and astrocyte-conditioned media has provenbeneficial for neuronal growth and survival [47]. Thus, itis not surprising that astroglial cultures at baseline pro-duce almost ten times more detectable analytes than neur-onal cultures. An unexpected finding, however, was thatresting astrocytes depleted the media of 1,576 analytes, or69% of detected compounds. Identification of these con-sumed compounds and understanding the process of re-source utilization will be important topics for futurestudies. It is also important to note that while the neuronsenriched the conditioned media by only 15 detected ana-lytes, we cannot exclude the possibility that these mole-cules are critical for neuronal-neuronal, neuronal-glial, orneuronal-microvascular communications [51].The outcome of the IL-6 stimulation was perhaps the
most interesting finding in our dataset. Neuronal andglial response to IL-6 stimulation was quite distinct,non-overlapping, and divergent: astroglia predominantlyincreased their metabolite production, while neuronsprimarily consumed resources from the media. We be-lieve that these two metabolic signatures are parts of anessential chemical communication mechanism betweenneurons and glia under stress, and they perhaps repre-sent an initial neuroprotective response to adverseconditions. In follow-up experiments, we were able topositively identify five distinct metabolites that were de-creased in astroglia-conditioned media in response toIL-6 stimulation. These included diacylglycerophos-phocholine, diacylglycerophospho-ethanolamine, and l-kynurenine, whereas N-methylethanolamine phosphateand formylanthranilate secretion increased in IL-6-stimulated neuronal cultures.Diacylglycerophosphocholine and diacylglycerophospho-
ethanolamine belong to the class of glycerophospholipids
(GPLs), an inactive pool from which bioactive lipids aresynthesized [52,53]. Neuronal-astroglial membranes con-tain several classes of GPLs, which constitute the mem-brane backbone and define membrane properties such asfluidity and ion permeability [52,54]. GPLs and the com-plementary bioactive lipid breakdown products have beenshown to modulate membrane excitability, monoaminergicneurotransmission, and brain development [39,55]. Recentevidence suggests that GPL metabolism is a critical dis-turbance across multiple brain diseases, as degradation ofGPLs by phospholipase A2 can release arachidonic acidand docosahexaenoic acid. The subsequent peroxidationand enzymatic processing of these long-chain polyunsatur-ated fatty acids produces multiple bioactive lipid mediators,all closely associated with neuronal metabolic pathwaysinvolved in the pathophysiology of major depression,schizophrenia, and Alzheimer’s disease [56-58]. Further-more, plasma phospholipid concentrations have beendemonstrated as predictive of memory impairment inelderly adults [59].In addition to altered GPL metabolism, exposure to IL-6
demonstrates a significant effect on at least two metaboliteswithin the tryptophan-kynurenine pathway. L-kynurenineis the metabolite whose breakdown leads to the generationof bioactive kynurenic and quinolinic acids, which acton the glutamatergic and nicotinic neurotransmissionas antagonists and agonists, respectively [60-62]. Thetryptophan-kynurenine pathway is intricately linked toinflammatory cytokines through the enzyme of indolea-mine 2,3-dioxygenase (IDO), which is the rate limitingstep in the degradation of tryptophan into kynurenineand the subsequent formation of downstream metabo-lites [63,64]. Tryptophan metabolites demonstrate im-munomodulatory effects, with increased tryptophanmetabolites leading to apoptosis and cell cycle arrestand induction of T regulatory cells [65,66]. Neuroimag-ing, biomarker, and animal model studies all indicatethat disturbances in the tryptophan-kynurenine pathwayare a critical pathophysiological event in major depression[38,64,67] and potentially other neuropsychiatric disorders[41,62,68,69]. Our observation of altered kynurenic acidand formylanthranilate levels (both critical components ofthe tryptophan-kynurenine pathway) in response to IL-6stimulation suggests that our system is relevant for study-ing brain disease-related processes and allows futuredissection of this molecular pathway under controlledstimulation of astrocytes and neurons. Furthermore, ourexperimental system has the capability to dissect thesecretory interplay between different brain cell types andimmune cells, including (but not limited to) astroglia, neu-rons, microglia, and ependymal, endothelial, and T cells,as well as the study of the blood-brain barrier [70].Based on our results, we hypothesize that the previ-
ously described detrimental effects of IL-6 on developing
Brown et al. Journal of Neuroinflammation 2014, 11:183 Page 10 of 12http://www.jneuroinflammation.com/content/11/1/183
neurons are at least partially due to the response ofastroglia to IL-6, resulting in an altered exometabolomicprofile, which in turn has a damaging effect on neurons.We intend to investigate this hypothesis further in follow-up, mechanistic studies which would test the effects theIL-6-induced astroglial exometabolome has on neuronaldifferentiation, growth, and synapse formation. This inves-tigation, coupled with precise identification and testingthe effects of individual metabolites, would lead to a betterunderstanding of neurotoxic and neuroprotective pro-cesses that might occur in the developing brain. Futureexperiments will also encompass defining exometabolo-mic changes, responses, and interplay between varioussubclasses of neurons and across the various brain re-gions, leading to three-dimensional in vitro modeling ofthe brain.It is also noteworthy that IL-6 response is quite con-
served across species [71-73] and that the general CNSdevelopment in rodents is governed by the same basicprinciples as in humans [74]. Thus, we believe that ourfindings, obtained on developing mouse neurons, are alsorelevant for human conditions such as schizophrenia andautism. This view is also underscored by human diseasefindings of elevated cytokines in schizophrenia and autism[6,7,10], as well as the critical role of IL-6 in maternal im-mune activation models [8-10].
ConclusionsIn summary, our studies utilize microfluidic technologywith a superb cell-to-media volume ratio, which is ideallysuited for analysis of cell-type-specific metabolic signa-tures. We find that 1) developing neurons have lowermetabolic activity at baseline than astroglia, which showstrong production of metabolites; 2) both neurons andastroglia respond to IL-6 exposure in a cell-type-specificfashion; 3) with IL-6 stimulation of each cell type, metabol-ite production predominantly increases for the astrocytesas compared to sham-treated cells, but decreases for neu-rons; and 4) disturbances in glycerophospholipid metabol-ism and tryptophan/kynurenine metabolite secretion aretwo important mechanisms by which IL-6 might affect thedeveloping nervous system.
Additional files
Additional file 1: Energy spectra for mass 156.04. Low (top) andhigh (bottom) energy spectra for mass 156.04, putatively identified asn-methylethanolamine phosphate. The fragmentation spectrum ismobility selected to isolate only product ions for this mass.
Additional file 2: Energy spectra for mass 209.10. Low (top) andhigh (bottom) energy spectra for mass 209.10, putatively identified askynurenine. The fragmentation spectrum is mobility selected to isolateonly product ions for this mass.
Additional file 3: Energy spectra for mass 166.05. Low (top) andhigh (bottom) energy spectra for mass 166.05, putatively identified as
formylanthranilate. The fragmentation spectrum is mobility selected toisolate only product ions for this mass.
Additional file 4: Energy spectra for mass 732.55. Low (top) andhigh (bottom) energy spectra for mass 732.55, a fragment of 760.59 andputatively identified as a phosphatidylcholine (PC). The fragmentationspectrum is mobility selected to isolate only product ions for this mass. Acharacteristic fragment ion of PCs is an ion at m/z 184, which is thephosphatidylcholine head group (structure shown above). The abovestructure is ONLY an example of the structure of PCs.
Additional file 5: Energy spectra for mass 768.56. Low (top) andhigh (bottom) energy spectra for mass 768.56, putatively identified as aphosphatidylethanolamine (PE). The fragmentation spectrum is mobilityselected to isolate only product ions for this mass. A characteristicfragment ion of PEs is the neutral loss of 141, which is theethanolaminephosphate head group (structure shown above). The abovestructure is ONLY an example of the structure of PEs.
Additional file 6: Dataset 1. Baseline astroglia and neurons, secretedand consumed – all data.
Additional file 7: Dataset 2. Neuron versus glial baseline – all data.
Additional file 8: Dataset 3. Effect of interleukin-6 – all data.
Additional file 9: Exometabolomic response of neurons and glia toIL-6 stimulation. Abbreviations: m/z, mass-to-charge ratio; RT, retentiontime; NIL6, neurons + IL-6; GIL6, glia + IL-6 stimulation; EIL6, emptychamber + IL-6 containing media; ALR, average Log2 ratio; P val, P value.
AbbreviationsAA: arachidonic acid; ALR: average logarithmic ratio; BEH: ethylene bridgedhybrid; CNS: central nervous system; DHA: docosahexaenoic acid;EPA: eicosapentaenoic acid; GFAP: glial fibrillary acidic protein;GPL: glycerophospholipid; HBSS: Hank’s balanced salt solution;IDO: indoleamine 2,3-dioxygenase; IL-6: interleukin-6; IM-MS: ion mobility -mass spectrometry; LC: liquid chromatography; LCPUFA: long-chainpolyunsaturated fatty acid; LPS: lipopolysaccharide; MEM: minimum essentialmedium; MIA: maternal immune activation; MS: mass spectrometry;MSE: data-independent acquisition mass spectrometry; NB: neural basal;PCA: principal component analysis; PDMS: polydimethylsiloxane; PolyI:C: polyinosinic:polycytidylic acid; RT: retention time; UPLC: ultra-performanceliquid chromatography; UPLC-IM-MS: ultra-performance liquidchromatography - ion mobility - mass spectrometry.
Competing interestsThe authors declare that they have no competing interests.
Authors’ contributionsJAB, JAM, JPW, and KM designed the study; JAB designed and executedexperiments in bioreactors; SDS and CRG designed and executed analysesmethods and UPLC IM-MS methods; JAB and SDS performed research; BB,LY, and DL contributed new analytic tools; KAG analyzed data; JAB, SDS, CRG,JAM, JPW, and KM analyzed, integrated, and interpreted data; JAB, SDS, CRG,and KM wrote the manuscript; and BB, LY, KAG, DL, JAM, and JPW edited themanuscript. All authors read and approved the final manuscript.
AcknowledgementsThis work and the preparation of the manuscript were supported in part bygrants from the National Institutes of Health: R01 MH079299 (NIMH) to KM,UH2 TR000491 (NCATS and the NIH Common Fund) to JPW, and P30HD15052 (NICHD) awarded to the Vanderbilt Kennedy Center for Researchon Human Development; JAB is supported by 2T32MH065215-11 (NIMH). Aportion of the work was also funded by a Vanderbilt University DiscoveryGrant to JPW. The content of this manuscript is solely the responsibility ofthe authors and does not necessarily represent the official views of thefunding agencies and organizations. The funding agencies and organizationshad no role in the design, collection, analysis, and interpretation of data, norwere they involved in the writing of the manuscript and the decision tosubmit it for publication. We appreciate the support of the VanderbiltInstitute for Integrative Biosystems Research and Education (VIIBRE) and theVanderbilt Institute of Chemical Biology, and thank Allison Price of VIIBRE forediting and providing valuable comments on the manuscript.
Brown et al. Journal of Neuroinflammation 2014, 11:183 Page 11 of 12http://www.jneuroinflammation.com/content/11/1/183
Author details1Department of Psychiatry, 465 21st Avenue South, Vanderbilt University,Nashville, TN 37232, USA. 2Vanderbilt Institute for Integrative BiosystemsResearch and Education, 6809 Stevenson Center, Vanderbilt University,Nashville, TN 37235, USA. 3Department of Physics and Astronomy, 6301Stevenson Center, Vanderbilt University, Nashville, TN 37235, USA.4Department of Chemistry, 5421 Stevenson Center, Vanderbilt University,Nashville, TN 37235, USA. 5Department of Mechanical Engineering, 333 OlinHall, Vanderbilt University, Nashville, TN 37235, USA. 6Department ofBiomedical Engineering, 5824 Stevenson Center, Vanderbilt University,Nashville 37235, TN, USA. 7Department of Molecular Physiology andBiophysics, 702 Light Hall, Vanderbilt University, Nashville, TN 37232, USA.8Vanderbilt Kennedy Center for Research on Human Development, 110Magnolia Circle, Vanderbilt University, Nashville, TN 37203, USA. 9Departmentof Psychiatry, University of Szeged, 6725 Szeged, Hungary.
Received: 25 August 2014 Accepted: 11 October 2014
References1. Arion D, Unger T, Lewis DA, Levitt P, Mirnics K: Molecular evidence for
increased expression of genes related to immune and chaperonefunction in the prefrontal cortex in schizophrenia. Biol Psychiatry 2007,62:711–721.
2. Voineagu I, Wang X, Johnston P, Lowe JK, Tian Y, Horvath S, Mill J, Cantor RM,Blencowe BJ, Geschwind DH: Transcriptomic analysis of autistic brain revealsconvergent molecular pathology. Nature 2011, 474:380–384.
3. Garbett K, Ebert PJ, Mitchell A, Lintas C, Manzi B, Mirnics K, Persico AM:Immune transcriptome alterations in the temporal cortex of subjectswith autism. Neurobiol Dis 2008, 30:303–311.
4. Shelton RC, Claiborne J, Sidoryk-Wegrzynowicz M, Reddy R, Aschner M,Lewis DA, Mirnics K: Altered expression of genes involved in inflammationand apoptosis in frontal cortex in major depression. Mol Psychiatry 2010,16:751–762.
5. Ganguly D, Haak S, Sisirak V, Reizis B: The role of dendritic cells inautoimmunity. Nat Rev Immunol 2013, 13:566–577.
6. Horvath S, Mirnics K: Immune system disturbances in schizophrenia. BiolPsychiatry 2014, 75:316–323.
7. Michel M, Schmidt MJ, Mirnics K: Immune system gene dysregulation inautism and schizophrenia. Dev Neurobiol 2012, 72:1277–1287.
8. Shi L, Fatemi SH, Sidwell RW, Patterson PH: Maternal influenza infectioncauses marked behavioral and pharmacological changes in theoffspring. J Neurosci 2003, 23:297–302.
9. Hsiao EY, McBride SW, Chow J, Mazmanian SK, Patterson PH: Modeling anautism risk factor in mice leads to permanent immune dysregulation.Proc Natl Acad Sci U S A 2012, 109:12776–12781.
10. Shi L, Tu N, Patterson PH: Maternal influenza infection is likely to alterfetal brain development indirectly: the virus is not detected in the fetus.Int J Dev Neurosci 2005, 23:299–305.
11. Patterson PH: Immune involvement in schizophrenia and autism: etiology,pathology and animal models. Behav Brain Res 2009, 204:313–321.
12. Garbett KA, Hsiao EY, Kalman S, Patterson PH, Mirnics K: Effects of maternalimmune activation on gene expression patterns in the fetal brain.Transl Psychiatry 2012, 2:e98.
13. Smith SE, Li J, Garbett K, Mirnics K, Patterson PH: Maternal immuneactivation alters fetal brain development through interleukin-6. J Neurosci2007, 27:10695–10702.
14. Hsiao EY, Patterson PH: Activation of the maternal immune systeminduces endocrine changes in the placenta via IL-6. Brain Behav Immun2011, 25:604–615.
15. Erta M, Quintana A, Hidalgo J: Interleukin-6, a major cytokine in thecentral nervous system. Int J Biol Sci 2012, 8:1254–1266.
16. Spooren A, Kolmus K, Laureys G, Clinckers R, De Keyser J, Haegeman G,Gerlo S: Interleukin-6, a mental cytokine. Brain Res Rev 2011, 67:157–183.
17. Stolp HB: Neuropoietic cytokines in normal brain development andneurodevelopmental disorders. Mol Cell Neurosci 2012, 53:63–68.
18. Wikswo JP, Curtis EL, Eagleton ZE, Evans BC, Kole A, Hofmeister LH, Matloff WJ:Scaling and systems biology for integrating multiple organs-on-a-chip.Lab Chip 2013, 13:3496–3511.
19. Faley S, Seale K, Hughey J, Schaffer DK, VanCompernolle S, McKinney B,Baudenbacher F, Unutmaz D, Wikswo JP: Microfluidic platform for
real-time signaling analysis of multiple single T cells in parallel. Lab Chip2008, 8:1700–1712.
20. Enders JR, Marasco CC, Wikswo JP, McLean JA: A dual-column solid phaseextraction strategy for online collection and preparation of continuouslyflowing effluent streams for mass spectrometry. Anal Chem 2012,84:8467–8474.
21. Brown JA, Diggs-Andrews KA, Gianino SM, Gutmann DH: Neurofibromatosis-1heterozygosity impairs CNS neuronal morphology in a cAMP/PKA/ROCK-dependent manner. Mol Cell Neurosci 2011, 49:13–22.
22. Clarris HJ, Nurcombe V, Small DH, Beyreuther K, Masters CL: Secretion ofnerve growth factor from septum stimulates neurite outgrowth andrelease of the amyloid protein precursor of Alzheimer’s disease fromhippocampal explants. J Neurosci Res 1994, 38:248–258.
23. Kerrison JB, Zack DJ: Neurite outgrowth in retinal ganglion cell culture.Methods Mol Biol 2007, 356:427–434.
24. Dugan LL, Kim JS, Zhang Y, Bart RD, Sun Y, Holtzman DM, Gutmann DH:Differential effects of cAMP in neurons and astrocytes. Role of B-raf J BiolChem 1999, 274:25842–25848.
25. Sandsmark DK, Zhang H, Hegedus B, Pelletier CL, Weber JD, Gutmann DH:Nucleophosmin mediates mammalian target of rapamycin-dependentactin cytoskeleton dynamics and proliferation in neurofibromin-deficientastrocytes. Cancer Res 2007, 67:4790–4799.
26. Dugan JP, Stratton A, Riley HP, Farmer WT, Mastick GS: Midbraindopaminergic axons are guided longitudinally through thediencephalon by Slit/Robo signals. Mol Cell Neurosci 2011, 46:347–356.
27. McDonald JC, Whitesides GM: Poly(dimethylsiloxane) as a material forfabricating microfluidic devices. Acc Chem Res 2002, 35:491–499.
28. Whitesides GM, Ostuni E, Takayama S, Jiang X, Ingber DE: Soft lithographyin biology and biochemistry. Annu Rev Biomed Eng 2001, 3:335–373.
29. Shi M, Majumdar D, Gao Y, Brewer BM, Goodwin CR, McLean JA, Li D, Webb DJ:Glia co-culture with neurons in microfluidic platforms promotes the formationand stabilization of synaptic contacts. Lab Chip 2013, 13:3008–3021.
30. Gao Y, Majumdar D, Jovanovic B, Shaifer C, Lin PC, Zijlstra A, Webb DJ, Li D:A versatile valve-enabled microfluidic cell co-culture platform anddemonstration of its applications to neurobiology and cancer biology.Biomed Microdevices 2011, 13:539–548.
31. Brewer BM, Shi M, Edd JF, Webb DJ, Li D: A microfluidic cell co-cultureplatform with a liquid fluorocarbon separator. Biomed Microdevices 2014,16(2):311–323.
32. Kuehn H, Liberzon A, Reich M, Mesirov JP: Using GenePattern for geneexpression analysis. Curr Protoc Bioinformatics 2008, Chapter 7:Unit 7 12.
33. Kessner D, Chambers M, Burke R, Agus D, Mallick P: ProteoWizard: opensource software for rapid proteomics tools development. Bioinformatics2008, 24:2534–2536.
34. Smith CA, O’Maille G, Want EJ, Qin C, Trauger SA, Brandon TR, Custodio DE,Abagyan R, Siuzdak G: METLIN: a metabolite mass spectral database.Ther Drug Monit 2005, 27:747–751.
35. Wishart DS: Current progress in computational metabolomics. BriefBioinform 2007, 8:279–293.
36. Sud M, Fahy E, Cotter D, Brown A, Dennis EA, Glass CK, Merrill AH Jr,Murphy RC, Raetz CR, Russell DW, Subramaniam S: LMSD: LIPID MAPSstructure database. Nucleic Acids Res 2007, 35:D527–D532.
37. da Costa KA, Rai KS, Craciunescu CN, Parikh K, Mehedint MG, Sanders LM,McLean-Pottinger A, Zeisel SH: Dietary docosahexaenoic acid supplementationmodulates hippocampal development in the Pemt−/−mouse. J Biol Chem2010, 285:1008–1015.
38. Myint AM, Schwarz MJ, Muller N: The role of the kynurenine metabolismin major depression. J Neural Transm 2011, 119:245–251.
39. Janssen CI, Kiliaan AJ: Long-chain polyunsaturated fatty acids (LCPUFA) fromgenesis to senescence: The influence of LCPUFA on neural development,aging, and neurodegeneration. Prog Lipid Res 2013, 53C:1–17.
40. Pfaffenseller B, Fries GR, Wollenhaupt-Aguiar B, Colpo GD, Stertz L, Panizzutti B,Magalhaes PV, Kapczinski F: Neurotrophins, inflammation and oxidativestress as illness activity biomarkers in bipolar disorder. Expert Rev Neurother2013, 13:827–842.
41. Muller N, Myint AM, Schwarz MJ: Kynurenine pathway in schizophrenia:pathophysiological and therapeutic aspects. Curr Pharm Des 2011,17:130–136.
42. McIntyre TM: Bioactive oxidatively truncated phospholipids ininflammation and apoptosis: formation, targets, and inactivation. BiochimBiophys Acta 2012, 1818:2456–2464.
Brown et al. Journal of Neuroinflammation 2014, 11:183 Page 12 of 12http://www.jneuroinflammation.com/content/11/1/183
43. Schwarcz R, Pellicciari R: Manipulation of brain kynurenines: glial targets,neuronal effects, and clinical opportunities. J Pharmacol Exp Ther 2002,303:1–10.
44. Oxenkrug GF: Tryptophan kynurenine metabolism as a commonmediator of genetic and environmental impacts in major depressivedisorder: the serotonin hypothesis revisited 40 years later. Isr J PsychiatryRelat Sci 2010, 47:56–63.
45. Johansson AS, Owe-Larsson B, Asp L, Kocki T, Adler M, Hetta J, Gardner R,Lundkvist GB, Urbanska EM, Karlsson H: Activation of kynurenine pathwayin ex vivo fibroblasts from patients with bipolar disorder or schizophrenia:cytokine challenge increases production of 3-hydroxykynurenine. J PsychiatrRes 2013, 47:1815–1823.
46. Doering LC (Ed): Protocols for Neural Cell Culture. 4th edition. New York:Humana Press; 2010.
47. Ji R, Tian S, Lu HJ, Lu Q, Zheng Y, Wang X, Ding J, Li Q: TAM receptorsaffect adult brain neurogenesis by negative regulation of microglial cellactivation. J Immunol 2013, 191:6165–6177.
48. Losino N, Waisman A, Solari C, Luzzani C, Espinosa DF, Sassone A, Muro AF,Miriuka S, Sevlever G, Baranao L, Guberman A: EDA-containing fibronectinincreases proliferation of embryonic stem cells. PLoS One 2013, 8:e80681.
49. Rao KM, Ma JY, Meighan T, Barger MW, Pack D, Vallyathan V: Time courseof gene expression of inflammatory mediators in rat lung after dieselexhaust particle exposure. Environ Health Perspect 2005, 113:612–617.
50. Wei F, Guo W, Zou S, Ren K, Dubner R: Supraspinal glial-neuronalinteractions contribute to descending pain facilitation. J Neurosci 2008,28:10482–10495.
51. Polazzi E, Contestabile A: Neuron-conditioned media differentially affectthe survival of activated or unstimulated microglia: evidence forneuronal control on apoptotic elimination of activated microglia.J Neuropathol Exp Neurol 2003, 62:351–362.
52. Morell P, Ousley AH: Metabolic turnover of myelin glycerophospholipids.Neurochem Res 1994, 19:967–974.
53. Lee C, Fisher SK, Agranoff BW, Hajra AK: Quantitative analysis of molecularspecies of diacylglycerol and phosphatidate formed upon muscarinicreceptor activation of human SK-N-SH neuroblastoma cells. J Biol Chem1991, 266:22837–22846.
54. Frisardi V, Panza F, Seripa D, Farooqui T, Farooqui AA:Glycerophospholipids and glycerophospholipid-derived lipid mediators:a complex meshwork in Alzheimer’s disease pathology. Prog Lipid Res2011, 50:313–330.
55. Chen C, Bazan NG: Lipid signaling: sleep, synaptic plasticity, andneuroprotection. Prostaglandins Other Lipid Mediat 2005, 77:65–76.
56. Lopresti AL, Maker GL, Hood SD, Drummond PD: A review of peripheralbiomarkers in major depression: the potential of inflammatory andoxidative stress biomarkers. Prog Neuropsychopharmacol Biol Psychiatry2013, 48:102–111.
57. Najjar S, Pearlman DM, Hirsch S, Friedman K, Strange J, Reidy J, Khoukaz M,Ferrell RB, Devinsky O, Najjar A, Zagzag D: Brain biopsy findings link majordepressive disorder to neuroinflammation, oxidative stress, andneurovascular dysfunction: a case report. Biol Psychiatry 2014, 75:e23–e26.
58. Wu JQ, Kosten TR, Zhang XY: Free radicals, antioxidant defense systems,and schizophrenia. Prog Neuropsychopharmacol Biol Psychiatry 2013,46:200–206.
59. Mapstone M, Cheema AK, Fiandaca MS, Zhong X, Mhyre TR, Federoff HJ:Plasma phospholipids identify antecedent memory impairment in olderadults. Nat Med 2014, 20(4):415–418.
60. Stone TW: Kynurenic acid antagonists and kynurenine pathwayinhibitors. Expert Opin Investig Drugs 2001, 10:633–645.
61. Freese A, Swartz KJ, During MJ, Martin JB: Kynurenine metabolites oftryptophan: implications for neurologic diseases. Neurology 1990,40:691–695.
62. Stone TW, Forrest CM, Darlington LG: Kynurenine pathway inhibition as atherapeutic strategy for neuroprotection. FEBS J 2012, 279:1386–1397.
63. Dantzer R, O’Connor JC, Lawson MA, Kelley KW: Inflammation-associateddepression: from serotonin to kynurenine. Psychoneuroendocrinology 2010,36:426–436.
64. Myint AM, Bondy B, Baghai TC, Eser D, Nothdurfter C, Schule C, Zill P, Muller N,Rupprecht R, Schwarz MJ: Tryptophan metabolism and immunogenetics inmajor depression: a role for interferon-gamma gene. Brain Behav Immun2013, 31:128–133.
65. Munn DH, Mellor AL: Indoleamine 2,3-dioxygenase and tumor-inducedtolerance. J Clin Invest 2007, 117:1147–1154.
66. Jain A, Munn LL: Biomimetic postcapillary expansions for enhancing rareblood cell separation on a microfluidic chip. Lab Chip 2011, 11:2941–2947.
67. Oxenkrug G: Serotonin-kynurenine hypothesis of depression: historicaloverview and recent developments. Curr Drug Targets 2013, 14:514–521.
68. Myint AM: Kynurenines: from the perspective of major psychiatricdisorders. FEBS J 2012, 279:1375–1385.
69. Plangar I, Zadori D, Klivenyi P, Toldi J, Vecsei L: Targeting the kynureninepathway-related alterations in Alzheimer’s disease: a future therapeuticstrategy. J Alzheimers Dis 2011, 24(Suppl 2):199–209.
70. Alcendor DJ, Block FE III, Cliffel DE, Daniels JS, Ellacott KL, Goodwin CR,Hofmeister LH, Li D, Markov DA, May JC, McCawley LJ, McLaughlin B,McLean JA, Niswender KD, Pensabene V, Seale KT, Sherrod SD, Sung HJ,Tabb DL, Webb DJ, Wikswo JP: Neurovascular unit on a chip: implicationsfor translational applications. Stem Cell Res Ther 2013, 4(Suppl 1):S18.
71. Burton MD, Sparkman NL, Johnson RW: Inhibition of interleukin-6trans-signaling in the brain facilitates recovery from lipopolysaccharide-induced sickness behavior. J Neuroinflammation 2011, 8:54.
72. Campbell IL, Erta M, Lim SL, Frausto R, May U, Rose-John S, Scheller J,Hidalgo J: Trans-signaling is a dominant mechanism for the pathogenicactions of interleukin-6 in the brain. J Neurosci 2014, 34:2503–2513.
73. Semple BD, Blomgren K, Gimlin K, Ferriero DM, Noble-Haeusslein LJ: Braindevelopment in rodents and humans: identifying benchmarks ofmaturation and vulnerability to injury across species. Prog Neurobiol 2013,106–107:1–16.
74. Trapero I, Cauli O: Interleukin 6 and cognitive dysfunction. Metab Brain Dis2014, 29:593–608.
doi:10.1186/s12974-014-0183-6Cite this article as: Brown et al.: Metabolic consequences of interleukin-6challenge in developing neurons and astroglia. Journal of Neuroinflammation2014 11:183.
Submit your next manuscript to BioMed Centraland take full advantage of:
• Convenient online submission
• Thorough peer review
• No space constraints or color figure charges
• Immediate publication on acceptance
• Inclusion in PubMed, CAS, Scopus and Google Scholar
• Research which is freely available for redistribution
Submit your manuscript at www.biomedcentral.com/submit