Mesoscale modeling: a study of particle generation and ... · Mesoscale modeling: a study of...
13
Mesoscale modeling: a study of particle generation and line-edge roughness Siddharth Chauhan Mark Somervell Michael Carcasi Steven Scheer Roger T. Bonnecaze Chris A. Mack C. Grant Willson
Transcript of Mesoscale modeling: a study of particle generation and ... · Mesoscale modeling: a study of...

Mesoscale modeling: a study ofparticle generation and line-edgeroughness
Siddharth ChauhanMark SomervellMichael CarcasiSteven ScheerRoger T. BonnecazeChris A. MackC. Grant Willson
Mesoscale modeling: a study of particle generation andline-edge roughness
Siddharth Chauhan,a Mark Somervell,b Michael Carcasi,b Steven Scheer,b Roger T. Bonnecaze,a Chris A. Mack,c andC. Grant Willsona,*aThe University of Texas at Austin, Department of Chemical Engineering, Austin, Texas 78712bTokyo Electron America Ltd., 2400 Grove Boulevard, Austin, Texas 78741cLithoguru.com, 1605 Watchhill Road, Austin, Texas 78703
Abstract. A lattice-type Monte Carlo–based mesoscale model and simulation of the lithography process havebeen adapted to study the insoluble particle generation that arises from statistically improbable events. Theseevents occur when there is a connected pathway of soluble material that envelops a volume of insoluble materialdue to fluctuations in the deprotection profile. The simulation shows that development erodes the insolublematerial into the developer stream and produces a cavity on the line edge that can be far larger than a singlepolymer molecule. The insoluble particles can coalesce to form aggregates that deposit on the wafer surface.The effect of the resist formulation, exposure, postexposure bake, and development variables on particle gen-eration was analyzed in both low- and high-frequency domains. It is suggested that different mechanisms aredominant for the formation of line-edge roughness (LER) at different frequencies. The simulations were used toassess the commonly proposed measures to reduce LER such as the use of low molecular weight polymers,addition of quenchers, varying acid diffusion length, etc. The simulation can be used to help set process var-iables to minimize the extent of particle generation and LER. © 2014 Society of Photo-Optical Instrumentation Engineers (SPIE)[DOI: 10.1117/1.JMM.13.1.013012]
Keywords: mesoscale modeling; particle generation; line-edge roughness; correlation length; polymer dissolution.
Paper 13105P received Jun. 27, 2013; revised manuscript received Nov. 6, 2013; accepted for publication Feb. 6, 2014; publishedonline Mar. 12, 2014.
1 IntroductionDefectivity has always been a key concern for the semicon-ductor industry. Because they lead to lost yield and thereforelost revenue, defects are constantly investigated in everymanufacturing facility in the world. Although lithographyprocesses are very clean, they are not perfect, and all havesome level of defectivity. One important class of lithographicdefects is “postdevelop defects” that are generated duringdevelopment of the photoresist. It has been proposed thatthese insoluble residues are generated by an erosion eventthat occurs when there is, generated by chance, a connectedpathway of soluble material that envelops or surrounds aninsoluble volume.1,2 Such residues or particles are inherentlyinsoluble photoresist materials that would have a tendency toredeposit on the wafer or the tools. Any drop in the pH of thesolution, like that which occurs during the rinse step, wouldaggravate the problem by further reducing the solubility ofthe particles already suspended in the solution. These statis-tical excursions of the development path during photoresistdissolution can produce a cavity on the line edge that is farlarger than the volume of a single polymer molecule.
A different but closely related problem in manufacturingis line-edge roughness (LER). The International TechnologyRoadmap for Semiconductors has outlined LER as one of themajor challenges ahead, as the critical dimension (CD) onthe integrated circuit (IC) chip is approaching moleculardimensions.3 For example, LER generates a random varia-tion in gate length (CD). These variations in CD affectthe device performance by introducing variations in threshold
voltage and on-off current. The morphology of a line edgedepends on the length scale of observation.4 Therefore, inthe recent past, the characterization of LER has been basednot only on the rms value σ (standard deviation of the lineedge), but also the spatial aspects of LER based on parametersincluding correlation length and roughness exponent. Ma et al.evaluated the impact of the individual parameters on CD varia-tion from a statistical prospective.5 They found that smallergate widths, larger correlation lengths, and smoother localedge roughness (larger roughness exponent) produce largerCD variations. The low-frequency LER produces transistorgate length variations leading to current leakage and IC timingissues, while the high-frequency LER affects dopant concen-tration profiles and interconnect wire resistance.3
Simulation studies have proven to be a time- and cost-effective approach to solving several engineering problems.Lithographic simulation and Monte Carlo techniques arenow being used throughout the industry to predict CD errorbudgets, process windows, and other important lithographicparameters. However, the subject of defectivity has largelyremained untouched by these simulations. Defectivity is astochastic process, and Monte Carlo simulations inherentlymake use of stochastics, so an attempt has been made toexploit Monte Carlo techniques to simulate particle genera-tion during the photoresist dissolution step. These simulationsalso provide valuable information about the fundamentalcauses of LER and aid in studying the convoluted variablesindividually, which is not feasible experimentally.
Mesoscale modeling is a promising simulation approachbased on molecular-level interactions and capable of
*Address all correspondence to: C. Grant Willson, E-mail: [email protected] 0091-3286/2014/$25.00 © 2014 SPIE
J. Micro/Nanolith. MEMS MOEMS 013012-1 Jan–Mar 2014 • Vol. 13(1)
J. Micro/Nanolith. MEMS MOEMS 13(1), 013012 (Jan–Mar 2014)

predicting stochastic responses such as LER. Our group hasdeveloped a three-dimensional (3-D) mesoscale model thatenables simulation of the lithographic processes includingspin-coating, postapply bake, exposure, postexposure bake(PEB), and dissolution. The stochastic variations in thedeprotection profile produced during PEB are captured bysimulating the reactive transport processes based on a newproposed transient acid diffusion mechanism.6 A mesoscale,dynamic Monte Carlo model for photoresist dissolutionbased on the molecular-level interactions between distinctcomponents of the resist and the developer has been devel-oped and used in the current study.7 These recent improve-ments in our simulator have enabled detection of volumes ofinsoluble material eroded into the developer near the lineedge during development. These advancements have alsoprovided access to valuable information about the relativecontributions of different lithographic steps to LER andthereby insight into the fundamental causes of LER.
2 Mesoscale ModelingThe present simulation work relies on mesoscale modeling1
of a model photoresist comprising copolymers of p-hydrox-ystyrene and t-butyloxycarbonyloxystyrene. A 3-D cubic lat-tice structure was created to simulate the photoresist film.Each cell in the lattice is assigned either as a monomer(where a string of connected monomer cells represents a pol-ymer chain), photoacid generator (PAG), quencher, or a void.A completely random configuration is obtained using aMonte Carlo approach with periodicity in the given direc-tion. Next, the most relevant and recently revised simulationmodules, namely PEB and dissolution, are briefly described.
2.1 Postexposure Bake
Acid diffusion in a chemically amplified resist amplifies thevariation in protection level near the interface of the exposed-unexposed region. The roughness in the protection level isbelieved to be a major contributor to the LER observedafter the dissolution step. Needless to say, an accurate aciddiffusion model is therefore critical for any LER study.Experimental results have demonstrated a fast acid diffusionfor the first ∼1 min of the PEB followed by a tremendousslowdown in subsequent acid diffusion rate.8 The reporteddiffusivity of acid in pure poly(p-hydroxystyrene) is verysmall (<10−7 cm2∕s) at typical PEB temperature andwould result in a mean diffusion length of only ∼1 nm.Postnikov proposed a reaction front propagation model toexplain the observed acid diffusion behavior.9 He postulatedthat the deprotection reaction causes local, transient enhance-ment of acid diffusivity, which results in high acid diffusionat the reaction front but this enhanced diffusivity lasts onlyfor a very short period of time. The concept of reaction-enhanced diffusivity could be explained for APEX-type248-nm resists by invoking transient free volume generationduring the deprotection reaction as the mechanism for diffu-sivity enhancement.1 Clearly, the loss of volatile productssuch as isobutylene that occurs during PEB could cause alocal and transient plasticization of the film and/or couldgenerate a transient and local volume of reduced density.Of course, this low-density condition is short lived becausethe film collapses to produce the familiar relief image that isobserved after the PEB. Unfortunately, this mechanism forthe transient enhancement of diffusivity does not apply to
methyladamantyl protected 193-nm resists where the by-product of the deprotection reaction is not volatile as it isin APEX-type 248-nm resists.
A different explanation for this phenomenon relies onheat from the exothermic deprotection reaction to elevatethe local temperature above the glass transition temperature(Tg) of the polymer, thus enhancing the acid diffusivity in alocal region.6,10 The diffusivity or permeance of a polymerfilm changes by several orders of magnitude when the localtemperature exceeds Tg. As time progresses, the heat gener-ated by the reaction diffuses away from the local region untilthe local temperature drops below Tg, thus rendering only atransient acid diffusivity enhancement. Any acid moleculethat happens to be in a volume of polymer above Tg isable to diffuse rapidly. During this diffusion, if an acid mol-ecule encounters any protected site, it can catalyze anotherdeprotection reaction and it then continues to diffuse.However, if the reaction front has moved forward andthere are no reaction sites available, the local matrix will coolbelow Tg and the acid molecule will diffuse no further.Eventually, all the acid molecules become trapped and thereaction front stops, not because of loss of chemical reactiv-ity, but because the acid catalyst is immobilized.
The temperature profile around the deprotection site wasestimated by solving the heat equation in spherical coordi-nates with an isolated heat source at the center.11 The localdiffusivity was estimated on the basis of the empirical rela-tionship between the temperature and the diffusivity.8
However, for simplicity, a binary profile for acid diffusionwas employed in which the acid is allowed to diffuse onlywhen the local temperature is above the given temperatureand below that temperature it is immobile. In order to facili-tate the computation, the present model allows an acid mol-ecule to diffuse through and share a lattice site with otherresist components. Thus, the excluded volume conditionis relaxed, a characteristic which is inherently assumed incontinuum models.
2.2 Photoresist Dissolution
At the onset of the development simulation step, a developerfilm is added to the lattice structure with lattice gridsextended into the developer film. The dissolution modelassumes that the base is readily available for deprotonationat polymer acidic sites and there is no depletion zone. Whenthe aqueous base (developer) comes in contact with the pol-ymer, deprotonation of the ionizable acidic sites causes accu-mulation of a negative charge at the polymer-developerinterface.12 The charged surface results in the depletion ofhydroxide ions near the interface, and an electric doublelayer is formed. The Poisson–Boltzmann equation and theequilibrium conditions are used to yield the ion concentra-tion at the charged surface and the corresponding fractionalsurface ionization. Thereafter, the surface is fractionally ion-ized and the dynamic equilibrium is maintained by consid-ering ionization/deionization step at the polymer–developerinterface. Polymer chain motion and chain solvation at thefilm-developer interface are simulated using the Metropolisalgorithm where the probability of a move is based on theenergetics of interactions between different species in thepolymer and the developer. Mesoscale modeling using thisapproach not only accounts for the favorable interactionbetween the ionized part of the polymer and the developer
J. Micro/Nanolith. MEMS MOEMS 013012-2 Jan–Mar 2014 • Vol. 13(1)
Chauhan et al.: Mesoscale modeling: a study of particle generation and line-edge roughness

solution to render the polymer soluble as in the critical ion-ization model,13 but also takes into account the chain con-figuration and the interactions of the nonionized part ofthe chain with the developer and the polymer film. The inter-action parameters for different species in the system werebased on experimentally determined interfacial energyvalues, and the ionized polymer-developer interactionparameter was determined by calibrating the simulated dis-solution rate response to polymer molecular weight anddeveloper concentration against measured values.14,15–17
After the photoresist dissolution is simulated for a givenperiod of time, the rinse step is simulated. The developeris replaced with water, and all of the ionized sites of polymerchains are deionized. The dangling chains are then settleddown against the lattice to reach the favored lower energeticstate. Finally, a denser film–air interface is attained withroughness at the surface. The roughness is characterizedand analyzed in a later section.
3 Insoluble Particle GenerationAn aerial image profile produces an acid gradient in theexposed resist film. During the PEB, the acid gradient resultsin a corresponding gradient in the average protection level(chemical gradient). There is a certain degree of stochasticvariation in the average blocking level. Figure 1 shows theaverage protection level (averaged over y − z plane at anygiven x) with �σ variation in the protection level at differenty along the y − z plane as a function of x-dimension of afeature. For the sake of argument, assume that the polymersolubility switch occurs at 25% protection level. The protec-tion level to the left of x ¼ a is higher than the solubilitythreshold and therefore, the resist volume is insoluble. Onthe other hand, the protection level to the right of x ¼ bis lower than the solubility threshold, implying that every-thing to the right of x ¼ b is soluble. However, there existsa solubility crossover region with a finite width d betweenx ¼ a and x ¼ b where part of the resist volume is soluble(protection level lower than threshold limit) while the rest ofit is inherently insoluble (protection level above the thresholdlimit). Solvation of each polymer chain within the solublevolume paves a path that allows the developer to penetrateand interact with the lower chain. If there exists a connected
pathway of soluble material that envelopes a volume of insol-uble material in the solubility crossover region, developmenterodes that insoluble material into the developer stream as aninsoluble particle. It is worthy to note that this analysis is asimplistic representation of the current problem. Here, varia-tion in protection level in z direction has not been considered.That is, the influence of film absorbance has been neglected.In reality, the possibility of connected pathways and the sta-tistics (size distribution, protection level, etc.) of insolubleparticles generated depend on the actual 3-D configurationof resist components and the development mechanism.Therefore 3-D mesoscale models for the PEB and dissolutionsteps discussed in earlier sections are crucial in this study.
The detection of the particles during a dissolution run isimportant and requires a suitable search algorithm. The net-work of chains in contact with the substrate defines the bulkresist film, and any group of chains detached from the resistfilm but not dissolved yet is considered as a particle. Theconnectivity between the two chains is determined by a mini-mum of one direct contact between the chains or indirectcontact through a series of chains. A simplistic but computa-tionally expensive approach for particle detection would thenbe to scan all the chains for connectivity using any standardsearch algorithm such as the breadth first search algorithm.Actually, the connectivity of only the interfacial chains, i.e.,those outer chains that are in direct contact with developer, isthe sufficient and necessary condition for no particle gener-ation. The interfacial chains are a small fraction of the totalnumber of chains and therefore considering them only cutsdown the search time considerably. The interfacial chains aretracked and updated at each Monte Carlo step and are peri-odically scanned for their connectivity through interfacialchains. If all interfacial chains are connected then there existsno particle and the particle search ends. When the interfacialchains are not all connected, then all the chains (interfacial aswell as bulk chains) must be scanned for their connectivity toidentify the particle. This step is computationally expensivebut rare and thus the costly redundancy of scanning allthe chains each time is avoided. Finally, particle details arerecorded and the particle is removed from the lattice structurefor the rest of the simulation.
Fig. 1 The average protection level is shown with a solid line (averaged over y − z plane at any given x ).The dotted lines show the limits of one standard deviation in the protection level at different y along they − z plane as a function of the x -dimension.
J. Micro/Nanolith. MEMS MOEMS 013012-3 Jan–Mar 2014 • Vol. 13(1)
Chauhan et al.: Mesoscale modeling: a study of particle generation and line-edge roughness

Once a particle has been generated, it can settle on thetooling, on the wafer, be rinsed away during the rinsing proc-ess, or dissolve in developer. Investigating the fate of the par-ticles requires longer tracking and is beyond the scope of thecurrent work. Figure 2(a) shows the size distribution of theparticles generated during a photoresist dissolution run basedon the typical simulation inputs outlined in the next section.Here, particle size is actually the number of polymer chainsin the particle. As expected, there is a large number of smallparticles and fewer big particles. To give some prospective tothe volume, a single chain occupies ∼27 nm3 in the simula-tion lattice structure. Once a simulation run is over, differentstatistics can be employed to do a postanalysis of the particlegeneration study. The total number of particles, averageblocking of the particles, the number average size of the par-ticles, and volume percentage of particles generated areshown in Fig. 2(a). For the purposes of this paper, the metricused to quantify particle generation is the volume percentageof the insoluble particles in the total resist volume dissolved.Figure 2(b) shows a snapshot of the dissolution run showingthe particles generated.
The following configuration setup is used for the particlegeneration study: a film of APEX type resist with dimensionsof 130 × 250 × 100 nm (half pitch × line length × filmthickness) was simulated using a 184 × 356 × 144 latticestructure with periodic boundary conditions only along theline length. The following resist formulation and processconditions, unless otherwise specified, were used in the par-ticle generation study. The resist that was simulated is for-mulated from a polymer with degree of polymerization of80, 60% protection level, pKa of 10.25, 5 wt. % PAG load-ing, and 20% quencher loading (relative to PAG concentra-tion). The exposure conditions involve normalized image logslope (NILS) equals to 2.41, dose to size with Dill C param-eter as 0.03 cm2∕mJ, and the image in resist using PROLITHfor typical KrF resist. The PEB time and the temperaturewere 60 s and 90°C, respectively. A development time of30 s with standard 0.26 N developer concentration was usedin the development step. Typical results reported are anaverage of 10 simulation runs. Next, the parametric studyis presented for polymer formulation (molecular weight,
protection level), exposure (dose, NILS), PEB (PAG/quencher loading, PEB time), and development (developerconcentration, polymer hydrophilicity).
3.1 Polymer Formulation
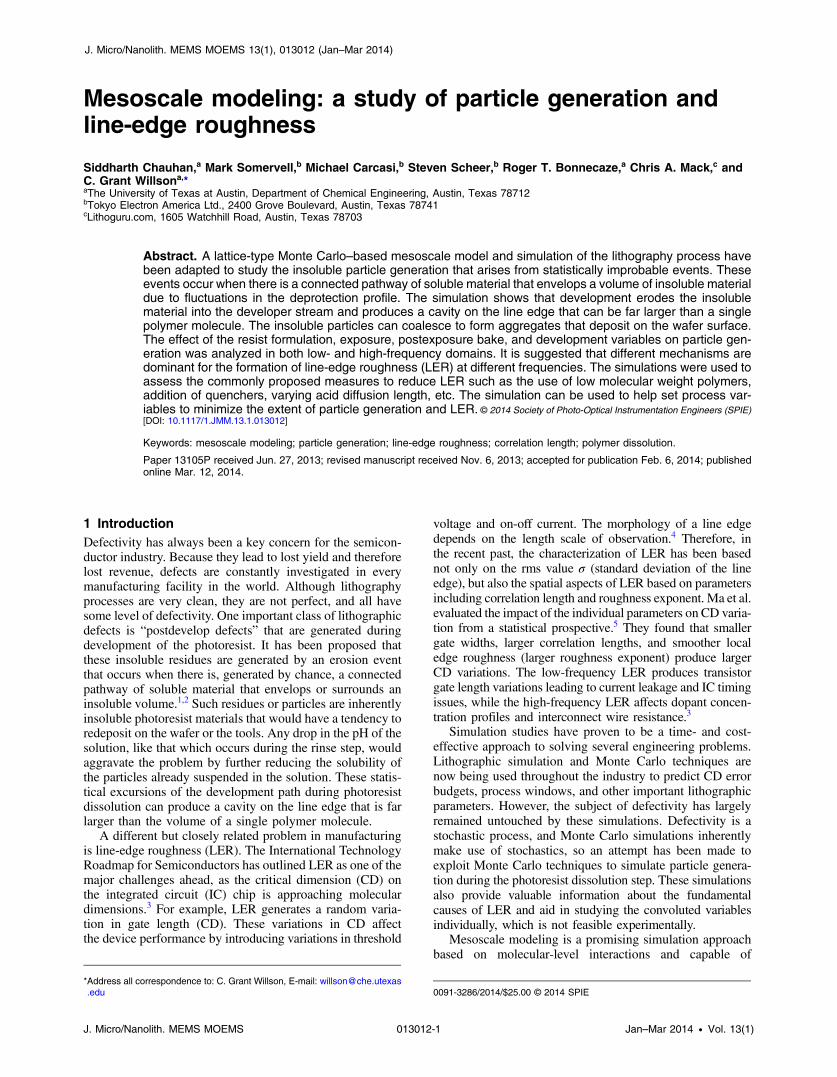
Figures 3(a) and 3(b) quantify the particle generation for aresist polymer as a function of degree of polymerization andcomposition. The results indicate that the volume percentageof insoluble particles decreases with increasing polymermolecular weight. The higher molecular weight enhances theextent of chain entanglement in the polymer matrix and theincreased entanglement makes the erosion phenomenonless probable, thereby producing fewer insoluble particles.Figure 3(b) shows that the particle generation first increasesand then decreases with an increase in the initial protectionlevel of the polymer. The further the polymer composition isfrom the solubility switch protection level, the higher thepossibility is of finding an insoluble volume in the solubilitycrossover region. The solubility switch for APEX resistsoccurs below 30% protection level under normal develop-ment conditions, so there is an increase in particle generationas protection level initially increases above 30%. However,the particle generation process depends not only on the exist-ence of an insoluble volume but also on the existence ofa connected pathway of soluble material surrounding theparticle to “erode” the particle from the bulk. The furtherincrease in the protection level reduces the developer pen-etration significantly and thus suppresses particle generation.Therefore, there exists a range of protection levels where theparticle generation is at a maximum. Ideally, the resist shouldbe formulated with a polymer protection level outside of thatrange, depending on other process constraints.
3.2 Exposure
Figures 4(a) and 4(b) show the particle formation as a func-tion of the NILS of the aerial image and the exposure dose.An aerial image with a higher NILS produces a steeperchemical gradient, narrowing the solubility switch crossoverregion, which results in a lower insoluble particle generation.The higher dose increases the acid concentration and
Fig. 2 (a) Particle size distribution for a typical simulation case (average of 10 runs), where the number ofpolymer chains corresponds to the particle size. Also shown is the postanalysis data that can be obtainedafter the simulation run. (b) A snapshot of one of the simulation runs showing the insoluble particlesgenerated during the photoresist dissolution.
J. Micro/Nanolith. MEMS MOEMS 013012-4 Jan–Mar 2014 • Vol. 13(1)
Chauhan et al.: Mesoscale modeling: a study of particle generation and line-edge roughness
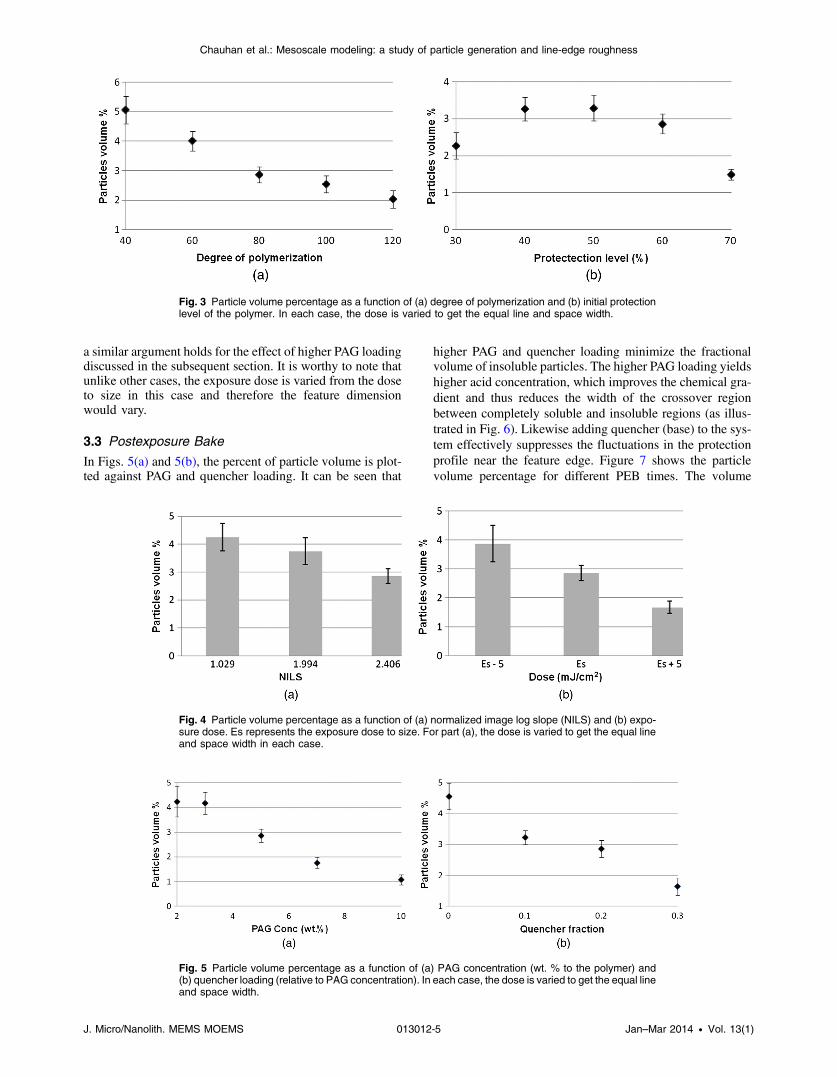
a similar argument holds for the effect of higher PAG loadingdiscussed in the subsequent section. It is worthy to note thatunlike other cases, the exposure dose is varied from the doseto size in this case and therefore the feature dimensionwould vary.
3.3 Postexposure Bake
In Figs. 5(a) and 5(b), the percent of particle volume is plot-ted against PAG and quencher loading. It can be seen that
higher PAG and quencher loading minimize the fractionalvolume of insoluble particles. The higher PAG loading yieldshigher acid concentration, which improves the chemical gra-dient and thus reduces the width of the crossover regionbetween completely soluble and insoluble regions (as illus-trated in Fig. 6). Likewise adding quencher (base) to the sys-tem effectively suppresses the fluctuations in the protectionprofile near the feature edge. Figure 7 shows the particlevolume percentage for different PEB times. The volume
Fig. 3 Particle volume percentage as a function of (a) degree of polymerization and (b) initial protectionlevel of the polymer. In each case, the dose is varied to get the equal line and space width.
Fig. 4 Particle volume percentage as a function of (a) normalized image log slope (NILS) and (b) expo-sure dose. Es represents the exposure dose to size. For part (a), the dose is varied to get the equal lineand space width in each case.
Fig. 5 Particle volume percentage as a function of (a) PAG concentration (wt. % to the polymer) and(b) quencher loading (relative to PAG concentration). In each case, the dose is varied to get the equal lineand space width.
J. Micro/Nanolith. MEMS MOEMS 013012-5 Jan–Mar 2014 • Vol. 13(1)
Chauhan et al.: Mesoscale modeling: a study of particle generation and line-edge roughness
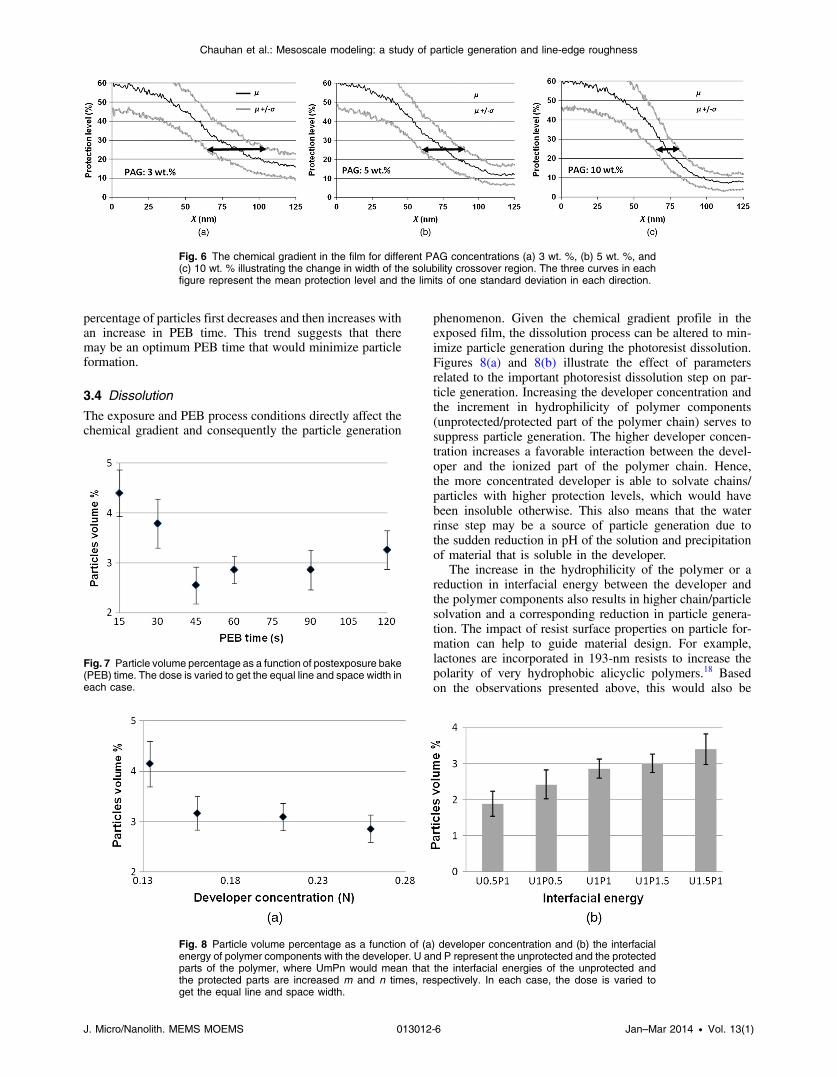
percentage of particles first decreases and then increases withan increase in PEB time. This trend suggests that theremay be an optimum PEB time that would minimize particleformation.
3.4 Dissolution
The exposure and PEB process conditions directly affect thechemical gradient and consequently the particle generation
phenomenon. Given the chemical gradient profile in theexposed film, the dissolution process can be altered to min-imize particle generation during the photoresist dissolution.Figures 8(a) and 8(b) illustrate the effect of parametersrelated to the important photoresist dissolution step on par-ticle generation. Increasing the developer concentration andthe increment in hydrophilicity of polymer components(unprotected/protected part of the polymer chain) serves tosuppress particle generation. The higher developer concen-tration increases a favorable interaction between the devel-oper and the ionized part of the polymer chain. Hence,the more concentrated developer is able to solvate chains/particles with higher protection levels, which would havebeen insoluble otherwise. This also means that the waterrinse step may be a source of particle generation due tothe sudden reduction in pH of the solution and precipitationof material that is soluble in the developer.
The increase in the hydrophilicity of the polymer or areduction in interfacial energy between the developer andthe polymer components also results in higher chain/particlesolvation and a corresponding reduction in particle genera-tion. The impact of resist surface properties on particle for-mation can help to guide material design. For example,lactones are incorporated in 193-nm resists to increase thepolarity of very hydrophobic alicyclic polymers.18 Basedon the observations presented above, this would also be
Fig. 6 The chemical gradient in the film for different PAG concentrations (a) 3 wt. %, (b) 5 wt. %, and(c) 10 wt. % illustrating the change in width of the solubility crossover region. The three curves in eachfigure represent the mean protection level and the limits of one standard deviation in each direction.
Fig. 7 Particle volume percentage as a function of postexposure bake(PEB) time. The dose is varied to get the equal line and space width ineach case.
Fig. 8 Particle volume percentage as a function of (a) developer concentration and (b) the interfacialenergy of polymer components with the developer. U and P represent the unprotected and the protectedparts of the polymer, where UmPn would mean that the interfacial energies of the unprotected andthe protected parts are increased m and n times, respectively. In each case, the dose is varied toget the equal line and space width.
J. Micro/Nanolith. MEMS MOEMS 013012-6 Jan–Mar 2014 • Vol. 13(1)
Chauhan et al.: Mesoscale modeling: a study of particle generation and line-edge roughness

expected to assist in suppressing the particle generation.However, increased hydrophilicity may result in polymerswelling and poor patterning due to the low solubility con-trast. Therefore, the optimal hydrophilicity of polymer com-ponents is, like most things in resist design, a trade-off.
4 Line Edge RoughnessLER characterization using only the standard deviation of theline edge neglects the spatial distribution of roughness alongthe edge. The quantification of the spectral aspects of LERrequires the set of three parameters, namely sigma value σ,correlation length Lc, and roughness exponent α. The sigmavalue is the standard deviation of the line edge and com-monly reported as LER. The correlation length representsthe length scale after which the line edges are uncorrelated.Also, the roughness exponent is indicative of the relativecontribution of high-frequency fluctuations to LER. Thelower the value of roughness exponent, the higher the con-tribution from high-frequency fluctuations. The power spec-tral density (PSD) function is generally employed to examinethe frequency content of roughness and is the edge varianceper unit spatial frequency. Mathematically, it is evaluated asthe square of the modulus of the Fourier transform of the lineedge divided by the normalization factor equal (or propor-tional) to the length of the measured line. Figure 9 showsa schematic plot of the PSD function. It shows that the dis-tribution of the magnitude of LER variance as a function ofspatial frequency with the area under the PSD curve equalsthe square of the sigma value. The correlation length corre-sponds to the frequency around which the PSD curve has theonset of the downward slope. For the length scale higher thanthe correlation length, i.e., in the low-frequency region, therandom noise is uncorrelated. However below the correlationlength Lc, i.e., at higher frequencies, the roughness is corre-lated and the slope of the PSD curve is dependent on theroughness exponent. The following function can be usedto fit the PSD curve to extract the relevant parameters:
psdðfÞpsdð0Þ ¼
1
1þ ð2π · fLcÞ1þ2α þ B; (1)
where f is the spatial frequency and B is added to account forany white noise.19–25 The roughness sigma value can beobtained either by determining the area under the PSDcurve or directly evaluating the standard deviation of theline edge. Different mechanisms contribute to the formation
of LER, including inhomogeneity of the resist components,illumination optics, reaction coupled diffusion during PEB,and polymer dissolution. In principle, each mechanismshould have a different LER response and the PSD analysiscould be used to assess the relative contribution of differentlithographic steps in low-/high-frequency domain. It is wor-thy to note that in the current study, LER reflects the edgeroughness only from the prospective of lithographic steps.Subsequent steps, like etch, may have been shown tohave an effect on LER, correlation length, and roughnessexponent.26
A film of APEX type resist with dimensions of 65×500 × 100 nm [X-, Y-, Z-dimensions in Fig. 10(a)] wassimulated using a 92 × 712 × 144 lattice structure with peri-odic boundary conditions in X- and Y-directions. The choiceof the dimensions is directed to capture the low-frequencyaspects of LER in Y-dimension. The resist that was simulatedis formulated from a polymer with degree of polymerizationof 80, pKa of 10.25, and 5 t. % PAG loading. The PEB timeand the temperature were 60 s and 90°C, respectively. Adevelopment time of 15 s with standard 0.26 N developerconcentration was used in the development step. Any pat-terned line after the dissolution step would have a sidewallangle depending on the various processing steps involved.The calculation of LER is therefore highly dependent on thechoice of the XY plane for determining the line edge.Therefore, an open frame development is used in the disso-lution step and the roughness is evaluated as the film thick-ness variation in the Z-direction along the Y-direction atdifferent X values. Figure 10(b) shows the film thicknessvariation roughness along the Y-direction at three X values.The final PSD curve reported is an average of PSD curvesobtained at different X values from 20 simulation runs. Inaddition to PEB and the development step, the aerial andresist image profile also affects the LER. To eliminate anycontribution from the optics to the roughness, a step profileof an acid concentration is used in the PEB step. Any PAGwithin the given top section of the film is converted to acid,effectively simulating the exposure with NILS equals toinfinity.
4.1 Dissolution
This section examines the characteristics of the roughnessdue to the dissolution of homopolymer (unprotected or par-tially protected). Figures 11(a) and 11(b) show the PSDcurves and fitted parameters of roughness due to the disso-lution of unprotected polymer for the different dissolutiontimes depicting the dynamic behavior of roughness. One cansee that the roughness sigma value (area under the PSDcurve) rapidly increases as the time progresses and theroughness increases in the entire (low/high) frequencydomain. Also, the correlation length increases fast with timeas shown by the left shift of the onset frequency for corre-lated roughness in Fig. 11(a). Both the roughness and thecorrelation length finally saturate in ∼1 s and do notshow much increase after that. However, this saturationcould be the artifact of the finite length of the line (500 nmin this case) simulated. The length of the line examinedshould be more than six to 10 times the correlation lengthto get the stable roughness sigma value.27 After the initialgrowth, the roughness exponent remains similar, implying that
Fig. 9 Schematic plot of PSD function for line-edge roughness illus-trating the characterization parameters, namely sigma value σ, corre-lation length Lc, and roughness exponent α.
J. Micro/Nanolith. MEMS MOEMS 013012-7 Jan–Mar 2014 • Vol. 13(1)
Chauhan et al.: Mesoscale modeling: a study of particle generation and line-edge roughness

the underlying mechanism of roughness formation remainsunchanged with time for uniform polymer configuration.
Figure 12 shows the PSD curves and fitted parameters ofroughness due to the dissolution of 10% protected polymersof different molecular weights. The roughness increases withthe polymer molecular weight throughout the frequencydomain. On the other hand, the roughness exponent forthe dissolution process remains similar for different polymermolecular weights. Similar analysis for the roughness due tothe dissolution of polymers with protection level rangingfrom 0% to 15% has shown the same behavior, i.e., theroughness sigma value increases with an increase in protec-tion level but the roughness exponent remains similar.
4.2 PEB and Dissolution
This section examines the characteristics of the roughness ofpolymer with both the PEB and the dissolution as the
underlying mechanisms for roughness formation. Unlikethe previous section, the inclusion of PEB step results in non-uniform polymer protection level with the film depth.Figures 13(a) and 13(b) show the PSD curves and the fittedparameters of roughness for polymers of different molecularweights when both PEB and subsequent dissolution steps aretaken into account. There are several distinctions that can bepointed out when comparing Fig. 13 with earlier Fig. 12where only polymer dissolution is considered. First, thereis a considerable reduction in correlation length as seenby the right shift of the onset frequency for correlated rough-ness shown by the arrow pointing right. Second, unlike thecase with only polymer dissolution, here the roughnessexponent decreases with the increase in polymer molecularweight. Third, the roughness sigma value does not varymuch with the change in polymer molecular weight. Thedependency of roughness exponent on the polymer molecu-lar weight results in crossing of PSD curves at a certain
Fig. 10 (a) Simulated film configuration and (b) film thickness variations along Y -direction for three differ-ent X values.
Fig. 11 (a) PSD curves and (b) fitted parameters of roughness (sigma value, correlation length, androughness exponent) of unprotected polymer for the different dissolution times. The sigma, the corre-lation length, and the roughness exponent are normalized with the values at 0.2 s dissolution time, i.e.,1.7 nm, 5.4 nm, and 0.28, respectively.
J. Micro/Nanolith. MEMS MOEMS 013012-8 Jan–Mar 2014 • Vol. 13(1)
Chauhan et al.: Mesoscale modeling: a study of particle generation and line-edge roughness
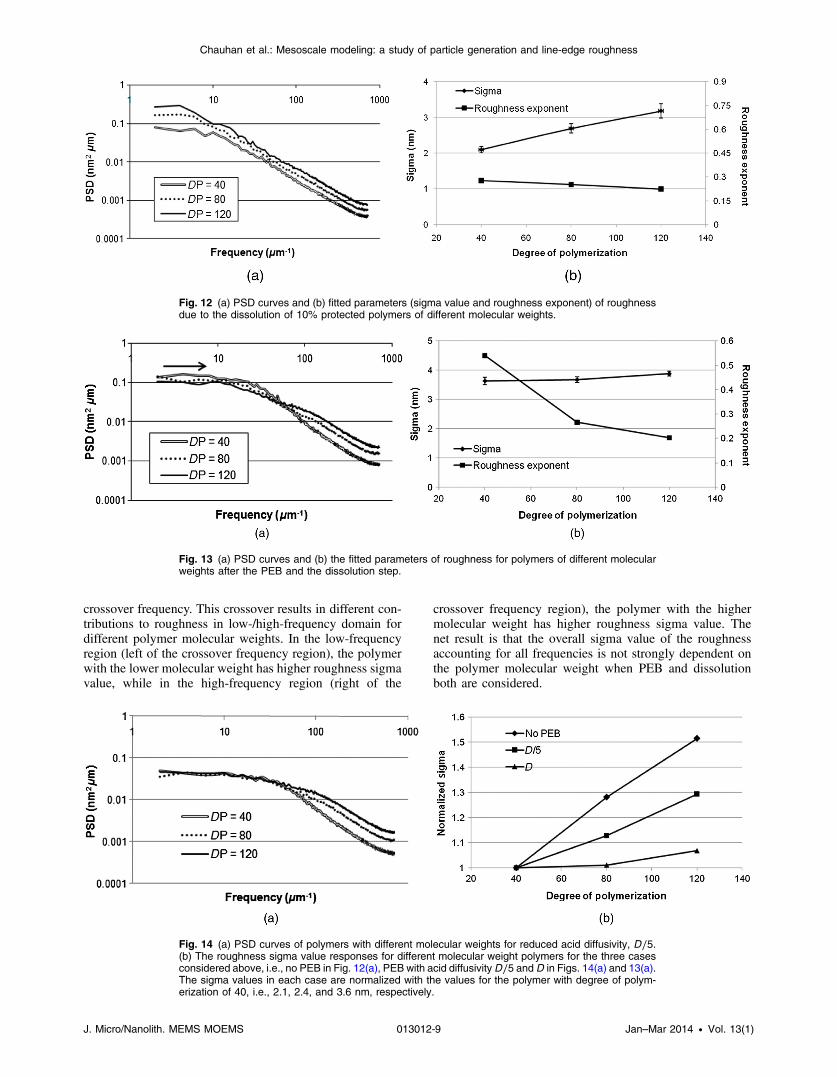
crossover frequency. This crossover results in different con-tributions to roughness in low-/high-frequency domain fordifferent polymer molecular weights. In the low-frequencyregion (left of the crossover frequency region), the polymerwith the lower molecular weight has higher roughness sigmavalue, while in the high-frequency region (right of the
crossover frequency region), the polymer with the highermolecular weight has higher roughness sigma value. Thenet result is that the overall sigma value of the roughnessaccounting for all frequencies is not strongly dependent onthe polymer molecular weight when PEB and dissolutionboth are considered.
Fig. 12 (a) PSD curves and (b) fitted parameters (sigma value and roughness exponent) of roughnessdue to the dissolution of 10% protected polymers of different molecular weights.
Fig. 13 (a) PSD curves and (b) the fitted parameters of roughness for polymers of different molecularweights after the PEB and the dissolution step.
Fig. 14 (a) PSD curves of polymers with different molecular weights for reduced acid diffusivity, D∕5.(b) The roughness sigma value responses for different molecular weight polymers for the three casesconsidered above, i.e., no PEB in Fig. 12(a), PEB with acid diffusivityD∕5 and D in Figs. 14(a) and 13(a).The sigma values in each case are normalized with the values for the polymer with degree of polym-erization of 40, i.e., 2.1, 2.4, and 3.6 nm, respectively.
J. Micro/Nanolith. MEMS MOEMS 013012-9 Jan–Mar 2014 • Vol. 13(1)
Chauhan et al.: Mesoscale modeling: a study of particle generation and line-edge roughness

The difference in the two cases compared in Figs. 12(a)and 13(a) is due to the different roughness responses to thepolymer molecular weights in low-frequency region. In thehigh-frequency region, the higher molecular weight polymerhas higher sigma value in both the cases and therefore onecan argue that the dissolution is the dominant mechanism inhigh-frequency region and the dissolution results in a lowerroughness sigma value with smaller polymer size or radius ofgyration. On the other hand, the different roughnessresponses in the low-frequency region due to the introductionof PEB in the latter case suggests that the underlying noisedue to the acid diffusion during PEB is the dominant con-tributor to the low-frequency roughness and it is the PEBthat results in higher roughness sigma at the lower polymermolecular weights.
Polymer dissolution (without PEB) can be considered asthe extreme case of polymer dissolution (with PEB) as theacid diffusion approaches zero. Therefore, the roughnessresponse to the polymer molecular weight could be con-trolled by altering the acid diffusion. Figure 14(a) shows thePSD curves of polymers with the different molecular weightsfor reduced acid diffusivity. The reduction in acid diffusionresults in the molecular weight response with the negligibledifference in the low-frequency region and the similarresponse as observed for earlier cases in the high-frequency
domain. Figure 14(b) summarizes the roughness sigma valueresponse for different molecular weight polymers for differ-ent cases considered above in Figs. 12(a), 13(a), and 14(a).The sensitivity of roughness sigma value to polymer molecu-lar weight is the most for the purely dissolution case. How-ever, as the acid diffusion increases, the roughness sigmavalue becomes less sensitive to polymer molecular weightfor the range of diffusivities examined in the current study.This analysis suggests that the role of polymer molecularweight with respect to the LER is contingent on the extentof acid diffusion. At low acid diffusion, the dominant mecha-nism for LER generation is dissolution and lower polymermolecular weight would result in lower LER. With higheracid diffusion and PEB as the dominant mechanism, thelower polymer molecular weight produces the same oreven higher LER. This result could be particularly relevantto the molecular glass community,” where significant efforthas been focused on the use of lower molecular weight poly-mer materials as a means to reduce LER.
The other commonly proposed measures for reducingLER, namely low acid diffusivity and the use of quenchers,were assessed (keeping the polymer molecular weight con-stant at a degree of polymerization of 80). Figures 15(a) and15(b) show the PSD curves and the fitted parameters ofroughness for different amount of acid diffusions. The
Fig. 15 (a) PSD curves and (b) the fitted parameters of roughness (sigma value and correlation length)for different amounts of acid diffusions during the PEB. The sigma and the correlation length arenormalized with the values at normal acid diffusivity (D), i.e., 3.7 and 7.2 nm, respectively.
Fig. 16 (a) PSD curves and (b) the fitted parameters of roughness (sigma value and correlation length)quantifying the effect of quencher loading (relative to PAG moles) on the roughness. The sigma and thecorrelation length are normalized with the values at 0% quencher loading, i.e., 3.7 and 7.2 nm,respectively.
J. Micro/Nanolith. MEMS MOEMS 013012-10 Jan–Mar 2014 • Vol. 13(1)
Chauhan et al.: Mesoscale modeling: a study of particle generation and line-edge roughness

roughness sigma value decreases with the lower acid diffu-sion and the reduction mainly occurs in low frequency. Also,the correlation length decreases with the lower acid diffu-sion. Figures 16(a) and 16(b) show the PSD curves andthe fitted parameters of roughness quantifying the effectof adding quenchers on the roughness. Similar to loweracid diffusivity, the addition of quenchers also reduces theroughness sigma value predominantly in the low-frequencyregion. The correlation length shows the same trend. Theseobservations further support the claim that the underlyingnoise due to the PEB step mainly contributes to low-frequency roughness.
5 ConclusionsA mesoscale model has been adapted to study particle gen-eration during photoresist dissolution. New PEB and disso-lution models have been incorporated that allow explorationof statistical excursions in the development path due tovariance around the mean protection level. Particles aregenerated during photoresist dissolution when there is a con-nected pathway of soluble material that envelops a volumean insoluble material. An extensive parametric study wasdone to assess the extent of particle generation as a functionof polymer formulation (molecular weight, protection level),exposure (dose, NILS), PEB (PAG/quencher loading, PEBtime), and development (developer concentration, polymerhydrophilicity). The relative contributions of the PEB andthe dissolution steps to LER in the low-/high-frequencydomain have also been investigated. Dissolution predomi-nantly affects the high-frequency roughness while thePEB has the greatest impact on LER in the low-frequencydomain. The commonly proposed measures to reduce LERsuch as the use of low molecular weight polymers, additionof quenchers, varying acid diffusion length, etc., wereassessed. This study can provide a means to guide materialdesign and optimize process conditions to minimize particlegeneration and LER.
AcknowledgmentsThe authors wish to thank the Tokyo Electron Limited (TEL)for funding this work; Texas Advanced Computing Center(TACC) at the University of Texas at Austin for providingcomputing resources; DuPont for generous donations ofmaterials; Dr. Vishwanath H. Dalvi and theWillson ResearchGroup for advice and useful discussions.
References
1. G. M. Schmid, “Understanding molecular scale effects during photore-sist processing,” Ph.D. Thesis, University of Texas, Austin (2003).
2. J. E. Meiring et al., “Using mesoscale simulation to explore photoresistline edge roughness,” Proc. SPIE 5753, 350–360 (2005).
3. International Technology Roadmap for Semiconductors (ITRS) officialwebsite, http://www.itrs.net/.
4. J.-Y. Lee et al., “Effect of line edge roughness (LER) and line widthroughness (LWR) on sub-100 nm device performance,” Proc. SPIE5376, 426–433 (2004).
5. Y. Ma, H. J. Levinson, and T. Wallow, “Line edge roughness impact oncritical dimension variation,” Proc. SPIE 6518, 651824 (2007).
6. M. Carcasi et al., “Extension of 248 nmMonte Carlo, mesoscale modelsto 193 nm platforms,” Proc. SPIE 7639, 76392K (2010).
7. S. Chauhan et al., “Polymer dissolution model: an energy adaptation ofthe critical ionization theory,” Proc. SPIE 7273, 727336 (2009).
8. M. D. Stewart, “Catalyst diffusion in positive-tone chemically amplifiedphotoresists, Ph.D. Thesis, University of Texas, Austin (2003).
9. S. V. Postnikov, “Transport properties of photogenerated acid andsilylating agent in polymer films,” Ph.D. Thesis, University of Texas,Austin (1999).
10. A. Reiser et al., “The molecular mechanism of novolak-diazonaphtho-quinone resists,” Eur. Polym. J. 38(4), 619–629 (2002).
11. M. N. Ozisik, Heat Conduction, 3rd ed., Wiley (1993).12. G. M. Schmid et al., “Electrostatic effects during dissolution of
positive tone photoresists,” J. Vac. Sci. Technol., B 20(6), 2913–2919(2002).
13. P. C. Tsiartas et al., “Mechanism of phenolic polymer dissolution,”Macromolecules 30(16), 4656–4664 (1997).
14. L. W. Flanagin et al., “Probabilistic model for the mechanism of phe-nolic polymer dissolution,” Proc. SPIE 3333, 268–277 (1998).
15. M. E. Colburn, “Step and flash imprint lithography: a low-pressure,room-temperature nanoimprint lithography,” Ph.D. Thesis, Universityof Texas, Austin (2001).
16. C. J. Van Oss, R. J. Good, and M. K. Chaudhury, “Additive and non-additive surface tension components and the interpretation of contactangles,” Langmuir 4(4), 884–891 (1988).
17. J. N. Israelachvili, Intermolecular and Surface Forces: WithApplications to Colloidal and Biological Systems, p. 296, AcademicPress, London (1985).
18. H. Ito, H. D. Truong, and P. J. Brock, “Lactones in 193 nm resists: whatdo they do?,” Proc. SPIE 6923, 692318 (2008).
19. C. Mack, “Stochastic modeling in lithography: autocorrelation behaviorof catalytic reaction-diffusion systems,” J. Micro/Nanolithogr., MEMS,MOEMS 8(2), 029701 (2009).
20. C. Mack, “Stochastic modeling in lithography: use of dynamical scalingin photoresist development,” J. Micro/Nanolithogr., MEMS, MOEMS8(3), 033001 (2009).
21. W. G. Lawrence, “Spatial frequency analysis of line edge roughnessin nine chemically related photoresists,” Proc. SPIE 5039, 713–724(2003).
22. A. Philippou, T. Mülders, and E. Schöll, “Impact of photoresist com-position and polymer chain length on line edge roughness probed witha stochastic simulator,” J. Micro/Nanolithogr., MEMS, MOEMS 6(4),043005 (2007).
23. A. Pawloski et al., “Line edge roughness and intrinsic bias for twomethacrylate polymer resist systems,” J. Microlithogr., Microfabr.,Microsyst. 5(2), 023001 (2006).
24. V. Constantoudis et al., “Line edge roughness and critical dimensionvariation: fractal characterization and comparison using model func-tions,” J. Vac. Sci. Technol., B 22(4), 1974–1981 (2004).
25. G. Lorusso et al., “Spectral analysis of line width roughness and itsapplication to immersion lithography,” J. Microlithogr., Microfabr.,Microsyst. 5(3), 033003 (2006).
26. V. Constantoudis et al., “Line-edge-roughness transfer during plasmaetching: modeling approaches and comparison with experimentalresults,” J. Micro/Nanolithogr., MEMS, MOEMS 8(4), 043004 (2009).
27. V. Constantoudis, G. Patsis, and E. Gogolides, “Photoresist line-edgeroughness analysis using scaling concepts,” J. Microlithogr.Microfabr., Microsyst. 3, 429–435 (2004).
Siddharth Chauhan received his BTech in chemical engineeringfrom IIT Kanpur, India, in 2005 and PhD in chemical engineeringfrom the University of Texas at Austin in 2010. He joined Intel Corpo-ration in 2011 in Assembly and Test Technology Development and iscurrently a member of Computational Lithography Technology.
Mark Somervell received his BChE in chemical engineering fromthe Georgia Institute of Technology in 1996 and his MS and PhDfrom the University of Texas at Austin in 1998 and 2000, respectively.He worked as a member of technical staff in the Silicon TechnologyDevelopment Group for Texas Instruments and now works as amember of technical staff within the Advanced Technology Groupat Tokyo Electron America.
Michael Carcasi received his BS in chemical engineering from theUniversity of Texas at Austin in 1997. He joined Tokyo Electron in1998. He is currently a senior research scientist in Tokyo Electron’sAdvanced Technology Group.
Steven Scheer received his BS in chemical engineering from the Mis-souri University of Science and Technology in 1997 and MS and PhDin chemical engineering from the University of Texas at Austin in 2001and 2002, respectively. He worked at IBM Microelectronics from 2002to 2005, then he joined Tokyo Electron Ltd. and formed the Lithogra-phy Advanced Technology Group based in Austin, Texas.
Roger T. Bonnecaze received his BS in chemical engineering fromCornell University in 1985 and his MS and PhD from the CaliforniaInstitute of Technology in 1987 and 1991, respectively. He served asa postdoctoral research fellow at the University of Cambridge from1991 to 1992. He joined the faculty of the Department of ChemicalEngineering at the University of Texas at Austin in 1998.
J. Micro/Nanolith. MEMS MOEMS 013012-11 Jan–Mar 2014 • Vol. 13(1)
Chauhan et al.: Mesoscale modeling: a study of particle generation and line-edge roughness

Chris A. Mack received his BS in physics, chemistry, electrical, andchemical engineering from Rose-Hulman Institute of Technology in1982, his MS in electrical engineering from the University ofMaryland in 1989, and his PhD in chemical engineering from theUniversity of Texas at Austin in 1998. After working in FINLETechnologies and KLA-Tencor, he currently writes, teaches, andconsults in the field of semiconductor lithography.
C. Grant Willson received his BS and PhD in organic chemistryfrom the University of California at Berkeley and his MS in organicchemistry from San Diego State University. He joined the facultiesof the Departments of Chemical Engineering and Chemistry at theUniversity of Texas at Austin in 1993 after holding a position as anIBM fellow and manager of the Polymer Science and Technologyarea at the IBM Almaden Research Center in San Jose, California.
J. Micro/Nanolith. MEMS MOEMS 013012-12 Jan–Mar 2014 • Vol. 13(1)
Chauhan et al.: Mesoscale modeling: a study of particle generation and line-edge roughness