Merging Inhomogeneous Proximity Sensor Systems for Social ...
14
Merging Inhomogeneous Proximity Sensor Systems for Social Network Analysis Amir Muaremi 1(B ) , Franz Gravenhorst 1 , Julia Seiter 1 , Agon Bexheti 2 , Bert Arnrich 3 , and Gerhard Tr¨ oster 1 1 Wearable Computing Lab, ETH Zurich, Gloriastrasse 35, 8092 Zurich, Switzerland {muaremi,gravenhorst,seiter,troester}@ife.ee.ethz.ch 2 Artificial Intelligence Laboratory, EPFL, 1015 Lausanne, Switzerland [email protected] 3 Computer Engineering Department, Bogazi¸ci University, 34342 Istanbul, Turkey [email protected] Abstract. Proximity information is a valuable source for social network analysis. Smartphone based sensors, like GPS, Bluetooth and ANT+, can be used to obtain proximity information between individuals within a group. However, in real-life scenarios, different people use different devices, featuring different sensor modalities. To draw the most com- plete picture of the spatial proximities between individuals, it is advan- tageous to merge data from an inhomogeneous system into one common representation. In this work we describe strategies how to merge data from Bluetooth sensors with data from ANT+ sensors. Interconnection between both systems is achieved using pre-knowledge about social rules and additional infrastructure. Proposed methods are applied to a data collection from 41 participants during an 8 day pilgrimage. Data from peer-to-peer sensors as well as GPS sensors is collected. The merging steps are evaluated by calculating state-of-the art features from social network analysis. Results indicate that the merging steps improve the completeness of the obtained network information while not altering the morphology of the network. Keywords: Proximity · Smartphones · Bluetooth · ANT+ · Pilgrims 1 Introduction and Motivation 1.1 Social Networks Based on Proximity Data Social networks are omnipresent and an essential part of many peoples’ lives. Social scientists have introduced social network analysis (SNA) methods to bet- ter understand and interpret relationships between individuals. They are an important tool to understand individual and group behavior within communi- ties or crowds. This kind of information is not only beneficial for intelligence services but can also be used to improve the security or well-being of individuals at crowd events as well as to improve individualized advertisement campaigns. c Institute for Computer Sciences, Social Informatics and Telecommunications Engineering 2014 I. Stojmenovic et al. (Eds.): MOBIQUITOUS 2013, LNICST 131, pp. 181–194, 2014. DOI: 10.1007/978-3-319-11569-6 15
Transcript of Merging Inhomogeneous Proximity Sensor Systems for Social ...

Merging Inhomogeneous Proximity SensorSystems for Social Network Analysis
Amir Muaremi1(B), Franz Gravenhorst1, Julia Seiter1, Agon Bexheti2,Bert Arnrich3, and Gerhard Troster1
1 Wearable Computing Lab, ETH Zurich, Gloriastrasse 35, 8092 Zurich, Switzerland{muaremi,gravenhorst,seiter,troester}@ife.ee.ethz.ch
2 Artificial Intelligence Laboratory, EPFL, 1015 Lausanne, [email protected]
3 Computer Engineering Department, Bogazici University, 34342 Istanbul, [email protected]
Abstract. Proximity information is a valuable source for social networkanalysis. Smartphone based sensors, like GPS, Bluetooth and ANT+,can be used to obtain proximity information between individuals withina group. However, in real-life scenarios, different people use differentdevices, featuring different sensor modalities. To draw the most com-plete picture of the spatial proximities between individuals, it is advan-tageous to merge data from an inhomogeneous system into one commonrepresentation. In this work we describe strategies how to merge datafrom Bluetooth sensors with data from ANT+ sensors. Interconnectionbetween both systems is achieved using pre-knowledge about social rulesand additional infrastructure. Proposed methods are applied to a datacollection from 41 participants during an 8 day pilgrimage. Data frompeer-to-peer sensors as well as GPS sensors is collected. The mergingsteps are evaluated by calculating state-of-the art features from socialnetwork analysis. Results indicate that the merging steps improve thecompleteness of the obtained network information while not altering themorphology of the network.
Keywords: Proximity · Smartphones · Bluetooth · ANT+ · Pilgrims
1 Introduction and Motivation
1.1 Social Networks Based on Proximity Data
Social networks are omnipresent and an essential part of many peoples’ lives.Social scientists have introduced social network analysis (SNA) methods to bet-ter understand and interpret relationships between individuals. They are animportant tool to understand individual and group behavior within communi-ties or crowds. This kind of information is not only beneficial for intelligenceservices but can also be used to improve the security or well-being of individualsat crowd events as well as to improve individualized advertisement campaigns.c© Institute for Computer Sciences, Social Informatics and Telecommunications Engineering 2014I. Stojmenovic et al. (Eds.): MOBIQUITOUS 2013, LNICST 131, pp. 181–194, 2014.DOI: 10.1007/978-3-319-11569-6 15

182 A. Muaremi et al.
A key question from a technical point of view is how data can be obtainedto reconstruct these social networks. Traditional research methods are based onsurveys and manual observations. More recently, however, data is collected digi-tally from communication hubs or online media. Online social network platformsare emerging but can only represent a fraction of the social network, which existsin our offline world. Identifying an offline social network with technical meansto convert it into a digital representation is a challenging task.
One approach to identify offline social networks is to measure the proximitybetween individuals within a group. Individuals who are spatially close to eachother are potentially also linked in a social sense. There are several technicaltools to measure spatial proximity between individuals. One possibility is tomeasure the absolute positions of individuals and then calculate their mutualspatial distance. Another method is to use peer-to-peer transceivers, which areworn by the individuals. If one transceiver picks up the signal of another one,the two individuals are considered to be close to each other.
Smartphone based sensors, like GPS, Bluetooth and ANT+, can be used toobtain proximity information between individuals within a group. However, inreal-life scenarios, different people use different devices, featuring different sensormodalities. To draw the most complete picture of the spatial proximities betweenindividuals, it is advantageous to merge data from an inhomogeneous system intoone common representation.
1.2 Data Collection During Pilgrimage
One of the biggest, global annual events is the Hajj pilgrimage of Muslims.Consequently, we identified it as a particularly useful event to collect data aboutsocial networks. During this pilgrimage millions of people from all over the worldcongregate for religious rituals at holy sites in the cities of Makkah and Madinahand their surrounds. The holy mosque in Makkah covers an area of approximately350,000 square meters and the holy site in Madinah is approximately 80,000square meters in size. Umrah, also known as the “lesser pilgrimage”, is the visitto the sacred sites outside the period of Hajj (for details see, e.g., [5]).
The pilgrimage of Hajj/Umrah is useful to our study for the following reasons:– It is a big event and features real-life conditions.– Daily routines are very structured which simplifies the annotations.– The fixed and synchronized schedule concerning prayer activities enables com-
parisons of data.– Each individual performs five prayers each day, prayers have dynamic, semi-
dynamic and static parts and involve re-groupings of the individuals. Thisensures a high but still predictable variety of recorded proximity data.
– There are fixed religious rules the pilgrims have to comply with and whichcan be exploited to de-noise the data.
1.3 Related Work
In [13], organizational human behavior is measured and analyzed by using prox-imity information, for example: time spent in close proximity to other people,
Merging Inhomogeneous Proximity Sensor Systems for SNA 183
this is determined by special wearable electronic badges. Nowadays, the emerg-ing technologies of smartphones have replaced the wearable sensors as sensingdevices. The work in [4] uses Bluetooth (BT) links to identify friendship networksby detecting people sharing the same space. Do et al. [3] demonstrate the usageof smartphone BT as a real, i.e., face-to-face, proximity sensor to identify socialnetworks. In the aforementioned examples the target subjects were employeesworking in offices or students living on university campuses.
As well as BT, the ANT+ protocol has recently been used as a proximitysensor. In [6] and [7], ANT+ is used for monitoring and assessing the performanceof firefighting teams in training scenarios.
The combination of BT and ANT+ has not been an area of significant interestin the literature to date. Most of the studies are performed in controlled labenvironments and settings. There are few technical challenges and the noiselevels, i.e., the external influences, are highly predictable.
Apart from our work, there are only a few studies about the Hajj pilgrim-age and these focus mainly on tracking pilgrims for security issues rather thanunderstanding social networks. For example, in [9] and [10] the authors describetwo frameworks that provide pilgrim tracking using smartphones, with the goalof improving transportation infrastructure and crowd management services. In[8] simulation tools are built to support pilgrims in navigating through religioussites.
1.4 Contributions
We present two ways of obtaining proximity data of peers within a crowd, firstlybased on peer-to-peer sensor nodes and secondly on positional (GPS) informa-tion. Both approaches are discussed qualitatively from a technical point of view.Additionally data collection is performed which enables a quantitative compar-ison from a practical point of view.
The main contributions and outcomes of our work are as follows:
1. We present the implementation of two types of peer-to-peer proximity sensornodes, which are based on mobile phones using BT and ANT+ technologyrespectively. We suggest a method for merging these inhomogeneous sensorsources into one common proximity matrix. Interconnection between bothsystems is achieved by using additional infrastructure and accessing pre-knowledge about religious and social rules in a specific community, in ourexample a Muslim community.
2. We present an approach to extract proximity information from position sensor(GPS) data.
3. We apply our methods to a data collection with n=41 participants during 8days in a real-life scenario and describe practical challenges.
4. Based on this data collection we compare proximity information obtainedfrom peer-to-peer sensors with proximity information based on position databoth qualitatively and quantitatively and discuss the results.
184 A. Muaremi et al.
2 Data Collection and Data Processing Schedule
In this section, we briefly describe the data collection. More information can befound in our previous work in [11].
2.1 Participants
41 pilgrims, equipped with Android smartphones participated in our study dur-ing the Umrah pilgrimage over 8 days. The youngest was a 7 year old boy and theoldest a 53 years old man (μ = 30, σ = 13). There were 31 males and 10 females,among which there were 10 couples, 10 children and 11 single participants.
2.2 Smartphone as Sensing Device
As sensing application we extended the Android open sensing framework Funf [1].The app collects proximity information, absolute GPS location, 3D-accelerationof the device and audio features. The smartphones were configured either as BTdevices or as ANT+ devices and were only able to capture nearby devices fromthe same configuration type. We distributed 22 BT devices (Samsung GalaxySII, SIII and SIII Mini) and 19 ANT+ devices (Sony Xperia Active and Neo).Participants were encouraged to wear the smartphones in their pockets, prefer-ably for the whole day, but at least around the times of the 5 daily prayers.
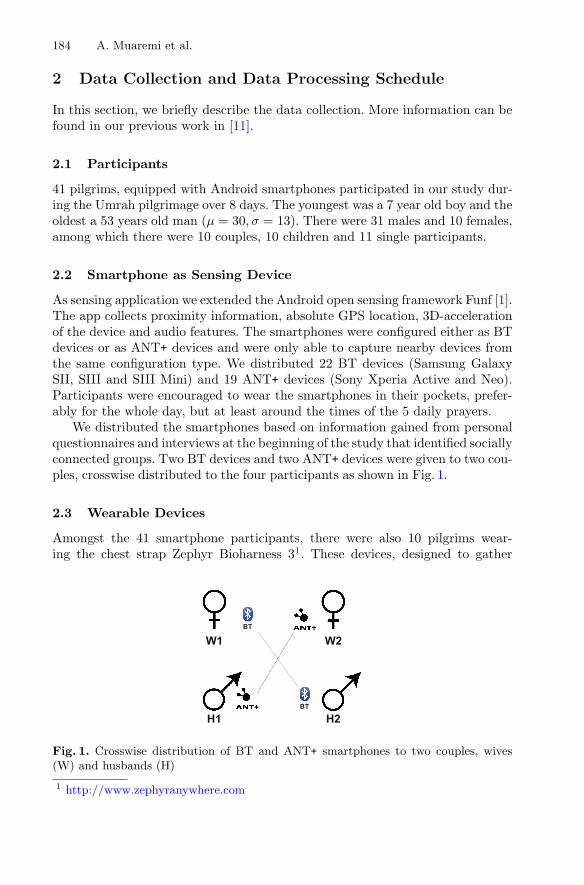
We distributed the smartphones based on information gained from personalquestionnaires and interviews at the beginning of the study that identified sociallyconnected groups. Two BT devices and two ANT+ devices were given to two cou-ples, crosswise distributed to the four participants as shown in Fig. 1.
2.3 Wearable Devices
Amongst the 41 smartphone participants, there were also 10 pilgrims wear-ing the chest strap Zephyr Bioharness 31. These devices, designed to gather
H1
W1 W2
H2
BT
BT
Fig. 1. Crosswise distribution of BT and ANT+ smartphones to two couples, wives(W) and husbands (H)
1 http://www.zephyranywhere.com
Merging Inhomogeneous Proximity Sensor Systems for SNA 185
1st call 2nd call
TS (SPREAD) TG (GATHERING) TP (PRAYER) TT (TRANSITION)
30 min 30 min 10 - 20 min
1
2
N
. . .
TW = 3 min TW
t
12
N
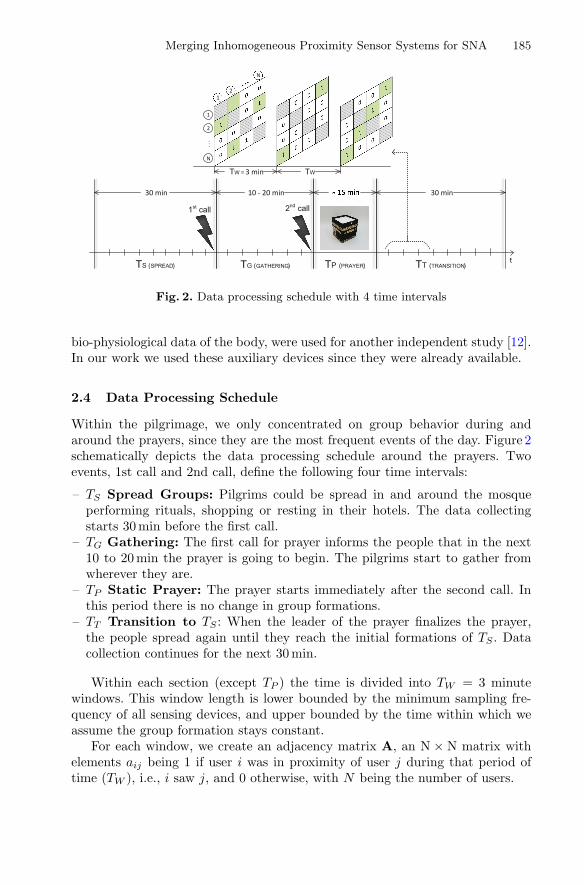
Fig. 2. Data processing schedule with 4 time intervals
bio-physiological data of the body, were used for another independent study [12].In our work we used these auxiliary devices since they were already available.
2.4 Data Processing Schedule
Within the pilgrimage, we only concentrated on group behavior during andaround the prayers, since they are the most frequent events of the day. Figure 2schematically depicts the data processing schedule around the prayers. Twoevents, 1st call and 2nd call, define the following four time intervals:
– TS Spread Groups: Pilgrims could be spread in and around the mosqueperforming rituals, shopping or resting in their hotels. The data collectingstarts 30 min before the first call.
– TG Gathering: The first call for prayer informs the people that in the next10 to 20 min the prayer is going to begin. The pilgrims start to gather fromwherever they are.
– TP Static Prayer: The prayer starts immediately after the second call. Inthis period there is no change in group formations.
– TT Transition to TS : When the leader of the prayer finalizes the prayer,the people spread again until they reach the initial formations of TS . Datacollection continues for the next 30 min.
Within each section (except TP ) the time is divided into TW = 3 minutewindows. This window length is lower bounded by the minimum sampling fre-quency of all sensing devices, and upper bounded by the time within which weassume the group formation stays constant.
For each window, we create an adjacency matrix A, an N × N matrix withelements aij being 1 if user i was in proximity of user j during that period oftime (TW ), i.e., i saw j, and 0 otherwise, with N being the number of users.

186 A. Muaremi et al.
BT
ZM41×41M+ + +
Zephyr Social Rule GPSf
0 0
00
00
0 0
1
...
4122×22B
19×19AZ
R
G
PZRM
Fig. 3. System overview: from ANT+ and BT to the final adjacency matrix P
3 Merging Inhomogeneous Proximity Sensor Systems
3.1 System Overview
Figure 3 shows a general overview of the steps involved in processing the prox-imity data. Two inhomogeneous systems, ANT+ and BT, provide the initialinputs. ANT+ proximity data is represented as a binary symmetric adjacencymatrix A19×19 of size equal to the number of participants (19). Similarly, BTproximity data is an adjacency matrix B22×22 of size 22. These two matrices aremerged into one matrix M41×41 of size equal to the total number of smartphones(41), using the operator “�”, as follows:
M =
⎛⎜⎝
0 · · · 0...
. . ....
0 · · · 0
⎞⎟⎠ , M1:19,1:19 = A ,M20:41,20:41 = B . (1)
The structure of the merged matrix M contains the two systems (coloredblocks) and two zero blocks. All following matrices in the processing chain areof equal size (41×41). “+” is the matrix logical OR operator. Z is the adjacencymatrix filled out with information gathered from the Zephyr wearable sensors.MZ = M+Z is the merged matrix with added Zephyr knowledge. Special socialrules (f) are applied to the existing proximity matrix. The additional connectionsextracted from these rules are stored in the adjacency matrix R. MZR = MZ+Ris the previous matrix, with knowledge added from the social rules.
The multi-modal aspect of proximity sensing is enriched by using the GPSsensor as well. The adjacency matrix G is built from GPS locations, and thefinal matrix P = MZR+G contains all previous proximity information.
The initial merged matrix M is improved by updating the zero values in eachstep of the chain.
3.2 ANT+ and BT Proximities
ANT+ is a proprietary wireless sensor network that operates in the 2.4 GHzfrequency range. It is mainly available in sport equipment devices such as bike

Merging Inhomogeneous Proximity Sensor Systems for SNA 187
1 2
4 5
6 7 9
83BT
Fig. 4. Social network graphs of ANT+ and BT proximity systems
computers or heart rate monitors. ANT+ radio devices support up to eight logicalchannels using time division multiplexing on one physical channel.
ANT+ Search Strategy. Each device periodically transmits its ID on one of theeight logical channels. Given a list of devices to search for, the remaining sevenchannels are used to search in parallel for all the devices provided in the list.There is a time out approach for cases when the device being searched is notpresent in the proximity range.
BT scans were used as means of identifying other BT capable devices that arein the proximity range. In order for a smartphone to be “seen” by other devices,its BT adapter needs to be in discoverable mode. The smartphone devices usedin this study are equipped with a Class 2 BT adapter.
BT Search Strategy. The BT search algorithm uses methods from the AndroidAPI to asynchronously initiate BT scans and retrieve scan results. The scanmethod performs a 12 second scan and for each newly discovered device a pagescan is done to retrieve its BT name.
The scores of the adjacency matrices A and B provide information aboutthe proximity relationship between each pair of devices, e.g., ai,j = 1 indicatesthat the ANT+ devices i and j are in proximity range. Moreover, the matricesare symmetric, i.e., if i sees j, then j sees i as well. Figure 4 illustrates a socialnetwork graph constructed from ANT+ and BT adjacency matrices. The graphsare undirected and because of the inhomogeneity of the systems, there is no linkbetween the two groups.
3.3 Wearable Sensor Proximity
Zephyr wearable sensors were provided to 10 pilgrims. The devices were equippedwith a BT adapter for transmitting the logged data to a smartphone and dur-ing the study were configured to always be in discoverable mode. From the 10devices, 6 were assigned to users that were using ANT+ smartphones for prox-imity sensing, and the other 4 were distributed to BT smartphones users. Inthis way, the 6 ANT+ smartphones participants contribute to connecting thetwo inhomogeneous systems, as it appears to the other participants that the 6users carry both types of smartphones. On the other hand, the 4 BT smart-phones users do not contribute directly, however, as they carry 2 discoverableBT devices, it is more likely to be seen by others when they enter the proximityregion.
188 A. Muaremi et al.
W1 W2
H2
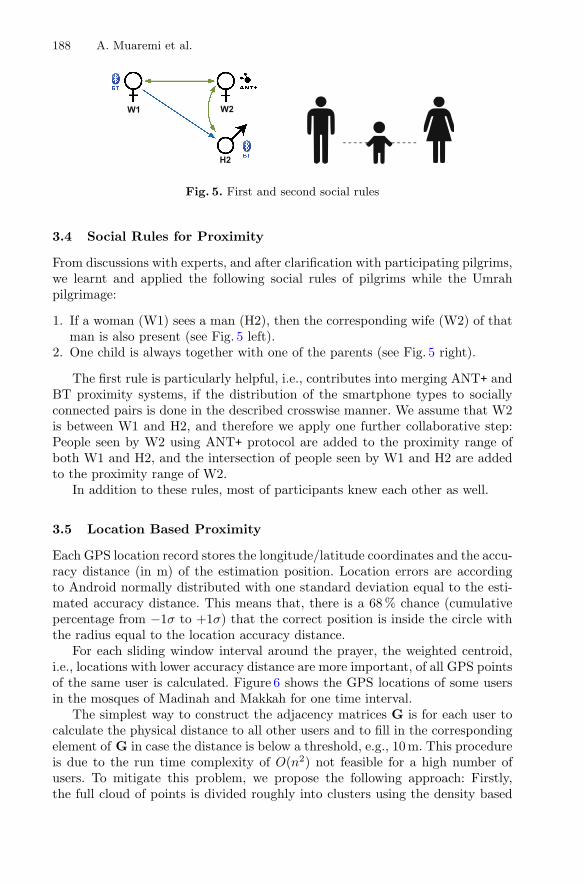
Fig. 5. First and second social rules
3.4 Social Rules for Proximity
From discussions with experts, and after clarification with participating pilgrims,we learnt and applied the following social rules of pilgrims while the Umrahpilgrimage:
1. If a woman (W1) sees a man (H2), then the corresponding wife (W2) of thatman is also present (see Fig. 5 left).
2. One child is always together with one of the parents (see Fig. 5 right).
The first rule is particularly helpful, i.e., contributes into merging ANT+ andBT proximity systems, if the distribution of the smartphone types to sociallyconnected pairs is done in the described crosswise manner. We assume that W2is between W1 and H2, and therefore we apply one further collaborative step:People seen by W2 using ANT+ protocol are added to the proximity range ofboth W1 and H2, and the intersection of people seen by W1 and H2 are addedto the proximity range of W2.
In addition to these rules, most of participants knew each other as well.
3.5 Location Based Proximity
Each GPS location record stores the longitude/latitude coordinates and the accu-racy distance (in m) of the estimation position. Location errors are accordingto Android normally distributed with one standard deviation equal to the esti-mated accuracy distance. This means that, there is a 68 % chance (cumulativepercentage from −1σ to +1σ) that the correct position is inside the circle withthe radius equal to the location accuracy distance.
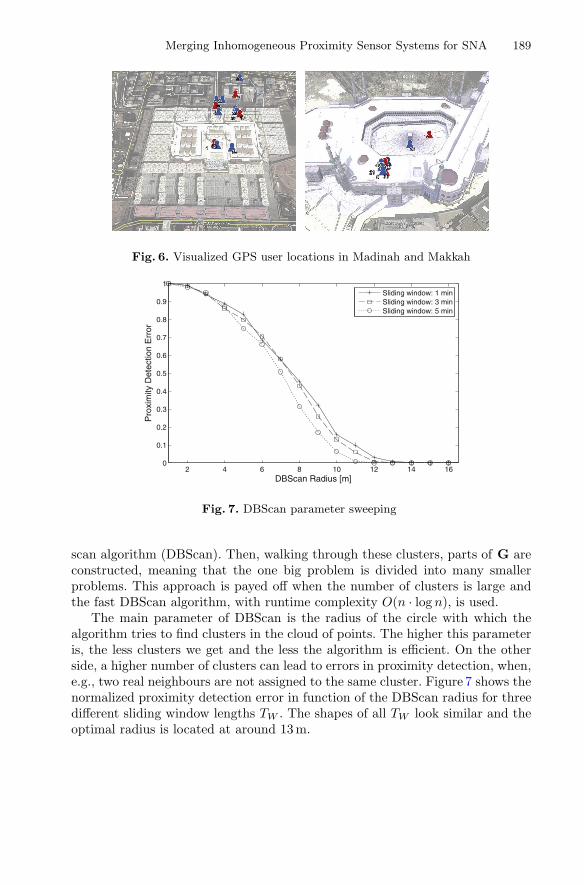
For each sliding window interval around the prayer, the weighted centroid,i.e., locations with lower accuracy distance are more important, of all GPS pointsof the same user is calculated. Figure 6 shows the GPS locations of some usersin the mosques of Madinah and Makkah for one time interval.
The simplest way to construct the adjacency matrices G is for each user tocalculate the physical distance to all other users and to fill in the correspondingelement of G in case the distance is below a threshold, e.g., 10 m. This procedureis due to the run time complexity of O(n2) not feasible for a high number ofusers. To mitigate this problem, we propose the following approach: Firstly,the full cloud of points is divided roughly into clusters using the density based
Merging Inhomogeneous Proximity Sensor Systems for SNA 189
Fig. 6. Visualized GPS user locations in Madinah and Makkah
2 4 6 8 10 12 14 160
0.1
0.2
0.3
0.4
0.5
0.6
0.7
0.8
0.9
1
DBScan Radius [m]
Pro
xim
ity D
etec
tion
Err
or
Sliding window: 1 minSliding window: 3 minSliding window: 5 min
Fig. 7. DBScan parameter sweeping
scan algorithm (DBScan). Then, walking through these clusters, parts of G areconstructed, meaning that the one big problem is divided into many smallerproblems. This approach is payed off when the number of clusters is large andthe fast DBScan algorithm, with runtime complexity O(n · log n), is used.
The main parameter of DBScan is the radius of the circle with which thealgorithm tries to find clusters in the cloud of points. The higher this parameteris, the less clusters we get and the less the algorithm is efficient. On the otherside, a higher number of clusters can lead to errors in proximity detection, when,e.g., two real neighbours are not assigned to the same cluster. Figure 7 shows thenormalized proximity detection error in function of the DBScan radius for threedifferent sliding window lengths TW . The shapes of all TW look similar and theoptimal radius is located at around 13 m.

190 A. Muaremi et al.
4 Evaluation
We aggregate the proximity data, i.e., average adjacency matrices, over a timeinterval T and extract the following SNA state-of-the-art features [2]:
– Average node eigenvector centrality (ANEC)NEC shows how well a node is connected to the most important nodes. Cen-trality features are used to identify pitchers (leaders) and catchers (followers).
– Network density (ND)ND is the ratio of links over the total number of possible links in a network.It measures the network connectivity and is used for comparing networks.
– Network clustering coefficient (NCC)NCC is the density of network neighbourhoods and can be used for detectingsubgroups in a network.
4.1 Graphical Representation
Figure 8 shows an example of proximity data over one interval TS . Initial ANT+and BT nodes and connections are plotted in (a). The systems are inhomoge-neous and there is no link between them. (b) shows is the state after incorpo-rating proximity data from Zephyr, where the number of links is doubled. Thenew links between the two systems occur because BT smartphones have indi-rectly detected the presence of ANT+ devices through the Zephyr BT radios.There is also an improvement within the BT nodes, due to the extra BT sig-nal available from Zephyr. The contribution of applying the pilgrimage socialrules is displayed in (c) where the network density increases significantly. And,(d) shows the final state of the network when GPS data are integrated.
4.2 Quantitative Evaluation
Table 1 lists the SNA features of all matrices described in Fig. 3, averaged overall prayers.
We observe that ANEC is almost constant with a value around 10%. We cantherefore say, that the centrality property of the network, i.e., the informationabout the importance of people (nodes) is not changed across all merging steps.
For NCC, we take the value of G as a baseline, because GPS proximity is a fairrepresentation of a homogeneous equivalent network of the two inhomogeneoussystems ANT+ and BT. Going through M, MZ, and MZR, we can see a smalldecrease of NCC at each step. The value at MZR is 16% smaller than thebaseline of G. Thus, we conclude, that the clustering property of the network ismoderately worsened compared to the GPS social network.
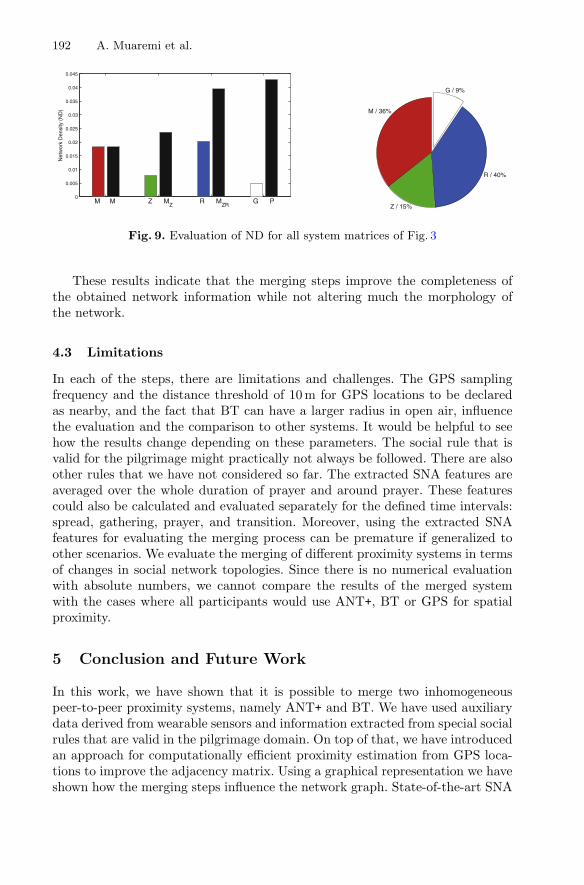
An increase in ND is observed at all steps. GPS contributes with only 9% tothe overall density, while the social rule with 40% is the most effective modalityfor merging. The cummulative plot and the pie chart are shown in Fig. 9.
The colored bars show the ND of the individual auxiliary proximities, while theblack bars represent the cumulative ND values of all the previous merging steps.The pie chart illustrates the percentage ofND increase fromeachproximity system.

Merging Inhomogeneous Proximity Sensor Systems for SNA 191
(a) Step 1 (M); ND = 0.0182No links between ANT+ and BT
(b) Step 2 (MZ); ND = 0.0236Merging of systems
(c) Step 3 (MZR); ND = 0.0394Significant increase of ND
(d) Step 4 (P); ND = 0.0429Final state of the network
Fig. 8. Proximity data visualizations of the interval TS for a prayer where ANT+
devices are in red and BT in blue. The size of a node is a figure of the number of totallinks. The line thickness represents the number of times the two connected nodes havebeen in proximity range.
Table 1. SNA feature comparison of system steps from Fig. 3
M Z MZ R MZR G P
ANEC 0.0994 0.0955 0.1123 0.0528 0.1263 0.1024 0.1301
ND 0.0182 0.0078 0.0236 0.0202 0.0394 0.0048 0.0429
NCC 0.5265 0.3008 0.4870 0.0661 0.4196 0.5784 0.5497
192 A. Muaremi et al.
0
0.005
0.01
0.015
0.02
0.025
0.03
0.035
0.04
0.045
M M Z MZ
R MZR
G P
Net
wor
k D
ensi
ty (
ND
) M / 36%
Z / 15%
R / 40%
G / 9%
Fig. 9. Evaluation of ND for all system matrices of Fig. 3
These results indicate that the merging steps improve the completeness ofthe obtained network information while not altering much the morphology ofthe network.
4.3 Limitations
In each of the steps, there are limitations and challenges. The GPS samplingfrequency and the distance threshold of 10 m for GPS locations to be declaredas nearby, and the fact that BT can have a larger radius in open air, influencethe evaluation and the comparison to other systems. It would be helpful to seehow the results change depending on these parameters. The social rule that isvalid for the pilgrimage might practically not always be followed. There are alsoother rules that we have not considered so far. The extracted SNA features areaveraged over the whole duration of prayer and around prayer. These featurescould also be calculated and evaluated separately for the defined time intervals:spread, gathering, prayer, and transition. Moreover, using the extracted SNAfeatures for evaluating the merging process can be premature if generalized toother scenarios. We evaluate the merging of different proximity systems in termsof changes in social network topologies. Since there is no numerical evaluationwith absolute numbers, we cannot compare the results of the merged systemwith the cases where all participants would use ANT+, BT or GPS for spatialproximity.
5 Conclusion and Future Work
In this work, we have shown that it is possible to merge two inhomogeneouspeer-to-peer proximity systems, namely ANT+ and BT. We have used auxiliarydata derived from wearable sensors and information extracted from special socialrules that are valid in the pilgrimage domain. On top of that, we have introducedan approach for computationally efficient proximity estimation from GPS loca-tions to improve the adjacency matrix. Using a graphical representation we haveshown how the merging steps influence the network graph. State-of-the-art SNA
Merging Inhomogeneous Proximity Sensor Systems for SNA 193
features are used to evaluate the validity of the merging. The centrality remainsconstant during all steps, the clustering property is moderately reduced and theoverall network density is much higher compared to GPS only, which makes usbelieve, that GPS can be neglected for proximity estimation where fine grainedinformation is needed. The data for this work is collected from 41 participantsduring an Umrah pilgrimage in Spring 2013.
As future work, we are planing to incorporate the speech and the environ-mental sound as an additional source for proximity detection. Moreover, usingthe results of our work, we are now able to answer questions related to social net-work analysis and to understand the grouping behaviour of pilgrims around therituals. The upcoming Hajj pilgrimage offers the next opportunity to improveand evaluate our work.
References
1. Aharony, N., Pan, W., Ip, C., Khayal, I., Pentland, A.: Social fMRI: investigatingand shaping social mechanisms in the real world. Pers. Ubiquit. Comput. (PUC)7(6), 643–659 (2011)
2. Bounova, G., de Weck, O.: Overview of metrics and their correlation patterns formultiple-metric topology analysis on heterogeneous graph ensembles. Phys. Rev.E 85, 016117 (2012)
3. Do, T., Gatica-Perez, D.: Human interaction discovery in smartphone proximitynetworks. Pers. Ubiquit. Comput. (PUC) 17(3), 413–431 (2012)
4. Eagle, N., (Sandy) Pentland, A.: Reality mining: sensing complex social systems.Pers. Ubiquit. Comput. (PUC) 10(4), 255–268 (2006)
5. Peters, F.E.: The Hajj: The Muslim Pilgrimage to Mecca and the Holy Places.Princeton University Press, Princeton (1994)
6. Feese, S., Arnrich, B., Burtscher, M., Meyer, B., Jona, K., Troster, G.: CoenoFire:monitoring performance indicators of firefighters in real-world missions usingsmartphones. In: Proceedings of the ACM Ubiquitous Computing (UbiComp)(2013)
7. Feese, S., Arnrich, B., Burtscher, M., Meyer, B., Jona, K., Troster, G.: Sensinggroup proximity dynamics of firefighting teams using smartphones. In: Proceedingsof the International Symposium on Wearable Computing (ISWC) (2013)
8. Hamhoum, F., Kray, C.: Supporting pilgrims in navigating densely crowded reli-gious sites. Pers. Ubiquit. Comput. (PUC) 16(8), 1013–1023 (2012)
9. Mantoro, T., Jaafar, A., Aris, M., Ayu, M.: Hajjlocator: a hajj pilgrimage trackingframework in crowded ubiquitous environment. In: International Conference onMultimedia Computing and Systems (ICMCS) (2011)
10. Mohandes, M.: Pilgrim tracking and identification using the mobile phone. In:IEEE International Symposium on Consumer Electronics (ISCE) (2011)
11. Muaremi, A., Seiter, J., Bexheti, A., Troster, G.: Monitor and understand pilgrims:data collection using smartphones and wearable devices. In: International Work-shop on Human Activity Sensing Corpus and its Application (HASCA) (2013)

194 A. Muaremi et al.
12. Muaremi, A., Seiter, J., Gravenhorst, F., Bexheti, A., Arnrich, B., Troster, G.:Monitor pilgrims: prayer activity recognition using wearable sensors. In: Proceed-ings of the International Conference on Body Area Networks (Bodynets) (2013)
13. Olguin, D., Waber, B., Kim, T., Mohan, A., Ara, K., Pentland, A.: Sensible orga-nizations: technology and methodology for automatically measuring organizationalbehavior. IEEE Trans. Syst. Man and Cybern. 39(1), 43–55 (2009)