Mergers and Acquisitions What can we Learn from Money … · Mergers and Acquisitions What can we...
22
39 I C R A B U L L E T I N Money Finance & OCT.DEC. . 1999 Mergers and Acquisitions What can we Learn from the “Wave” of the 1980s? SUMON KUMAR BHAUMIK Abstract During the 1980s, the US witnessed a merger wave that was much larger than those observed during the 1920s and the 1960s. This in itself may not be surprising, given that the market for corporate assets was much larger during the 1980s than ever before. However, the wave of the 1980s left its mark on US’s financial-corporate history in two different ways. First, aided by banks and private investors, financial engineering in the form of LBOs and MBOs formed a key component of this wave. Second, despite the fact that the gains to acquirers were not significant, the wave continued unabated for nearly 7 years, from the beginning of the 1980s to 1987. An economist, therefore, is saddled with two concerns: the possible rationale for the sustenance of the wave, in the absence of significant gains to acquirers; and the extent of participation of the banks in the financial engineering, and the impact of such participation on the banks’ asset risk. This paper addresses these two questions, drawing upon the theoretical and empirical literature on corporate governance, and the US merger wave of the 1980s. It argues that ex ante there were many reasons for the precipitation of a merger wave, but hindsight suggests that managerial hubris was a key driver of the merger wave. While M&As may have helped augment the allocational efficiency of the country’s productive resources, empirical evidence cited in this paper suggests that there were few reasons, if any, for the persistence of the merger wave, especially since many of the mergers involved a high degree of leverage. Further, after taking into account the nature and extent of the exposure of US banks to the M&As, the paper argues that exposure to M&As was responsible for increasing the banks’ financial fragility. It concludes that the risk notwithstanding, M&As can act as a vehicle for creative destruction that is an integral part of a competitive market. Hence, an agenda of economic liberalisation is inconsistent with anti-trust legislation aimed at eliminating M&As; rather, M&As should be supplemented by strong disclosure and prudential norms. Introduction Mergers and acquisitions (M&A) seem to have become an integral part of recent Indian corporate culture. 1 The number of open bids/offers rose from 30 in 1996-97 to 66 in 1998-99, and has crossed 35 in the first seven months of the current financial year. In tandem, the amount associated with 1 To begin with, note that from an economic point of view there is no difference between a merger and an acquisition. In both cases, one firm is acquired by another, either by paying cash for its shares, or by swapping equities in some well-defined manner. Irrespective of whether the fusion of two companies is a merger (which has a friendly connotation) or an acquisition (which often implies that the acquirer is hostile), an economist is interested in the impact of the fusion on the organisational structure of the post-M&A firm, and its impact on the company’s agency problem and efficiency. Hence, in the rest of the paper, the terms merger and acquisition have been used interchangeably, unless otherwise specified.
Transcript of Mergers and Acquisitions What can we Learn from Money … · Mergers and Acquisitions What can we...

39
I C R A B U L L E T I N
Money
Finance&O C T. � D E C . . 1 9 9 9
Mergers and AcquisitionsWhat can we Learn fromthe “Wave” of the 1980s?
SUMON KUMAR BHAUMIK
AbstractDuring the 1980s, the US witnessed a merger wave that was much larger
than those observed during the 1920s and the 1960s. This in itself may not besurprising, given that the market for corporate assets was much larger during the1980s than ever before. However, the wave of the 1980s left its mark on US’sfinancial-corporate history in two different ways. First, aided by banks and privateinvestors, financial engineering in the form of LBOs and MBOs formed a keycomponent of this wave. Second, despite the fact that the gains to acquirers were notsignificant, the wave continued unabated for nearly 7 years, from the beginning ofthe 1980s to 1987. An economist, therefore, is saddled with two concerns: thepossible rationale for the sustenance of the wave, in the absence of significant gainsto acquirers; and the extent of participation of the banks in the financialengineering, and the impact of such participation on the banks’ asset risk. Thispaper addresses these two questions, drawing upon the theoretical and empiricalliterature on corporate governance, and the US merger wave of the 1980s. It arguesthat ex ante there were many reasons for the precipitation of a merger wave, buthindsight suggests that managerial hubris was a key driver of the merger wave.While M&As may have helped augment the allocational efficiency of the country’sproductive resources, empirical evidence cited in this paper suggests that there werefew reasons, if any, for the persistence of the merger wave, especially since many ofthe mergers involved a high degree of leverage. Further, after taking into account thenature and extent of the exposure of US banks to the M&As, the paper argues thatexposure to M&As was responsible for increasing the banks’ financial fragility. Itconcludes that the risk notwithstanding, M&As can act as a vehicle for creativedestruction that is an integral part of a competitive market. Hence, an agenda ofeconomic liberalisation is inconsistent with anti-trust legislation aimed at eliminatingM&As; rather, M&As should be supplemented by strong disclosure and prudentialnorms.
IntroductionMergers and acquisitions (M&A) seem to have become an integral
part of recent Indian corporate culture.1 The number of open bids/offers rosefrom 30 in 1996-97 to 66 in 1998-99, and has crossed 35 in the first sevenmonths of the current financial year. In tandem, the amount associated with
1 To begin with, note that from an economic point of view there is no differencebetween a merger and an acquisition. In both cases, one firm is acquired by another, eitherby paying cash for its shares, or by swapping equities in some well-defined manner.Irrespective of whether the fusion of two companies is a merger (which has a friendlyconnotation) or an acquisition (which often implies that the acquirer is hostile), aneconomist is interested in the impact of the fusion on the organisational structure of thepost-M&A firm, and its impact on the company’s agency problem and efficiency. Hence, inthe rest of the paper, the terms merger and acquisition have been used interchangeably,unless otherwise specified.

40
I C R A B U L L E T I N
Money
Finance&O C T. � D E C . . 1 9 9 9
the bids/offers rose from Rs 170 crore in 1996-97 to Rs 1,606 in 1998-99,and crossed the Rs 750 crore mark during the April-November period of1999.2 However, apart from acquisitions that involve spinning off divisions/assets of large companies, or acquisition of the share of Indian joint-venturepartners by foreign companies, most M&As have involved relatively smallcompanies. The market for M&As in India has quite a long way to gobefore we may see mega-mergers like those involving giants like Citibankand the Travelers group, as well as exotic varieties of M&A like leveragedbuyout (LBO) and management buyout (MBO).
But before we have a M&A “wave” involving large companies, asseen in the United States and Western Europe, we should have a betterunderstanding of certain important issues.
• First, why did these countries witness a merger wave involvingmany billions of dollars? Was there a compelling economic reasonfor the mergers/acquisitions, or can we ascribe much of it to the so-called managerial hubris?
• Second, how were the mega mergers financed, and how did thehigh degree of leverage affect the extent of financial fragility of thebanking system?
• Third, did the M&As help augment the efficiency of the firmssubsequent to the merger/acquisition, especially in light of the factthat the mergers typically increased their leverage ratios signifi-cantly, and did they serve any broad economic purpose in theprocess?
These are compelling issues. The empirical literature on M&As hasfocussed largely on the “wave” of the 1980s in the US.3 The waves of the1920s and the 1960s have mostly been mentioned in the passing, and it istoo early to evaluate the impact of the wave of the 1990s on either thecompanies themselves or on the economy as a whole. This literature issupplemented by that on the phenomenon of junk bonds, and the well-developed theoretical literature on the nature of agency problems that arise
2 The M&A market was relatively inactive during the April-October period, interms of the value of the underlying assets. The market picked up after November, withseveral high-profile acquisitions, including that of Indiaworld by Satyam, the acquisitionof Times Bank by HDFC Bank, the reported merger of ICICI Bank with Centurion Bankand the purchase by Gujarat Ambuja of the Tata’s shareholding in ACC.
3 In part, this wave drew attention to itself by introducing an unprecedentedextent of financial engineering involving junk bonds, mezzanine financing, LBOs andMBOs. However, the sheer magnitude of the M&As was stupendously large. During thepeak years of 1984-86, the values of the concluded M&A deals were USD 122 billion,USD 180 billion and USD 180 billion. By another estimate, the gains to the shareholders ofthe acquired companies between 1977 and 1986 was USD 346 billion (in 1986 dollars).While it is difficult to obtain corresponding figures for the 1960s’ wave, there is generalagreement among economists that the 1980s’ wave was much larger in value terms.
. . . the causes under-
lying the merger wave,
its financing and
impart on productivity
form the focus of this
paper
41
I C R A B U L L E T I N
Money
Finance&O C T. � D E C . . 1 9 9 9
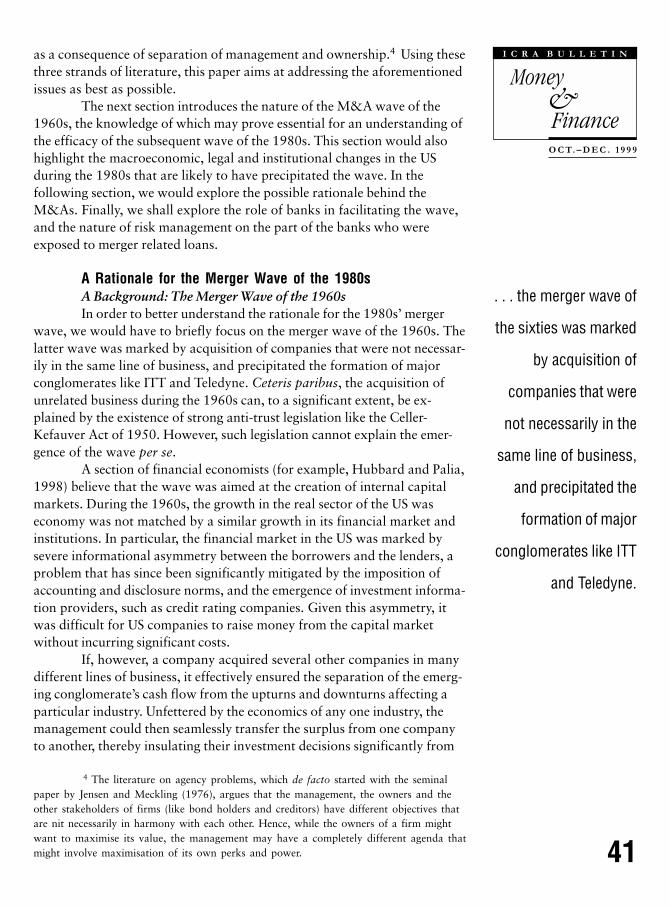
as a consequence of separation of management and ownership.4 Using thesethree strands of literature, this paper aims at addressing the aforementionedissues as best as possible.
The next section introduces the nature of the M&A wave of the1960s, the knowledge of which may prove essential for an understanding ofthe efficacy of the subsequent wave of the 1980s. This section would alsohighlight the macroeconomic, legal and institutional changes in the USduring the 1980s that are likely to have precipitated the wave. In thefollowing section, we would explore the possible rationale behind theM&As. Finally, we shall explore the role of banks in facilitating the wave,and the nature of risk management on the part of the banks who wereexposed to merger related loans.
A Rationale for the Merger Wave of the 1980sA Background: The Merger Wave of the 1960sIn order to better understand the rationale for the 1980s’ merger
wave, we would have to briefly focus on the merger wave of the 1960s. Thelatter wave was marked by acquisition of companies that were not necessar-ily in the same line of business, and precipitated the formation of majorconglomerates like ITT and Teledyne. Ceteris paribus, the acquisition ofunrelated business during the 1960s can, to a significant extent, be ex-plained by the existence of strong anti-trust legislation like the Celler-Kefauver Act of 1950. However, such legislation cannot explain the emer-gence of the wave per se.
A section of financial economists (for example, Hubbard and Palia,1998) believe that the wave was aimed at the creation of internal capitalmarkets. During the 1960s, the growth in the real sector of the US waseconomy was not matched by a similar growth in its financial market andinstitutions. In particular, the financial market in the US was marked bysevere informational asymmetry between the borrowers and the lenders, aproblem that has since been significantly mitigated by the imposition ofaccounting and disclosure norms, and the emergence of investment informa-tion providers, such as credit rating companies. Given this asymmetry, itwas difficult for US companies to raise money from the capital marketwithout incurring significant costs.
If, however, a company acquired several other companies in manydifferent lines of business, it effectively ensured the separation of the emerg-ing conglomerate’s cash flow from the upturns and downturns affecting aparticular industry. Unfettered by the economics of any one industry, themanagement could then seamlessly transfer the surplus from one companyto another, thereby insulating their investment decisions significantly from
4 The literature on agency problems, which de facto started with the seminalpaper by Jensen and Meckling (1976), argues that the management, the owners and theother stakeholders of firms (like bond holders and creditors) have different objectives thatare nit necessarily in harmony with each other. Hence, while the owners of a firm mightwant to maximise its value, the management may have a completely different agenda thatmight involve maximisation of its own perks and power.
. . . the merger wave of
the sixties was marked
by acquisition of
companies that were
not necessarily in the
same line of business,
and precipitated the
formation of major
conglomerates like ITT
and Teledyne.

42
I C R A B U L L E T I N
Money
Finance&O C T. � D E C . . 1 9 9 9
the credit and capital markets.5 One major advantage of such a financialstructure was that it enabled the companies to effectively utilise first-moveradvantage without having to divulge the project-specific or market-specificinformation to competitors by way of disclosures to investors and/or finan-cial intermediaries (Bhide, 1997).
Jensen (1987), however, argues that much of a M&A wave can beexplained with the so-called “free cash flow” theory. The genesis of thistheory lies in the stylised belief that in the event of separation of manage-ment and ownership, which is true for almost all modern joint-stock compa-nies, the objectives of the managers are not in harmony with those of theowners. This phenomenon has been dubbed agency problem by economists.Specifically, while owners may desire the maximisation of net earnings,managers may be more interested in the enhancement of their own perksand the expansion of their own power bases.6 A corollary of this view of theagency problem is that the management will always want to expand thecompanies’ operations.7 If, therefore, a company is in a line of business thatguarantees a substantial cash inflow, but makes intra-industry expansiondifficult or impossible, its management is very likely to use the free cashflows to acquire companies in growing industries/market segments. Jensen’sargument is substantiated by the observation that during the 1960s a largenumber of the acquirers were in lines of business (like oil, for example) thatgenerated huge cash inflows but where expansion was difficult.
The Environment during the 1980sLet us abstract from the rationale for the M&A wave of the 1960s,
a wave that witnessed a spurt in the acquisition of companies in unrelated
5 Note that in much the same way, the management could set off the losses fromone of the companies against the gains from another, and thereby derive significant taxbenefit. Such a practice, which reduces the net earnings of a larger company would beunacceptable in a paradigm where maximisation of shareholder value is of paramountimportance. But shareholder value was hardly the focus of the companies’ managementduring the 1960s (Donaldson, 1997)
6 Economists have argued that one way of mitigating the agency problem is tooffer the management shares of a company so that they have an ownership stake in it. It isfelt that such a stake is likely to align the interests if the management and the (other)owners of the company, thereby reducing the extent of the agency problem. However, notethat in a large company with a large number of shares outstanding, it may be difficult toprovide the management with enough stake that will make them behave more like ownersthan like hired management. Perhaps in response to this problem, companies have startedoffering stock options to their management. However, the value of these options aremaximised if the expected returns to the companies’ investments are high, a condition thatis likely to be satisfied only if the projects themselves are risky (Bhide, 1997).
7 Note that, ironically, the management of a company may want to diversify itsoperations through acquisition if they own a very high fraction of its shares. If themanagement behave as rational risk-return optimising agents, they may be much morecomfortable with a company that is diversified in many areas of business than in acompany that is focused on one line of business. [In other words, both very little and verysignificant management stake in the equity of a company may be detrimental to theinterests of the owners. For information about the empirical support for this hypothesis seeShleifer and Vishny (1987).]
. . . it has been argued
that in the event of
separation of manage-
ment and ownership,
which is true for
almost all modern
joint-stock companies,
the objectives of the
managers are not in
harmony with those of
the owners and
managers may be
more interested in the
enhancement of their
own perks and the
expansion of their own
power bases

43
I C R A B U L L E T I N
Money
Finance&O C T. � D E C . . 1 9 9 9
lines of business, and turn our attention back to the 1980s. Suffice to notethat, as observed by a number of financial economists, a large number ofthe mega companies or conglomerates that were formed as a consequence ofthe M&A wave of the 1960s were performing poorly,8 especially in theaftermath of the energy price shocks of 1974 and 1979.9
The 1980s were marked by the emergence of macroeconomic andother trends that were clearly favourable for M&As. First, the high inflationrate had increased the nominal value of all fixed assets, and companiescould benefit significantly by acquiring the assets of other companies andsetting off their depreciation against their earnings at a higher rate (Shleiferand Vishny, 1997).10 Further, the high rate of inflation substantially reducedthe real rate of interest payable on past (fixed coupon) loans, therebyenabling companies to increase their leverage.
Second, the Reagan administration, which has since become abenchmark for laissez faire economic policies, was lax in its enforcement ofanti-trust laws (Shleifer and Vishny, 1997; Jarrell, 1997). Hence, after manydecades it was once again possible to acquire firms in the same line ofbusiness, thereby paving the way for horizontal mergers.
Third, since the 1970s, the cohort of shareholders in the US wasincreasingly dominated by institutional shareholders. Unlike individualshareholders, these institutional investors were much less tolerant in so faras under-performance was concerned, and sold the shares of a company assoon as it failed to live up to the expectations that it had previously gener-ated. At the same time, if a company or entrepreneur wanted to take overan under-performing company, it/(s)he could now purchase a significantproportion of the latter’s equity from just one or two (institutional) share-holders who were offloading its shares.11
Finally, a profound change was taking place in the US bankingindustry. Subsequent to the deregulation of the (bank) deposit rates, and theabolition of Regulation Q, the US banks, which were competing with themoney market mutual funds, faced a sharp reduction in their borrowing-
8 This is hardly surprising, even if we assume that the conglomerate creatingM&A wave of the 1960s was driven by the need for an internal capital market rather thanby agency problems. Given that the companies did not have to raise much capital from themarket, the (internal) capital used by these companies for investments was typically under-priced, a phenomenon that usually leads to a significant exposure to non-viable projects.
9 The stock prices in the US, as indicated by the DJIA, started falling from mid1970s, and did not recover to their 1976 levels until 1983 (Ravenscraft, 1987).
10 Some economists (Auerbach and Reishus, 1997; Bhide, 1997) have arguedthat there was incentive for the management to take over poorly performing companies,and directly use the latter as a tax shield. It is not obvious how depreciation of newlyacquired assets can necessarily enhance a company’s earnings, and hence its shareholdervalue. But, as we have noted later in the paper, maximisation of shareholders’ wealth wasperhaps not a priority of the management of the acquiring firms.
11 At the very least, this enabled the predator to take a toehold in the under-performing company, thereby making it perceptibly easier for the predator to assumecontrol of the company at a later date (Bulow, Huang and Klemperer, 1996).
. . . the 1980s were
marked by the
emergence of
macroeconomic and
other trends that were
clearly favourable for
M&As namely, high
inflation, looser anti-
trust enforement, rise
of institutional
shareholders and
changes in the US
banking industry

44
I C R A B U L L E T I N
Money
Finance&O C T. � D E C . . 1 9 9 9
JUNK BONDS
It is well known that “junk” bonds are non-investment grade bonds, and the conventionalwisdom is that junk bonds were a significant force driving the merger and acquisition boom inthe US during the 1980s. Indeed, Drexel Burnham began selling junk bonds to provide financingfor leveraged buyouts as early as 1981, and in 1983 the firm introduced the concept of junkbond financing into the market for hostile takeovers. Why, however, did the junk bond marketgrow? And how important a role did these bonds play in the eighties merger and acquisitionhistory of the United States?
The relatively high inflation rate in the US during much of the 1970s, and increased competitionin its financial sector had significantly lowered the operating margins of a section of thecountry’s financial institutions, namely, conventional and investment banks. These institutionalinvestors were, therefore, looking for securities that would have added to the returns on theirinvestments. This latent demand for high-yield securities enabled institutions like Drexel createa liquid market for junk bonds involving banks, and other institutional investors. Junk bonds,therefore, not only offered higher returns, but also enabled the financial institutions to substitutehigh risk and illiquid term loans with such bonds. Indeed, the relative liquidity and divisibilityof the debt raised through junk bonds helped mitigate liquidity risks and thereby made thempreferable vis-à-vis high yield term loans.
Why, however, were the companies willing to issue junk bonds, given that the issue of suchbonds might have sent undesirable signals to the investors? Essentially, the acquirers benefitedfrom the speed at which they could obtain funds through the junk bond route, timing being animportant consideration during a takeover attempt. Indeed, in the hands of an able investmentbanking firm, the issue of junk bonds by a company was not held back by procedural delays.
How, therefore, were junk bonds placed in the market? Through an investment banker, theacquiring firm obtained financing commitments from investors and, on the basis of thesecommitments, made a tender offer for the target firm. The investors were expected to honourtheir commitments so long as the acquirer was able to purchase some pre-specified fraction ofshares, often using a shell corporation as a front. Importantly, the junk bonds were notcollateralised by the shares of the target company. If the tender offer succeeded, these sharescould be used as collateral to obtain more funds, if required, to complete the acquisition.Irrespective of whether the takeover attempt was successful, the investors in the junk bondsreceived commitment fees: between 3/8th of a percent and 1 percent of the funds committed.
To what extent did junk bonds facilitate mergers and acquisitions in the US during the 1980s?There is no clear answer to this question. For example, Drexel Burnham estimated that only 11per cent of junk bonds issued during 1984, valued at USD 1.7 billion, was used for mergersand acquisitions. In other words, junk bonds accounted for only 1.4 per cent of all merger andacquisition activity recorded during 1984. The Federal Reserve Bank, on the other hand,estimated that 41 per cent of the junk bonds issued during 1984 was used for mergers andacquisitions, accounting for about 9 per cent of the merger and acquisition activity for that year.Finally, according to Merrill Lynch, the corresponding figures for 1984 are 21-31 per cent and2.6-4.5 per cent. However, irrespective of the relative accuracy of these figures, it is evident thatthe junk bonds accounted for a very small fraction of the merger and acquisition activity in theUS during the 1980s. In other words, while the rise of junk bonds as financial instruments hadcertainly helped acquirers in specific cases, they did not play as big a role in facilitating mergersand acquisitions as they are often believed to have done.
Source: Taggart (1988)

45
I C R A B U L L E T I N
Money
Finance&O C T. � D E C . . 1 9 9 9
lending spreads, a phenomenon that adversely affected their profitability.12
At the same time, there was a significant erosion of the banks’ lendingbusiness as good corporate borrowers bypassed the banks and raised capitaldirectly from the capital market using debentures and commercial papers(Borio, 1990). The loss of market share in the deposit and credit marketswas further aggravated by competition from the foreign banks (Borio, 1990;Taggart, 1988). Hence, as many economists have argued, the banks wereboth willing to take risks that are typically associated with lines of businessthat yield high returns, and were looking for alternative business activi-ties.13 In other words, the stage was set for introduction of banking productslike bridge and mezzanine financing, as well as high risk-high yield finan-cial instruments like LBO-financing junk bonds.
Search for a Rationale for the 1980s’ M&A WaveIt is evident that during the 1980s there existed both opportunities
and some incentive, in the form of tax related gains, for (predator) compa-nies to acquire others. However, the mere existence of opportunities, and taxrelated gains cannot possibly account for the large number of M&Asinvolving hundreds of billions of dollars! Hence, an explanation for the“wave” lies elsewhere.
A compelling, and intuitively appealing, explanation for the waveis that predator companies wanted to acquire companies that were underval-ued in the stock market because of under-performance. The implicit assump-tion underlying this line of argument is that the acquired companies, or atleast their core lines of businesses, could be turned around and madeprofitable subsequent to changes in organisational structure and the style offunctioning of the management.14 If this is indeed a valid explanation forthe M&A wave of the 1980s, we would expect to witness a significantamount of post-acquisition divestitures and, in some cases, sale of “non-core” lines of business by conglomerates to companies in the same lines ofbusiness as the sold units.
Both cross-sectional evidence, and case studies suggest that thisindeed was the case. For example, Shleifer and Vishny (1997), for example,find that in a sample of 62 hostile takeovers between 1984 and 1986 about
12 Specifically, while the borrowing/deposit rates were raised to maintain themarket share of the banks vis a vis the money market mutual funds, a substantial propor-tion of the banks’ assets were locked into low interest yielding securities that had beenissued in the 1960s.
13 Indeed, as noted in Box 1, only about 11 per cent of M&A activities wasfinanced with junk bonds. In other words, about 89 per cent of such activities was financedby conventional and investment banks.
14 Note, however, that while organisational changes can be effected to offer theincumbent management of the acquired company a better incentive structure to performwell—contracts involving both significant rewards and severe penalties—disbanding ofthe entire team of incumbent managers can adversely affect the health of the companybecause these managers possess “managerial rents” in the form of firm-specific and uniquetalents and skills (Zollo, 1998).
. . . the banks were
both willing to take
risks that are typically
associated with lines
of business that yield
high returns, and were
looking for alternative
business activities,
and thus the stage was
set for introduction of
banking products like
bridge and mezzanine
financing, as well as
high risk-high yield
financial instruments
like LBO-financing
junk bonds

46
I C R A B U L L E T I N
Money
Finance&O C T. � D E C . . 1 9 9 9
STAG
GERE
DBO
ARD
SUPE
R-M
AJOR
ITY
FAIR
PRIC
EPO
ISON
PILL
SDU
AL C
LASS
RECA
PITA
LISA
TION
SUMMARY OF PRE-OFFER TAKEOVER DEFENSES
Type of Description Defensive Impact Share PotentialDefense holder Effective-
Approval ness
Board is classified into 3 equal Bidder cannot obtain Required Moderategroups. Only one group is control of the targetelected each year. immediately after
obtaining a majorityof shares.
A high proportion of shares Increase the number Required Mildrequired to approve a merger, of shares required tousually 80 per cent. Board obtain control incan void the clause. hostile takeovers.
Super-majority provisions Prevent two-tier Required Mildwaived if bidder pays all takeover offers.stockholders the same price.
Rights to preferred stock issued Makes hostile tender Not Severeto shareholders. Rights can be offers prohibitively requiredexercised after a tender offer or expensive.the accumulation of a largeblock of shares by an outsideparty. In flip-over plansexercised rights can be used topurchase stock in the bidder onfavourable terms. In flip-inplans, exercised rights are re-purchased by the issuing firmat a substantial premium. Thebidding firm or large share-holder is excluded from therepurchase.
Distributes a new class of Allows incumbent Required Severeequities to shareholders with managers to obtain asuperior voting rights but majority of votesinferior dividends or marketabi- without owning ality. Allows shareholders to majority of theexchange the new shares for common stock.ordinary common stock.
Source: R.S. Ruback, “An Overview of Takeover Defenses,” (in) A.J. Auerbach (ed.)
Mergers and Acquisitions, The University of Chicago Press, 1988, pp. 54-55.

47
I C R A B U L L E T I N
Money
Finance&O C T. � D E C . . 1 9 9 9
30 per cent of the assets of the acquired companies was sold off withinthree years of acquisition.15 In as many as 70 per cent of cases, the sell-offswere to companies that were in the same lines of business. The findingsof the illuminating case study about the 1984 sell-off of O. M Scott andSons Company, a part of the ITT “empire,” in the form of a divisionalleveraged buyout, is in agreement with this empirical evidence. Bakers andWruck (1997), the authors of the case study, have noted that the divestituredecision was prompted by decline in O. M. Scott’s financial performanceduring the period in which it was a fully owned subsidiary of ITT.Finally, there is agreement about the fact that, in general, the financialperformance of the acquiring companies was superior to the performance ofthe acquired companies, after controlling for the respective industryperformances.
Can we, therefore, hypothesise that M&A was a process aimed atrealising the potential of (acquired) companies through reallocation of theirassets to those that could best use them? Unfortunately, such a hypothesisdoes not stand the trial of close scrutiny. Economists have attempted toidentify potential gains from M&A activities using three different researchmethodologies (Rhoades, 1994; Peristiani, 1997). First, they have comparedthe pre-merger and post-merger financial performances of the acquiringcompany. Second, they compare the performance of the stock prices of thepredator firms before and after the announcement of M&As.16 The assump-tion underlying this line of research is that in an efficient capital market allinformation and expectation about a company’s future performance will beaccurately reflected by its stock price. Third, they have constructed “effi-cient” cost curves/frontiers for the predator and the acquired companies, andhave compared the deviations of the pre- and post-merger costs from therespective minimum costs implicit in the efficient frontier. It is obvious thatif a merger is efficiency enhancing, the post-merger deviation will besmaller than the pre-merger deviation.
The research methodologies are not devoid of shortcomings. Forexample, while it may take a company a few years to reap the benefits ofM&A by way of economies of scale and scope, and perhaps better govern-ance, after a couple of years it becomes difficult to distinguish gains andlosses arising out of mergers from those arising out of other factors likeproductivity gains on account of technological advancement. Moreover,samples used in empirical research typically do not include companies thathave acquired more than one company during the target period. Now, thesecompanies may go through the process of M&A more than once eitherbecause ex ante they were good at assimilating other companies in similar
15 The proportion of assets sold off was higher in the case of LBOs and stood at44 per cent in the sample of Shleifer and Vishny (1997).
16 The average size of the “window” over which the stocks’ performances areobserved is about 20 days, from 10 days prior to the announcement of the merger/acquisition till 10 days after it. However, the window has been as small as 10 days, and aslarge as 40 weeks.
. . . unfortunately, the
hypothesis that M&A
was a process aimed
at realising the
potential of (acquired)
companies through
reallocation of their
assets to those that
could best use them
does not stand the trial
of close scrutiny

48
I C R A B U L L E T I N
Money
Finance&O C T. � D E C . . 1 9 9 9
B o x 3Summary of Post-Offer Takeover Defenses
Type of Description Defensive ImpactDefense
Repurchase of block of issues held by a Eliminates a potentialshareholder, usually at a premium. bidder.
Limits ownership by a given firm for a Eliminates a potentialspecified time period. May include an bidder.agreement with a large shareholder tovote holdings with the board.
Suit filed against bidder for violating Delays bidder.antitrust or securities laws.
Assets bought that a bidder does not want Makes the target lessor that will create antitrust problems. valuable.Assets sold that the bidder wants.
Shares issued to a friendly third party or Makes it more difficultnumber of shareholders increased. Shares to obtain the number ofrepurchased at a premium from the existing shares required for ashareholders. hostile bidder to achieve
control.
Source: R.S. Ruback, “An Overview of Takeover Defenses,” (in) A.J. Auerbach (ed.)Mergers and Acquisitions, The University of Chicago Press, 1988, p. 62.
TAR
GET
EDR
E-PU
RCH
ASE
STAN
DSTI
LLAG
REEM
ENT
LITI
GA-
TIO
N
ASSE
TR
ESTR
UCT
UR
-IN
G
LIAB
ILIT
YR
ESTR
UCT
UR
ING
lines of business, or because they rapidly learnt through initial acquisitionshow to assimilate two or more companies optimally. In such an event,omitting such companies from a sample might bias the conclusions drawnfrom the empirical exercises (Pilloff and Santomero, 1996).
But no research methodology is fully secure against pitfalls, andhence the empirical results cannot be completely overruled on the basis oftheir methodological shortcomings. However, taken as a whole, theseresults bring into question the efficacy of M&As from the individual compa-nies’ perspective. Both operating performance studies and event studiesindicate that post-M&A companies in the respective samples did not witnessstatistically significant efficiency gain (Rhoades, 1994, p. 10-35). Indeed, inmany cases the acquiring company’s efficiency change as well as returns onits equity were negative. Even more revealing is the fact that post-M&Aefficiency gains have not observed even in the banking sector, where theeconomies of scale and scope can be reaped easier and faster as compared
. . . both operating
performance studies
and event studies
indicate that post-M&A
companies in the
respective samples did
not witness
statistically significant
efficiency gain . . .

49
I C R A B U L L E T I N
Money
Finance&O C T. � D E C . . 1 9 9 9
to the non-financial sector (Pilloff and Santomero, 1996; Peristiani, 1997).17
Sans efficiency gains, and gains in shareholder value, why would acompany want to acquire another company that is presumably not in thepink of health? Indeed, early M&A attempts may have been precipitated byvisions of post-merger efficiency gains, but if we are to assume that themanagers act as rational economic agents, it is difficult to justify why themerger wave continued through 1987,18 when evidence of actual gains werehard to come by. In line with Jensen’s (1987) view, there seems to be ageneral agreement among economists that acquisitions during the 1980swere often fuelled by the coexistence of the managers’ desire to expandoperations and hence their own horizons of influence, and the willingness ofbanks and private financiers to provide funding for purchase of the targetcompanies’ equity. Pilloff and Santomero (1996) suggest that the attemptsto maximise the utility of the acquiring managers resulted in an accommo-dation of the management and shareholders of the target companies in theform of high takeover premia over the market prices of the shares. The highpremia, which resulted in high leverage and high levels of interest payment,is said to have been responsible for the sub-expectation post-M&A perform-ance of the companies.19
Banks’ Role in Mergers and AcquisitionsAs indicated above, banks and private financiers played an impor-
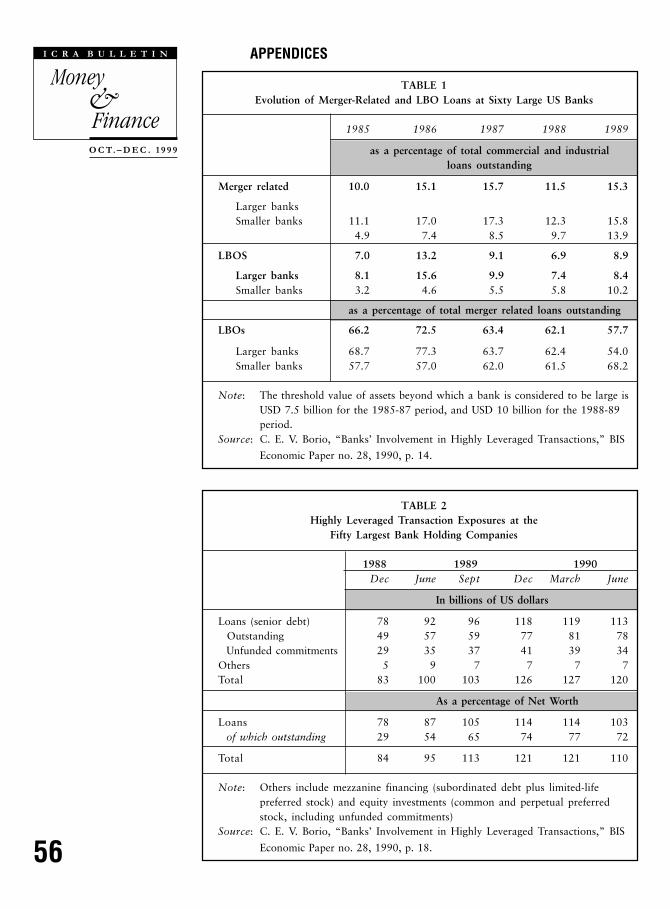
tant role in facilitating mergers and acquisitions during the 1980s. Indeed,by 1986, credit used for M&As accounted for more than 15 per cent of thebanks’ outstanding advances to the commercial and industrial sectors, andof this LBOs accounted for about 13 per cent [see Table 1 in the Appendix].By the end of 1988, the credit outstanding of the 50 largest bank holding
17 Pilloff and Santomero (1996), however, cite a paper that has claimed to havefound evidence of post-M&A profitability gains in the banking sector, using frontieranalysis. But, according to the same paper, evidence of profitability gains was not foundusing stylised analysis of financial ratios.
18 For all we know, the M&A wave may have been brought to a halt by theemergence of the “second generation” anti-takeover laws enacted by the state govern-ments , the granting of legal sanctity to poison pills [see box 2 for a description of pre-biddefensive tactics], the collapse of the junk bond market, and the increased fragility of theUS banking system towards the end of 1980s.
19 In other words, the present value (or more!) of the entire expected gain frommerger between two companies was paid in the form of a premium by the acquiringcompany to the shareholders of the target company. Andrade and Kaplan (1998) arguethat high leverage was the main reason for financial distress among post-M&A companies.In their sample, highly leveraged firms had a median coverage ratio of 0.98, against theindustry median of 3.87. The impact of operating margins on the extent of the distress wasfound to be marginal; in the absence of a reduction of operating margins, the coverageratio of distressed firms would have been 1.08. However, the negative impact of highleverage possibly kicked in if it was above some threshold level. Several studies haveconfirmed that subsequent to an increase in leverage, either for acquisition or to effect apoison pill strategy, a company’s investment in non-core areas declined significantly, andthereby had a salutary impact on its operating performance (Safieddine and Titman,1997).
. . . early M&A
attempts may have
been precipitated by
visions of post-merger
efficiency gains, but if
we are to assume that
the managers act as
rational economic
agents, it is difficult to
justify why the merger
wave continued
through 1987 . . .

50
I C R A B U L L E T I N
Money
Finance&O C T. � D E C . . 1 9 9 9
companies (BHCs) in the US, on account of highly leveraged transactions,stood at USD 49 billion, i.e., 29 per cent of the combined equity capital ofthese BHCs [see Table 2].20
Apart from term loans and revolving credit, the banks’ exposure tocompanies involved in M&As included bridge loans (Borio, 1990). Theseloans, an innovation of the M&A era of the 1980s, were usually of short tomedium term maturity, and were typically repaid out of proceeds from saleof financial and/or real assets. They served two important purposes. First,they helped a predator company add credibility to its tender offer for atarget company’s shares by backing up the offer with ready cash, till thepredator could arrange for funds by way of issue of debt instruments and/orequity. Second, bridge loans could be used to meet post-merger financialobligations till the new entity could sell its assets to raise the necessaryamount. 21
Bridge loans were typically collateralised, the collateral for suchloans being the assets of the target companies and/or the equity of subsidiar-ies of the predator companies. However, the US banks also sold loansassociated with highly leveraged transactions to other banks.22 The sale ofloans took two different forms. In case of an assignment, the original lendergave up all its rights and obligations with respect to the relevant loan to thepurchasing bank. In other words, subsequent to the sale, there was nofurther relationship between the original lender and the borrowing company.The “purchasing” bank could resell the loan subsequently to a third bank.In case of an inter-bank participation contract, on the other hand, theoriginal borrower continued to be involved with the payment schedule andthe terms of the loan. The bank “purchasing” the loan, however, was giventhe sole right to determine the interest rate and length of maturity; but itcould not resell the loan.23
The banks’ participation in highly leveraged transactions markedthe beginning of a new paradigm in lending. The banks were lending moneynot so much on the basis of the strength of the balance sheets of the compa-nies, but on the basis of their expectations about the future cash flows of thecompanies, subsequent to mergers. Further, actual loans were being supple-mented by off-balance-sheet commitments that substantially increased theexposure of the banks to the companies in question. Given the ex postevidence that the highly leveraged companies were often in financial distress(Andrade and Kaplan, 1998), it was safe to presume that the riskiness of the
20 The implication of this observation for the capital requirement of a bank thatis subject to minimum capital adequacy ratio, a la Basle norms, is fairly obvious.
21 A 1989 study involving sixty large US banks indicated that about 10 per centof bridge loans were repaid by issue of bonds, while 30 per cent were repaid using fundsgenerated from asset sales.
22 However, as a consequence of the heterogeneity in the nature of the underly-ing loans, this de facto asset backed securities market did not take off. As late as 1990,loans valued at only about USD 1.5 billion were securitised.
23 Given the difference with respect to the extent of involvement of the“purchasing” bank, in case of participation contracts the original banks were not allowedto remove the loans from their balance sheets.
. . . the banks’
participation in highly
leveraged transactions
marked the beginning
of a new paradigm in
lending. The banks
were lending money
not so much on the
basis of the strength of
the balance sheets of
the companies, but on
the basis of their
expectations about the
future cash flows of
the companies,
subsequent to mergers

51
I C R A B U L L E T I N
Money
Finance&O C T. � D E C . . 1 9 9 9
banks’ credit portfolio was on the rise. The manifestation of the higher riskwas the higher interest rates on the credit disbursed for highly leveragedtransactions.
The US banking industry was marked by widespread financialdistress between the late 1980s and the early 1990s. Its exposure to highlyleveraged transaction was certainly not the only reason for its distress. Thebanking system was also over-exposed to real estate, especially in regionslike New England, and other high risk assets (Randall, 1993). However, it isdifficult to get away from the possibility that the banks’ exposure to M&Arelated credit and junk bonds may have facilitated the banking crisis, atleast in part. At the very least, there was a case for establishing prudentialnorms aimed at regulating the banks’ exposure to M&A.24
Summing UpThe M&A wave in the US increased the leverage ratio of many
companies beyond reasonable thresholds, and it is safe to assume that itcontributed to the fragility of the banking system in the US during the1980s. However, from a “macro” economic point of view, the M&A wavedid serve and useful purpose. The internal capital markets created by the1960s’ wave led to underpricing of capital, and hence encouraged invest-ments in projects that were not necessarily viable. At the same time, the sizeof the diversified companies helped obscure the managements’ performance,and hence paved the way for managerial moral hazard. As we have seen,an important characteristic of the M&A wave of the 1980s was the breakingup of conglomerates, and the sale of the acquired companies’ units to othercompanies that were in related lines of business. In other words, the M&Awave served the useful purpose of reallocation of the economy’s industrialresources to those that could use these resources most efficiently. At the sametime, the wave forced companies to raise funds from the “external” capitalmarket, thereby eliminating the problem of underpricing of financialresources.
Even if M&A is efficiency augmenting in a “macro” sense, one canjustifiably seek clarification about the impact of M&As like employmentand investment in areas like research and development. Indeed, there iswidespread apprehension about the possibility of post-merger layoffs andwage-cuts, and underinvestment in research and development, given thecapital intensive nature of such activities and the cash crunch facing highlyleveraged post-merger corporate entities. The US experience during the1980s, which cannot necessarily be generalised, suggests that M&A doesnot always lead to wide spread layoffs. Specifically, as argued by Shleiferand Vishny (1997), there is no evidence of a reduction in research anddevelopment related investments of companies that were involved in M&Aduring the 1980s; nor evidence of substantial wage cuts for employees of
24 Indeed, some of the later norms did attempt to regulate the banks’ exposure inthe form of off-balance-sheet activities, and the riskiness of the banks’ exposures to M&Arelated lending is at least partly endogenised by the introduction of the (minimum) capitaladequacy ratio.
. . . it is difficult to get
away from the
possibility that the
banks’ exposure to
M&A related credit and
junk bonds may have
facilitated the banking
crisis, at least in part

52
I C R A B U L L E T I N
Money
Finance&O C T. � D E C . . 1 9 9 9
. . . with the growth of
global trade and the
abolition of a licensing
system, it is difficult
for any company to
acquire monopolistic
powers and, more
importantly, sustain it
for a reasonable length
of time . . . it is today
difficult for the
management of
companies to hide
under-performance
and (collective)
myopia using size as a
barrier to effective
monitoring
POST-MERGER EFFICIENCY IN THE BANKING SECTOR
Several financial economists have attempted to identify the impact of M&A activity withinthe banking sector, on the efficiency of the banks. The sample sizes for these empiricalexercises have been as small as 11 and as large as 469, the average size being in excessof 100. These economists verified the impact of M&As on several performance indicators:returns on assets and equity, ratios of total expense to assets and non-interest expenses toassets, abnormal return on stock within a time period that includes the date of announce-ment of the merger/acquisition, and even X-efficiency. Interestingly, most of the studiesundertaken during the 1980s have focused on abnormal returns on stock, while thestudies conducted during the 1990s used financial ratios as the basis for their evaluation(see Rhoades, 1994).
Some of the interesting findings of these empirical investigations that were replicatedacross studies are as follows:
• While the acquired firms’ shareholders sometimes enjoyed abnormal returns ontheir equity investment after the announcement of the merger/acquisition, theshareholders of the acquiring firms rarely gained significantly.
• The returns on assets and equity of the merged bank were rarely significantlyhigher than the combined returns of the acquiring and the acquired banks prior tomerger, if at all.
• With a few exceptions – largely in the context of mergers among banks belongingto the same holding companies – there was no significant improvement in costefficiency of the banks subsequent to merger.
• While the acquiring banks were, in general, more efficient and profitable than theacquired banks, both were typically less efficient and profitable than the mostefficient or “best practice” banks.
As discussed in the paper, the methodologies associated with these empirical investiga-tions were not devoid of shortcomings. However, the similarity of the findings acrossstudies and samples suggests that it would perhaps be reasonable to conclude thatmergers involving two banks in the US, during the 1980s, were by and large not success-ful in augmenting either the profitability or the efficiency of the acquiring and the acquiredbanks. While the rationale for such an experience is not obvious, history does not seem tobe on the side of bank mergers in the US.
these companies. Further, while there were layoffs, the magnitude of thelayoffs was not alarming. For example, between 1984 and 1986, a total of26,000 employees lost their jobs subsequent to mergers. They accounted for2.5 per cent of the total employees of the companies involved in M&Aduring that period. Importantly, layoff was much more significant amongwhite collared workers than among blue collared employees.
At some point of time in history, when formation of monopolies andoligopolies was a viable threat, the efficacy of M&A as an economicactivity was perhaps questionable, especially because acquisition during theearlier part of the 20th century resulted in consolidation of economic power.

53
I C R A B U L L E T I N
Money
Finance&O C T. � D E C . . 1 9 9 9
However, two significant changes have taken place in most major econo-mies since then. First, with the growth of global trade and the abolition of alicensing system, it is difficult for any company to acquire monopolisticpowers and, more importantly, sustain it for a reasonable length of time.25
Second, the emergence of capital markets as the main source of finance, andincreased concentration of equity in the hands of institutional investors havebrought market discipline to the fore, and, at the same time, there has beena significant improvement in the disclosure norms facing the companies.These changes have made it difficult for the management of companies tohide under-performance and (collective) myopia using size as a barrier toeffective monitoring. In other words, in this day and age, any economic orpolitical ideology that attempts to restrict or eliminate M&A may beanachronistic.26
The entire purpose of having a competitive market economy is toattain a high level of allocative efficiency. At the same time, the high levelof efficiency can be preserved only with the help of “creative destruction.”In a textbook example, creative destruction is facilitated by free entry andexit of companies to and from the market. In the more real world, M&A isanother way of facilitating creative destruction—and achieving economiesof scale and scope—one that reduces the costs associated with entry andexit. This view does not waive away the problems and risks that areassociated with managerial hubris, high leverage ratios of companies, andfragility of the financial system. But the solution does not lie in the elimina-tion of M&A activities, with or without the help of anti-trust legislation. Ithas to involve strong disclosure norms and pro-active prudential regulationgoverning M&A, issue of M&A-related securities, and bank lending, not tomention the creation of a social safety net. To recapitulate, economicliberalisation is a process of evolution where risks are inevitable but wheredecisions have to be taken on the basis of the risk-reward ratio, not on thebasis of risks alone. If M&As improve allocational efficiency significantly,therefore, such that the risk-adjusted gain from such activity is perceived tobe fairly high at an aggregate level, they should be viewed as an integraland important part of the process of economic liberalisation, withoutmalice.
25 Shleifer and Vishny (1997) highlight an indirect evidence that suggest that bythe 1980s M&As were no longer being viewed as events facilitating concentration ofmonopolistic and oligopolistic powers in the hands of the acquiring companies. Economictheory suggests that if competition within an industry is expected to decline, then theinvestors should expect an increase in the future earnings of the incumbent companies,thereby having a salutary impact on the share prices of these companies. However, it wasseen that, more often than not, share prices of companies within an industry fell across theboard when an anti-competitive merger was blocked by the antitrust authorities. In otherwords, prima facie it can be argued that investors felt that the possible efficiency gainsarising out of M&A would far outweigh the losses on account of decrease in competition.
26 Note that such a possibility exists even in market friendly countries. In the US,for example, the initial wave of M&As during the 1980s was followed by the rise of the“second generation” anti-trust legislation at the state level which aimed at makingacquisition of companies difficult, especially in the case of cross-border acquisitions.
. . . in the more real
world, M&A is another
way of facilitating
creative destruction—
and achieving
economies of scale
and scope—one that
reduces the costs
associated with entry
and exit

54
I C R A B U L L E T I N
Money
Finance&O C T. � D E C . . 1 9 9 9
REFERENCESAndrade, G. and S. N. Kaplan (1998) “How Costly is Financial (Not Economic)
Distress? Evidence from Highly Leveraged Transactions that Became Distressed,” Journalof Finance, LIII(5): 1443-94.
Auerbach, A. J. and D. Reishus (1988) “The Impact of Taxation on Mergers andAcquisitions,” (in) A. J. Auerbach (ed.) Mergers and Acquisitions, The University ofChicago Press.
Baker, G. and K. Wruck, (1997) “Lessons from a Middle Market LBO: The Caseof OM Scotty,” (in) D. H. Chew (ed.) Studies in International Corporate Finance andGovernance Systems, Oxford University Press.
Bhide, A. (1997) “Reversing Corporate Diversification,” (in) D. H. Chew (ed.).Bittlingmayer, G. (1998) “The Market for Corporate Control (Including
Takeovers),” Working Paper, Graduate School of Management, University of California atDavis.
Borio, C. E. V. (1990) “Banks’ Involvement in Highly Leveraged Transactions,”Economic Paper No. 28, Bank for International Settlements.
Boyle, G. W., R. B. Carter and R. D. Stover (1998) “Extraordinary AntitrustProvisions and Insider Ownership Structure: The Case of Converting Savings and Loans,”Journal of Financial and Quantitative Analysis, 33(2): 291-304.
Brewer III, Elijah and W. E. Jackson III (1997) “Requiem for a Market Maker:The Case of Drexel Burnham Lambert and Below-Investment-Grade Bonds,” Workingpaper No. WP-97-25, Federal Reserve Bank of Chicago.
Brickley, J. A., J. L. Coles and R. L. Terry (1994) “Outside Directors and theAdoption of Poison Pills,” Journal of Financial Economics, 35: 371-390.
Browne, L. E. and E. S. Rosengren (1987) “Are Hostile Takeovers Different?”(in) L. E. Browne and E. S. Rosengren (eds.) The Merger Boom, Federal Reserve Bank ofBoston.
Bulow, J, M. Huang and P. Klemperer (1996) “Toeholds and Takeovers,”Working Paper, Graduate School of Business, Stanford University.
Caves, W. J. (1987) “Effects of Mergers and Acquisitions on the Economy: AnIndustrial Organization Perspective,” (in) L. E. Browne and E. S. Rosengren (eds.).
Donaldson, G. (1997) “The Corporate Restructuring of the 1980s – And ItsImport for the 1990s,” (in) D. H. Chew (ed.).
Garvy, G. T. and G. Hanka (1999) “Capital Structure and Corporate Control:The Effect of Antitakeover Statutes on Firm Leverage,” Journal of Finance, LIV(2): 519-546.
Golbe, D. L. and L. J. White (1988) “Mergers and Acquisitions in the USEconomy: An Aggregate and Historical Overview,” (in) A. J. Auerbach, (ed.).
Hotchkiss, E. S. (1998) “Acquisitions as a Means of Restructuring Firms inChapter 11,” Journal of Financial Intermediation, 7: 240-262.
Hubbard, R. G. and D. Pulia (1995) “Benefits of Control, Managerial Owner-ship, and the Stock Returns of Acquiring Firms,” NBER Working Paper No. 5079.
______ (1998) “A Re-examination of the Conglomerate Merger Wave in the1960s: An Internal Capital Market’s View,” NBER Working Paper No. 6539.
Jarrell, G. A. (1987) “Financial Innovation and Corporate Mergers,” (in) L. E.Browne and E. S. Rosengren (eds.).
Jensen, M. C. (1987) “The Free Cash Flow Theory of Takeovers: A FinancialPerspective on Mergers and Acquisitions and the Economy,” (in) L. E. Browne and E. S.Rosengren (eds.).
Mahoney, P. and M. Weinstein (1999) “The Appraisal Remedy and MergerPremiums,” Working Paper, School of Law, University of Virginia.
Pilloff, S. J. and A. M. Santomero (1996) “The Value Effects of Bank Mergersand Acquisitions,” Working Paper No. 97-07, Financial Institutions Center, The WhartonSchool.
Peristiani, S. (1997) “Do Mergers Improve the X-efficiency and Scale Efficiency

55
I C R A B U L L E T I N
Money
Finance&O C T. � D E C . . 1 9 9 9
of US Banks? Evidence from the 1980s,” Journal of Money Credit and Banking, 29(3):326-337.
Randall, R. E. (ed. 1993) Safeguarding the Banking System in an Environmentof Financial Cycles, Federal Reserve Bank of Boston.
Ravenscraft, D. J. (1987) “The 1980s Merger Wave: An Industrial OrganizationPerspective,” (in) L. E. Browne and E. S. Rosengren (eds.).
Rhoades, S. A. (1994) “A Summary of Merger Performance Studies in Banking,198093, and an Assessment of the “Operating Performance” and “Event Study” Method-ologies,” Working Paper No. 167, Board of Governors of the Federal Reserve System.
Ruback, R. S. (1988) “An Overview of Takeover Defenses,” (in) A. J. Auerbach(ed.).
Safieddine, A. and S. Titman (1997) “Debt and Corporate Performance:Evidence from Unsuccessful Takeovers,” NBER Working Paper No. 6068.
Shleifer, A. and R. W. Vishny (1988) “Management Buyouts as a Response toMarket Pressure,” (in) A. J. Auerbach (ed.).
______ (1997) “The Takeover Wave of the 1980s,” (in) D. H. Chew (ed.).Singh, R. (1995) “Takeover Bidding with Toeholds,” Working Paper, Olin School
of Business, Washington University at St. Louis.Taggart, R. A., Jr. (1988) “The Growth of the “Junk” Bond Market and Its Role
in Financing Takeovers,” (in) A. J. Auerbach (ed.).Zollo, M. (1997) “Strategies or Routines? Knowledge Codification, Path-
Dependence and the Evolution of Post-Acquisition Integration Practices in the US BankingIndustry,” Working Paper No. 97-10-C, Financial Institutions Center, The Wharton School,
University of Pennsylvania.
56
I C R A B U L L E T I N
Money
Finance&O C T. � D E C . . 1 9 9 9
APPENDICES
TABLE 1Evolution of Merger-Related and LBO Loans at Sixty Large US Banks
1985 1986 1987 1988 1989
as a percentage of total commercial and industrialloans outstanding
Merger related 10.0 15.1 15.7 11.5 15.3
Larger banksSmaller banks 11.1 17.0 17.3 12.3 15.8
4.9 7.4 8.5 9.7 13.9
LBOS 7.0 13.2 9.1 6.9 8.9
Larger banks 8.1 15.6 9.9 7.4 8.4Smaller banks 3.2 4.6 5.5 5.8 10.2
as a percentage of total merger related loans outstanding
LBOs 66.2 72.5 63.4 62.1 57.7
Larger banks 68.7 77.3 63.7 62.4 54.0Smaller banks 57.7 57.0 62.0 61.5 68.2
Note: The threshold value of assets beyond which a bank is considered to be large isUSD 7.5 billion for the 1985-87 period, and USD 10 billion for the 1988-89period.
Source: C. E. V. Borio, “Banks’ Involvement in Highly Leveraged Transactions,” BIS
Economic Paper no. 28, 1990, p. 14.
TABLE 2Highly Leveraged Transaction Exposures at the
Fifty Largest Bank Holding Companies
1988 1989 1990Dec June Sept Dec March June
In billions of US dollars
Loans (senior debt) 78 92 96 118 119 113 Outstanding 49 57 59 77 81 78 Unfunded commitments 29 35 37 41 39 34Others 5 9 7 7 7 7Total 83 100 103 126 127 120
As a percentage of Net Worth
Loans 78 87 105 114 114 103 of which outstanding 29 54 65 74 77 72
Total 84 95 113 121 121 110
Note: Others include mezzanine financing (subordinated debt plus limited-lifepreferred stock) and equity investments (common and perpetual preferredstock, including unfunded commitments)
Source: C. E. V. Borio, “Banks’ Involvement in Highly Leveraged Transactions,” BIS
Economic Paper no. 28, 1990, p. 18.

57
I C R A B U L L E T I N
Money
Finance&O C T. � D E C . . 1 9 9 9
TABLE 3LBO Example: Owens-Illinois
Financing of transaction Final CapitalTender offer Merger date Structure
USD per cent USD per cent USD per centbillion share billion share billion share
Senior bank debt 3.0 75 2.7 63 2.7 60
Subordinated debt 0.8 20 1.4 31 1.4 30 Senior 0.8 17 0.8 16 Junior zero-coupon 0.6 15 0.6 14 0.6 13 KKR notes 0.2 5
Excess cash 0.1 2
Equity 0.2 5 0.2 4 0.2 4
Remaining pre-existing debt 0.3 7
Total 3.9 100 4.3 100 4.4 100
Note: The transaction involved the purchase of the existing equity and over halfof the pre-existing debt given that existing indentures prevented merger.Bridge financing was supplied by Kohlberg, Kravis, Roberts and Co. (KKR)and Morgan Stanley in the form of KKR subordinated notes and juniorzero-coupon debt. On the merger date bridge financing and part of thesenior bank debt was refinanced with subordinated debt.
Source: C. E. V. Borio, “Banks’ Involvement in Highly Leveraged Transactions,”BIS Economic Paper no. 28, 1990, p. 7.
TABLE 4Characteristics of Bank Lending
Maturity Interest Rate Collateral
Form Margin Existence Form
Bridge loans 0.5 – 2.0 Floating Libor + Common - Subsidiaries’ stocksyears 200–300 bps - Assets sold
Revolving credit 1 – 10 Floating Libor + Common - Receivablesyears 200–300 bps - Inventory
Term loans 4 – 10 Floating Libor + Common - Subsidiaries’ stocksyears 200–300 bps - Subsidiaries’
guarantees- General lien on assets
Source: C. E. V. Borio, “Banks’ Involvement in Highly Leveraged Transactions,” BISEconomic Paper no. 28, 1990, p. 22.

58
I C R A B U L L E T I N
Money
Finance&O C T. � D E C . . 1 9 9 9
TABLE 5Composition of US Short Term Business Credit
1973 1977 1981 1985 1988 1989
in percentage
Commercial banks 95 93 87 87 85 83 US 87 83 68 67 62 59 of which: Large banks 64 55 50 45 43 41 non-US 8 10 19 19 24 24
Commercial paper 5 7 13 14 15 17
Total 100 100 100 100 100 100
Memorandum item:Non-US banks’ share ofbank lending 8 11 21 22 28 29
Source: C. E. V. Borio, “Banks’ Involvement in Highly Leveraged Transactions,” BISEconomic Paper no. 28, 1990, p. 29.
TABLE 6Top 10 Junk Bond Underwriters in 1989
Investment Bank Amount
In USD Million Share
Drexel Burnham Lambert 9,748.6 38.6%
Shearson Lehman 2,361.0 9.3%
Morgan Stanley 2,349.7 9.3%
Merrill Lynch 2,252.5 8.9%
Goldman Sachs 2,195.4 8.9%
First Boston 2,014.9 8.0%
Salomon Brothers 1,508.3 6.0%
Donaldson Lufkin 1,308.9 5.2%
Bear Stearns 547.0 2.2%
Kidder Peabody 375.0 1.5%
Source: E. Brewer III and W. E. Jackson III, “Requiem for a Market Maker: TheCase for Drexel Burnham Lambert and Below-Investment-Grade Bonds,”Working Paper No. WP-97-25, Federal Reserve Bank of Chicago, 1997,
p. 40.

ICRA LIMITED
CORPORATE & REGISTERED OFFICENEW DELHIKailash Building, 4th Floor26, Kasturba Gandhi Marg,New Delhi 110 001Tel. : +(91 11) 335 7940-50Fax : +(91 11) 335 7014,3355293
BRANCHESMUMBAIElectric Mansion, 3rd Floor,Appasaheb Marathe Marg,Prabhadevi, Mumbai 400 025Tel. : +(91 22) 433 1046/53/62/74/86/87Fax : +(91 22) 433 1390
CHENNAIKarumuttu Centre, 5th Floor,498, Anna Salai, Nandanam,Chennai 600 035Tel. : +(91 44) 434 0043/9659/8080,433 0724,433 3293/94Fax : +(91 44) 434 3663
KOLKATAFMC Fortuna, A-10&11, 3rd Floor,234/3A, A.J.C. Bose Road,Kolkata 700 020Tel. : +(91 33) 287 0450,240 6617/8839,280 0008Fax : +(91 33) 247 0728
BANGALOREVayudooth Chambers, 2nd Floor,Trinity Circle, 15-16 M.G. Road,Bangalore 560 001Tel. : +(91 80) 559 7401/4049/5320326Fax : +(91 80) 559 4065
AHMEDABAD907-908 Sakar –ll, Ellisbridge,Opp. Town Hall,Ahmedabad 380 006Tel. : +(91 79) 658 4924/5049/2008/5494Fax : +(91 79) 658 4924
HYDERABAD‘Greendale’, 1st Floor,No. 7-1-24/2/D, 102, Ameerpet,Hyderabad 500 016Tel. : +(91 40) 373 5061/7251Fax : +(91 40) 373 5152
CHANDIGARHSCO 24-25, 1st Floor,Sector 9D, Madhya Marg,Chandigarh 160 017Tel. : +(91 172) 743 776, 743 882Fax : +(91 172) 746 068
PUNE5A, 5th Floor, Symphony,S. No. 210, CTS 3202,Rane Hills Road, Shivajinagar,Pune 411 007Tel. : +(91 20) 552 0194/95/96Fax : +(91 20) 5539231
Copyright, ICRA Limited, 26 Kasturba Gandhi Marg, New Delhi – 110001
None of the Information contained in the publication may be copied otherwise reproduced, repackaged,further transmitted, disseminated, redistributed, or resold, or stored for subsequent use for any suchpurpose, in whole or in part, in any form or manner or by means whatsoever, by any person without ICRA’sprior written permission.

Disclaimer
All information contained herein is obtained by ICRA from sources believed by it to be accurate andreasonable. Although reasonable care has been taken to ensure that the information herein is true, suchinformation is provided ‘as is’ without any warranty of any kind and ICRA in particular, makes norepresentation or warranty, express or implied, as to the accuracy, timelines or completeness of any suchinformation. All information contained herein must be construed solely as statements of opinion and ICRAshall not be liable for any loses incurred by users from any use of publication or its contents.