
Merely Incidental?: Effects of Response Format on Self ...
24
Merely Incidental?: Effects of Response Format on Self-reported Behavior Randall K. Thomas 1 and Jonathan D. Klein 2 Surveys have often employed two different self-report formats when gathering information on a series of behaviors or events: 1) a yes – no grid format (answer “yes” or “no” if the behavior or event has occurred) or 2) a multiple response list format (“select all that apply”). In a series of five web-based experiments, these two behavioral self-report formats were compared. We found consistent and significant differences – using yes – no grids yielded higher endorsement rates than obtained using multiple response list formats. These differences were obtained regardless of topic or language and country of residence of respondents. Key words: Behavioral self-report; Internet survey methods; response format effects; survey mode effects. 1. Introduction A common goal of a survey is to determine whether a person has ever engaged in a specific behavior, owned a particular product, or experienced an event of interest. Some have pointed out the difficulties in obtaining accurate behavioral information in self-report surveys (e.g., Lee, Hu, and Toh 2000; Schwarz 1999; Schwarz and Oyserman 2001). Others (e.g., Chang and Krosnick 2004) have indicated that, for behaviors with objective benchmarks, self-reported information preserves both order and relative frequency with a fair degree of correspondence to reality. Self-reported information serves many functions. Questions concerning behaviors and events often perform a crucial respondent screening function that determines which questions to subsequently ask respondents. Self-reported behaviors or events also serve a function for sampling (Levy and Lemeshow 1999). If the number of people who engage in a behavior or experience an event is lower than anticipated, more respondents may be needed to obtain the necessary number of respondents to make stable inferences for analytic purposes. When more respondents are required, study costs increase and longer field periods are required. Conversely, if the self-reported incidence is greater than expected, more people may participate than needed for analytic purposes. This can cause q Statistics Sweden 1 Harris Interactive, 135 Corporate Woods, Rochester, New York 14623, U.S.A. Email: [email protected] 2 University of Rochester, Rochester, NY 14627, U.S.A. Email: [email protected] Acknowledgment: Portions of this article were presented at the 58th Annual Conference of the American Association for Public Opinion Research AAPOR in Nashville, Tennessee, May 2003 and other portions were presented at the 59th Annual Conference of the American Association for Public Opinion Research in Phoenix, Arizona, May, 2004. Many thanks to Susan Behnke and Alyssa Johnson for their reviews of earlier drafts of this document and to the four anonymous reviewers for their keen insights and suggestions. Journal of Official Statistics, Vol. 22, No. 2, 2006, pp. 221–244
Transcript of Merely Incidental?: Effects of Response Format on Self ...

Merely Incidental?: Effects of ResponseFormat on Self-reported Behavior
Randall K. Thomas1 and Jonathan D. Klein2
Surveys have often employed two different self-report formats when gathering information ona series of behaviors or events: 1) a yes–no grid format (answer “yes” or “no” if the behavioror event has occurred) or 2) a multiple response list format (“select all that apply”). In a seriesof five web-based experiments, these two behavioral self-report formats were compared. Wefound consistent and significant differences – using yes–no grids yielded higher endorsementrates than obtained using multiple response list formats. These differences were obtainedregardless of topic or language and country of residence of respondents.
Key words: Behavioral self-report; Internet survey methods; response format effects; surveymode effects.
1. Introduction
A common goal of a survey is to determine whether a person has ever engaged in a specific
behavior, owned a particular product, or experienced an event of interest. Some have
pointed out the difficulties in obtaining accurate behavioral information in self-report
surveys (e.g., Lee, Hu, and Toh 2000; Schwarz 1999; Schwarz and Oyserman 2001).
Others (e.g., Chang and Krosnick 2004) have indicated that, for behaviors with objective
benchmarks, self-reported information preserves both order and relative frequency with a
fair degree of correspondence to reality.
Self-reported information serves many functions. Questions concerning behaviors and
events often perform a crucial respondent screening function that determines which
questions to subsequently ask respondents. Self-reported behaviors or events also serve a
function for sampling (Levy and Lemeshow 1999). If the number of people who engage in
a behavior or experience an event is lower than anticipated, more respondents may be
needed to obtain the necessary number of respondents to make stable inferences for
analytic purposes. When more respondents are required, study costs increase and longer
field periods are required. Conversely, if the self-reported incidence is greater than
expected, more people may participate than needed for analytic purposes. This can cause
q Statistics Sweden
1 Harris Interactive, 135 Corporate Woods, Rochester, New York 14623, U.S.A. Email:[email protected] University of Rochester, Rochester, NY 14627, U.S.A. Email: [email protected]: Portions of this article were presented at the 58th Annual Conference of the AmericanAssociation for Public Opinion Research AAPOR in Nashville, Tennessee, May 2003 and other portions werepresented at the 59th Annual Conference of the American Association for Public Opinion Research in Phoenix,Arizona, May, 2004. Many thanks to Susan Behnke and Alyssa Johnson for their reviews of earlier drafts of thisdocument and to the four anonymous reviewers for their keen insights and suggestions.
Journal of Official Statistics, Vol. 22, No. 2, 2006, pp. 221–244

the study to have higher incentive costs if qualified respondents have been promised
incentives. Self-reported behaviors or product ownership also serve an important data
function, ranging from behavioral surveillance to market-sizing studies. Finally,
self-reported data has been used for a weighting function to adjust data to be
more representative of a larger population (e.g., ownership of products has
been used to determine social class, which has then been used to weight to social
class targets – see Economic Status Scale, ESOMAR, http://www.esomar.org/upload/
144677_9107_1094551813643-StandardDemoClass97.pdf).
The context of response formulation affects subjects’ responses (Schwarz and Hippler
1987) and the effect of a measurement task on the frequency of behavioral or event
occurrence has received some empirical attention (Dillman 2000; Menon 1993, 1997;
Rockwood, Sangster, and Dillman 1997). Both the range and availability of response
options have been demonstrated to affect response choices for ordered behavioral
frequency scales (Dillman 2000, Rockwood et al. 1997). Most often, though, these
frequency or amount scales are preceded by a dichotomous measure that asks the
respondent if he or she engaged in the behavior or experienced the event of interest
(“Have you ever done this behavior?”).
In spite of the problems that have been identified in the validity of self-report of behaviors
(Lee et al. 2000; Schwarz 1999), many surveys attempt to assess the occurrence of
behaviors or events to better inform decisions affecting those behaviors or events. From
health-related surveys like the State and Local Area Integrated Telephone Survey (SLAITS
– http://www.cdc.gov/nchs/slaits.htm) or the National Immunization Survey (NIS – http://
www.cdc.gov/nis/), to estimates of disabilities (U.S. Census survey long form – http://
www.census.gov/dmd/www/pdf/d02p.pdf), to the many business surveys conducted in
market research, all rely to some degree on self-report of behaviors or events. While there
are many self-report response formats used to determine incidence, two methods have
commonly been employed when assessing the self-reported occurrence of a series of
behaviors or events: 1) a yes–no grid, whereby a respondent is typically presented with a
series of events or behaviors (hence using rows of elements and columns of responses which
determine the grid) and the respondent indicates with a “yes” or “no” whether the event or
behavior has occurred, or 2) a multiple response list, whereby a respondent is presented with
a list of events or behaviors and then indicates all of the elements that apply to him or her
(“select all that apply”). The yes–no grid typically requires a response for each element
listed while the multiple response lists requires only responses for the elements that apply to
the respondent. A multiple response list typically will also present a “None of these”
response. Both response formats are used in self-administered, visually-presented surveys
(e.g., paper-pencil/mail or web-based surveys). In self-administered mail surveys, the
yes–no grid has been found to be associated with higher rates of endorsement than multiple
response lists (Rasinski, Mingay, and Bradburn 1994). With the advent of web-based
surveys, determining which aspects of survey design affect respondents’ answers and
survey experience has become of great research interest (Couper 2000; Dillman, Tortora,
and Bowker 1998; Tourangeau, Couper, and Conrad 2004). In the first reported
investigation on dichotomous response formats in web-based surveys, Thomas, Behnke,
Smith, and Lafond (2003) obtained higher endorsement rates with yes–no grids than
multiple response lists in web-based surveys. Dillman, Smythe, Christian, and Stern (2003)
Journal of Official Statistics222

subsequently reported similar results. Because self-report measures of behaviors and events
are a critical cornerstone for surveys, this study sought to expand the limited empirical
attention that has been devoted to self-report behavioral measurement employing
dichotomous techniques through a series of five web-based experiments.
2. Method
2.1. Respondents
All experiments reported here obtained respondents using the Harris Interactive panel
(HarrisPollOnline.com). The Harris Interactive panel has over seven million members
who have been recruited through various websites and online panel enrollment campaigns.
This panel has been shown to provide data that is both valid and, when sampling and
weighting is appropriate, comparable to data that has been obtained from random
samples of general populations (Berrens, Bohara, Jenkins-Smith, Silva, and Weimer 2003;
Chang and Krosnick 2001; Taylor, Bremer, Overmeyer, Siegel, and Terhanian 2001;
Thomas, Krane, and Taylor 2003, 2004).
Respondents were randomly selected for the experiments from the Harris Interactive
panel within the strata of gender and age group (and, in the U.S., region of country) and
sent an e-mail invitation to respond to a web-based survey. Some experiments reported
here had more women or more men as respondents due to the nature of the larger study in
which the experiment was embedded.
Experiment 1 was a study conducted with 923 U.S. respondents who were 18 years old
or older (540 males with an average age of 45.6; 383 females with an average age of 44.7)
that took place in April, 2002. Respondents were randomly assigned to either a yes–no
grid or a multiple response list and were asked to indicate if they had ever done each of
seven protest behaviors regarding the products, services, or activities of any company
(Figure 1). The seven protest behaviors were randomly ordered for each respondent to
control for order effects. In each experiment, yes–no grids and multiple response lists
were presented as single screen tasks.
Experiment 2 was a consumer products study conducted in July, 2002 which examined
the self-reported use of a variety of food products in the past year. This study had 1,254
U.S. respondents who were 18 years old or older (268 males with an average age of 49.1
and 986 females with an average age of 46.7 – this survey targeted the primary grocery
shopper of a household so approximately 80% of the sample invited to take part in the
survey was female). Since the effect of a response format could be affected by the number
of elements that the respondent is asked to consider, we varied the number of elements
across response condition. The experiment employed a 2 £ 2 factorial design with
response format (yes–no grid or multiple response list format) and number of elements
(either five or ten food products) varying between respondents. The order of the food
products was randomized for each respondent. Though targeting primary household
grocery shopper, the questions concerning grocery product use did not have a screening
question prior to their presentation.
Experiment 3 was a study conducted in October, 2002 which examined self-reported
purchase behavior at convenience stores. The survey had 1,722 U.S. respondents 18 years
Thomas and Klein: Merely Incidental?: Effects of Response Format on Self-reported Behavior 223

or older (780 males; 942 females), of whom 86.7% (687 males, average age 44.5; 806
females, average age 42.1) reported that they had shopped at a convenience store in the
past 30 days (a simple yes–no question served as the filter for this experiment). These
eligible participants were subsequently randomly assigned to the experimental conditions.
The experiment employed a 2 £ 4 factorial design with response format (yes–no grid,
multiple response list) and number of elements (5, 10, 15, or 20) varying between
respondents. The order of products was randomized for each respondent, and we also
analyzed these data for order effects.
Experiment 4 expanded consideration of response format internationally and across
languages and focused on the self-reported consumption of five different types of products
at convenience stores on a regular basis (“more than once a week”). This experiment was
conducted from September to December, 2003. We varied only the type of response
format in it. This study had 25,800 respondents who were 18 years or older (13,184 males
with an average age of 41.5 and 12,616 females with an average age of 36.7) residing in
eight different countries (Australia, Canada, France, Germany, Italy, Spain, UK, U.S.A.).
The survey was presented in five different language versions (English, French, German,
Italian, Spanish). As with the previous experiments, response elements were randomly
ordered in their presentation.
Experiment 5 was conducted with respondents from five European countries (France,
Germany, Italy, Spain, UK) between October and November, 2003. While the previous
four experiments examined the influence of response format on behavior (protest, use,
purchase, consumption), Experiment 5 examined the influence of response format on
Fig. 1. Examples of formats and items used in experiments. In each format, respondents completed the task by
using a mouse to click on radio boxes to indicate their responses
Journal of Official Statistics224
self-reported household ownership of 14 different kitchen appliances. This study had
6,530 respondents who were 18 years old or older (3,327 males with an average age of
38.8 and 3,213 females with an average age of 34.6) from five European countries (France,
Germany, Italy, Spain, UK) and was presented in five languages. We again varied only the
type of response format in this experiment (yes–no grid and multiple response list) and the
14 elements were randomly ordered in their presentation.
In Experiments 4 and 5, we also examined the time it took respondents to complete the
tasks with both response formats, as time spent on the task has been found to be correlated
with the extent of cognitive processing required to complete it (Krosnick 1999). For
Experiments 2, 3, and 4 we also recorded the order of presentation of the elements.
2.2. Analyses
Our primary purpose of these studies was to determine what, if any, effect the survey
design feature of response format would have on responses, and not to obtain results
projectable to the general, nonpanel population. Thus we followed the normal practice
used in experimental survey design research and report statistical results that use
unweighted data only. As indicated by Berrens et al. (2003) “True probability samples
may not be necessary to make valid inferences about relationships, especially when the
most important variables of interest are based on “treatments” that are randomly applied to
respondents.” Using unweighted data thus provides a more sensitive test of the
experimental design as weighting data both inflates variance and normally requires the
sample size to be adjusted downward as a function of weighting efficiency.
F-tests were used to compare dichotomous data since respondents were randomly
assigned to experimental conditions. This also allowed us to maintain consistency across
experiments, as later analyses used more complex experimental designs. Additionally, we
examined the correlation between the proportions of endorsements obtained using the
different response formats from each of the separate experiments, in order to assess the
relative ordering of proportions of endorsement for each response format.
3. Results
3.1. Experiment 1
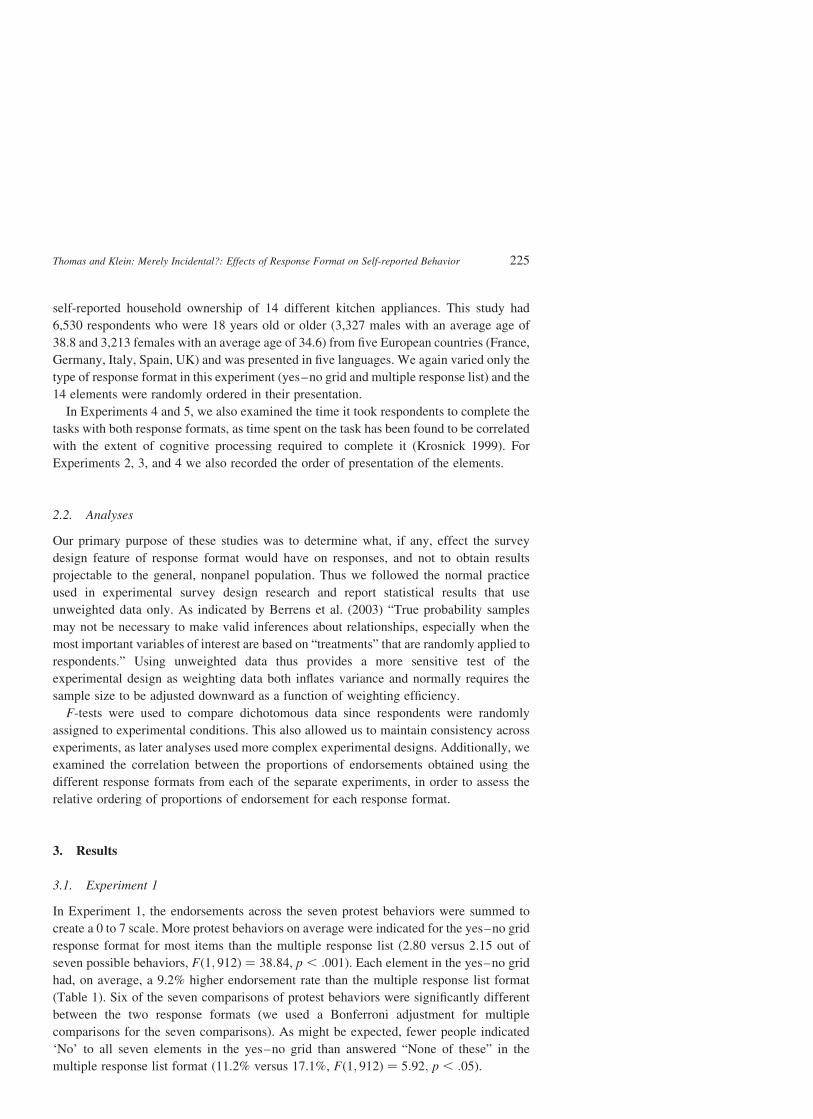
In Experiment 1, the endorsements across the seven protest behaviors were summed to
create a 0 to 7 scale. More protest behaviors on average were indicated for the yes–no grid
response format for most items than the multiple response list (2.80 versus 2.15 out of
seven possible behaviors, Fð1; 912Þ ¼ 38:84, p , :001). Each element in the yes–no grid
had, on average, a 9.2% higher endorsement rate than the multiple response list format
(Table 1). Six of the seven comparisons of protest behaviors were significantly different
between the two response formats (we used a Bonferroni adjustment for multiple
comparisons for the seven comparisons). As might be expected, fewer people indicated
‘No’ to all seven elements in the yes–no grid than answered “None of these” in the
multiple response list format (11.2% versus 17.1%, Fð1; 912Þ ¼ 5:92; p , :05).
Thomas and Klein: Merely Incidental?: Effects of Response Format on Self-reported Behavior 225
3.2. Experiment 2
In Experiment 2 we formed an index of endorsement frequency by summing together the
endorsements for the first five elements and for the second five elements (ranging from 0 to
5 each). The self-reported use of the food products was consistently high across both
response formats (Table 2). The yes–no grid again was found to have a higher incidence,
but less so than in the first study (3.0% higher endorsement rate for the first five elements
for those assigned to the five-element condition, Fð1; 638Þ ¼ 6:18, p , :05; 4.1% for the
second five elements for those assigned to the ten-element condition, Fð1; 612Þ ¼ 10:90,
p , :001). This average difference between formats was lower than we obtained in
Experiment 1 and was most likely due to a ceiling effect that limited the effect of the
response format (i.e., most people had used most of the food products within the past year).
The yes–no grid had a higher endorsement for 14 of the 15 possible comparisons, though
only five comparisons were statistically significant (p , :05), again using the Bonferroni
adjustment for multiple comparisons within each condition.
An increase in the number of elements did not significantly affect the self-reported
incidence rates obtained by either response format for the first five elements, although a
ceiling effect may have obscured any effect of set size on response format performance. In
addition, because the average endorsement for the elements was high, there was no
significant difference in the proportion who did not endorse any of the items when the two
response formats were compared.
We recorded the order in which the elements were presented and analyzed for order
effects (average proportion of element endorsement by order position is shown in Table 3).
In the five-element condition, we found a significant main effect for order
(Fð4; 2552Þ ¼ 3:87, p , :01), with a significant linear component (Fð1; 638Þ ¼ 15:39,
Table 1. Results for Experiment 1
Yes–no grid item stem for Experiment 1
People sometimes disagree with what a company might do and show their disapproval in a variety of ways. Have
you ever expressed your disapproval of a specific company’s products, services, or activities by: : :
Multiple response list for Experiment 1
People sometimes disagree with what a company might do and show their disapproval in a variety of ways. Have
you ever expressed your disapproval of a specific company’s products, services, or activities by doing any of the
following? Please select all that apply.
Response format Yes–no grid Multiple responseN 444 479
Demonstration 6.5% 5.8%Petition 45.5% 28.2%***Message 12.2% 8.1%*Refuse to purchase products 84.7% 77.7%**Convince other to refuse purchase 76.4% 64.9%***Sell stock 17.6% 10.6%**Convince other to sell stock 37.2% 20.0%***
Total number endorsed 2.80 2.15***Average endorsement 40.0% 30.8%None endorsed 11.5% 17.1%
*p , :05; **p , :01; ***p , :001, Bonferroni adjustment for multiple comparisons.
Journal of Official Statistics226

p , :001). We also had a marginally significant response format £ order effect
(Fð4; 2552Þ ¼ 1:97, p , :10) with a significant quadratic component (Fð1; 638Þ ¼ 4:75).
Elements occurring later in the list were less likely to be endorsed and this appeared to be
more characteristic of the multiple response list condition. Analyses for the ten element
Table 2. Experiment 2 Results by Condition
Yes–no grid item stem for Experiment 2
Have you used any of the following products within the past year?
Multiple response list item stem for Experiment 2
Which of the following types of products have you used within the past year? Please check all that apply.
Response format Yes–nogrid
Multipleresponse
Yes–nogrid
Multipleresponse
Number of elements 5 5 10 10N 332 308 313 301
Pasta 87.7% 81.2%* 82.7% 79.7%Cereal 92.5% 90.6% 94.9% 89.7%*Salad dressing 96.7% 91.2%** 94.6% 92.0%Peanut butter 88.0% 86.7% 87.2% 87.7%Coffee 80.1% 77.3% 79.6% 77.7%
Total number endorsed – First 5 4.45 4.27* 4.39 4.27Average endorsement – First 5 89.0% 85.4% 87.8% 85.4%
Bagel 74.4% 68.1%Milk 97.1% 94.7%Meat 98.1% 95.3%Ice cream 97.8% 94.4%*Juice 91.4% 86.0%***
Total number endorsed – Second 5 4.59 4.39***Average Endorsement – Second 5 91.8% 87.7%None endorsed 0.0% 0.6% 0.0% 0.0%
*p , :05; **p , :01; ***p , :001, Bonferroni adjustment for multiple comparisons within number of elements
conditions.
Table 3. Experiment 2 – Average proportion endorsing element as a function of order in presentation
Response format Yes–no grid Multiple response Yes–no grid Multiple responseNumber of elements 5 5 10 10N 332 308 313 301
Element position1 92.8% 89.3% 91.7% 89.0%2 88.6% 87.3% 91.4% 88.7%3 87.3% 85.4% 91.1% 88.4%4 86.4% 84.7% 88.5% 87.7%5 89.8% 80.2% 90.4% 90.0%6 85.6% 81.1%7 91.7% 87.0%8 91.7% 85.4%9 87.2% 83.4%10 88.5% 84.7%
Thomas and Klein: Merely Incidental?: Effects of Response Format on Self-reported Behavior 227
condition also revealed a significant order main effect (Fð9; 5508Þ ¼ 3:63, p , :001) with
a significant linear component (Fð1; 612Þ ¼ 12:14, p , :001). Items in the ten-element list
were less likely to be endorsed when they occurred at the end of the list. There was no
significant response format £ order effect for the ten-element condition.
3.3. Experiment 3
Unlike the self-reported rates of use of food products in Experiment 2, self-reported
purchases at a convenience store for Experiment 3 were more varied, ranging from a low
of 1.2% to a high of 89.1% (Table 4). As in the prior experiment, we formed indices of
endorsement frequency by summing the endorsements for the each group of five elements
(with each index ranging from 0 to 5). All comparisons for each group of five elements
(first 5, second 5, third 5, and fourth 5) showed significant differences. Yes–no grids had
higher aggregate endorsement than multiple response lists for each set of five elements.
The yes–no grids had higher endorsement rates for the elements in 47 of 50 comparisons
and 27 of these differences were statistically significant ( p , .05, again using Bonferroni
adjustment for multiple comparisons within the number of elements condition).
As part of our post-hoc comparisons, we examined the impact of increasing the number
of elements on the differences between the response formats. We compared the five-
element group with the 10-, 15-, and 20-element groups (pooling the three groups). In the
yes–no grid condition, there were no significant differences in endorsement rates between
the five-element group and the other groups (Ms ¼ 2.55 and 2.46, respectively). In the
multiple response list condition, respondents in the five-element group endorsed
significantly more elements than to the other groups (for the first five elements –
Ms ¼ 2.28 and 2.04 items, respectively; Fð1; 728Þ ¼ 6:11, p , :05).
In Experiment 3 we also recorded the order in which the elements were presented. If the
lower proportion of endorsement occurring in the multiple response list was due to
satisficing, we might expect a decline in endorsement with an increasing number of
elements. Table 5 summarizes the average proportion endorsing the elements by position
of presentation. We conducted a repeated measures analysis of variance on the
endorsement frequencies with response format as the between-subjects variable and order
as a within-subjects variable (because the elements were different for each set of five
elements we conducted four separate analyses – for each level of numbers of elements).
We found no evidence for a main effect for order nor an interaction for response
format £ order within any of the conditions so no test of trends is reported.
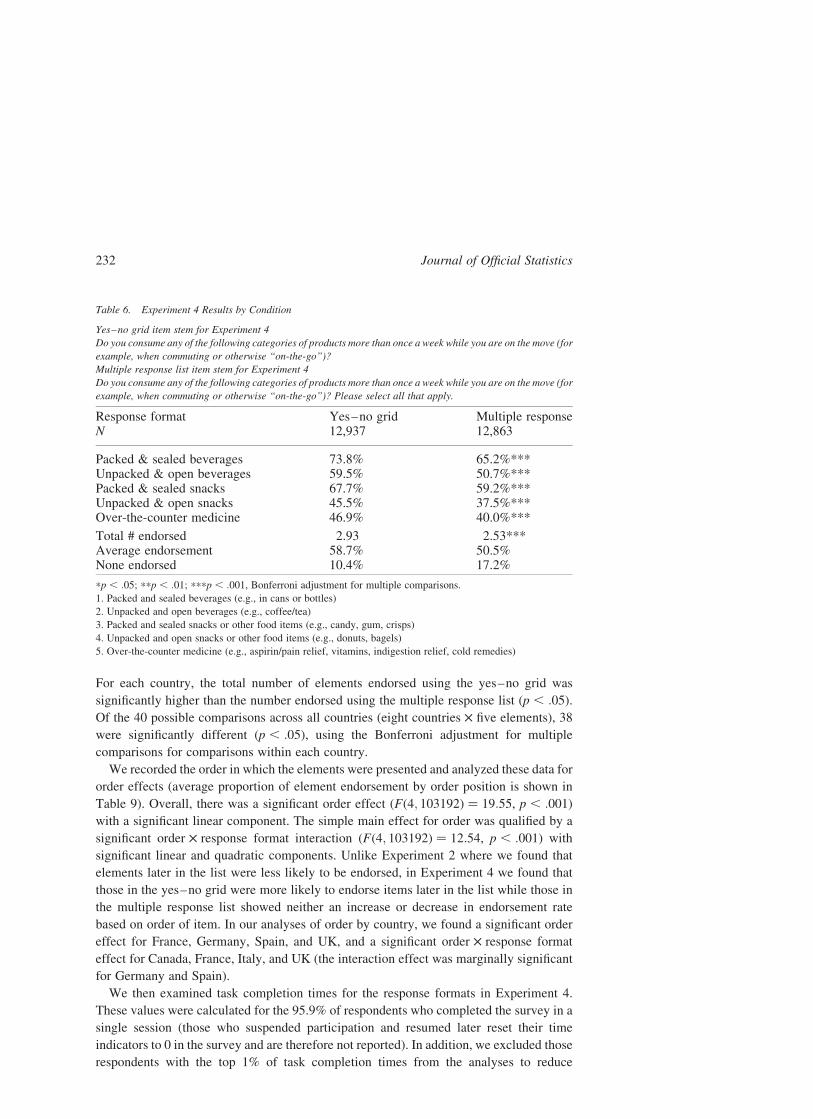
3.4. Experiment 4
In Experiment 4 we formed an index of endorsement frequency by summing together the
endorsements for the five types of snacks consumed in the past week (ranging from 0 to 5).
We found that the yes–no grid again led to higher levels of self-reported behavior than did
the multiple response list format. Across countries, the yes–no grid had an 8.2% higher
average endorsement per item overall (Fð1; 25798Þ ¼ 410:8, p , :001), with all five items
demonstrating significant differences (p , :05, using Bonferroni adjustment). Table 6
summarizes the overall results while Table 7 summarizes the results for Australia, Canada,
France, and Germany and Table 8 summarizes the results for Italy, Spain, UK, and U.S.A.
Journal of Official Statistics228
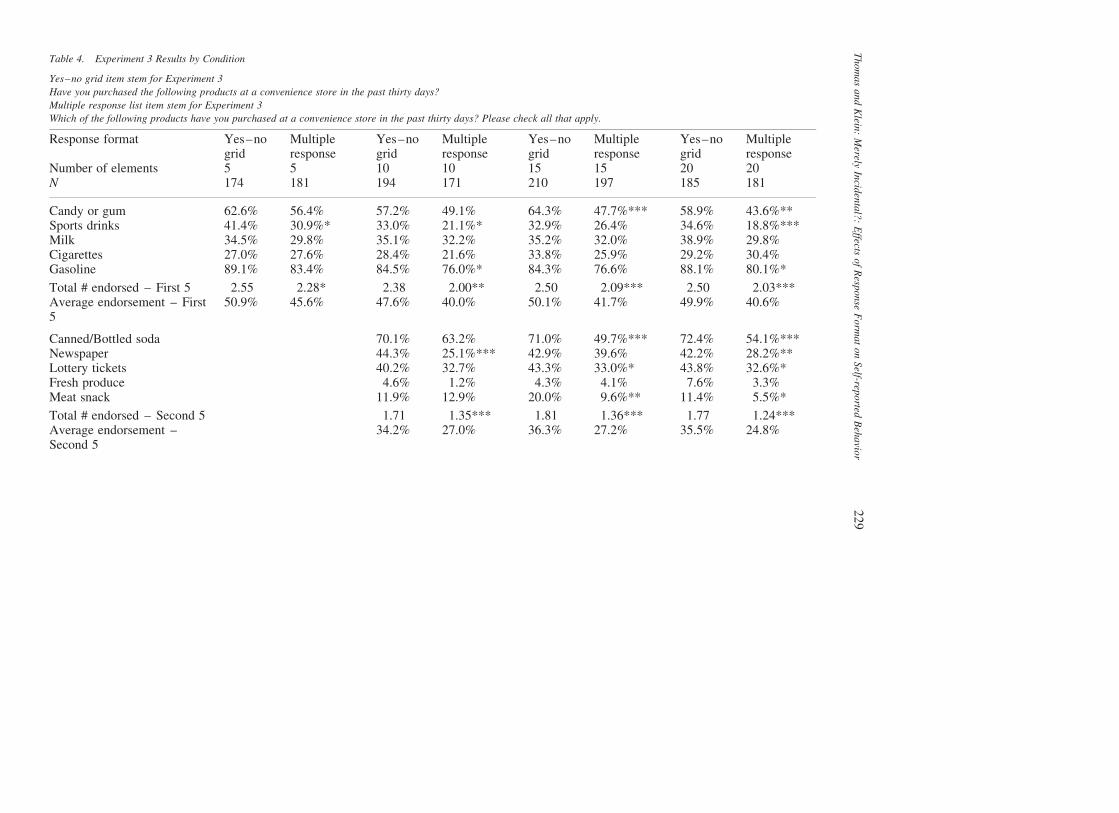
Table 4. Experiment 3 Results by Condition
Yes–no grid item stem for Experiment 3
Have you purchased the following products at a convenience store in the past thirty days?
Multiple response list item stem for Experiment 3
Which of the following products have you purchased at a convenience store in the past thirty days? Please check all that apply.
Response format Yes–nogrid
Multipleresponse
Yes–nogrid
Multipleresponse
Yes–nogrid
Multipleresponse
Yes–nogrid
Multipleresponse
Number of elements 5 5 10 10 15 15 20 20N 174 181 194 171 210 197 185 181
Candy or gum 62.6% 56.4% 57.2% 49.1% 64.3% 47.7%*** 58.9% 43.6%**Sports drinks 41.4% 30.9%* 33.0% 21.1%* 32.9% 26.4% 34.6% 18.8%***Milk 34.5% 29.8% 35.1% 32.2% 35.2% 32.0% 38.9% 29.8%Cigarettes 27.0% 27.6% 28.4% 21.6% 33.8% 25.9% 29.2% 30.4%Gasoline 89.1% 83.4% 84.5% 76.0%* 84.3% 76.6% 88.1% 80.1%*
Total # endorsed – First 5 2.55 2.28* 2.38 2.00** 2.50 2.09*** 2.50 2.03***Average endorsement – First5
50.9% 45.6% 47.6% 40.0% 50.1% 41.7% 49.9% 40.6%
Canned/Bottled soda 70.1% 63.2% 71.0% 49.7%*** 72.4% 54.1%***Newspaper 44.3% 25.1%*** 42.9% 39.6% 42.2% 28.2%**Lottery tickets 40.2% 32.7% 43.3% 33.0%* 43.8% 32.6%*Fresh produce 4.6% 1.2% 4.3% 4.1% 7.6% 3.3%Meat snack 11.9% 12.9% 20.0% 9.6%** 11.4% 5.5%*
Total # endorsed – Second 5 1.71 1.35*** 1.81 1.36*** 1.77 1.24***Average endorsement –Second 5
34.2% 27.0% 36.3% 27.2% 35.5% 24.8%
ThomasandKlein
:Merely
Incid
ental?:Effects
ofResp
onse
Form
atonSelf-rep
orted
Behavio
r2
29

Table 4. Continued
Response format Yes–nogrid
Multipleresponse
Yes–nogrid
Multipleresponse
Yes–nogrid
Multipleresponse
Yes–nogrid
Multipleresponse
Number of elements 5 5 10 10 15 15 20 20N 174 181 194 171 210 197 185 181
Packaged bread/rolls 22.4% 15.7% 22.7% 14.4%*Fountain soda or frozendrink
51.0% 36.5%** 51.4% 40.3%*
Hot beverage 50.5% 32.5%*** 47.6% 33.1%**Packaged salty snacks 57.6% 36.0%*** 58.9% 42.0%***Grocery items 23.3% 14.2%* 23.8% 16.6%*
Total # endorsed – Third 5 2.05 1.35*** 2.04 1.46***Average endorsement –Third 5
41.0% 27.0% 40.9% 29.3%
Cigars/Snuff/Chewingtobacco
8.1% 5.0%
Bottled water 50.3% 38.1%*Ice cream 17.8% 10.5%*Prepared fast food 30.3% 23.8%Energy/Nutrition bars 8.1% 2.2%*
Total # endorsed – Fourth 5 1.15 0.80*Average endorsement –Fourth 5
22.9% 15.9%
None endorsed 1.7% 4.4% 0.5% 1.8% 0.0% 0.0% 1.6% 0.0%
*p , :05; **p , :01; ***p , :001, Bonferroni adjustment for multiple comparisons within Number of Elements conditions.
JournalofOfficia
lStatistics
23
0
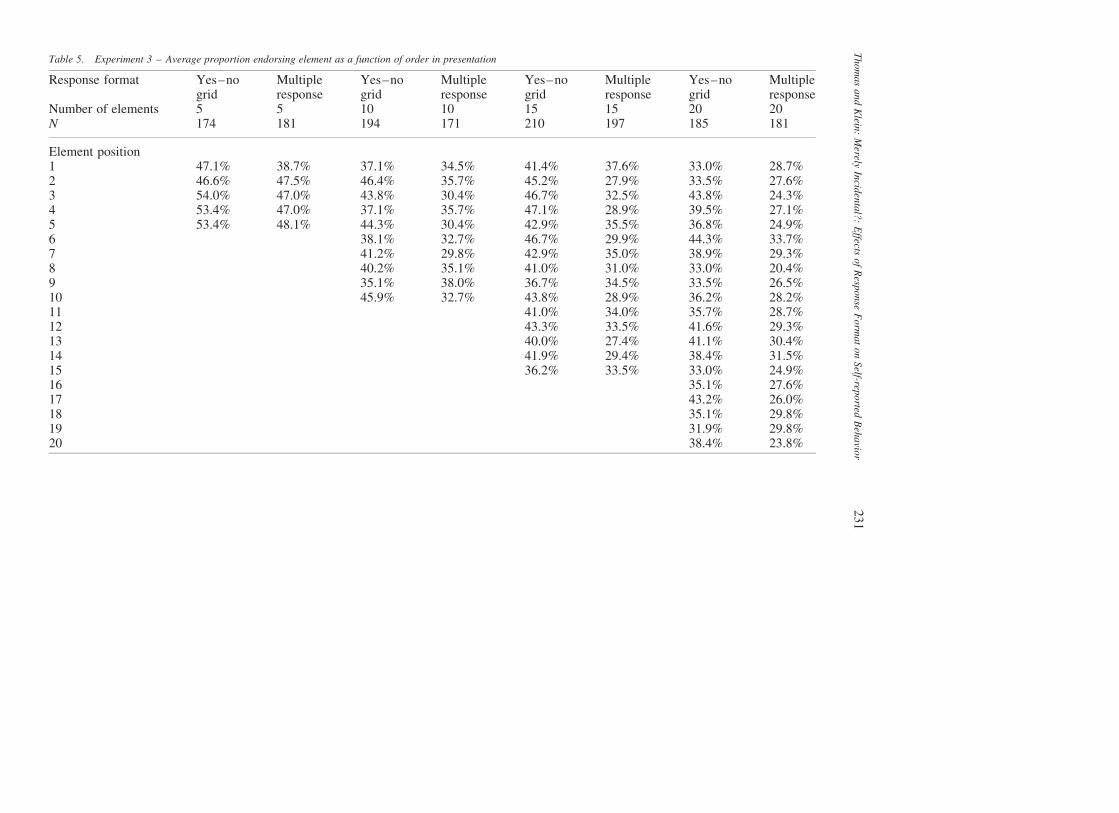
Table 5. Experiment 3 – Average proportion endorsing element as a function of order in presentation
Response format Yes–nogrid
Multipleresponse
Yes–nogrid
Multipleresponse
Yes–nogrid
Multipleresponse
Yes–nogrid
Multipleresponse
Number of elements 5 5 10 10 15 15 20 20N 174 181 194 171 210 197 185 181
Element position1 47.1% 38.7% 37.1% 34.5% 41.4% 37.6% 33.0% 28.7%2 46.6% 47.5% 46.4% 35.7% 45.2% 27.9% 33.5% 27.6%3 54.0% 47.0% 43.8% 30.4% 46.7% 32.5% 43.8% 24.3%4 53.4% 47.0% 37.1% 35.7% 47.1% 28.9% 39.5% 27.1%5 53.4% 48.1% 44.3% 30.4% 42.9% 35.5% 36.8% 24.9%6 38.1% 32.7% 46.7% 29.9% 44.3% 33.7%7 41.2% 29.8% 42.9% 35.0% 38.9% 29.3%8 40.2% 35.1% 41.0% 31.0% 33.0% 20.4%9 35.1% 38.0% 36.7% 34.5% 33.5% 26.5%10 45.9% 32.7% 43.8% 28.9% 36.2% 28.2%11 41.0% 34.0% 35.7% 28.7%12 43.3% 33.5% 41.6% 29.3%13 40.0% 27.4% 41.1% 30.4%14 41.9% 29.4% 38.4% 31.5%15 36.2% 33.5% 33.0% 24.9%16 35.1% 27.6%17 43.2% 26.0%18 35.1% 29.8%19 31.9% 29.8%20 38.4% 23.8%
ThomasandKlein
:Merely
Incid
ental?:Effects
ofResp
onse
Form
atonSelf-rep
orted
Behavio
r2
31
For each country, the total number of elements endorsed using the yes–no grid was
significantly higher than the number endorsed using the multiple response list (p , :05).
Of the 40 possible comparisons across all countries (eight countries £ five elements), 38
were significantly different (p , :05), using the Bonferroni adjustment for multiple
comparisons for comparisons within each country.
We recorded the order in which the elements were presented and analyzed these data for
order effects (average proportion of element endorsement by order position is shown in
Table 9). Overall, there was a significant order effect (Fð4; 103192Þ ¼ 19:55, p , :001)
with a significant linear component. The simple main effect for order was qualified by a
significant order £ response format interaction (Fð4; 103192Þ ¼ 12:54, p , :001) with
significant linear and quadratic components. Unlike Experiment 2 where we found that
elements later in the list were less likely to be endorsed, in Experiment 4 we found that
those in the yes–no grid were more likely to endorse items later in the list while those in
the multiple response list showed neither an increase or decrease in endorsement rate
based on order of item. In our analyses of order by country, we found a significant order
effect for France, Germany, Spain, and UK, and a significant order £ response format
effect for Canada, France, Italy, and UK (the interaction effect was marginally significant
for Germany and Spain).
We then examined task completion times for the response formats in Experiment 4.
These values were calculated for the 95.9% of respondents who completed the survey in a
single session (those who suspended participation and resumed later reset their time
indicators to 0 in the survey and are therefore not reported). In addition, we excluded those
respondents with the top 1% of task completion times from the analyses to reduce
Table 6. Experiment 4 Results by Condition
Yes–no grid item stem for Experiment 4
Do you consume any of the following categories of products more than once a week while you are on the move (for
example, when commuting or otherwise “on-the-go”)?
Multiple response list item stem for Experiment 4
Do you consume any of the following categories of products more than once a week while you are on the move (for
example, when commuting or otherwise “on-the-go”)? Please select all that apply.
Response format Yes–no grid Multiple responseN 12,937 12,863
Packed & sealed beverages 73.8% 65.2%***Unpacked & open beverages 59.5% 50.7%***Packed & sealed snacks 67.7% 59.2%***Unpacked & open snacks 45.5% 37.5%***Over-the-counter medicine 46.9% 40.0%***
Total # endorsed 2.93 2.53***Average endorsement 58.7% 50.5%None endorsed 10.4% 17.2%
*p , :05; **p , :01; ***p , :001, Bonferroni adjustment for multiple comparisons.
1. Packed and sealed beverages (e.g., in cans or bottles)
2. Unpacked and open beverages (e.g., coffee/tea)
3. Packed and sealed snacks or other food items (e.g., candy, gum, crisps)
4. Unpacked and open snacks or other food items (e.g., donuts, bagels)
5. Over-the-counter medicine (e.g., aspirin/pain relief, vitamins, indigestion relief, cold remedies)
Journal of Official Statistics232

Table 7. Experiment 4 Results for Australia, Canada, France, and Germany
Country Australia Canada France Germany
Response format Yes–nogrid
Multipleresponse
Yes–nogrid
Multipleresponse
Yes–nogrid
Multipleresponse
Yes–nogrid
Multipleresponse
N 970 927 2731 2701 2099 2069 866 895
Packed & sealedbeverages
75.1% 69.6%** 78.8% 72.4%*** 63.9% 52.4%*** 63.7% 53.1%***
Unpacked & openbeverages
58.0% 52.0%** 70.7% 65.2%*** 49.9% 37.7%*** 52.5% 41.9%***
Packed & sealedsnacks
65.8% 61.2%* 72.8% 68.4%*** 60.7% 49.0%*** 63.7% 48.8%***
Unpacked & opensnacks
42.7% 38.7% 56.4% 51.4%*** 24.2% 18.2%*** 61.8% 48.4%***
Over-the-countermedicine
47.3% 46.2% 55.4% 51.9%* 41.4% 29.4%*** 34.4% 28.0%**
Total # endorsed 2.89 2.68** 3.34 3.09*** 2.40 1.87*** 2.76 2.20***Average endorsement 57.8% 53.5% 66.8% 61.9% 48.0% 37.3% 55.2% 44.0%None endorsed 11.1% 11.1% 6.5% 10.5% 13.9% 25.3% 12.2% 21.7%
*p , :05; **p , :01; ***p , :001, Bonferroni adjustment for multiple comparisons within countries.
ThomasandKlein
:Merely
Incid
ental?:Effects
ofResp
onse
Form
atonSelf-rep
orted
Behavio
r2
33
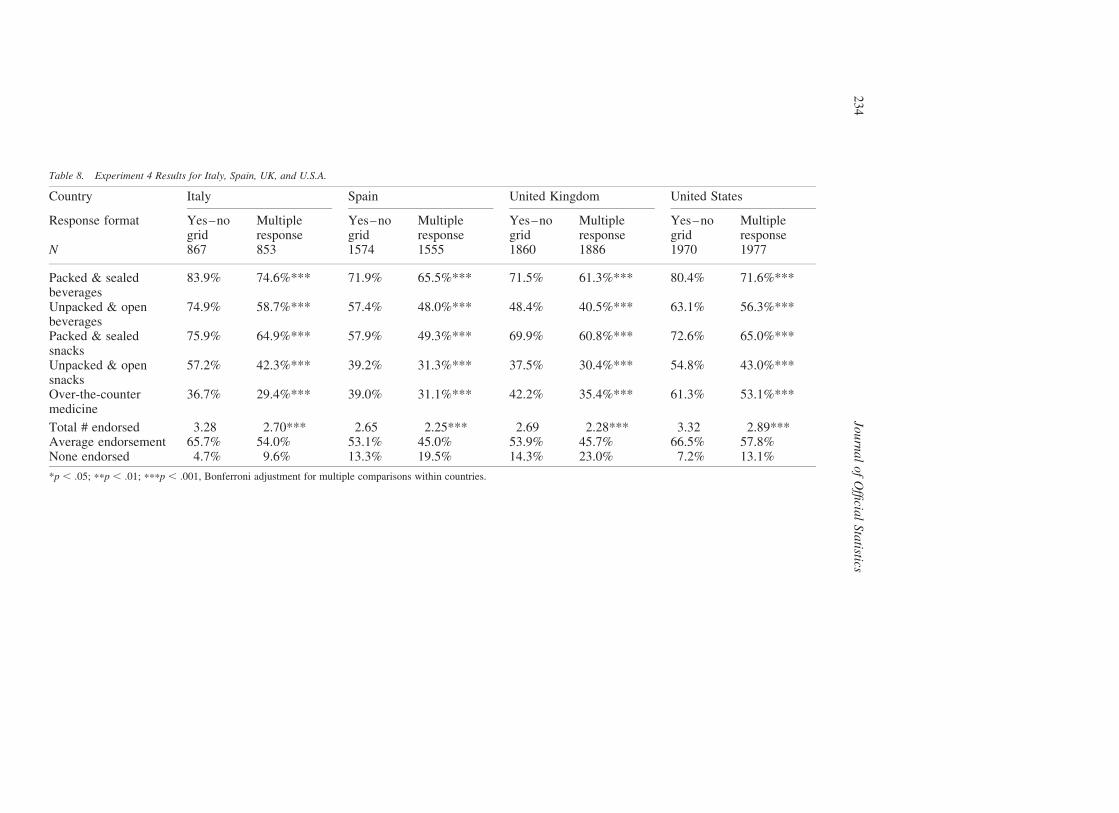
Table 8. Experiment 4 Results for Italy, Spain, UK, and U.S.A.
Country Italy Spain United Kingdom United States
Response format Yes–nogrid
Multipleresponse
Yes–nogrid
Multipleresponse
Yes–nogrid
Multipleresponse
Yes–nogrid
Multipleresponse
N 867 853 1574 1555 1860 1886 1970 1977
Packed & sealedbeverages
83.9% 74.6%*** 71.9% 65.5%*** 71.5% 61.3%*** 80.4% 71.6%***
Unpacked & openbeverages
74.9% 58.7%*** 57.4% 48.0%*** 48.4% 40.5%*** 63.1% 56.3%***
Packed & sealedsnacks
75.9% 64.9%*** 57.9% 49.3%*** 69.9% 60.8%*** 72.6% 65.0%***
Unpacked & opensnacks
57.2% 42.3%*** 39.2% 31.3%*** 37.5% 30.4%*** 54.8% 43.0%***
Over-the-countermedicine
36.7% 29.4%*** 39.0% 31.1%*** 42.2% 35.4%*** 61.3% 53.1%***
Total # endorsed 3.28 2.70*** 2.65 2.25*** 2.69 2.28*** 3.32 2.89***Average endorsement 65.7% 54.0% 53.1% 45.0% 53.9% 45.7% 66.5% 57.8%None endorsed 4.7% 9.6% 13.3% 19.5% 14.3% 23.0% 7.2% 13.1%
*p , :05; **p , :01; ***p , :001, Bonferroni adjustment for multiple comparisons within countries.
JournalofOfficia
lStatistics
23
4

Table 9. Experiment 4 – Average proportion endorsing element as a function of order in presentation overall
and by country
Country Element position Yes–no grid Multiple response
Overall 1 55.6% 50.5%2 58.3% 49.8%3 58.8% 50.9%4 59.6% 50.0%5 61.0% 51.4%
Australia 1 55.7% 53.4%2 57.8% 53.1%3 59.0% 53.7%4 58.1% 52.8%5 58.2% 54.7%
Canada 1 64.3% 62.6%2 66.8% 61.2%3 66.5% 62.1%4 68.5% 60.7%5 67.9% 62.8%
France 1 44.4% 36.8%2 47.2% 36.1%3 47.5% 38.0%4 48.9% 36.4%5 52.1% 39.3%
Germany 1 50.0% 42.2%2 53.7% 44.0%3 55.8% 45.6%4 58.0% 44.6%5 58.8% 43.8%
Italy 1 61.9% 55.8%2 65.4% 54.4%3 67.0% 53.7%4 66.7% 53.6%5 67.5% 52.5%
Spain 1 48.2% 43.8%2 52.7% 45.1%3 54.3% 45.0%4 54.9% 44.6%5 55.4% 46.6%
United Kingdom 1 50.5% 45.7%2 53.7% 43.4%3 54.4% 46.1%4 53.7% 46.4%5 57.3% 46.8%
United States 1 65.8% 58.3%2 66.0% 57.4%3 65.6% 58.3%4 66.4% 57.1%5 68.5% 58.0%
Thomas and Klein: Merely Incidental?: Effects of Response Format on Self-reported Behavior 235
the influence of outliers – respondents can discontinue activity in the survey and then
resume within an hour while the timer continues to record duration, and therefore long task
completion times are not necessarily indicative of the actual time spent completing the
task. These exclusions eliminated a total of 5.1% of all respondents from the task
completion time analyses. For the remaining respondents, the yes–no grid took four
seconds longer on average to complete the five elements across all countries (M ¼ 35:9
seconds for the yes–no grid, M ¼ 31:9 seconds for the multiple response list;
Fð1; 24487Þ ¼ 361:5, p , :001) and this difference was also statistically significant for
each country (p , :05). Table 10 summarizes the task completion times by country by
response format.
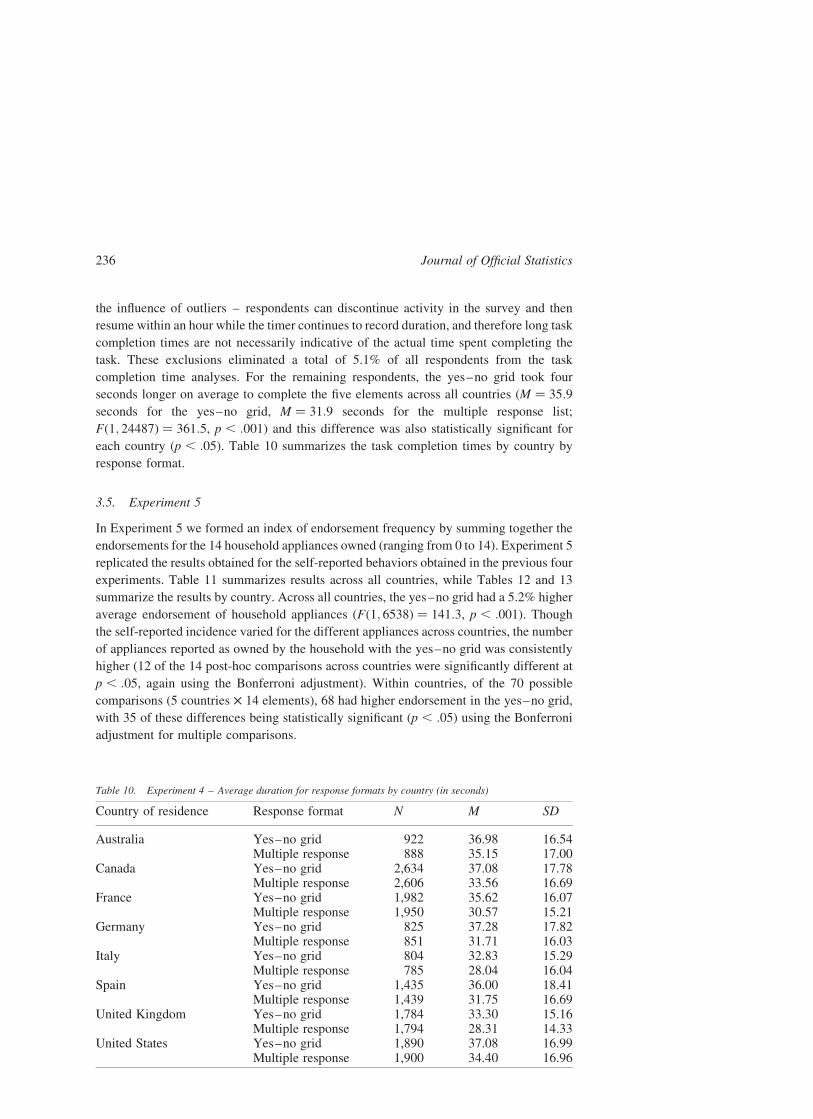
3.5. Experiment 5
In Experiment 5 we formed an index of endorsement frequency by summing together the
endorsements for the 14 household appliances owned (ranging from 0 to 14). Experiment 5
replicated the results obtained for the self-reported behaviors obtained in the previous four
experiments. Table 11 summarizes results across all countries, while Tables 12 and 13
summarize the results by country. Across all countries, the yes–no grid had a 5.2% higher
average endorsement of household appliances (Fð1; 6538Þ ¼ 141:3, p , :001). Though
the self-reported incidence varied for the different appliances across countries, the number
of appliances reported as owned by the household with the yes–no grid was consistently
higher (12 of the 14 post-hoc comparisons across countries were significantly different at
p , :05, again using the Bonferroni adjustment). Within countries, of the 70 possible
comparisons (5 countries £ 14 elements), 68 had higher endorsement in the yes–no grid,
with 35 of these differences being statistically significant (p , :05) using the Bonferroni
adjustment for multiple comparisons.
Table 10. Experiment 4 – Average duration for response formats by country (in seconds)
Country of residence Response format N M SD
Australia Yes–no grid 922 36.98 16.54Multiple response 888 35.15 17.00
Canada Yes–no grid 2,634 37.08 17.78Multiple response 2,606 33.56 16.69
France Yes–no grid 1,982 35.62 16.07Multiple response 1,950 30.57 15.21
Germany Yes–no grid 825 37.28 17.82Multiple response 851 31.71 16.03
Italy Yes–no grid 804 32.83 15.29Multiple response 785 28.04 16.04
Spain Yes–no grid 1,435 36.00 18.41Multiple response 1,439 31.75 16.69
United Kingdom Yes–no grid 1,784 33.30 15.16Multiple response 1,794 28.31 14.33
United States Yes–no grid 1,890 37.08 16.99Multiple response 1,900 34.40 16.96
Journal of Official Statistics236
We also examined task completion times in Experiment 5 and applied the same criteria
for selecting respondents for analysis as was used in Experiment 4. In Experiment 5, 8.1%
of all respondents were excluded as a result of these selection criteria. The yes–no grid
again took longer to complete than did the multiple response list, averaging 11.6 seconds
longer to complete for the 14 elements (M ¼ 37:7 for yes–no grid and M ¼ 26:1 for
multiple response list, Fð1; 6008Þ ¼ 811:8, p , :001). The difference in task completion
between response formats for each country was statistically significant (p , :05); these
results are summarized in Table 14.
4. Overall Analyses
All five experiments demonstrated significant differences in endorsement frequencies
between the response formats. However, we also examined whether the endorsement
frequencies were ordered differently or similarly across response formats. By treating each
proportion of endorsement for each element as a point estimate (ranging from 0 to 1), we
calculated the correlation between the proportions as obtained by the yes–no grid and by the
multiple response list. Thus across all five experiments we had 182 point estimates for each
response format that we could compare (using point estimates obtained for Experiments 2
and 3 from within assignment groups – number of elements – and for Experiments 4 and 5
Table 11. Experiment 5 Results by Condition
Yes–no grid item stem for Experiment 5
Next, we have a few questions about household appliances. Which of these products do you have in your
household?
Multiple response list item stem for Experiment 5
Next, we have a few questions about household appliances. Which of these products do you have in your
household? Please select all that apply.
Overall results by response format
N Yes–no grid Multiple response3,306 3,224
Iron 95.5% 92.9%***Kettle 63.7% 61.2%*Toaster 83.7% 82.2%Coffee maker 71.4% 65.7%***Espresso machine 32.1% 28.9%**Deep fat fryer 46.4% 43.6%*Electric steamer 17.8% 13.6%***Health grill 28.9% 21.3%***Rice cooker 25.2% 17.7%***Multi-cooker 30.7% 19.3%***Fondue set 35.8% 30.4%***Raclette maker 27.1% 25.9%Hand blender 60.6% 49.7%***Food processor 55.7% 50.0%***
Total # endorsed 6.75 6.02***Average endorsement 48.2% 43.0%None endorsed 0.4% 0.9%
*p , :05; **p , :01; ***p , :001, Bonferroni adjustment for multiple comparisons.
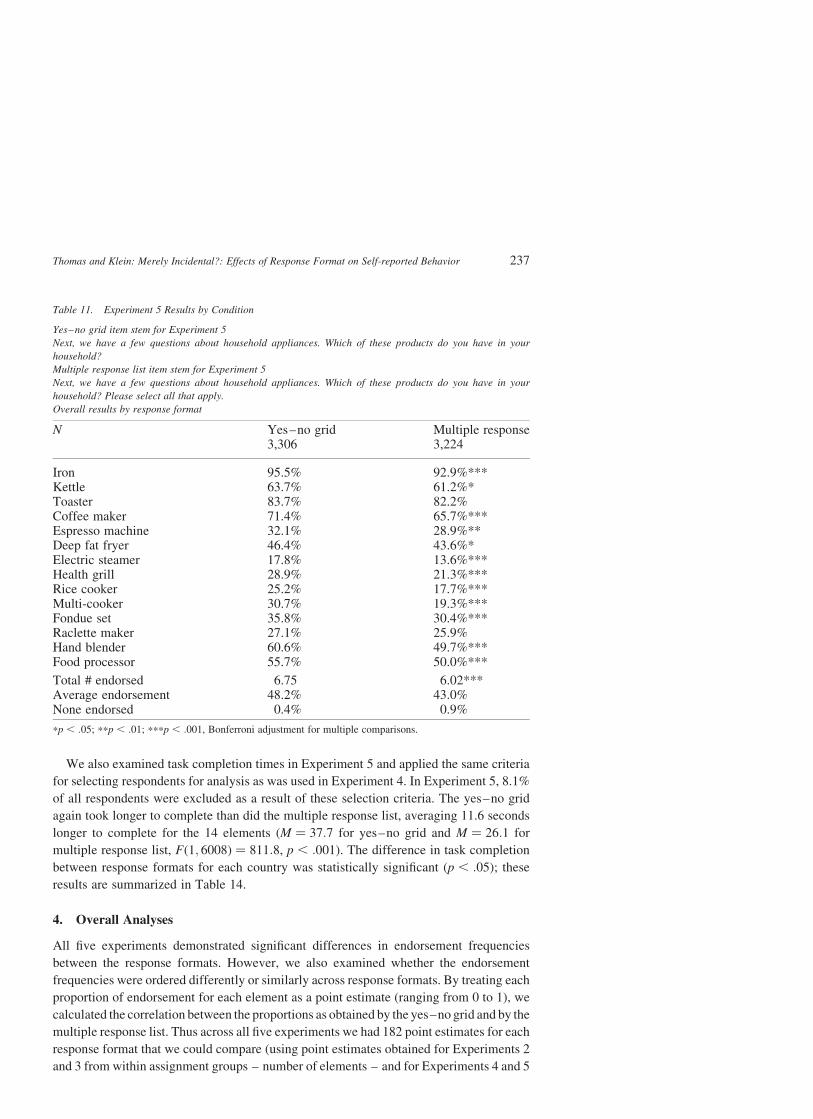
Thomas and Klein: Merely Incidental?: Effects of Response Format on Self-reported Behavior 237
from within countries). The correlation between the response formats was .981 (p , :001),
reflecting a nearly identical ordering of proportions of endorsement for each response
format. Averaging across all point estimates across all experiments, the average proportion
of respondents who endorsed any given element for the yes–no grid was 51.7% while the
average proportion for the multiple response list was 44.5%, indicating that the percent of
respondents endorsing any given element in a yes–no grid was on average 7.2% higher than
the estimate from a multiple response list. The inclusion of a ‘None of these’ category in the
multiple response lists groups may have introduced an additional element to the element
mix presented to respondents, which could have affected our results. However, because the
proportion endorsing “None of these” varied greatly (from 0% to 25%) and yet the
differences remained consistent across experiments, the presence or absence of a “None of
these” category is very unlikely to have altered our findings.
5. Discussion
The response format used to determine the self-reported occurrence of a behavior or event
had significant effects on online survey behavior across the various topics that we studied in
these five experiments. Yes–no grid response formats consistently led to higher levels of
endorsement than multiple response lists. This replicated similar results reported by
Rasinski et al. (1994) in mail surveys. In Experiment 1, the items tested were measures of
lifetime behaviors regarding corporate political protest actions; in Experiment 2, the items
reflected annual use of consumer items; Experiment 3 assessed past 30-day purchase of
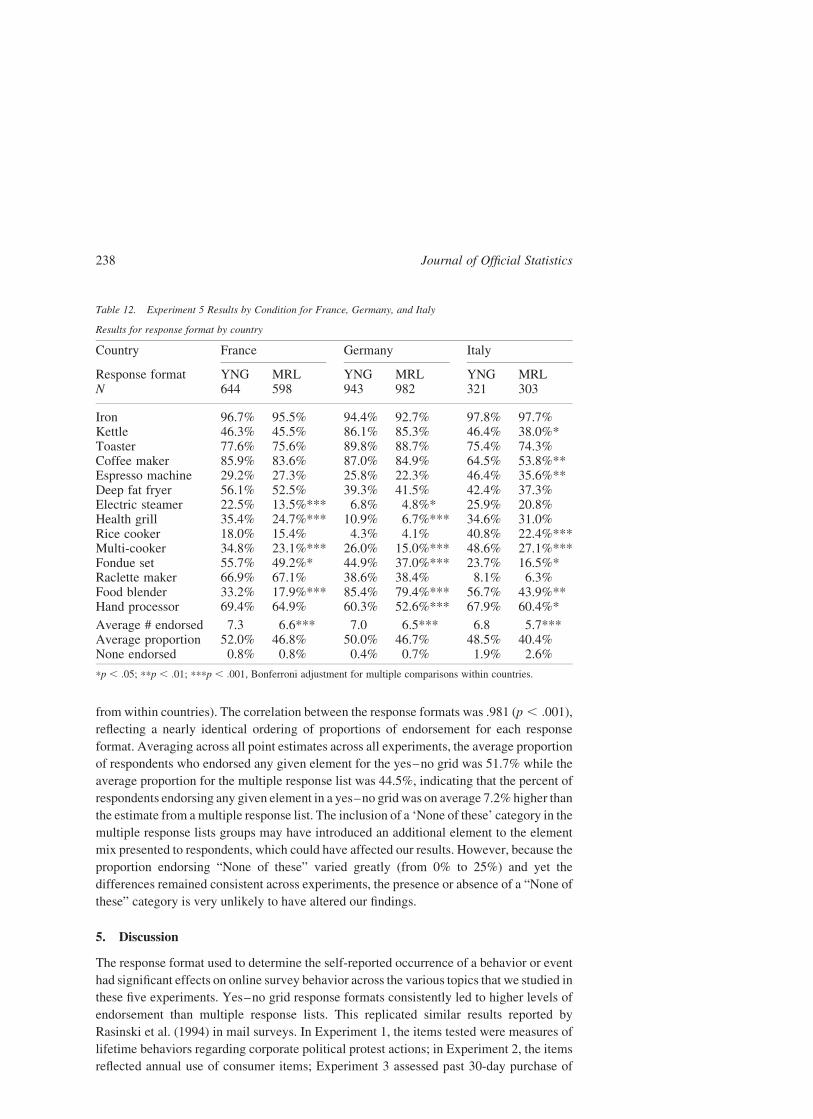
Table 12. Experiment 5 Results by Condition for France, Germany, and Italy
Results for response format by country
Country France Germany Italy
Response format YNG MRL YNG MRL YNG MRLN 644 598 943 982 321 303
Iron 96.7% 95.5% 94.4% 92.7% 97.8% 97.7%Kettle 46.3% 45.5% 86.1% 85.3% 46.4% 38.0%*Toaster 77.6% 75.6% 89.8% 88.7% 75.4% 74.3%Coffee maker 85.9% 83.6% 87.0% 84.9% 64.5% 53.8%**Espresso machine 29.2% 27.3% 25.8% 22.3% 46.4% 35.6%**Deep fat fryer 56.1% 52.5% 39.3% 41.5% 42.4% 37.3%Electric steamer 22.5% 13.5%*** 6.8% 4.8%* 25.9% 20.8%Health grill 35.4% 24.7%*** 10.9% 6.7%*** 34.6% 31.0%Rice cooker 18.0% 15.4% 4.3% 4.1% 40.8% 22.4%***Multi-cooker 34.8% 23.1%*** 26.0% 15.0%*** 48.6% 27.1%***Fondue set 55.7% 49.2%* 44.9% 37.0%*** 23.7% 16.5%*Raclette maker 66.9% 67.1% 38.6% 38.4% 8.1% 6.3%Food blender 33.2% 17.9%*** 85.4% 79.4%*** 56.7% 43.9%**Hand processor 69.4% 64.9% 60.3% 52.6%*** 67.9% 60.4%*
Average # endorsed 7.3 6.6*** 7.0 6.5*** 6.8 5.7***Average proportion 52.0% 46.8% 50.0% 46.7% 48.5% 40.4%None endorsed 0.8% 0.8% 0.4% 0.7% 1.9% 2.6%
*p , :05; **p , :01; ***p , :001, Bonferroni adjustment for multiple comparisons within countries.
Journal of Official Statistics238
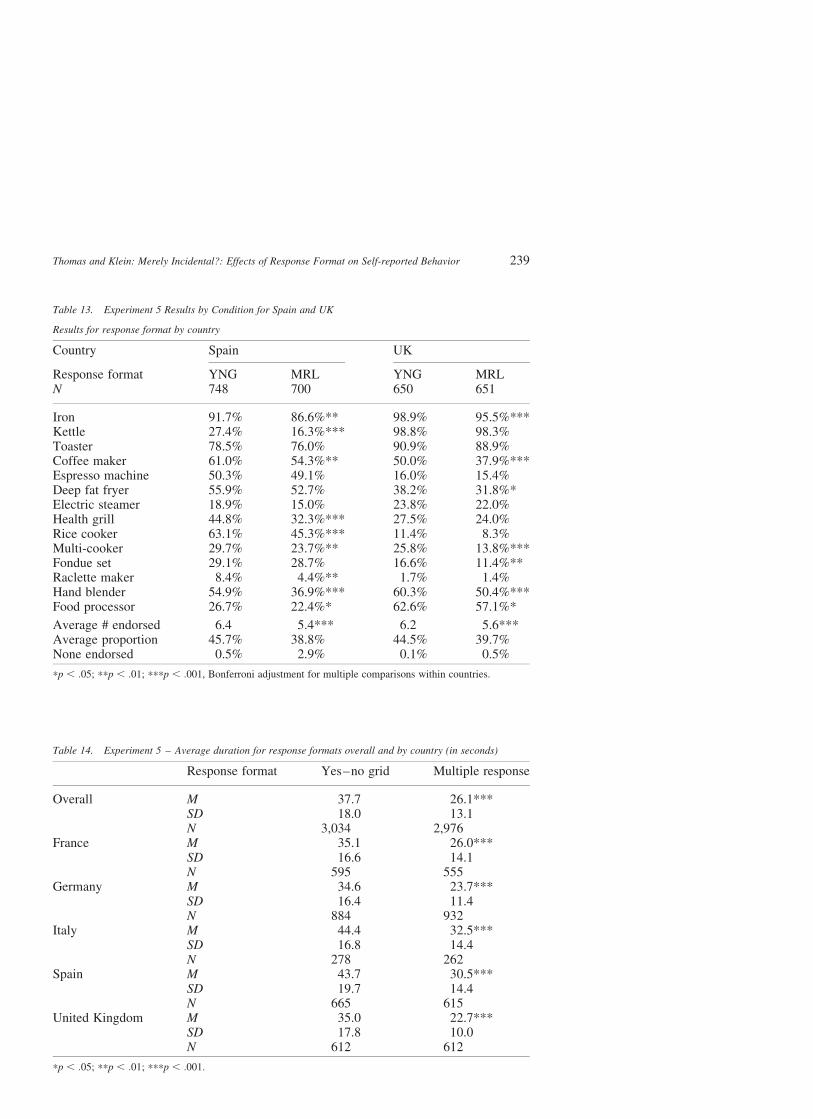
Table 14. Experiment 5 – Average duration for response formats overall and by country (in seconds)
Response format Yes–no grid Multiple response
Overall M 37.7 26.1***SD 18.0 13.1N 3,034 2,976
France M 35.1 26.0***SD 16.6 14.1N 595 555
Germany M 34.6 23.7***SD 16.4 11.4N 884 932
Italy M 44.4 32.5***SD 16.8 14.4N 278 262
Spain M 43.7 30.5***SD 19.7 14.4N 665 615
United Kingdom M 35.0 22.7***SD 17.8 10.0N 612 612
*p , :05; **p , :01; ***p , :001.
Table 13. Experiment 5 Results by Condition for Spain and UK
Results for response format by country
Country Spain UK
Response format YNG MRL YNG MRLN 748 700 650 651
Iron 91.7% 86.6%** 98.9% 95.5%***Kettle 27.4% 16.3%*** 98.8% 98.3%Toaster 78.5% 76.0% 90.9% 88.9%Coffee maker 61.0% 54.3%** 50.0% 37.9%***Espresso machine 50.3% 49.1% 16.0% 15.4%Deep fat fryer 55.9% 52.7% 38.2% 31.8%*Electric steamer 18.9% 15.0% 23.8% 22.0%Health grill 44.8% 32.3%*** 27.5% 24.0%Rice cooker 63.1% 45.3%*** 11.4% 8.3%Multi-cooker 29.7% 23.7%** 25.8% 13.8%***Fondue set 29.1% 28.7% 16.6% 11.4%**Raclette maker 8.4% 4.4%** 1.7% 1.4%Hand blender 54.9% 36.9%*** 60.3% 50.4%***Food processor 26.7% 22.4%* 62.6% 57.1%*
Average # endorsed 6.4 5.4*** 6.2 5.6***Average proportion 45.7% 38.8% 44.5% 39.7%None endorsed 0.5% 2.9% 0.1% 0.5%
*p , :05; **p , :01; ***p , :001, Bonferroni adjustment for multiple comparisons within countries.
Thomas and Klein: Merely Incidental?: Effects of Response Format on Self-reported Behavior 239

consumer items; Experiment 4 assessed typical weekly consumption of consumer items;
and Experiment 5 assessed household appliance ownership. Thus, the differences we found
were robust across multiple time frames, across different types of activities and information
with a wide range of salience to individual respondents, and across question formats
requiring different recall strategies. Consistent results were also seen across multiple
countries and languages. All differences that reached statistical significance pointed in one
direction – yes–no grids led to higher endorsement rates. Nonetheless, in spite of these
consistent differences, the relative order of endorsement of the elements in each experiment
was nearly identical (i.e., those with lower levels of endorsement in the yes–no grid had
lower levels using the multiple response list, and those with higher levels of endorsement in
the yes–no grid paralleled higher levels of endorsement in the multiple response list).
A variety of factors can affect memory and recall when answering questions about past
behaviors, including the time frame, the salience of an event or topic, and event priming
(Baddeley 1999; Chang and Krosnick 2003; Conrad, Brown, and Cashman 1998; Menon
1993; Tourangeau, Rips, and Rasinski 2000). Specific events and complex behaviors are
schema-based, and this too may lead to error in reporting their occurrence (Lee et al. 2000;
Schwarz 1999; Reason 1990). Although we used identical or near-identical prompts (item
stems) in both response formats so as to not bias recall strategies used by the respondents,
it is possible that the multiple response lists and the yes–no grids activated different recall
strategies. These recall strategies, and not the cognitive expectations of the item formats
themselves, may be one reason for the differences in endorsements of the elements that we
obtained.
Another possible reason for the difference between response formats is the mandatory
nature of the yes–no grids. As they were programmed in the experiments, the yes–no
grids required an answer by the respondent to each element, so that the survey would not
advance to the next screen without a response to every element. In contrast, the respondent
must only respond to a minimum of one element in the multiple response list format (an
element in the list or “None of these”) to advance to the next screen of the survey. In
comparisons of forced choice versus list endorsement within the paper-pencil survey
format, more forced choices required greater cognitive work on the part of respondents
(Krosnick 1991; Sudman and Bradburn 1982). Therefore, yes–no grids may cause
respondents to read each item and more thoughtfully consider their responses, leading to a
higher endorsement frequency. When presented with a multiple response list, respondents
may be more likely to glance at the elements on the list rather than read them thoroughly,
and then answer the few items that are either more easily recognized or processed as being
true of them. This process of minimally reading a list and answering those items that most
stand out, also known as satisficing, results in respondents’ choosing the first reasonable
option, rather than the best option, due to time constraints or due to requirements for more
cognitive resources than they are willing to invest in the item or what the item appears to
demand (Krosnick 1991; 1999). In a multiple response list format, a nonanswer is a ‘no’
response; while when it comes to the forced choices of a yes–no grid, a ‘no’ requires
active decision-making against endorsement of the item. Response endorsement takes
more effort than response nonendorsement in the multiple response list format. For
yes–no grids, the effort for both endorsement and nonendorsement is equal. Experiment 3
provided some evidence that satisficing may have occurred more for the multiple response
Journal of Official Statistics240

lists than for the yes–no grids. In our post-hoc analyses, we found that increasing the
number of elements beyond five was associated with a decreased tendency to endorse
items for the multiple response list format but not for the yes–no grid format. In addition,
in Experiments 4 and 5, respondents assigned to the yes–no grids took more time to
complete their responses, implying a greater cognitive demand and further supporting the
possibility that the respondents considered items more thoughtfully before responding
(although the greater number of required mechanical operations of moving the mouse and
clicking may have contributed to the increased time as well). In contrast, respondents
presented with a multiple response list format may have felt they had answered the
questions adequately even though less time and effort was spent on recall.
If satisficing were more likely to occur with one response format than another, these
effects should also be obtained in other survey modalities and not just in web-based
surveys. In most cases, phone surveys and in-person interviews use sequential yes–no
formats for multiple elements rather than multiple response list formats. Although a
multiple response list format could be designed for phone and in-person interviews, it
would most likely be constrained by the limits of human memory, and thus would
probably not function well. Mail or paper and pencil surveys should also be prone to the
effects that have been identified in this study, because both yes–no grids and multiple
response formats are used in these types of surveys and Rasinski et al. (1994) found
evidence supporting this. In addition, Dillman et al. (2003) recently described order
effects, including primacy, anchoring, and subtraction, in comparing forced choice and all-
that-apply questions for college students using a web-based survey. They also found a
greater endorsement of responses in forced choice, which they attributed to an
acquiescence bias (a greater tendency to endorse “yes” answers rather than “no” answers).
Nonetheless, use of yes/no choices may be better for surveys that seek to combine multi-
modal methods, since in most phone surveys when respondents are asked about whether a
series of elements are true of them, the elements typically require a “yes” or a “no” to be
uttered by the respondent to continue. Having a parallel assessment methodology will
probably lead to the most comparable results.
Variation in the social desirability of an item or its responses also may have affected the
report of the disapproving behaviors in Experiment 1, or of negative, potentially
stigmatizing behaviors (such as smoking). Thus, lower rates of self-report may be
expected for items with low social desirability. However, the endorsement rate for
elements in the yes–no grid format was higher across all experiments (and for items with
no apparent social desirability), which would lend further support to the belief that
different cognitive processes operate within the two question formats, regardless of the
type of attitude or the extent of social desirability of the behavior.
Our study is limited by several factors. A major limitation is the lack of objective
measures with which we could establish the relative validity of the response formats. Thus,
while we found consistent differences by question format, these experiments do not settle
the question of which format best identifies underlying behaviors. While Lee et al. (2000)
found that those higher in behavioral frequency underreport their usage and those lower in
behavioral frequency overreport their usage, we found that the effect of response format
was consistent in directional influence, so the effect reported by Lee et al. may be a distinct
effect that applies across response formats. It may be that yes–no grids lead to higher
Thomas and Klein: Merely Incidental?: Effects of Response Format on Self-reported Behavior 241
levels of false positives or that multiple response lists lead to higher levels of false
negatives (or the truth may be somewhere in between).
Our findings may not be generalizable to all population groups. However, because
we were interested in the experimental effect of response format, our analyses were
performed on individuals and on unweighted data without regard to the representativeness
of the sample (weighting, though demonstrated to improve representativeness, reduces
experimental precision). Nonetheless, the experimental conditions were randomly
assigned, and the results were replicated consistently across topics, languages, and
countries. We have also replicated results by other researchers using paper and pencil
measures and different samples, giving greater confidence that this is a real effect that is
independent of sample sources. Although there were demographic differences between the
panel and the population, the demographic factors and topical elements varied sufficiently
between experiments that we do not believe that these factors are likely to have affected the
obtained differences. Those with lower educational levels are less likely to be online. Since
those with lower educational levels are also more likely to engage in satisficing at tasks
requiring greater cognitive efforts (Krosnick 1991; 1999) and since the differences in
endorsement rates between the response formats may be at least partially due to satisficing,
our studies most likely somewhat underestimate the differences due to response format. We
are continuing to examine both respondent factors and survey factors in terms of how they
may increase or decrease the response format effects we have discovered.
In several experiments using diverse samples and with varied topics, we found that
yes–no grid response formats consistently led to higher levels of endorsement than multiple
response lists response formats for self-reported occurrence of behaviors or events in a series
of online surveys. While the data demonstrated a clear and replicable effect, these studies
did not examine two key questions that will need to be answered: why the differences occur
and which method better estimates true behavior and events. Our study sought to describe
and replicate these differences but did not address these underlying questions. Nonetheless,
understanding the sources of differences in self-report and exploring why these differences
occur and what are the biases involved in each method are necessary prerequisites to
achieving results that can be accurately related to actual behaviors. Understanding these
differences in response formats can also help in selecting measures, interpreting findings,
and comparing estimates between groups and between studies. Further exploration of the
differences across self-report response formats for incidence determination in other survey
modalities is also warranted. Additionally, our findings have implications for future research
on sample targeting and the design features of surveys. Future research should investigate
the effects of varying respondent load in responses to the different self-report formats, and
should attempt to establish the relative validity of each format.
6. References
Baddeley, A.D. (1999). Essentials of Human Memory. Hove, UK: Psychology Press.
Berrens, R., Bohara, A., Jenkins-Smith, H., Silva. C., and Weimer, D. (2003). The Advent
of Internet Surveys for Political Research: A Comparison of Telephone and Internet
Samples. Political Analysis, 11, 1–23.
Journal of Official Statistics242

Chang, L. and Krosnick, J.A. (2001). National Surveys via RDD Telephone Interviewing
vs the Internet: Comparing Sample Representativeness and Response Quality. Paper
presented at the 56th Annual Conference of the American Association for Public
Opinion Research, Montreal.
Chang, L. and Krosnick, J.A. (2003). Measuring the Frequency of Regular Behaviors:
Comparing the “Typical Week” to the “Past Week”. Sociological Methodology, 33,
55–80.
Chang, L. and Krosnick, J.A. (2004). Assessing the Accuracy of Event Rate Estimates
from National Surveys. Paper presented at the 59th Annual Conference of the American
Association for Public Opinion Research, Phoenix, Arizona.
Conrad, F.G., Brown, N.R., and Cashman, E.R. (1998). Strategies for Estimating
Behavioral Frequency in Survey Interviews. Memory, 6, 339–366.
Couper, M. (2000). Web Surveys: A Review of Issues and Approaches. Public Opinion
Quarterly, 64, 464–494.
Dillman, D.A. (2000). Mail and Internet Surveys: The Tailored Design Method.
New York: John Wiley and Sons.
Dillman, D.A., Smythe, J.D., Christian, L.M., and Stern, M.J. (2003). Multiple Answer
Questions in Self-adminstered Surveys; The Use of Check-all-that-apply and Forced-
choice Question Formats. Paper presented at the Annual Meeting of the American
Statistical Association. San Francisco, CA.
Dillman, D.A., Tortora, R.D., and Bowker, D. (1998). Principles for Constructing Web
Surveys. SESRC Technical Report, 98–50. http://survey.sesrc.wsu.edu/dillman/papers/
websurveyppr.pdf
Krosnick, J.A. (1991). Response Strategies for Coping with Cognitive Demands of
Attitude Measures in Surveys. Applied Cognitive Psychology, 5, 213–236.
Krosnick, J.A. (1999). Survey Research. Annual Review of Psychology, 50, 537–567.
Lee, E., Hu, M.Y., and Toh, R.S. (2000). Are Consumer Survey Results Distorted?
Systematic Impact of Behavioral Frequency and Duration on Survey Response Errors.
Journal of Marketing Research, 37, 125–133.
Levy, P.S. and Lemeshow, S. (1999). Sampling of Populations: Methods and Applications
(3rd ed.). New York, NY: Wiley.
Menon, G. (1993). The Effects of Accessibility of Information in Memory on Judgments
of Behavioral Frequencies. Journal of Consumer Research, 20, 431–440.
Menon, G. (1997). Are the Parts Better Than the Whole?: The Effects of Decompositional
Questions on the Judgments of Frequent Behaviors. Journal of Marketing Research, 34,
335–346.
Rasinski, K.A., Mingay, D., and Bradburn, N. (1994). Do Respondents Really “Mark All
That Apply” on Self-administered Questions? Public Opinion Quarterly, 58, 400–408.
Reason, J. (1990). Human Error. Cambridge, UK: Cambridge University Press.
Rockwood, T.H., Sangster, R.L., and Dillman, D.A. (1997). The Effect of Response
Categories on Questionnaire Answers: Context and Mode Effects. Sociological
Methods and Research, 26, 118–140.
Schwarz, N. (1999). Self-reports: How the Questions Shape the Answers. American
Psychologist, 54, 93–105.
Thomas and Klein: Merely Incidental?: Effects of Response Format on Self-reported Behavior 243
Schwarz, N. and Hippler, H.-J. (1987). What Response Scales May Tell Your
Respondents: Informative Functions of Response Alternatives. In Social Information
Processing and Survey Methodology, Hans-J. Hippler, Norbert Schwarz, and Seymour
Sudman (eds). New York: Springer-Verlag, 163–177.
Schwarz, N. and Oyserman, D. (2001). Asking Questions About Behavior: Cognition,
Communication, and Questionnaire Construction. American Journal of Evaluation, 22,
127–160.
Schonlau, M., Zapert, K., Simon, L.P., Stanstad, K., Marcus, S., Adams, J., Spranca, J.,
Kan, H., Turner, R., and Berry, S. (2003). A Comparison between Responses from a
Propensity-weighted Web survey and an Identical RDD Survey. Social Science
Computer Review, 21, 1–11.
Sudman, S. and Bradburn N.M. (1982). Asking Questions. San Francisco, CA:
Jossey-Bass.
Taylor, H., Bremer, J., Overmeyer, C., Siegel, J.W., and Terhanian, G. (2001). The Record
of Internet-based Opinion Polls in Predicting the Results of 72 Races in the November
2000 U.S. Elections. International Journal of Market Research, 43, 58–63.
Thomas, R.K., Behke, S., Smith, R., and Lafond, R. (2003). It’s Only Incidental: Effects of
Response Format in Determining Incidence. Paper presented at the 58th Annual
Conference of the American Association for Public Opinion Research, Nashville, TN.
Thomas, R.K., Krane, D., and Taylor, H. (2003). Presidential Approval: You May Be Only
as Good as Your Rating Scale. Paper presented at the 58th Annual Conference of the
American Association for Public Opinion Research, Nashville, TN.
Thomas, R.K., Krane, D., and Taylor, H. (2004). On the Convergent Validity of Attitude
Measurement in Phone and Online Surveys. Paper presented at the 59th Annual
Conference of the American Association for Public Opinion Research, Phoenix, AZ.
Tourangeau, R., Couper, M.P., and Conrad, F. (2004). Spacing, Position, and Order:
Interpretative Heuristics for Visual Features of Survey Questions. Public Opinion
Quarterly, 68, 368–393.
Tourangeau, R., Rips, L.J., and Rasinski, K. (2000). The Psychology of Survey Response.
Cambridge, UK: Cambridge University Press.
Received April 2004
Revised March 2006
Journal of Official Statistics244