Mercer Capital's Bank Watch | April 2015 | "Increasing The Capital Cap For Small Banks: Regulation...
9
Bank Watch April 2015 www.mercercapital.com Increasing The Capital Cap For Small Banks: Regulation A+ 1 Observations from the Initial Q1’15 Bank Earnings 3 Resources for Depository Institutions 4 Public Market Indicators 5 M&A Market Indicators 6 Regional Public Bank Peer Reports 7 About Mercer Capital 8
-
Upload
mercer-capital -
Category
Economy & Finance
-
view
260 -
download
0
Transcript of Mercer Capital's Bank Watch | April 2015 | "Increasing The Capital Cap For Small Banks: Regulation...

Bank Watch
April 2015
www.mercercapital.com
Increasing The Capital Cap For Small Banks:
Regulation A+ 1
Observations from the
Initial Q1’15 Bank Earnings 3
Resources for Depository Institutions 4
Public Market Indicators 5
M&A Market Indicators 6
Regional Public
Bank Peer Reports 7
About Mercer Capital 8

© 2015 Mercer Capital // Data provided by SNL Financial 1
Bank Watch
April 2015
Increasing The Capital Cap For Small Banks: Regulation A+Unlike the dark days that prevailed during 2008 through 2010 for many capital-starved financial and non-
financial institutions alike, the current environment of ample liquidity may become more so based upon
recent rule making by the Securities and Exchange Commission (SEC).
On March 25, 2015, the SEC issued its final ruling amending Regulation A, an existing exemption from
registration requirements for smaller issuers of securities. The new rules, commonly referred to as “Regulation
A+,” were first proposed in December 2013 under Title IV of the Jumpstart Our Business Startups (JOBS)
Act.1 Regulation A+ is expected to increase access to capital markets for small companies that do not report
to the SEC, including banks and bank holding companies with fewer than 1,200 equity holders, by exempting
registration requirements for securities offerings of up to $50 million annually.2
The new regulation aims to amend certain weaknesses in Regulation A that led to its limited use as a
capital raising tool. The original $5 million ceiling under Regulation A was considered by many to be too
low relative to the costs for a small offering, and not worth the burden of complying with blue state laws in
each state in which the offering was conducted. The expansion of the offering limit and more reasonable
filing requirements under Regulation A+ will create new opportunities for mature, private companies
that wish to raise capital without going public or asking permission from state regulators. The new rules
create a two-tiered offering structure with differing requirements based on the size of the offering.
» Tier 1 consists of securities offerings of up to $20 million in a 12-month period, with no
more than $6 million in offers by selling security-holders that are affiliates of the issuer.
» Tier 2 consists of securities offerings of up to $50 million in a 12-month period, with no
more than $15 million in offers by selling security-holders that are affiliates of the issuer.
Both tiers are subject to the same basic requirements of Regulation A, including issuer eligibility and
disclosure, but with additional requirements and exemptions under each tier that aim to solve some of the
limitations of Regulation A. In effect, the rules for Tier 1 will be the same as the current Regulation A, but
are now limited to a greater aggregate offering of $20 million over a 12-month period. The issuer can elect
whether to proceed under Tier 1 or Tier 2 for offerings up to $20 million. However, there are no longer
investment limitations on purchasers, and all securities issued under Regulation A+ are non-restricted and
transferable. Tier 1 offerings must still comply with blue sky laws, but financial disclosures are less rigorous.

© 2015 Mercer Capital // Data provided by SNL Financial 2
Mercer Capital’s Bank Watch April 2015
In comparison, Tier 2 offerings are limited to an aggregate offering of $50 million over a
12-month period, and are offerings are subject to periodic reporting requirements that are
effectively scaled-down versions of the annual, quarterly, and ongoing reporting requirements
that Exchange Act reporting companies are subject to. However, Regulation A+ exempts all Tier
2 offerings from blue sky requirements, which are instead preempted by federal securities law.
In addition to removing barriers and increasing capital limits, Regulation A+ has also broadened
the base of investors. Originally, only accredited investors who made over $200,000 a year or
had a net worth of $1 million could buy securities that were not subject to SEC registration under
Regulation D.3 According to the SEC, only 7% of American individual investors could invest as
an accredited investor as presently defined.4 Under Regulation A+, there is no cap to the total
investment from each unqualified investor under Tier 1 and a cap of 10% of annual income or
net worth under Tier II.5 A definitive ruling on crowdfunding is still pending under Title III of the
JOBS Act.
The preemption laws and expansion of the investor base under Regulation A+ has received
considerable push-back from state regulators and the North American Securities Administrators
Association. According to the Secretary of the Commonwealth of Massachusetts, “[preemption]
is a step that puts small retail investors unacceptably at risk.”6 Under the original Regulation
A, companies were required to file the offering and pay fees in each state in which they were
selling. Although the additional level of scrutiny was considered a safeguard by many states,
the cost and the burden of filing under the blue sky laws were often too much for the limited
capital gains.7
The updated Regulation A+ provides a greater annual dollar limit without the “costly
entanglement in the web of state blue sky regulation” for larger sums of capital.8 Companies
are still required to provide audited financial statements and ongoing periodic reporting that
will provide the transparency necessary to maintain investor confidence, while investors can
diversify their portfolios and provide liquidity without an IPO offering. Regulation A+ is seen as
especially beneficial for community banks, as with greater amounts of capital at their disposal,
smaller banks can increase lending limits and make more or larger loans. In effect, Regulation
A+ acts as an intermediary step in the IPO process and a means obtain growth capital for small
companies and community banks alike.9
The issuance of debt and especially equity raises a number of questions, including those
related to valuation and fairness from a financial point of view. At Mercer Capital we have over
three decades of experience in assisting managements and boards of directors in evaluating
such questions. Please call if your firm is considering a raise, whether under Regulation A+ or
otherwise, that will require financial advisory services.
Madeleine L. Harrigan
1 Largason, Paula Grace. “SEC issues proposals to increase smaller companies’ access to capital.” SNL. Online. Accessed April 15, 2015.
2 http://www.cbaofga.com/uploads/4/1/3/7/41371065/sec_opens_capital_spigot_for_small_banks,_online_lenders_american_banker_article.pdf
3 http://www.sec.gov/answers/accred.htm4 http://www.cbaofga.com/uploads/4/1/3/7/41371065/sec_opens_capital_spigot_for_small_banks,_online_lenders_
american_banker_article.pdf5 http://sddco.com/updates/the-sec-gives-an-a-plus-but-are-proposed-reg-a-edits-enough/6 The Commonwealth of Massachusetts. Secretary of the Commonwealth. Online. Available: http://www.sec.gov/comments/
s7-11-13/s71113-1.pdf. Accessed April 16, 2015.7 “Regulation A+ Offerings – A New Era at the SEC.” Online. Available: http://corpgov.law.harvard.edu/2014/01/15/regulation-
a-offerings-a-new-era-at-the-sec/. Accessed April 16, 2015.8 http://corpgov.law.harvard.edu/2014/01/15/regulation-a-offerings-a-new-era-at-the-sec/9 http://www.cbaofga.com/uploads/4/1/3/7/41371065/sec_opens_capital_spigot_for_small_banks,_online_lenders_
american_banker_article.pdf
What We’re Reading
This thought-provoking article from Radek Jezbera of PWC examines the following question: Can
banks be more like FinTech companies?
http://mer.cr/1yRgQFT
Al Dominick draws parallels from non-bank deals in an article entitled “Why Big Banks Aren’t
Merging.”
http://mer.cr/1Hmz8BY
SNL Financial had an interesting article entitled “Bank Investor Sees M&A as Path Away from
Lending ‘Slippery Slope’.” (subscription required)
http://mer.cr/1JdqmXp

© 2015 Mercer Capital // Data provided by SNL Financial 3
Mercer Capital’s Bank Watch April 2015
Observations from the Initial Q1’15 Bank EarningsJeff K. Davis, CFA, Managing Director of Mercer Capital’s Financial Institutions Group, is a
regular editorial contributor to SNL Financial. This contribution was originally published April
22, 2015 at SNL Financial. It is reprinted here with permission.
If U.S. Bancorp CEO Richard Davis’ comments on April 15 about the corrosive impact of low loan yields on bank profitability did not get the attention of the Street, it should have. Davis made an analogy to a fitness challenge that the zero rate world is increasingly stressful the longer it lasts. I thought Comerica Inc.’s results summed up what has been occurring the past few years. The company had $48 billion of loans based upon average balances in the first quarter, up about $3 billion from the year ago quarter, but net interest income only rose $3 million to $413 million.
Until this quarter, I thought the Street had not been paying much attention to what was happening to loan yields the past couple of years. Maybe because declining credit costs and a shift in earning assets to more loans and fewer bonds masked the implications of declining loan yields. And since the second half of 2014 the consensus coalesced around the view that the Fed would begin to raise short rates in June or September of 2015. Now Fed rate hikes, which may be a one-and-done move, look iffy for 2015.
Without assuming the Fed is going to change the math “next year,” it is hard to ignore what the numbers are saying: earnings are at best are going to move sideways to slightly higher for most banks with high single-digit ROEs other than for the leanest of cost structures such as U.S. Bancorp and Birmingham, Ala.-based ServisFirst Bancshares Inc. ROEs will decline further whenever credit costs rise, though nothing in bank results to date indicate an upturn is anywhere near. Sustained loan growth at some point is going to require reserve building to resume, however.
At some point loan yields will bottom, but the bottom may be much lower than envisioned. First Horizon National Corp. CEO D. Bryan Jordan commented on April 17 that the market had seen an acceleration of weakening loan pricing and structure. Aircraft lessor FLY Leasing Ltd. (B1 Moody’s; BB S&P) announced on April 20 that it had repriced its 2012 term loan for the third time since it was originated to LIBOR +2.75% with a LIBOR floor of 0.75% from LIBOR+3.50% and 1.00%. And a loan made by U.S. Bank NA to Pinnacle Bank earlier this year to partially finance
an investment in Bankers Healthcare Group points to where the bottom may be for “A” credits like Pinnacle: the greater of zero or 30-day LIBOR plus 165 bps to 195 bps. At least U.S. Bank, and I assume most banks, is thinking about the potential for the Fed to target negative rates by writing loan agreements to set a 0% base rate floor.
In most mature industries, volume growth to offset margin pressure may not be ideal, but is manageable. Banks can do so too, but loan growth eats capital and implies risk adjusted returns may not be so good. Or in the vernacular of an operating company: capital expenditures have to increase to maintain EBITDA. My take on bank ROEs is that over extended periods of time ROE tends to be roughly 500 bps to 700 bps over the 10-year U.S. Treasury. It does not seem appealing for equity investors, but that implies current ROEs of 7-9% that banks such as Comerica Inc. and SunTrust Banks Inc. posted in the first quarter are about where they should be. But will they hold?
Investors will have to decide what entry price makes sense, which along with the decision of when to sell, is the only thing that an investor controls. For bankers there are only two logical conclusions: hack costs and/or merge. U.S. Bancorp’s Davis, who runs one of the nation’s best banks, commented that so far he had resisted special cost cutting and mass layoffs; however, I wonder how long even a high return bank like U.S. Bancorp can hold out if the Fed does not relent.
Jeff K. Davis, CFA [email protected]
What We’re Reading
Thomas Michaud, CEO of KBW, talks about expectations for bank stocks and what those
valuations mean for M&A in a video on American Banker’s website entitled “Valuation: The Have
and Have-Nots in M&A.”
http://mer.cr/1Gk4p89
Chris Mercer, CEO of Mercer Capital, has an interesting piece where he takes a look at ways to
unlock wealth in private companies and improve rates of returns for their owners in a piece entitled
“Private Company Wealth Destruction or Current Wealth Realization?”
http://mer.cr/1MbZAM8

© 2015 Mercer Capital // Data provided by SNL Financial 4
Mercer Capital’s Bank Watch April 2015
The Financial Institutions Group of Mercer Capital works with hundreds of depository institutions and other financial institutions annually providing a broad range of specialized resources for the financial services industry.
An Overview of the Leveraged Lending Market and Bank Participation in the Market
There has been a flurry of media reports this year that regulators—especially the OCC—are intensifying scrutiny of leveraged lending. In this webinar we took a look at one of the fastest growing markets that has emerged post crisis.
View webinar on SNL Financial’s site at http://mer.cr/VRc9JV
Understanding Deal Considerations
Key issues that we see when banks combine as it relates to valuing and evaluating a combination are reviewed. This is particularly critical when the consideration consists of shares issued by a buyer (or senior merger partner) whose shares are either privately held or are thinly traded.
View replay at http://mer.cr/bnkweb2
Basel III Capital Rules Finally Final: What Does It Mean for Community Banks?
Finalized at last, the regulations provide direction for bank capital management decisions. This webinar, co-sponsored by Mercer Capital and Jones Day, reviews the final rules and assesses their impact on community banks.
View replay at http://mer.cr/capital-rules-webinar
An Introduction toBusiness Development Companies In the hunt for yield, investors are increasingly setting their sights on business development companies (BDCs), which offer public equity investors access to portfolios of private equity investments. This webinar explored the features that have contributed to the growth in BDCs, underlying asset classes to which BDCs offer investors exposure, and highlighted the key performance metrics for evaluating BDCs. Our panel discussed relevant regulatory developments affecting BDCs, reviewed the portfolio valuation procedures and assumptions that influence quarterly profits, and explored the relative performance of key market benchmarks.
View webinar on SNL Financial’s site at http://mer.cr/ZnauO7 Complimentary Download of Slides at http://mer.cr/1tuwzaI
Webinars Available for Replay
Newest Webinar
Sponsored by SNL Financial
Presenters from Mercer Capital and
Sutherland Asbill & Brennan
Mercer Capital’sResources for Depository Institutions
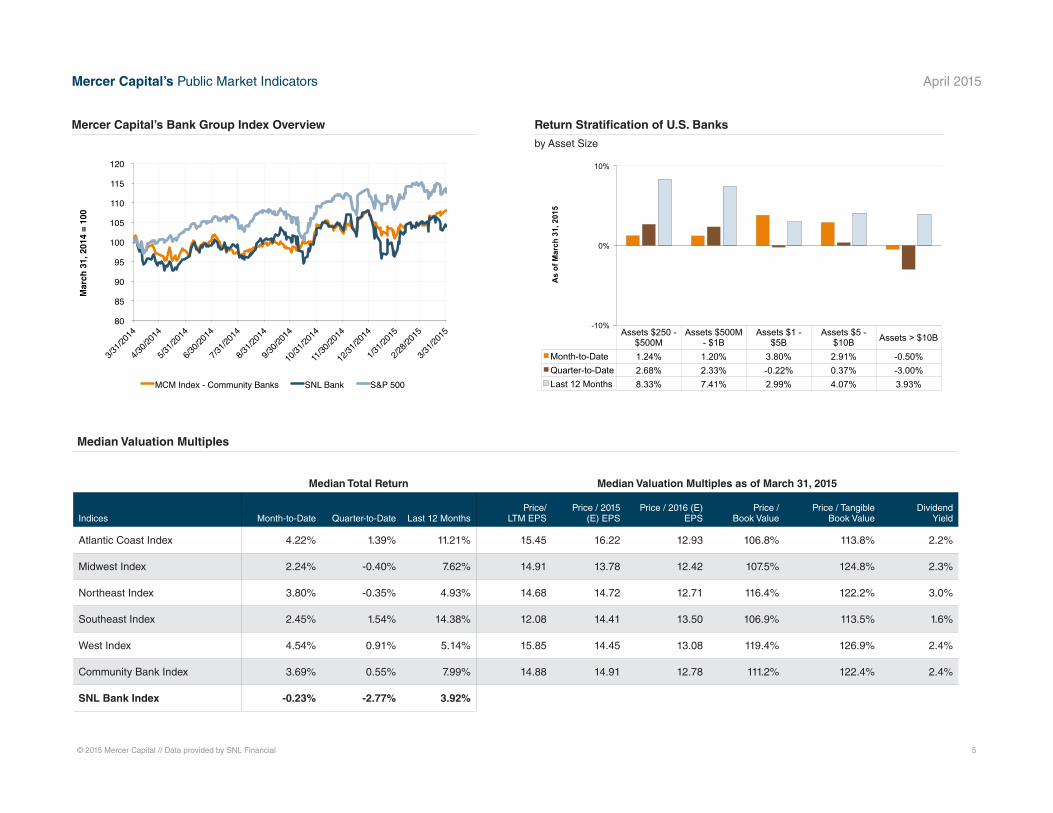
Public Market Indicators
© 2015 Mercer Capital // Data provided by SNL Financial 5
Median Valuation Multiples
Mercer Capital’s Bank Group Index Overview Return Stratification of U.S. Banks
by Asset Size
Median Total Return Median Valuation Multiples as of March 31, 2015
Indices Month-to-Date Quarter-to-Date Last 12 MonthsPrice/
LTM EPSPrice / 2015
(E) EPSPrice / 2016 (E)
EPSPrice /
Book ValuePrice / Tangible
Book ValueDividend
Yield
Atlantic Coast Index 4.22% 1.39% 11.21% 15.45 16.22 12.93 106.8% 113.8% 2.2%
Midwest Index 2.24% -0.40% 7.62% 14.91 13.78 12.42 107.5% 124.8% 2.3%
Northeast Index 3.80% -0.35% 4.93% 14.68 14.72 12.71 116.4% 122.2% 3.0%
Southeast Index 2.45% 1.54% 14.38% 12.08 14.41 13.50 106.9% 113.5% 1.6%
West Index 4.54% 0.91% 5.14% 15.85 14.45 13.08 119.4% 126.9% 2.4%
Community Bank Index 3.69% 0.55% 7.99% 14.88 14.91 12.78 111.2% 122.4% 2.4%
SNL Bank Index -0.23% -2.77% 3.92%
Assets $250 - $500M
Assets $500M - $1B
Assets $1 - $5B
Assets $5 - $10B Assets > $10B
Month-to-Date 1.24% 1.20% 3.80% 2.91% -0.50% Quarter-to-Date 2.68% 2.33% -0.22% 0.37% -3.00% Last 12 Months 8.33% 7.41% 2.99% 4.07% 3.93%
-10%
0%
10%
As
of M
arch
31,
201
5
80 !
85 !
90 !
95 !
100 !
105 !
110 !
115 !
120 !
Mar
ch 3
1, 2
014
= 10
0!
MCM Index - Community Banks! SNL Bank! S&P 500!
Mercer Capital’s Public Market Indicators April 2015

M&A Market Indicators
© 2015 Mercer Capital // Data provided by SNL Financial 6
2004 2005 2006 2007 2008 2009 2010 2011 2012 2013 2014 LTM U.S. 18.3% 19.9% 19.9% 18.7% 12.0% 6.9% 6.3% 5.4% 4.3% 5.5% 7.5% 7.5%
0%
5%
10%
15%
20%
25%
Cor
e D
epos
it P
rem
ium
s
2004 2005 2006 2007 2008 2009 2010 2011 2012 2013 2014 LTM U.S. 246% 243% 243% 228% 196% 145% 141% 132% 130% 134% 155% 152%
0%
50%
100%
150%
200%
250%
300%
350%
Pric
e / T
angi
ble
Boo
k Va
lue
2004 2005 2006 2007 2008 2009 2010 2011 2012 2013 2014 LTM U.S. 22.3 22.0 22.0 22.1 19.9 19.3 21.7 21.9 17.0 16.5 17.5 18.8
0
5
10
15
20
25
30
Pric
e / L
ast 1
2 M
onth
s E
arni
ngs
Regions
Price / LTM
Earnings
Price / Tang.
BV
Price / Core Dep Premium
No. of
Deals
Median Deal
Value
Target’s Median Assets
Target’s Median
LTM ROAE (%)
Atlantic Coast 19.93 1.56 6.7% 13 51.60 451,519 9.19%
Midwest 18.38 1.57 7.3% 72 35.89 107,801 9.04%
Northeast 21.90 1.71 8.9% 8 101.87 431,132 7.10%
Southeast 16.93 1.36 5.6% 29 50.58 198,314 8.23%
West 18.88 1.48 7.8% 17 65.51 359,964 9.16%
Nat’l Community Banks 18.75 1.52 7.5% 139 50.00 200,005 8.93%
Source: Per SNL Financial
Median Valuation Multiples for M&A Deals
Target Banks’ Assets <$5B and LTM ROE >5%, 12 months ended March 2015
Median Core Deposit Multiples
Target Banks’ Assets <$5B and LTM ROE >5%
Median Price/Tangible Book Value Multiples
Target Banks’ Assets <$5B and LTM ROE >5%
Median Price/Earnings Multiples
Target Banks’ Assets <$5B and LTM ROE >5%
Mercer Capital’s M&A Market Indicators April 2015

Updated weekly, Mercer Capital’s Regional Public Bank Peer Reports offer a closer look at the market pricing and performance of publicly traded banks in the states of five U.S. regions. Click on the map to view the reports from the representative region.
© 2015 Mercer Capital // Data provided by SNL Financial 7
Atlantic Coast Midwest Northeast
Southeast West
Mercer Capital’s Regional Public Bank Peer Reports
Mercer Capital’s Bank Watch April 2015

About Mercer Capital
Mercer Capital assists banks, thrifts, and credit unions with significant corporate valuation requirements, transactional advisory services, and other strategic decisions.
Mercer Capital pairs analytical rigor with industry knowledge to deliver unique insight into issues facing banks. These insights
underpin the valuation analyses that are at the heart of Mercer Capital’s services to depository institutions.
Mercer Capital is a thought-leader among valuation firms in the banking industry. In addition to scores of articles and books, The
ESOP Handbook for Banks (2011), Acquiring a Failed Bank (2010), The Bank Director’s Valuation Handbook (2009), and Valuing
Financial Institutions (1992), Mercer Capital professionals speak at industry and educational conferences.
The Financial Institutions Group of Mercer Capital publishes Bank Watch, a monthly e-mail newsletter covering five U.S. regions.
In addition, Jeff Davis, Managing Director, is a regular contributor to SNL Financial.
For more information about Mercer Capital, visit www.mercercapital.com.
Mercer CapitalFinancial Institutions Services
Jeff K. Davis, [email protected]
Andrew K. Gibbs, CFA, CPA/ABV [email protected]
Jay D. Wilson, Jr., CFA, ASA, CBA [email protected]
Mercer Capital5100 Poplar Avenue, Suite 2600Memphis, Tennessee 38137901.685.2120 (P)
www.mercercapital.com
Contact Us
Copyright © 2015 Mercer Capital Management, Inc. All rights reserved. It is illegal under Federal law to reproduce this publication or any portion of its contents without the publisher’s permission. Media quotations with source attribution are encouraged.
Reporters requesting additional information or editorial comment should contact Barbara Walters Price at 901.685.2120. Mercer Capital’s Industry Focus is published quarterly and does not constitute legal or financial consulting advice. It is offered as an
information service to our clients and friends. Those interested in specific guidance for legal or accounting matters should seek competent professional advice. Inquiries to discuss specific valuation matters are welcomed. To add your name to our mailing list
to receive this complimentary publication, visit our web site at www.mercercapital.com.